Article

Exploring High-Pressure Transformations in Low-Z (H2, Ne) Hydrates at Low Temperatures

by
Paulo H. B. Brant Carvalho
1,*,
Amber Mace
2,
Inna Martha Nangoi
3,
Alexandre A. Leitão
3,
Chris A. Tulk
4,
Jamie J. Molaison
4,
Ove Andersson
5,
Alexander P. Lyubartsev
1 and
Ulrich Häussermann
1
1
Department of Materials and Environmental Chemistry, Stockholm University, SE-10691 Stockholm, Sweden
2
Department of Chemistry-Ångström Laboratory, Uppsala University, SE-75236 Uppsala, Sweden
3
Department of Chemistry, Federal University of Juiz de Fora, Juiz de Fora 36036-900, Brazil
4
Neutron Scattering Division, Oak Ridge National Laboratory, Oak Ridge, TN 37831, USA
5
Department of Physics, Umeå University, SE-90187 Umeå, Sweden
*
Author to whom correspondence should be addressed.
Crystals 2022, 12(1), 9; https://doi.org/10.3390/cryst12010009
Submission received: 15 November 2021 / Revised: 12 December 2021 / Accepted: 13 December 2021 / Published: 21 December 2021
(This article belongs to the Special Issue The Structures and Transitions of Ice and Water)

Abstract

:
The high pressure structural behavior of H2 and Ne clathrate hydrates with approximate composition H2/Ne·~4H2O and featuring cubic structure II (CS-II) was investigated by neutron powder diffraction using the deuterated analogues at ~95 K. CS-II hydrogen hydrate transforms gradually to isocompositional C1 phase (filled ice II) at around 1.1 GPa but may be metastably retained up to 2.2 GPa. Above 3 GPa a gradual decomposition into C2 phase (H2·H2O, filled ice Ic) and ice VIII’ takes place. Upon heating to 200 K the CS-II to C1 transition completes instantly whereas C1 decomposition appears sluggish also at 200 K. C1 was observed metastably up to 8 GPa. At 95 K C1 and C2 hydrogen hydrate can be retained below 1 GPa and yield ice II and ice Ic, respectively, upon complete release of pressure. In contrast, CS-II neon hydrate undergoes pressure-induced amorphization at 1.9 GPa, thus following the general trend for noble gas clathrate hydrates. Upon heating to 200 K amorphous Ne hydrate crystallizes as a mixture of previously unreported C2 hydrate and ice VIII’.

1. Introduction

Clathrate hydrates are crystalline inclusion compounds in which a guest species (i.e., small molecules or monoatomic noble gases) occupy the polyhedral cages formed by a hydrogen-bonded water network [1]. These materials form when guest-water solutions freeze, or when gaseous guest interacts with hexagonal ice, Ih, at elevated pressure (above 50 bar) [2]. Clathrate hydrates occur abundantly in nature, storing natural gas, and are of interest for e.g., CO2 sequestration and H2 storage [3]. Clathrate hydrates with the low Z guests Ne and H2 are distinguished because of the rather extreme pressure conditions (>2 kbar at 280 K) that have to be applied for their synthesis [4]. Both Ne and H2 clathrate hydrate have been reported to form the so-called clathrate structure II (CS-II) which possesses hexakaidecahedral 51264 cages (consisting of 5- and 6-membered rings, in the following abbreviated as “L”-cages) and dodecahedral 512 cages (exclusively built from 5-membered rings, in the following abbreviated as “S”-cages). The cubic CS-II unit cell contains 136 water molecules and 16 S and 8 L cages. At pressurized synthesis conditions the large L cages can be occupied by up to four H2 molecules (whereas the smaller S cages are occupied by one), yielding an extremely high H-storage capacity (H2·3H2O) [5]. At ambient pressure conditions the L occupancy is reduced to two [6]. The composition for Ne clathrate hydrate appears to be less established (or contradictorily reported) [7,8]. Furthermore, unique for low Z clathrate hydrate is the high mobility of the guest species, based on defect-free diffusion through 6-membered rings [9,10,11]. This is manifested by the discovery of empty CS-II (ice XVI) from pumping Ne and H2 clathrate hydrate between 110 and 145 K [7].
Interestingly a He clathrate hydrate does not form from ice Ih—gas interaction (but may be obtained by filling ice XVI at around 100 K [12]). Instead, at comparable conditions leading to H2 and Ne clathrate hydrate a different, denser, hydrate is obtained which is based on rhombohedral ice II (filled ice II hydrate, typically abbreviated as C1) and which possesses a guest:water ratio 1:~6 [13,14]. The C1 hydrate has been found also for the Ne-H2O and H2-H2O systems at pressures above 5 kbar (0.5 GPa) and temperatures 250–280 K [4,15,16]. The high pressure behavior of the H2-H2O system has been recently well investigated. The highest pressure phase known is based on cubic ice, Ic (filled cubic ice, typically abbreviated as C2) with a guest:water composition 1:1 and found to be stable above 3 GPa up to at least 20 GPa [17]. The C2 phase has not yet been reported for the Ne-H2O system. In addition to the CS-II, C1, and C2 phases, hydrogen hydrate also exists as C0 phase (in the pressure range 0.2–0.5 GPa) with a composition 1H2:2H2O. Note that these phase relations between hydrates of variable guest:water compositions have been established for a rather narrow temperature range, ~220–270 K, and in the presence of a reservoir of H2 and Ne (either using diamond anvil cell or gas pressure vessel equipment).
In this paper we want to address specifically the high pressure behavior of the low Z CS-II hydrates, i.e., employing ex-situ synthesized starting materials with a specific composition and no reservoir of H2 and Ne, at low temperatures (below 200 K). It has been shown that CS-II hydrates with high Z guests (e.g., Ar, THF) undergo transitions to more dense, exotic, clathrate structures and/or breakdown reactions into filled forms of ice (accepting larger concentrations of guest species) and ice when compressed to 2–3 GPa at 260–280 K [3]. At lower temperatures (<130 K) CS-II hydrates would instead exhibit a sharp, first-order-like transition to an amorphous state at 1.2–2 GPa [18,19], similar to the behavior of pure water ice Ih which undergoes pressure-induced amorphization to “high density amorphous” (HDA) ice when compressed to around 1 GPa at temperatures below 130 K [20]. Since the low Z CS-II hydrates appear distinguished, it was deemed important to establish their high pressure behavior at low temperatures.

2. Experimental Details and Methods of Analysis

Fully deuterated CS-II hydrogen hydrate (HH) and neon hydrate (NeH) samples (H2O and H2 99.9 atom % deuterated, Sigma Aldrich, Saint Louis, MO, USA; Ne ≥ 99.99% purity, Sigma Aldrich, Saint Louis, MO, USA) were synthesized following the procedure by Lokshin et al. [5]. A high-pressure rated vessel compatible for hydrogen gas was filled with finely ground ice and loaded with pressurized hydrogen/neon at 200 MPa using a gas-pressure intensifier. Both ice and gas transfers were done in a eutectic ethanol-water bath at freezing temperature (~278 K). The pressurized vessels were then kept at 253 K for one week in a freezer. The fully converted CS-II samples were recovered at LN2 temperature on the day of the experiments. The complete conversion of ice Ih to the CS-II clathrate was confirmed by X-ray powder diffraction on a Panalytical X’Pert Pro (Almelo, Overijssel, The Netherlands) diffractometer using the Anton Paar TTK 450 Low Temperature Chamber, and all samples were verified to be initially ice-free. A total of three CS-II HH sample batches were prepared (A, B, and C) and we report on four HH experiments (a1, a2, a3, b) based on samples A and B (C was only used for structure/composition characterization of CS-II HH). One CS-II NeH sample was prepared and one Ne experiment (c) was run. Details of the experimental pathways and compositions throughout each experiment can be found in the Supplementary Materials.
In situ high pressure neutron diffraction experiments were conducted on the SNAP high-pressure diffractometer at the Spallation Neutron Source in the Oak Ridge National Laboratory, Oak Ridge, TN, USA, using the Paris-Edinburgh (PE) VX5 press [21]. Samples were handled at LN2 temperature, loaded into a null-scattering Ti-Zr alloy encapsulated gasket and set into the pre-cooled anvils. The gaskets were slightly pressurized upon loading for sealing and stabilizing the samples, which warmed up to about 170 K during transferring the pressure cell to the cryostat where they were cooled to 90–95 K. Pressurization was done in steps of 0.1–0.2 GPa, followed by data collection during 15 min to up to several hours. (Note that data collection is quantified by proton charge accumulated, but usually referred to by time of irradiation for simplicity.) Compression rates were averaged over time taking into account loading and collection periods. Pressure was estimated using a Birch–Murnaghan equation of state for lead [22], which was added to all samples. Data reduction was performed using the Mantid package (Workbench version 6.2) [23], and Rietveld refinements were conducted using GSAS-II version 5113 [24]. Refined parameters for the hydrate and ice phases consisted of phase fractions, lattices, positional and thermal parameters, atomic fractions (for guest atoms) and peak profile parameters. In addition, silicon powder, vanadium powder and an empty gasket were measured for calibration, intensity normalization and background correction, respectively.
Molecular dynamics (MD) simulations were performed at 95 K, with pressure increase in steps of 0.1 GPa. The simulation cells for CS-II HH and NeH corresponded to 2 × 2 × 2 unit cells and were created with GenIce [25]. We considered a guest:water ratio 1:4 which was obtained by occupying some of the L cages triply. Simulations were done at similar conditions to those proposed by Alavi et al. [26]. Two different software were used for calculations, GROMACS (version 2021.3) [27] and LAMMPS (release 29 September 2021) [28]. GROMACS was used for the CS-II HH system where pressure was controlled by the isotropic Parrinello-Rahman barostat [29] and temperature by the velocity-rescaling thermostat [30]. The Van der Waals and Coulomb interactions were set to a cutoff radius of 0.85 nm and the long-range part of the electrostatic interactions was treated by the Particle Mesh Ewald (PME) method [31]. Hydrogen molecules were modelled as a rigid diatomic molecule with bond constrained to 0.7414 Å and a massless center of mass where the LINCS algorithm was adopted to constrain molecular bonds [32]. The force-field parameters for H2 were set as those determined by Harada et al. [33]. CS-II NeH was simulated with LAMMPS. The Nose-Hoover barostat with the Melchionna modification was employed to control the temperature and pressure of the systems [34]. The UFF [35] force field was used to describe the interatomic interactions of Ne. The Van der Waals and Coulomb interactions were set to a cutoff radius of 1.25 nm and the long-range part of the electrostatic interactions was treated by the Particle-Particle Particle Mesh (PPPM) method [36]. In both systems the water molecules were described by the TIP4P/ice force field model [37] and the Lorentz-Berthelot mixing rules were applied [38]. At each pressure step the system was first incremented gradually over 2 ns, the system was then equilibrated for 5 ns followed by a further 1 ns simulation during which statistics for analyses were collected. The simulation time step was 1.0 fs and barostat relaxation time was set to 2000 time steps.

3. Results

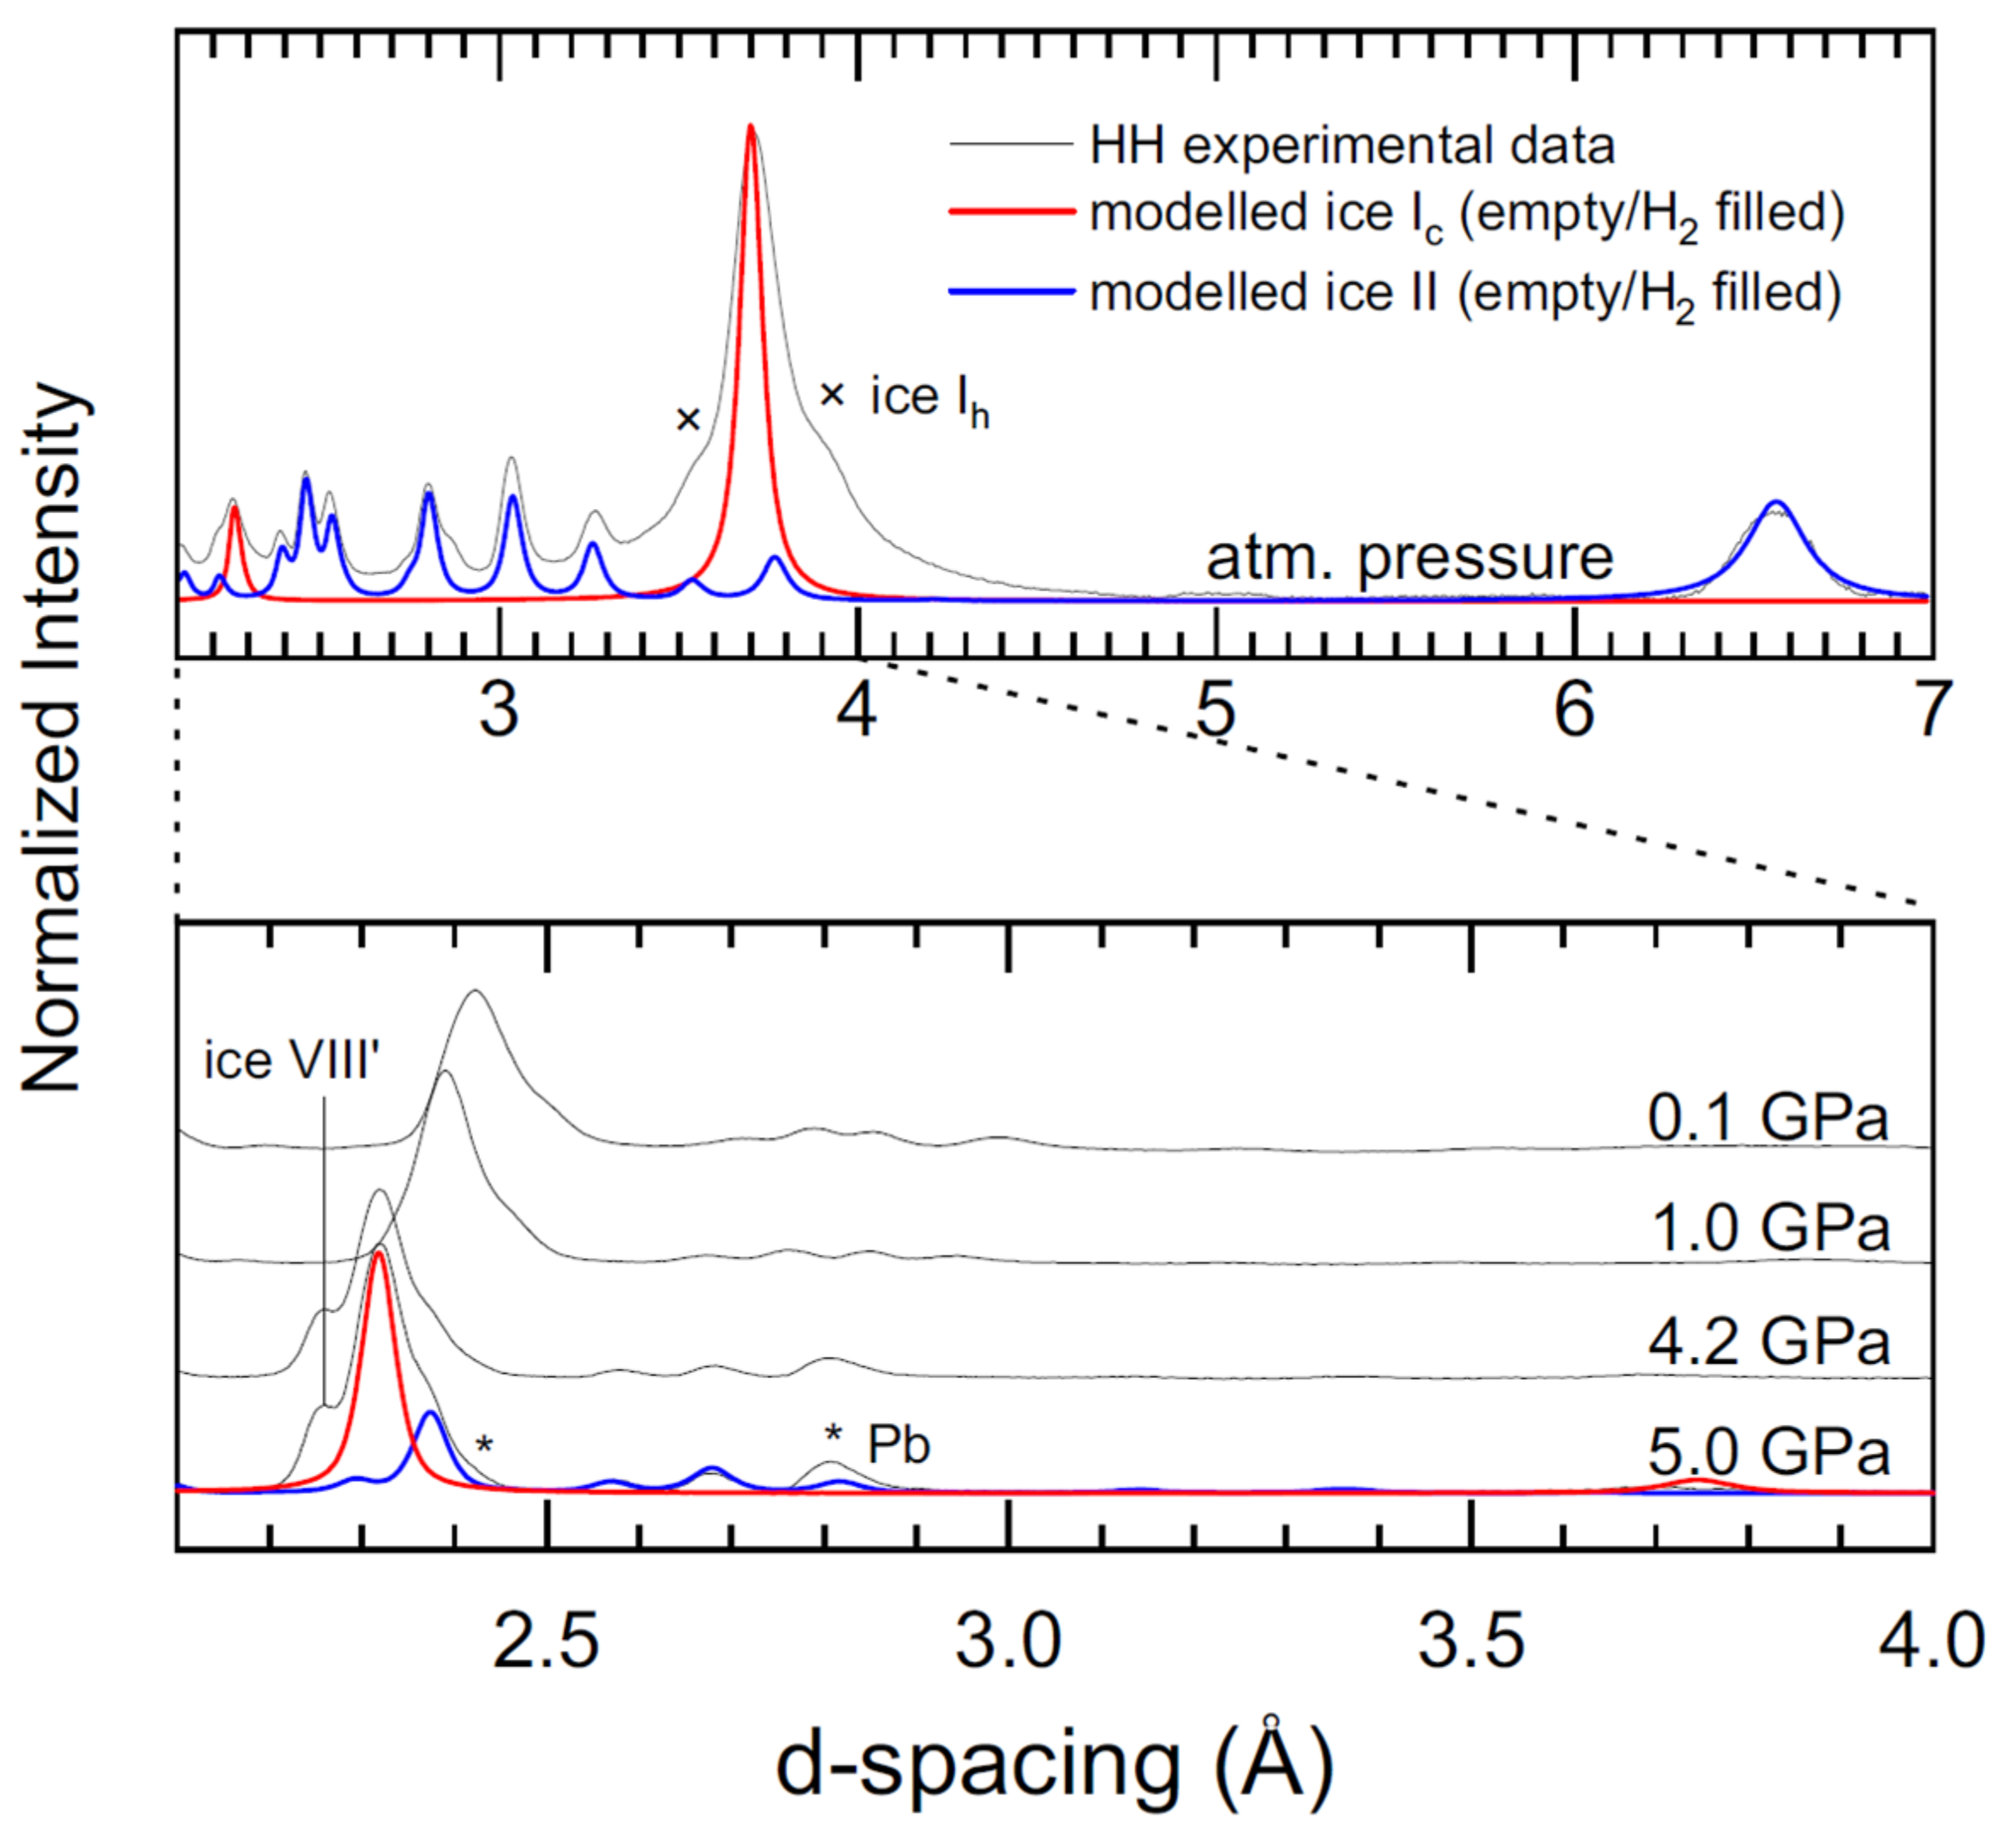
3.1. CS-II HH and NeH Starting Materials

The various pathways and the phase diagrams of hydrogen-water system [39] and pure water [40] are shown in Figure 1. In the Supplementary Materials there are more details, together with a thorough description of phase changes on each experiment. Diffraction data of the crystalline CS-II hydrates of hydrogen (HH) and neon (NeH) (space group F d 3 ¯ m ) at the initial stage of the experiments (near ambient pressure (<0.1 GPa) and 90–95 K) are shown in Figure 2. For the refinement of CS-II HH, the structure model for the ambient pressure recovered material at 100 K according to Ranieri et al. was applied [41]. This model describes the orientationally disordered H2 molecule in S cages with a 96g Wyckoff position (0, 0, ~0.022), accounting for three orientations of a H2 molecule around the S cage center at 16c (0, 0, 0). The positionally and orientationally disordered H2 molecules in L cages are also modeled with a 96g position (~0.43, ~0.43, ~0.4) which yields a distribution of 12 H atoms around the center at 8b (3/8, 3/8, 3/8) at a distance ~1.45 Å from the center. In our refinements the parameters of the 96g positions were restrained to the values of Ranieri et al. [41] and only thermal parameters (Biso) and occupancies were refined. An occupancy of 1/6 would correspond to one and two H2 molecules in S and L, respectively.
Rietveld refinement of the CS-II HH data showed that all samples were pure CS-II with an (inverse-variance weighted over 3 sample batches A, B, C) average unit cell lattice parameter a = 17.095(3) Å. Refinement of the S and L cage occupancies yielded 0.99(4) and 2.1(4) H2 molecules, respectively (1H2:~4.2H2O), which is in good agreement with the composition reported by Ranieri et al. [41]. Also the NeH sample was pure CS-II phase. For its refinement Ne atoms were positioned at the center of the L and S cages (i.e., the Wyckoff sites 8b and 16c), and Biso values and occupancies were refined. The refinement of CS-II NeH yielded a lattice parameter a = 17.1161(8) Å (at 0.09(5) GPa), and 0.98(9) and 2.3(3) Ne atoms in S cages and L cages, respectively (1Ne:~4H2O), which is a similar guest:water composition as for CS-II HH. We note that the value of the lattice parameter is close to that reported by Falenty et al. (17.1028 Å at ambient pressure and 5 K) [7]. However, the refined composition deviates. Falenty et al. reported contradictory values for the L cage occupancy (either 4.7 or 0.85 Ne atoms) for CS-II NeH at 5 K, which appears either too high or too low. The reason for the discrepancy is not clear.
Subsequently the CS-II samples were compressed at 90–95 K to pressures between 1 and 5 GPa and then heated to 200 K, followed by either further compression or decompression.

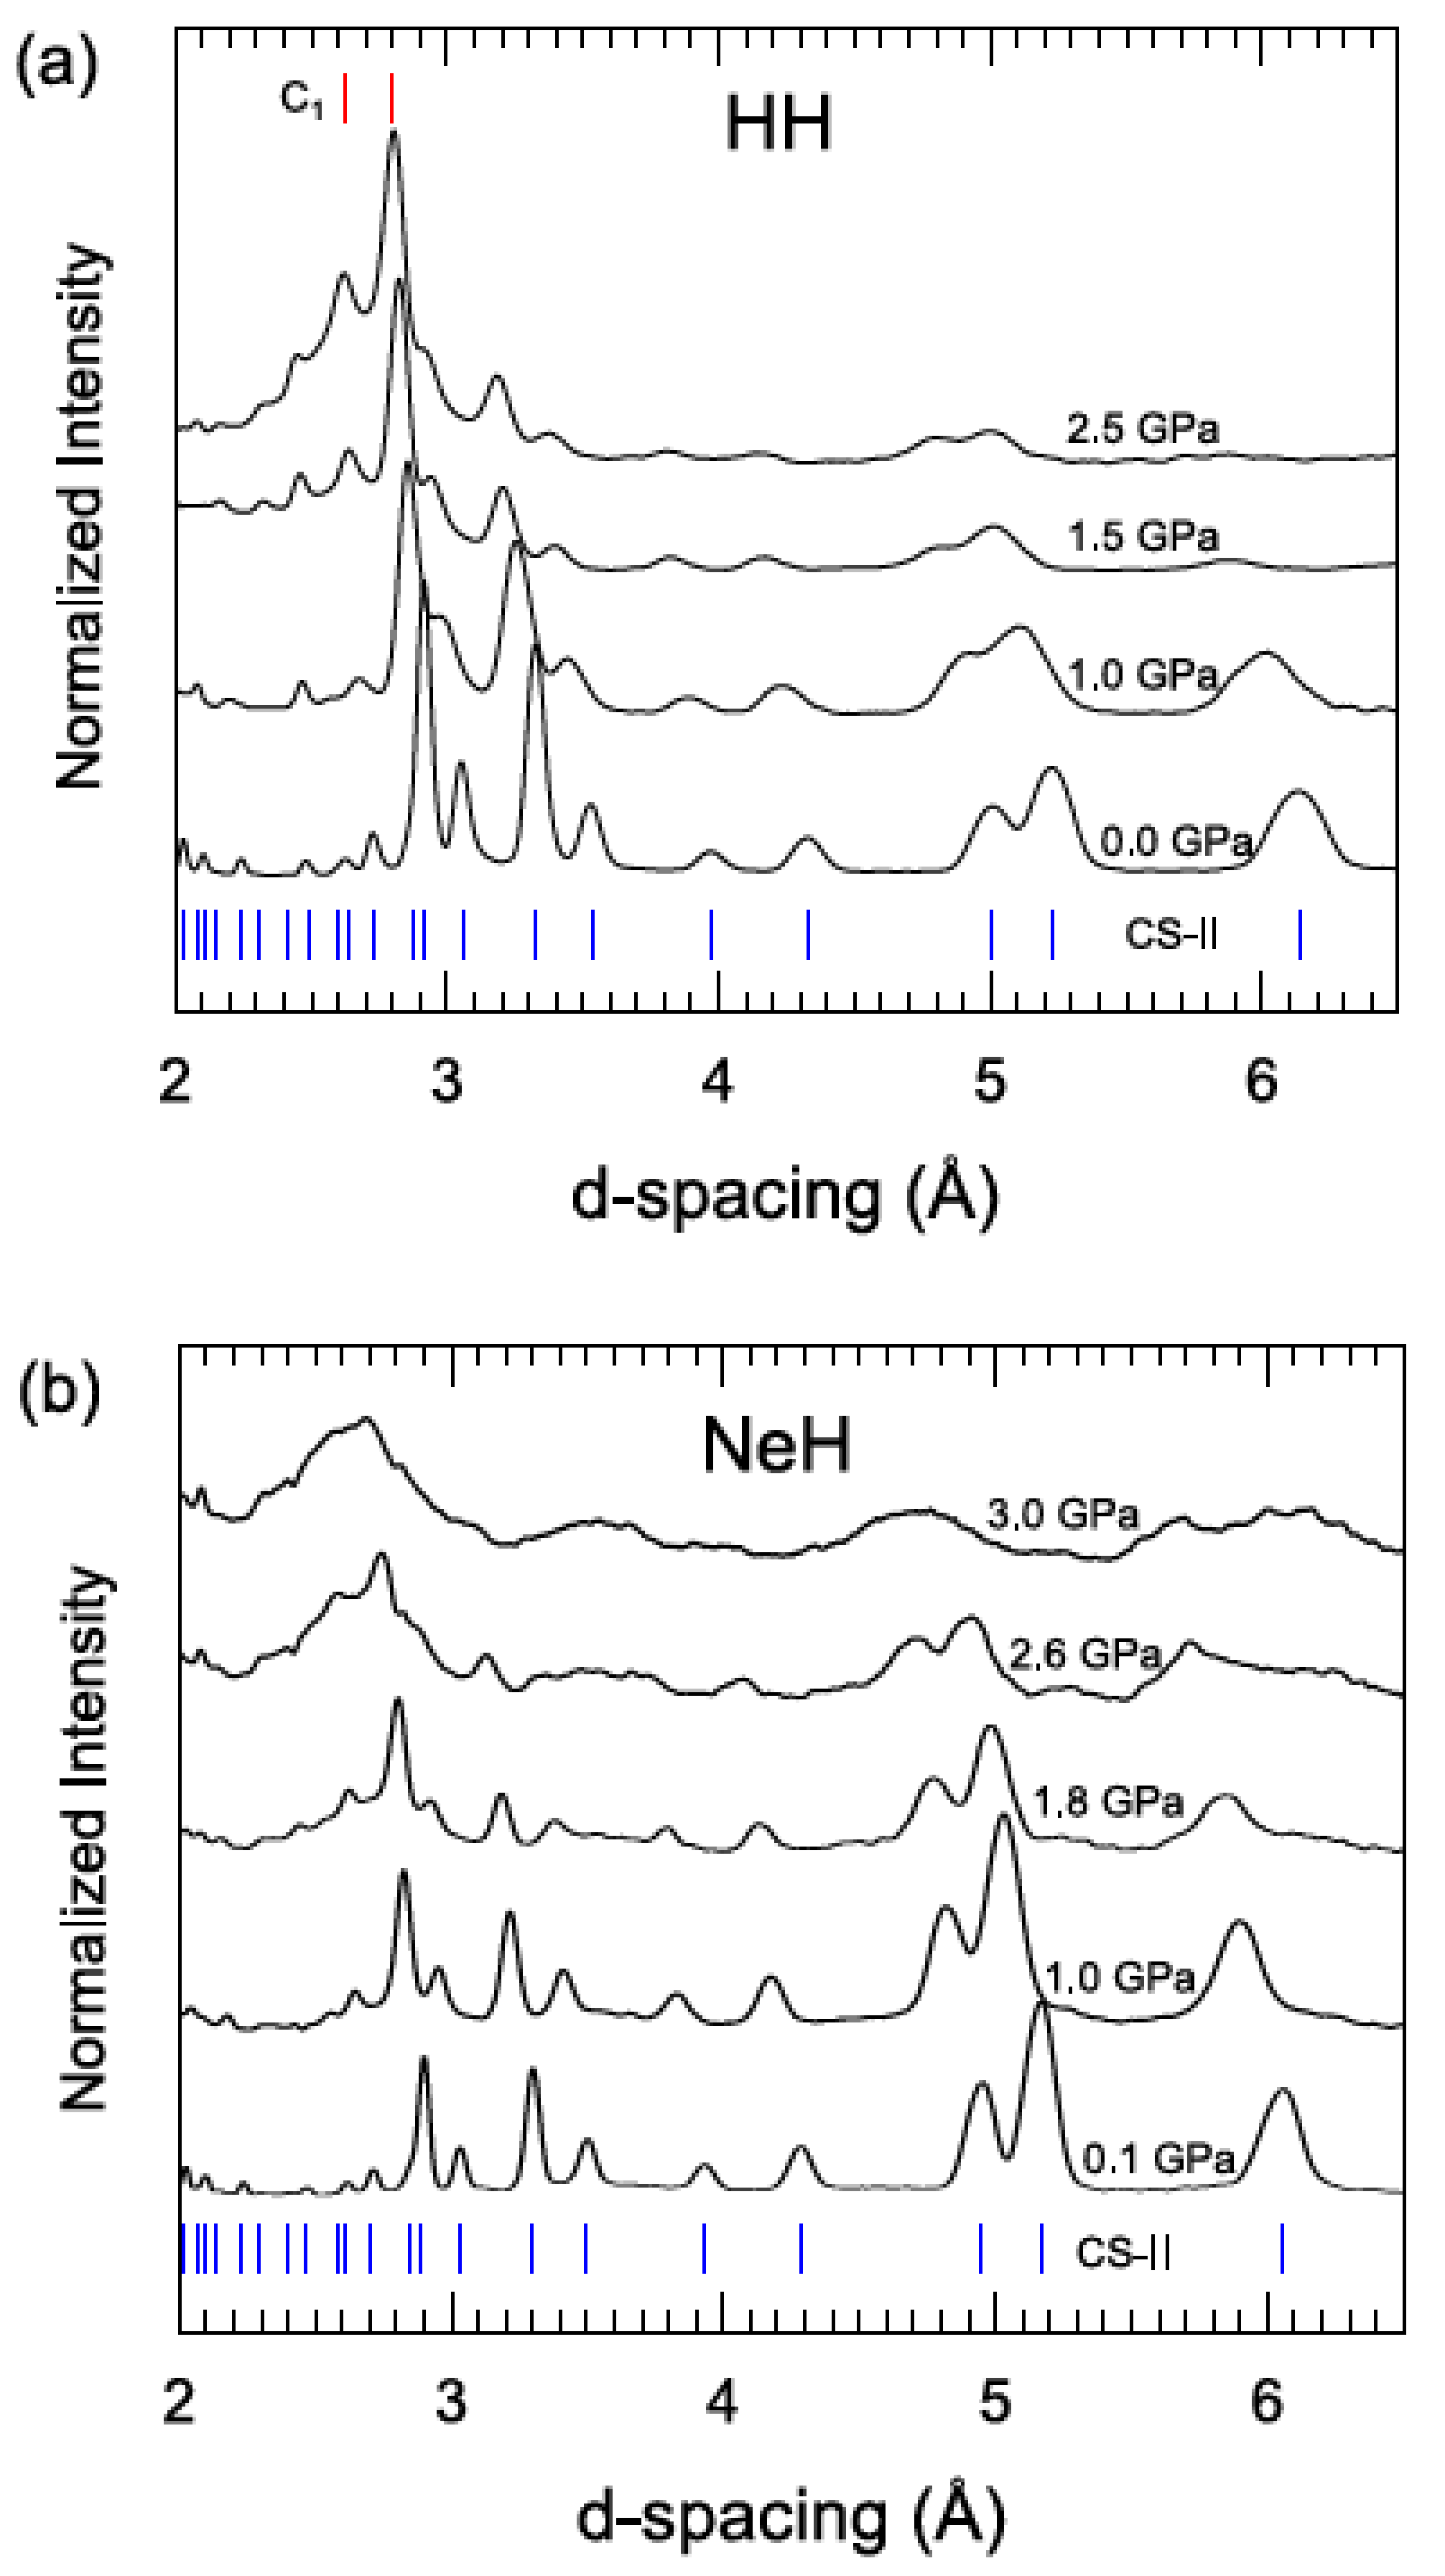
3.2. Compression of CS-II HH and NeH at ~95 K

CS-II HH was initially compressed at 95 K to 1.3(2) GPa (experiment a1) upon which a gradual transformation into C1 phase was observed at 1.1(2) GPa. The CS-II to C1 transition was identified from the growth of the two strongest C1 reflections ( 31 1 ¯ and 21 2 ¯ ) over the CS-II reflections (cf. Figure 3a). Upon recovery to ambient pressure (at 95 K), C1 transformed back to CS-II. No other phases (i.e., ices) were observed, suggesting that the composition 1H2:4.2H2O was kept constant throughout. A new sample was then loaded (experiment a2) and the compression was repeated. This time gradual transition into C1 phase was observed at 1.12(5) GPa. The compression rates in experiments a1 and a2 were about 90 bar/h and 50 bar/h. Loading CS-II HH from a different sample batch (experiment b), we repeated the compression at a slower rate (~12.5 bar/h). In this experiment the CS-II phase was retained to 2.2(1) GPa. Although highly strained, the diffraction patterns above 1.5 GPa show clear remnant features of the CS-II phase alongside growing reflections of the C1 phase (Figure 3a).
CS-II NeH was compressed at ~90 K (experiment c). Its pressure-induced amorphization (PIA) was indicated by the loss of Bragg peak intensity and the evolution of diffuse scattering at 1.86(3) GPa. Figure 3b shows the evolution of the diffraction patterns of CS-II NeH up to 3.0(1) GPa. The PIA behavior follows the established trend of noble gas clathrate hydrates which has been earlier investigated by MD simulations [19]. The collapse for CS-II NeH with doubly and singly occupied L and S cages, respectively, was predicted at ~1.65 GPa, which is close to the here reported experimental finding.
Figure 4 depicts the V-p relations of CS-II HH and NeH. An equation of state (EoS) fit was undertaken with the simple Murnaghan relation V0/V = [p(B’/B) + 1]1/B’, where V0, B, and B’ are the volume at zero pressure, the bulk modulus, and its first pressure derivative, respectively [42]. According to Manakov et al. [43] the compressibility of CS-II hydrates is rather similar, irrespective the kind of guest species and cage filling, thus essentially being determined by the H-bond structure. The universal bulk modulus for the pressure range up to 1.5 GPa was specified as (9 ± 2) GPa [43]. Our V(p) data appear somewhat scattered, which is mostly attributed to the rapidly degrading quality of the CS-II patterns above 0.3 GPa. The extracted bulk moduli for HH and NeH are 10.9(6) and 12(2) GPa, respectively (with B’ fixed at 4.0), which would follow the general trend. We also include the V-p relation from MD simulations (which for (heavier) noble gas clathrate hydrates follow well the experiment [19]). For CS-II HH and NeH deviations from experiment are certainly due to the limited data quality, but in addition it appears that MD underestimates the volume of CS-II HH (at least for the case with doubly and singly occupied L and S cages, respectively). We note that also the simulation results by Katsumasa et al. show a systematic volume underestimation [44]. As mentioned above, MD simulations of CS-II NeH show PIA at around 1.65 GPa. Also CS-II HH collapses according to MD (at ~0.8 GPa) indicating its instability at somewhat lower pressures than the experimentally observed crystal-crystal transition to C1 (which is not possible to simulate in MD).

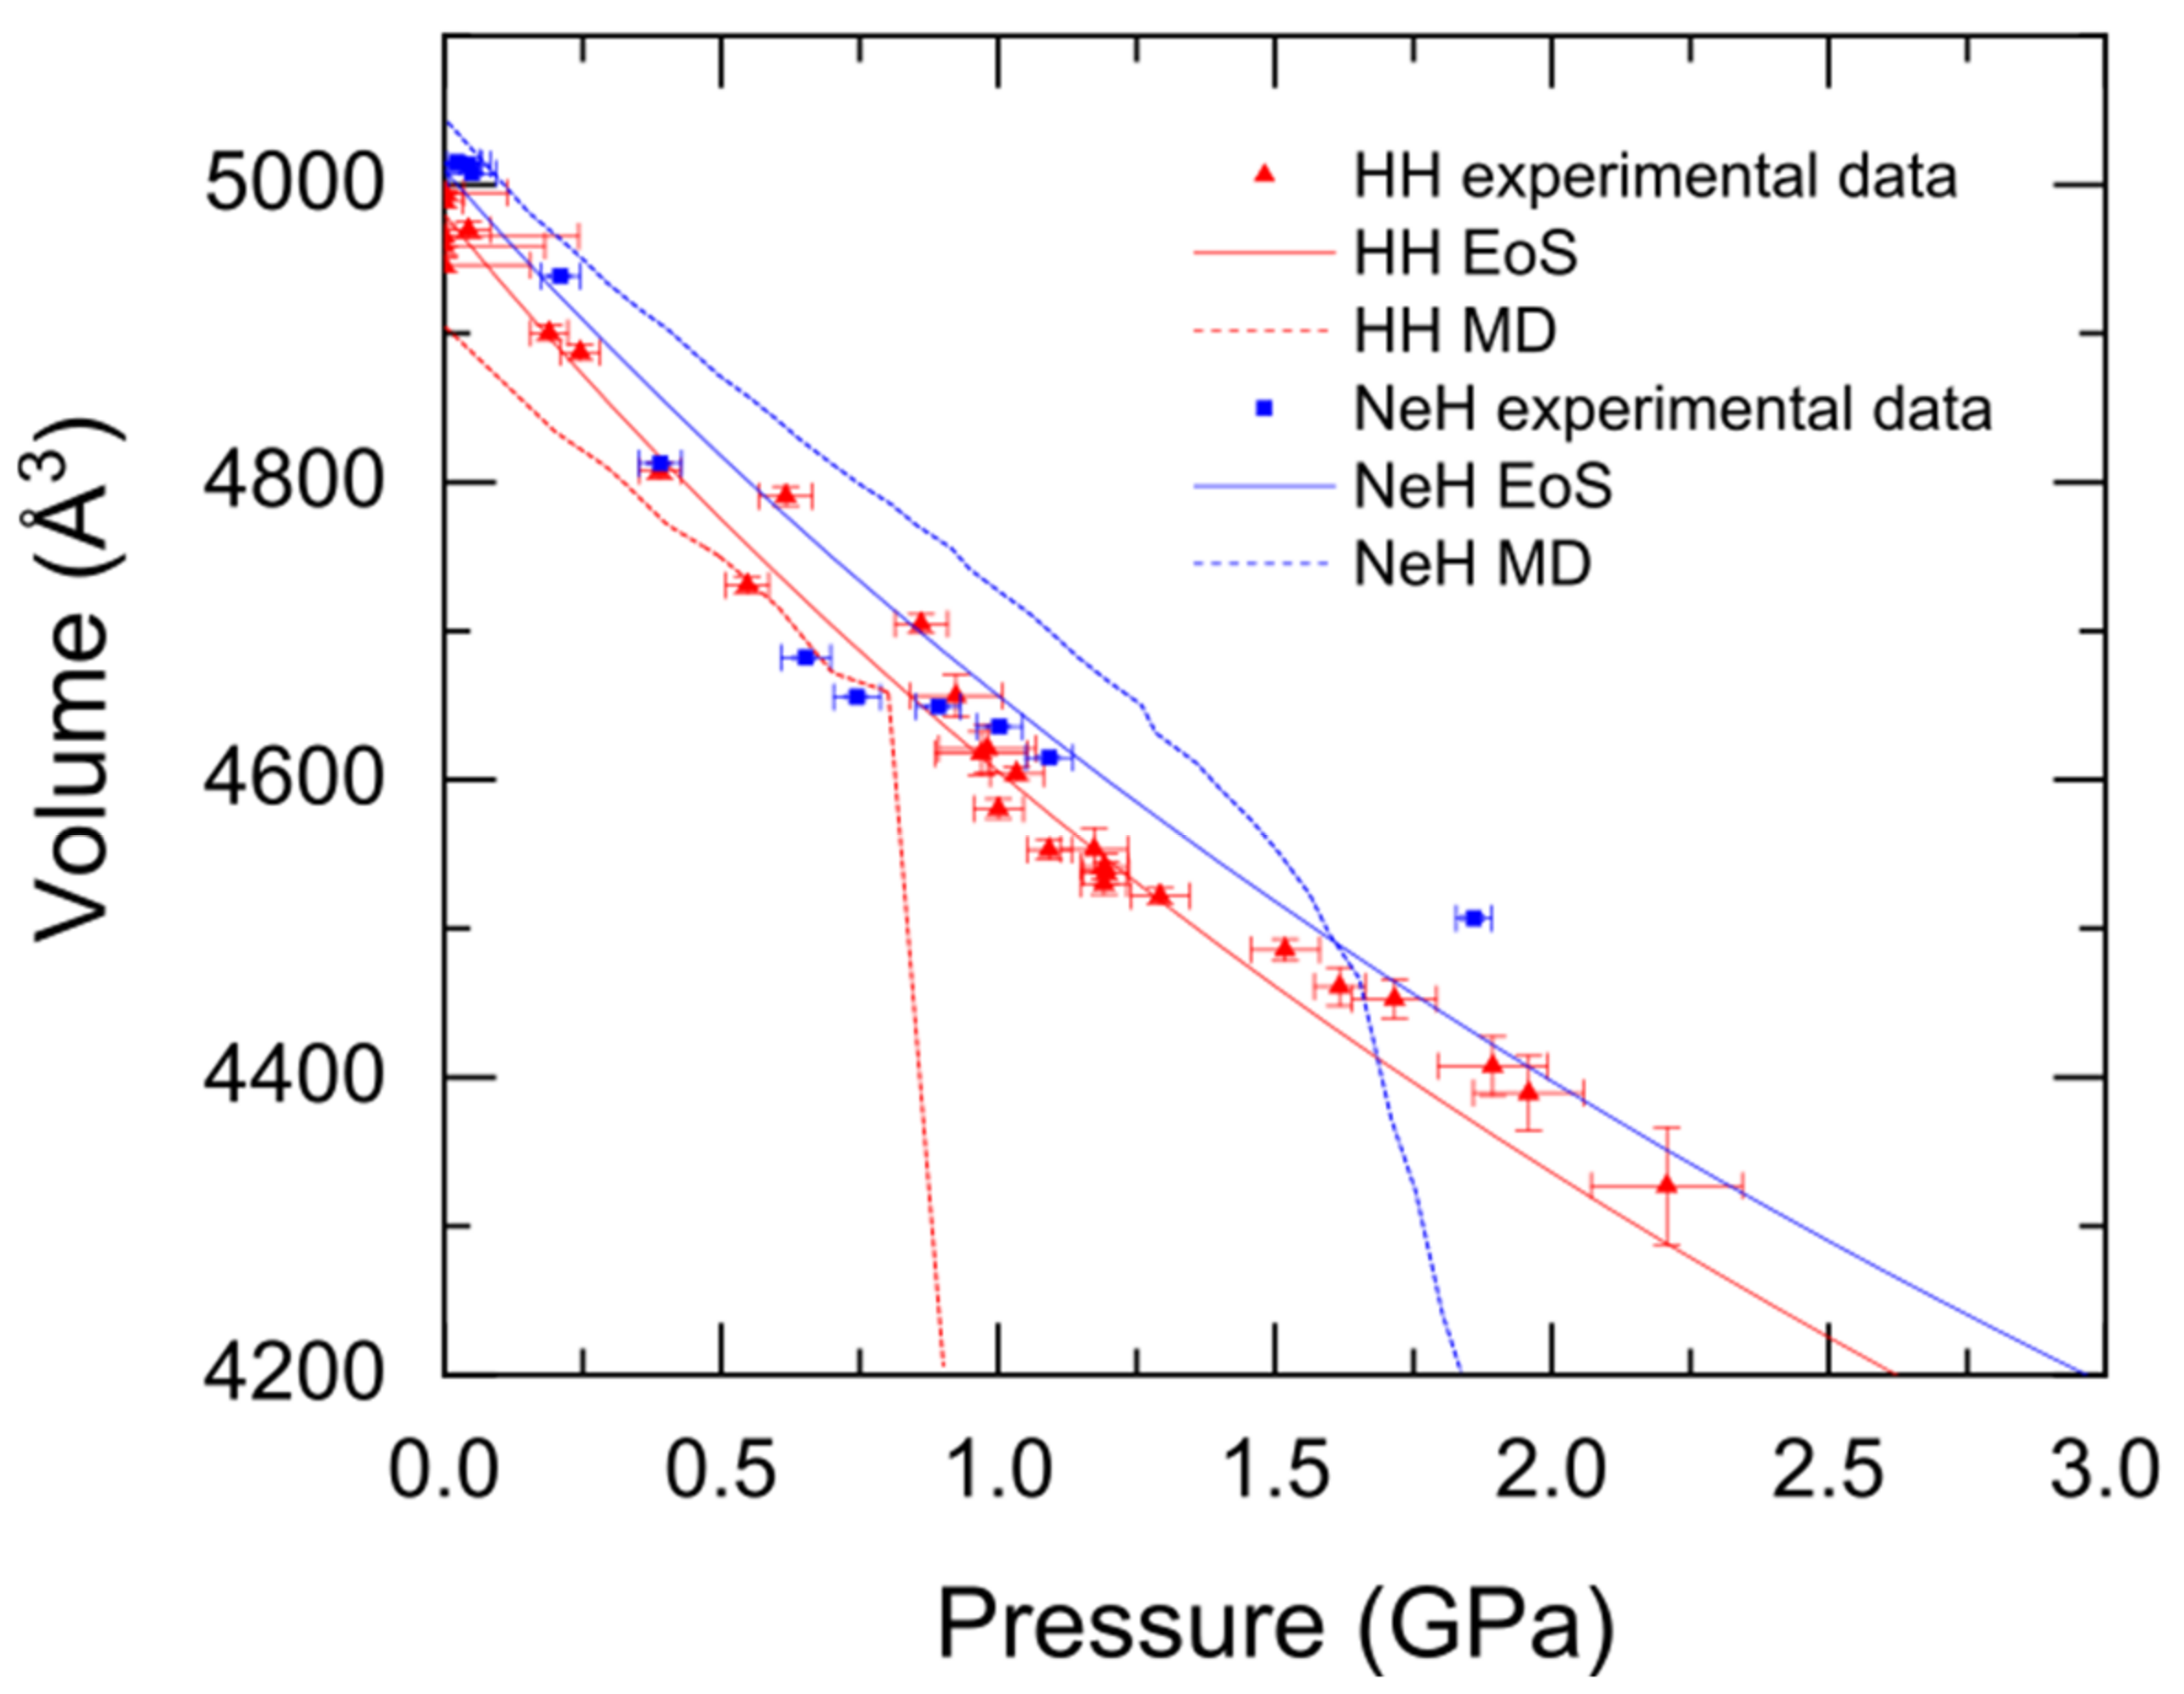
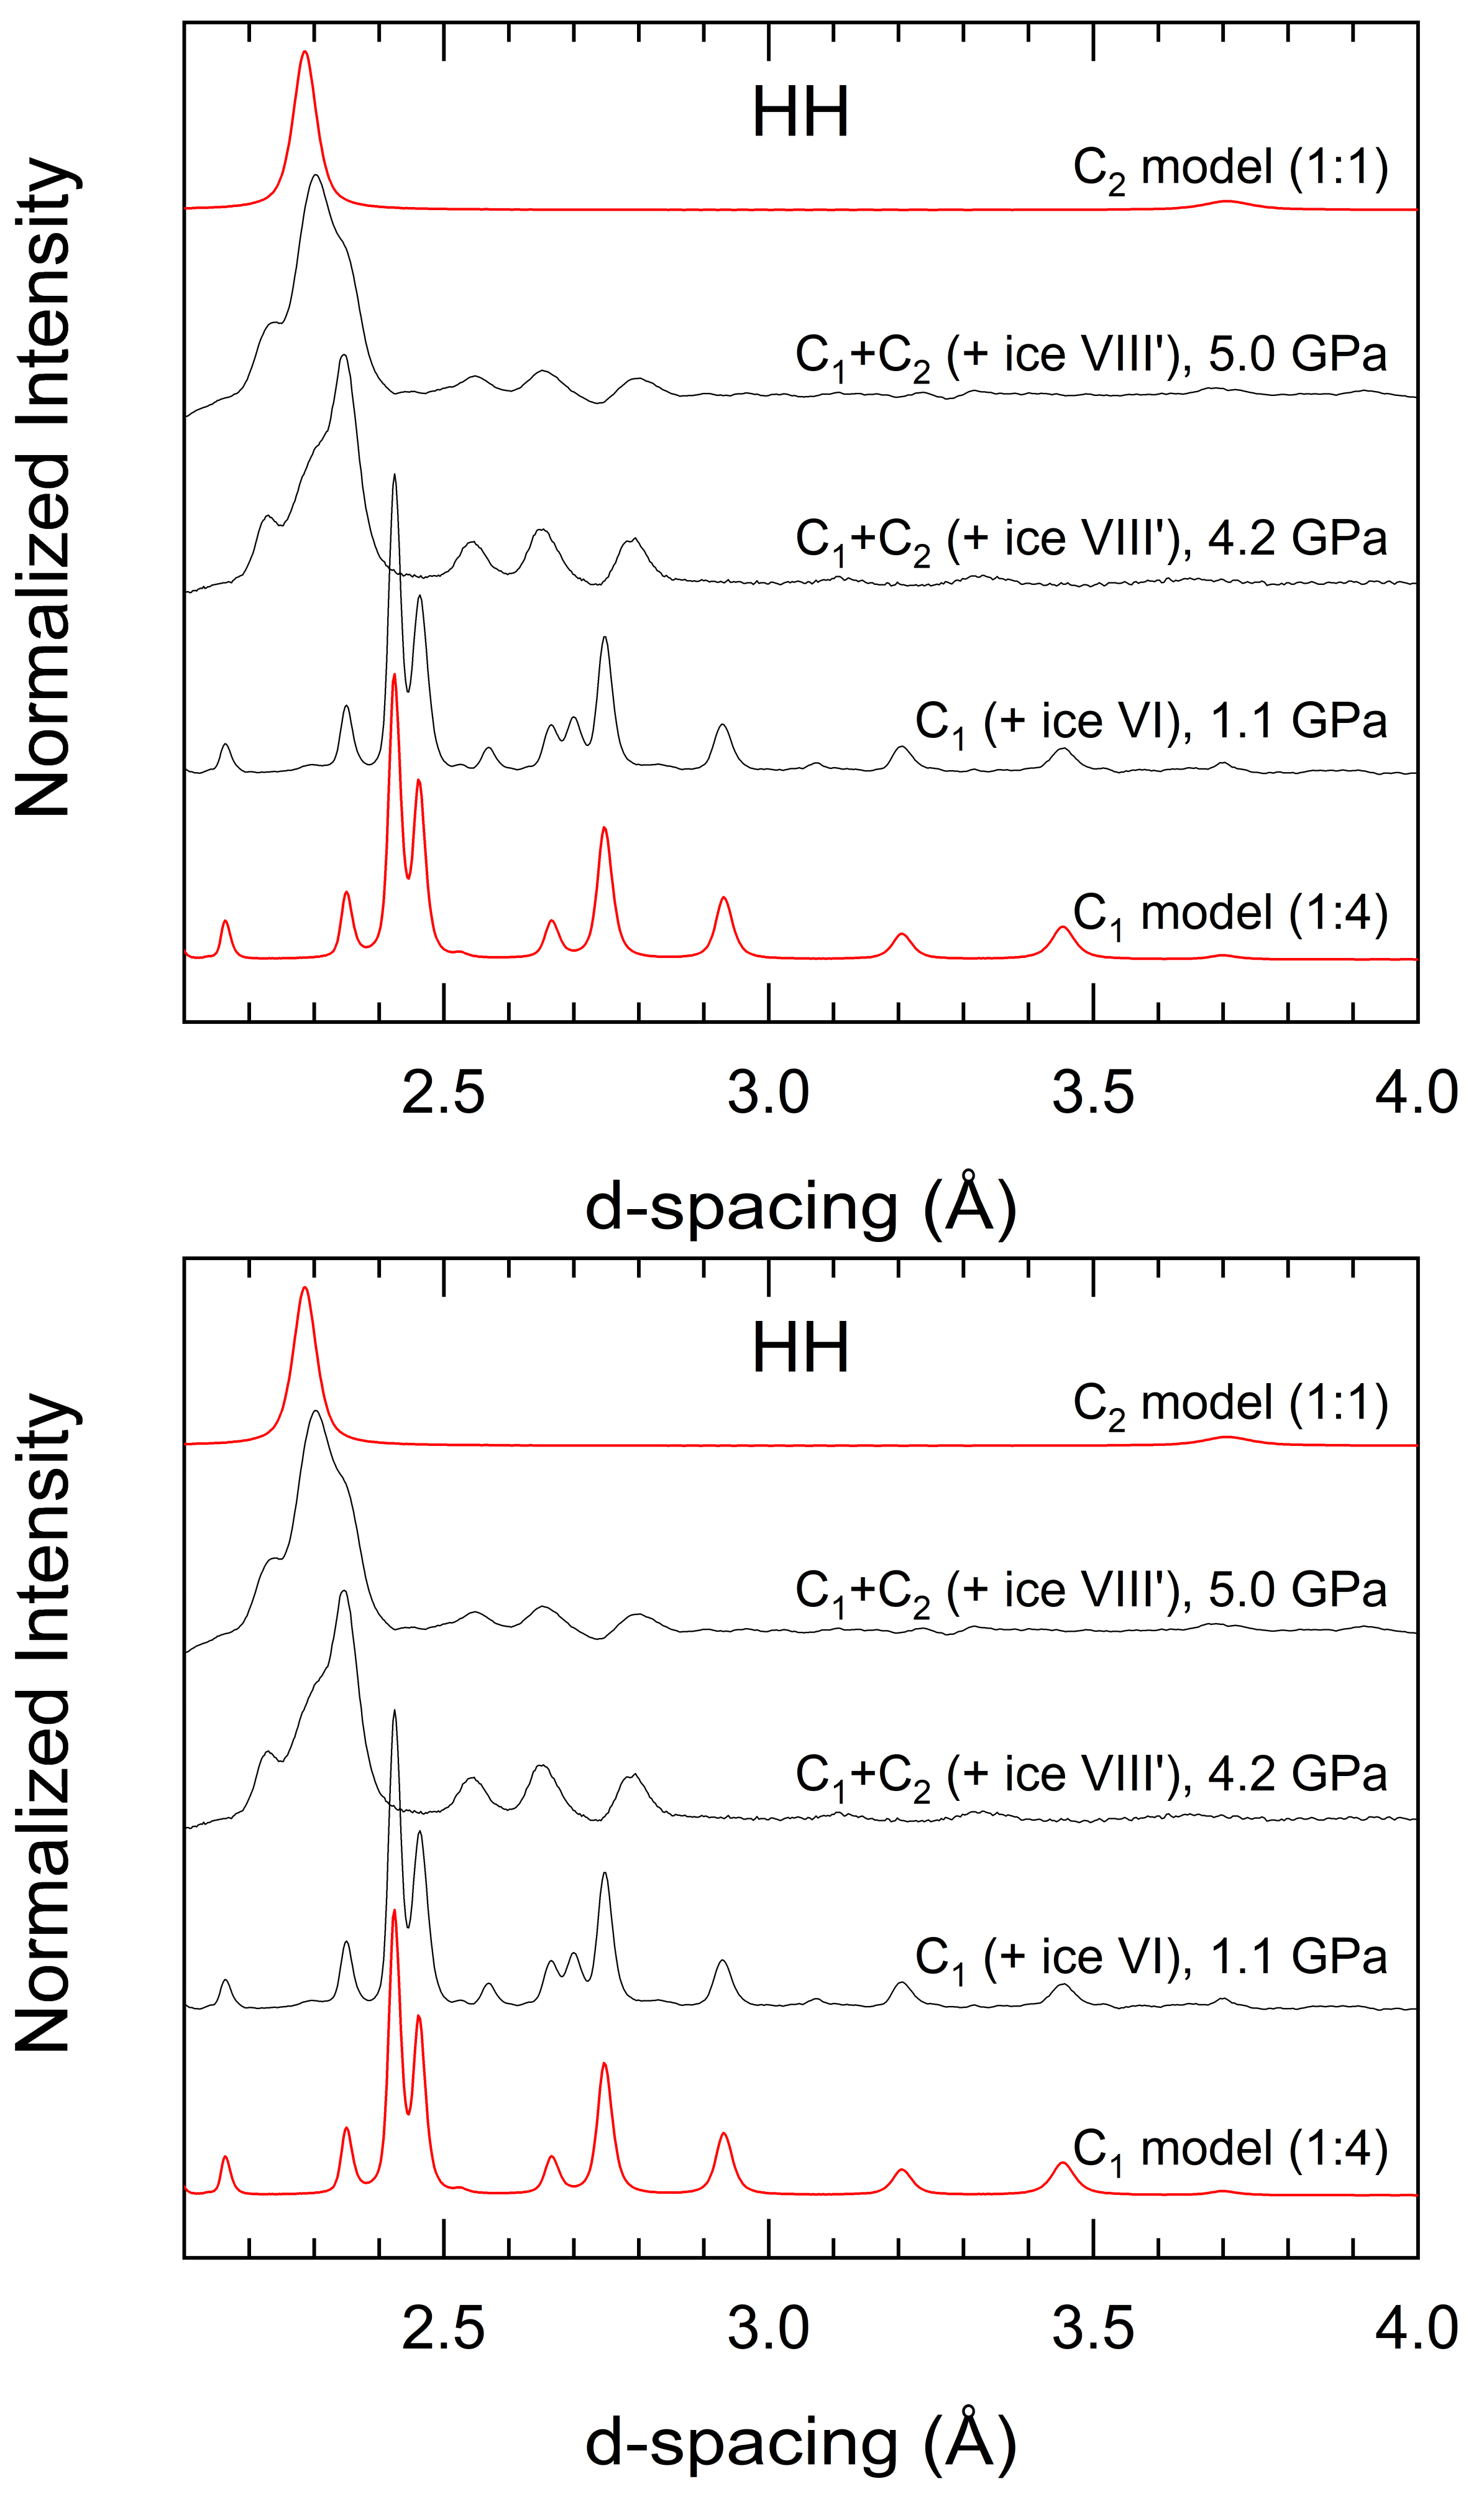
3.3. Formation, Compressibility and Decompression Behavior of C1 and C2 HH Phases

As described above, in experiments a1 and a2 gradual CS-II to C1 transition was observed at 1.1 GPa. The C1 phase has an ideal crystallographic composition 1:6 [16], but is known to accept hydrogen contents up to 1:~4 [45], which is the expected composition in our experiments. Experiment a2 proceeded by further compressing the sample up to 4.8(4) GPa. At 3.5(2) GPa the sample constituted about 50% C1 and about 50% a mixture of C2 and ice VIII’ (apostrophe designates unspecified proton-ordering). This indicates that at 95 K and above 3 GPa C1 HH sluggishly decomposes according to C1 (H2·(H2O)4) → C2 (H2·H2O) + 3 ice VIII’ (H2O).
In Rietveld refinements, C1 was modeled as H-filled high-pressure ice II with a rhombohedral R 3 ¯ h structure based on Londono et al.’s C1 He hydrate [13]. The C1 unit cell closely resembles that of ice II. The c/a ratio of He hydrate (0.481) is smaller than that of pure ice II (0.483) [46], and was predicted to decrease with pressure reaching 0.473 at 1.1 GPa [13]. This prediction agrees well with our observation, a = 12.8025(8) Å and c = 6.0673(4) Å and c/a = 0.474 at 1.1 GPa. H2 molecules were described as a single D position (Wyckoff position 6c) at the center of six-membered water rings. Thermal parameters and occupancy were refined and resulted in a composition of 1:~4.5. C2 HH was modeled according to Komatsu et al. [47] as a twice-as-large ice Ic unit cell (a ≈ 6.5 Å, space group F d 3 ¯ m ) where randomly oriented D2 molecules are described by a Wyckoff position 48f (0.064, 1/8, 1/8). Only the lattice parameters were refined and the composition was assumed to be 1:1 (i.e., the 48f occupancy was constrained to 1/3), since the C2 phase is considered only stable at maximum filling of ice Ic by hydrogen [8]. Figure 5 shows selected diffractograms and Rietveld fits for C1 and C2 HH.
In experiment a3 an alternative route was taken and CS-II HH was heated from 95 K just before the phase transition seen in a1 and a2 (~1 GPa). During this non-isobaric step diffraction patterns were collected for 1h at each temperature, at 10 K intervals. At 165 K and 1.19(4) GPa, CS-II HH fully transformed into C1. At 200 K, the sample was continuously compressed to 7.8(2) GPa. During this compression C1 transformed/decomposed into C2 + ice VIII’ above 3 GPa, similar to experiment a2 at 95 K, but C1 phase was partially maintained up to the highest pressures. (Due to the low quality of the data C1/C2 phase fractions could not be refined). The compressibility of C1 HH was followed and the EoS was extracted, which is shown in Figure 6. The bulk modulus of C1 HH (16.3(5) GPa) is very close to that reported for ice II (12.13(7) GPa) [48]. Experiment a3 was concluded by decompressing the sample upon which C1 reformed from C2 + ice VIII’. Between 4.6(1) and 1.90(4) GPa the sample developed into single phase C1 which at atmospheric pressure turned into pure ice II (empty C1). Ice II is known to be recoverable at LN2 temperature and is metastable at 200 K due to its low entropy (H-ordering) [49,50].
In experiment b CS-II HH was observed metastably up to 2.2(1) GPa (at 95 K). At this stage, the sample was heated to 200 K and immediately transformed into C1. After further compressing at 200 K to 5.0(2) GPa (and after about 18 h), the sample constituted 20% C1 and 20% C2/60% ice VIII’. Considering C1 and C2 as 1:4 and 1:1 hydrates, respectively, the overall composition would be maintained at 1:~4.2. The sample was then cooled back to 95 K and decompressed in small steps (Figure 7). After complete removal of the load from the PE press the residual pressure remained at 0.1(2) GPa. At this pressure, crystalline C1 HH could be still noticed in the diffraction pattern whereas reflections from C2 HH appeared absent. Komatsu et al. reported that C2 HH undergoes amorphization below 0.5 GPa on decompression at 100 K [47]. Interestingly, from this amorphous form the authors could obtain stacking-disorder free ice Ic upon ambient pressure recovery. Thus, possibly the absence of C2 reflections relates to amorphization since also diffuse features grew in the diffractogram. Experiment b was completed by recovering the sample to ambient pressure at 95 K (by opening the PE press breech). As in experiment a3 hydrogen escaped and the recovered sample constituted ice II (which should correlate to C1 HH present in the pressurized sample) and either ice stacking-disordered ice (Isd) or a mixture of ice Ih and ice Ic. Against the background Komatsu et al.’s [47] finding, we assumed the presence of ice Ic (which should correlated to C2 HH in the pressurized sample) and Ih (from the fraction of ice VIII’).

3.4. Synthesis of C2 NeH

As described above (experiment c), the CS-II NeH sample became fully amorphous when compressed to 1.86(3) GPa at 90 K. Experiment c proceeded with heating the sample at 3.0(1) GPa to 170 K. The heavier noble gas CS-II Ar clathrate hydrate amorphizes at around 1.4 GPa at the same temperature. Heating amorphous Ar hydrate to 170 K and annealing at this temperature then creates a second amorphous form, which is more dense [51]. However, in contrast with amorphous Ar hydrate, amorphous NeH recrystallized as a mixture of C2, ice VIII’ and a small fraction of (metastable) ice Ic during heating to 170 K. C2 NeH has not been observed before experimentally although it was predicted to be more stable than C1 above 0.85 GPa (at 273 K) in a grand-canonical Monte Carlo simulation [52]. This is the first report, to our knowledge, of the synthesis of C2 NeH. The diffraction pattern, shown in Figure 8, was modeled with a C2 NeH phase based on C2 HH, together with ice VIII [53] and ice Ic [47]. The refinement (presented in more details in the Supplementary Materials) resulted in 27.5% C2, 40.7% ice VII’ and 4.2% ice Ic, which again maintains the overall composition 1:~4.

4. Discussion

The high pressure behavior of CS-II HH (H2:4.2H2O) at low temperatures (~95 K) deviates from the established phase relations of HH at higher temperatures (220–270 K). A gradual transition into C1 phase with the same or similar H2 content is seen at 1.1–1.2 GPa. The instability of crystalline CS-II HH above 0.8 GPa as revealed in MD simulations may indicate that a mixture of H2 fluid and C0 phase with 1:6 composition is more stable in the narrow range 0.8–1.1 GPa but is not observed for kinetic reasons. The transition to C2 phase (1H2:1H2O) is seen above 3 GPa and inevitably leads to a phase mixture C2 HH and ice VIII’ because of the higher H2 content of the C2 phase (the ideal ratio of this mixture is 1:3). The decomposition of C1 HH into C2 HH and ice VIII’ appears to be very sluggish. C1 can be observed (metastably) at very high pressures, up to 8 GPa even at 200 K. In contrast, the transition of CS-II to C1 HH completes readily at 1.1–1.2 GPa when rising the temperature from 95 to 200 K.
Once completely transformed, reformation of CS-II HH upon decompression has not been observed. Instead C1 and C2 HH can be retained to very low pressures and recovered as empty ice II and Ic/Isd, respectively, at ambient pressure. Backformation of C1 from C2/ice VIII’ can be observed at 200 K, whereas at 95 K it seems to be suppressed. Similarly, Komatsu et al. [47] could retain a pure C2 HH sample (which was produced at 3 GPa and 300 K in the presence of a reservoir of H2) to below 0.5 GPa on decompression at 100 K.
Different to CS-II HH, CS-II NeH undergoes PIA at low temperature high pressure conditions, thus following the trend of the heavier noble gas clathrate hydrates. However, different to these, pressure-amorphized CS-II NeH cannot be annealed to produce a densified and (potentially) recoverable amorphous state, but undergoes recrystallization to C2 NeH and ice VIII’ when heating from 90 to 170 K at 2.65 GPa. The existence of C2 NeH has been predicted at this pressure but has not yet been reported.
In summary, the high pressure behavior of CS-II hydrates with the low Z guests H2 and Ne is distinguished from high Z analogues. CS-II HH undergoes transitions/decompositions to crystalline high pressure hydrates even at low temperatures where high Z analogues undergo PIA. CS-II NeH undergoes PIA but the amorphous form readily forms the high pressure hydrate C2 NeH at slightly elevated temperatures instead of a densified polyamorph.

Supplementary Materials

The following are available online at https://www.mdpi.com/article/10.3390/cryst12010009/s1, experimental details of high pressure neutron diffraction data collected at the high-pressure diffractometer SNAP (beamline 3) at the Spallation Neutron Source, USA; Table S1. Refinement details from neutron powder diffraction data for C2 neon hydrate.

Author Contributions

Conceptualization, U.H. and C.A.T.; methodology, U.H., A.P.L., C.A.T. and A.M.; validation, U.H., A.P.L., O.A., C.A.T., A.M. and A.A.L.; formal analysis, P.H.B.B.C. and I.M.N.; investigation, P.H.B.B.C., A.M., I.M.N., C.A.T. and J.J.M.; resources, U.H., A.P.L. and C.A.T.; data curation, P.H.B.B.C.; writing—original draft preparation, P.H.B.B.C. and U.H.; writing—review and editing, O.A., A.M. and A.A.L.; visualization, P.H.B.B.C. and U.H.; supervision, U.H., O.A. and C.A.T.; project administration, U.H. and O.A.; funding acquisition, U.H., A.P.L., O.A. and A.A.L. All authors have read and agreed to the published version of the manuscript.

Funding

This research has been funded by the Swedish Foundation for Strategic Research (SSF) within the Swedish national graduate school in neutron scattering (SwedNess). A portion of this research used resources at the Spallation Neutron Source, a DOE Office of Science User Facility operated by the Oak Ridge National Laboratory. The simulations were enabled by resources provided by the Swedish National Infrastructure for Computing (SNIC), partially funded by the Swedish Research Council through grant agreement no. 2018-05973. The authors thank also the financial support from the Swedish Foundation for International Cooperation in Research and Higher Education (STINT) and the Brazilian agency CAPES (project CAPES/STINT N° 88887.304724/2018).

Institutional Review Board Statement

Not applicable.

Informed Consent Statement

Not applicable.

Conflicts of Interest

The authors declare no conflict of interest.

References

  1. Sloan, E.D., Jr.; Koh, C.A.; Koh, C.A. Clathrate Hydrates of Natural Gases; CRC Press: Boca Raton, FL, USA, 2007; ISBN 9780429129148. [Google Scholar]
  2. Van der Waals, J.H.; Platteeuw, J.C. Clathrate Solutions; John Wiley & Sons, Ltd.: Hoboken, NJ, USA, 2007; pp. 1–57. [Google Scholar]
  3. Loveday, J.S.; Nelmes, R.J. High-pressure gas hydrates. Phys. Chem. Chem. Phys. 2008, 10, 937–950. [Google Scholar] [CrossRef] [PubMed]
  4. Dyadin, Y.A.; Larionov, E.G.; Manakov, A.Y.; Zhurko, F.V.; Aladko, E.Y.; Mikina, T.V.; Komarov, V.Y. Clathrate hydrates of hydrogen and neon. Mendeleev Commun. 1999, 9, 209–210. [Google Scholar] [CrossRef]
  5. Lokshin, K.A.; Zhao, Y. Fast synthesis method and phase diagram of hydrogen clathrate hydrate. Appl. Phys. Lett. 2006, 88, 131909. [Google Scholar] [CrossRef]
  6. Lokshin, K.A.; Zhao, Y.; He, D.; Mao, W.L.; Mao, H.-K.K.; Hemley, R.J.; Lobanov, M.V.; Greenblatt, M. Structure and dynamics of hydrogen molecules in the novel clathrate hydrate by high pressure neutron diffraction. Phys. Rev. Lett. 2004, 93, 125503. [Google Scholar] [CrossRef]
  7. Falenty, A.; Hansen, T.C.; Kuhs, W.F. Formation and properties of ice XVI obtained by emptying a type sII clathrate hydrate. Nature 2014, 516, 231–233. [Google Scholar] [CrossRef]
  8. Bozhko, Y.Y.; Subbotin, O.S.; Fomin, V.M.; Belosludov, V.R.; Kawazoe, Y. Theoretical investigation of structures, compositions, and phase transitions of neon hydrates based on ices Ih and II. J. Eng. Thermophys. 2014, 23, 20–26. [Google Scholar] [CrossRef]
  9. Trinh, T.T.; Waage, M.H.; Van Erp, T.S.; Kjelstrup, S. Low barriers for hydrogen diffusion in sII clathrate. Phys. Chem. Chem. Phys. 2015, 17, 13808–13812. [Google Scholar] [CrossRef] [Green Version]
  10. Burnham, C.J.; English, N.J. Free-energy calculations of the intercage hopping barriers of hydrogen molecules in clathrate hydrates. J. Phys. Chem. C 2016, 120, 16561–16567. [Google Scholar] [CrossRef]
  11. Burnham, C.J.; Futera, Z.; English, N.J. Quantum and classical inter-cage hopping of hydrogen molecules in clathrate hydrate: Temperature and cage-occupation effects. Phys. Chem. Chem. Phys. 2017, 19, 717–728. [Google Scholar] [CrossRef]
  12. Kuhs, W.F.; Hansen, T.C.; Falenty, A. Filling Ices with Helium and the Formation of Helium Clathrate Hydrate. J. Phys. Chem. Lett. 2018, 9, 3194–3198. [Google Scholar] [CrossRef]
  13. Londono, D.; Finney, J.L.; Kuhs, W.F. Formation, stabilty, and structure of helium hydrate at high pressure. J. Chem. Phys. 1992, 97, 547–552. [Google Scholar] [CrossRef]
  14. Londono, D.; Kuhs, W.F.; Finney, J.L. Enclathration of helium in ice II: The first helium hydrate. Nature 1988, 332, 141–142. [Google Scholar] [CrossRef]
  15. Yu, X.; Zhu, J.; Du, S.; Xu, H.; Vogel, S.C.; Han, J.; Germann, T.C.; Zhang, J.; Jin, C.; Francisco, J.S.; et al. Crystal structure and encapsulation dynamics of ice II-structured neon hydrate. Proc. Natl. Acad. Sci. USA 2014, 111, 10456–10461. [Google Scholar] [CrossRef] [Green Version]
  16. Vos, W.L.; Finger, L.W.; Hemley, R.J.; Mao, H. Novel H2-H2O Clathrates at High Pressures. Phys. Rev. Lett. 1993, 71, 3150–3153. [Google Scholar] [CrossRef]
  17. Machida, S.; Hirai, H.; Kawamura, T.; Yamamoto, Y.; Yagi, T. Structural changes of filled ice Ic structure for hydrogen hydrate under high pressure. J. Chem. Phys. 2008, 129, 224505. [Google Scholar] [CrossRef]
  18. Brant Carvalho, P.H.B.; Mace, A.; Bull, C.L.; Funnell, N.P.; Tulk, C.A.; Andersson, O.; Häussermann, U. Elucidation of the pressure induced amorphization of tetrahydrofuran clathrate hydrate. J. Chem. Phys. 2019, 150, 204506. [Google Scholar] [CrossRef] [Green Version]
  19. Brant Carvalho, P.H.B.; Mace, A.; Andersson, O.; Tulk, C.A.; Molaison, J.; Lyubartsev, A.P.; Nangoi, I.M.; Leitão, A.A.; Häussermann, U. Pressure-induced amorphization of noble gas clathrate hydrates. Phys. Rev. B 2021, 103, 064205. [Google Scholar] [CrossRef]
  20. Amann-Winkel, K.; Böhmer, R.; Fujara, F.; Gainaru, C.; Geil, B.; Loerting, T. Colloquium: Water’s controversial glass transitions. Rev. Mod. Phys. 2016, 88, 011002. [Google Scholar] [CrossRef]
  21. Besson, J.M.; Nelmes, R.J.; Hamel, G.; Loveday, J.S.; Weill, G.; Hull, S. Neutron powder diffraction above 10 GPa. Phys. B Condens. Matter 1992, 180–181, 907–910. [Google Scholar] [CrossRef]
  22. Strässle, T.; Klotz, S.; Kunc, K.; Pomjakushin, V.; White, J.S. Equation of state of lead from high-pressure neutron diffraction up to 8.9 GPa and its implication for the NaCl pressure scale. Phys. Rev. B 2014, 90, 014101. [Google Scholar] [CrossRef] [Green Version]
  23. Arnold, O.; Bilheux, J.C.; Borreguero, J.M.; Buts, A.; Campbell, S.I.; Chapon, L.; Doucet, M.; Draper, N.; Ferraz Leal, R.; Gigg, M.A.; et al. Mantid—Data analysis and visualization package for neutron scattering and μ SR experiments. Nucl. Instruments Methods Phys. Res. Sect. A Accel. Spectrometers Detect. Assoc. Equip. 2014, 764, 156–166. [Google Scholar] [CrossRef] [Green Version]
  24. Toby, B.H.; Von Dreele, R.B. GSAS-II: The genesis of a modern open-source all purpose crystallography software package. J. Appl. Crystallogr. 2013, 46, 544–549. [Google Scholar] [CrossRef]
  25. Matsumoto, M.; Yagasaki, T.; Tanaka, H. GenIce: Hydrogen-Disordered Ice Generator. J. Comput. Chem. 2018, 39, 61–64. [Google Scholar] [CrossRef]
  26. Alavi, S.; Ripmeester, J.A.; Klug, D.D. Molecular-dynamics study of structure II hydrogen clathrates. J. Chem. Phys. 2005, 123, 24507. [Google Scholar] [CrossRef] [PubMed]
  27. Abraham, M.J.; Murtola, T.; Schulz, R.; Páll, S.; Smith, J.C.; Hess, B.; Lindahl, E. GROMACS: High performance molecular simulations through multi-level parallelism from laptops to supercomputers. SoftwareX 2015, 1–2, 19–25. [Google Scholar] [CrossRef] [Green Version]
  28. Plimpton, S. Fast parallel algorithms for short-range molecular dynamics. J. Comput. Phys. 1995, 117, 1–19. [Google Scholar] [CrossRef] [Green Version]
  29. Parrinello, M.; Rahman, A. Polymorphic Transitions in Single Crystals: A New Molecular Dynamics Method. J. Appl. Phys. 1981, 52, 7182–7190. Available online: http://lammps.sandia.gov for informatio (accessed on 15 November 2021). [CrossRef]
  30. Bussi, G.; Donadio, D.; Parrinello, M. Canonical sampling through velocity rescaling. J. Chem. Phys. 2007, 126, 014101. [Google Scholar] [CrossRef] [Green Version]
  31. Essmann, U.; Perera, L.; Berkowitz, M.L.; Darden, T.; Lee, H.; Pedersen, L.G. A smooth particle mesh Ewald method. J. Chem. Phys. 1995, 103, 8577–8593. [Google Scholar] [CrossRef] [Green Version]
  32. Hess, B.; Bekker, H.; Berendsen, H.J.C.; Fraaije, J.G.E.M. LINCS: A Linear Constraint Solver for molecular simulations. J. Comput. Chem. 1997, 18, 1463–1472. [Google Scholar] [CrossRef]
  33. Harada, A.; Arman, Y.; Miura, S. Molecular dynamics study on fast diffusion of hydrogen molecules in filled ice II. J. Mol. Liq. 2019, 292, 111316. [Google Scholar] [CrossRef]
  34. Melchionna, S.; Ciccotti, G.; Holian, B.L. Hoover npt dynamics for systems varying in shape and size. Mol. Phys. 1993, 78, 533–544. [Google Scholar] [CrossRef]
  35. Rappé, A.K.; Casewit, C.J.; Colwell, K.S.; Goddard, W.A.; Skiff, W.M. UFF, a Full Periodic Table Force Field for Molecular Mechanics and Molecular Dynamics Simulations. J. Am. Chem. Soc. 1992, 114, 10024–10035. [Google Scholar] [CrossRef]
  36. Hockney, R.; Eastwood, J. Computer Simulation Using Particles, 1st ed.; CRC Press: Boca Raton, FL, USA, 2021; ISBN 9780367806934. [Google Scholar]
  37. Abascal, J.L.F.; Sanz, E.; Fernández, R.G.; Vega, C. A potential model for the study of ices and amorphous water: TIP4P/Ice. J. Chem. Phys. 2005, 122, 234511. [Google Scholar] [CrossRef] [Green Version]
  38. Papadimitriou, N.I.; Tsimpanogiannis, I.N.; Economou, I.G.; Stubos, A.K. Influence of combining rules on the cavity occupancy of clathrate hydrates by Monte Carlo simulations. Mol. Phys. 2014, 112, 2258–2274. [Google Scholar] [CrossRef]
  39. Strobel, T.A.; Somayazulu, M.; Hemley, R.J. Phase behavior of H2 + H2O at high pressures and low temperatures. J. Phys. Chem. C 2011, 115, 4898–4903. [Google Scholar] [CrossRef]
  40. Salzmann, C.G. Advances in the experimental exploration of water’s phase diagram. J. Chem. Phys. 2019, 150, 190901. [Google Scholar] [CrossRef]
  41. Ranieri, U.; Koza, M.M.; Kuhs, W.F.; Gaal, R.; Klotz, S.; Falenty, A.; Wallacher, D.; Ollivier, J.; Gillet, P.; Bove, L.E. Quantum Dynamics of H2 and D2 Confined in Hydrate Structures as a Function of Pressure and Temperature. J. Phys. Chem. C 2019, 123, 1888–1903. [Google Scholar] [CrossRef]
  42. MacDonald, J.R. Review of some experimental and analytical equations of state. Rev. Mod. Phys. 1969, 41, 316–349. [Google Scholar] [CrossRef]
  43. Manakov, A.Y.; Ogienko, A.G.; Tkacz, M.; Lipkowski, J.; Stoporev, A.S.; Kutaev, N.V. High-pressure gas hydrates of argon: Compositions and equations of state. J. Phys. Chem. B 2011, 115, 9564–9569. [Google Scholar] [CrossRef]
  44. Katsumasa, K.; Koga, K.; Tanaka, H. On the thermodynamic stability of hydrogen clathrate hydrates. J. Chem. Phys. 2007, 127, 044509. [Google Scholar] [CrossRef] [Green Version]
  45. Kuzovnikov, M.A.; Tkacz, M. T-P-X Phase Diagram of the Water-Hydrogen System at Pressures up to 10 kbar. J. Phys. Chem. C 2019, 123, 3696–3702. [Google Scholar] [CrossRef]
  46. Kamb, B.; Hamilton, W.C.; LaPlaca, S.J.; Prakash, A. Ordered Proton Configuration in Ice II, from Single-Crystal Neutron Diffraction. J. Chem. Phys. 1971, 55, 1934–1945. [Google Scholar] [CrossRef]
  47. Komatsu, K.; Machida, S.; Noritake, F.; Hattori, T.; Sano-Furukawa, A.; Yamane, R.; Yamashita, K.; Kagi, H. Ice Ic without stacking disorder by evacuating hydrogen from hydrogen hydrate. Nat. Commun. 2020, 11, 464. [Google Scholar] [CrossRef] [Green Version]
  48. Fortes, A.D.; Wood, I.G.; Alfredsson, M.; Vočadlo, L.; Knight, K.S. The incompressibility and thermal expansivity of D2O ice II determined by powder neutron diffraction. J. Appl. Crystallogr. 2005, 38, 612–618. [Google Scholar] [CrossRef] [Green Version]
  49. Bertie, J.E.; Calvert, L.D.; Whalley, E. Transformations of Ice II, Ice III, and Ice V at Atmospheric Pressure. J. Chem. Phys. 1963, 38, 840–846. [Google Scholar] [CrossRef]
  50. Fuentes-Landete, V.; Rasti, S.; Schlögl, R.; Meyer, J.; Loerting, T. Calorimetric Signature of Deuterated Ice II: Turning an Endotherm to an Exotherm. J. Phys. Chem. Lett. 2020, 11, 8268–8274. [Google Scholar] [CrossRef]
  51. Brant Carvalho, P.H.B.; Moraes, P.I.R.; Leitão, A.A.; Andersson, O.; Tulk, C.A.; Molaison, J.; Lyubartsev, A.P.; Häussermann, U. Structural investigation of three distinct amorphous forms of Ar hydrate. RSC Adv. 2021, 11, 30744–30754. [Google Scholar] [CrossRef]
  52. Hakim, L.; Koga, K.; Tanaka, H. Novel neon-hydrate of cubic ice structure. Phys. A Stat. Mech. Appl. 2010, 389, 1834–1838. [Google Scholar] [CrossRef]
  53. Jorgensen, J.D.; Worlton, T.G. Disordered structure of D2O ice VII from in situ neutron powder diffraction. J. Chem. Phys. 1985, 83, 329–333. [Google Scholar] [CrossRef] [Green Version]
Figure 1. Phase diagram of the hydrogen-water system and experimental pathways performed in this work. Solid blue lines show the hydrogen-water phase transition lines from Strobel et al. [39]. Solid gray lines show the pure-water phase diagram from Salzmann [40]. Arrows show the path taken in each of the four HH experiments a1 (solid line), a2 (dashed line), a3 (dotted line), and b (dash-dot line), red ticks marking phase transitions.
Crystals 12 00009 g001
Figure 2. Neutron powder diffraction (NPD) patterns of the starting crystalline CS-II HH and NeH phases. Black crosses show the experimental data, red lines the Rietveld fit and blue lines the difference. Tick marks represent allowed reflections for the CS-II phase with a ≈ 17.1 Å. NeH refinement whole-pattern residual Rw = 3.20%, χ2 = 1.55; and HH Rw = 3.47%, χ2 = 2.40.
Crystals 12 00009 g002
Figure 3. NPD profiles of (a) HH and (b) NeH upon compression up to 2.5–3.0 GPa. Tick marks show Bragg positions of allowed reflections for the CS-II phase at atmospheric pressure (blue ticks) and C1 phase most intense reflections ( 31 1 ¯ and 21 2 ¯ ) at 2.5 GPa (red ticks).
Crystals 12 00009 g003
Figure 4. Equations of state of CS-II HH and NeH. The solid lines are fits of the Murnaghan equa-tion. The dashed lines are MD simulations of the compression and amorphization.
Crystals 12 00009 g004
Figure 5. NPD patterns of the high-pressure HH phases at 200 K. Experimental patterns (solid black lines) and calculated diffraction patterns (red lines) show C1 and C2 HH phases at 200 K with increasing pressure.
Crystals 12 00009 g005
Figure 6. Equations of state of C1 HH. The solid line is a fit of the Murnaghan equation (dotted lines show the standard deviation).
Crystals 12 00009 g006
Figure 7. NPD patterns of the decompression and recovery of HH at 95 K. Solid black lines show experimental data, red and blue lines show calculated diffraction patterns of ices II and Ic while empty and H2-filled (C1 and C2 phases, respectively). Ice (hexagonal and ice VIII’) and lead (pressure marker) peaks are discriminated in the experimental data.
Crystals 12 00009 g007
Figure 8. Rietveld refinement and modelled C2 neutron diffraction pattern obtained for Ne hydrate at 3.6(1) GPa and 90 K. The observed intensities are shown as blue crosses, and calculated patterns as solid lines (total calculated in black, C2 NH phase in red). The difference curve is shown below in cyan. Fitted phases include ices VIII’, ice Ic, lead (pressure marker) and parasite peaks from the anvil (steel and c-BN).
Crystals 12 00009 g008
Publisher’s Note: MDPI stays neutral with regard to jurisdictional claims in published maps and institutional affiliations.

