Article

The Radiation Temperature Characteristics of Sapphire under Shock Loading

1
College of Electronic Information Engineering, Xi’an Technological University, 2, Xuefu Rd., Xi’an 710021, China
2
Institute of High Temperature and High Pressure Physics, Southwest Jiaotong University, 111 North Second Ring Rd., Chengdu 610031, China
*
Authors to whom correspondence should be addressed.
Crystals 2022, 12(10), 1364; https://doi.org/10.3390/cryst12101364
Submission received: 23 August 2022 / Revised: 22 September 2022 / Accepted: 23 September 2022 / Published: 26 September 2022

Abstract

:
A light gas gun was used to study the radiation temperature from the window material of sapphire. The luminescence characteristics were determined using a multi-wavelength pyrometer in the pressure range of 36–50 GPa. By improving the processing technology for the metal sample and assembly technology for the target, the eight-wavelength light radiation was measured from sapphire under shock pressure without phase transition. The experimental results showed that sapphire has luminous phenomenon from 36.5 GPa. The luminous intensity changes in a linear fashion, revealing the thickness of the radiating layer of shock-compressed sapphire with a constant absorption coefficient. The results indicated that the spectral distribution is a typical thermal radiation, which fits well with the grey-body spectrum. The radiation of sapphire under shock mostly came from the adiabatic shear banding, as determined by comparing the melting line of sapphire using a static high-pressure experiment and theoretical calculations with the radiation temperature. The study is an effective means to obtain the transparent material shock radiation temperature. Moreover, an effective approach is proposed to research the radiation mechanism of transparent material and the high pressure melting line.

1. Introduction

Transparent window materials refer to a class of medium with little absorption of visible light at normal temperature and pressure, such as single crystals of alkali metal halide (KCL, NaCl, LiF), oxidized materials (Al2O3, SiO2), single crystal diamonds, organic glass, and liquid media (water, alcohol, chloroform). Most have good transparency at normal temperature and pressure, especially the single crystal materials with high strength, which are often used as window materials for various flight equipment [1,2]. However, with the change of environmental pressure, the transparency is lost under shock compression. Because of the intense luminescence of compressed materials at high pressure and high temperature, the transparency under shock compression is lost. The experimental study of shock radiation temperature measurement of transparent materials began in the 1950s [3,4]. Kondo and Ahrens [5] first observed a phenomenon of high-temperature radiation in SiO2 crystals with a color temperature significantly higher than the thermodynamic computation value, but with a very low emissivity. Therefore, it was interpreted as a non-uniform luminescence phenomenon. Schmidt and Ahrens [6] later studied the impact luminescence characteristics of MgO and found that the emission of MgO had obvious band spectral characteristics. They summarized the impact luminescence characteristics of transparent crystals changing with the impact pressure: radiation with a band characteristic spectrum appears in the low pressure region, and the gray body radiation of inhomogeneous hot spots appears in the pressure region with structural transformation. Svendsen and Ahrens [7] found the luminescence and extinction phenomenon of MgO single crystals appear during the shock wave compression process. The luminescence of transparent MgO single crystals under impact is considered to originate from the defect structure. Al2O3 single crystal, also known as sapphire, is considered as an ideal window, with high impedance and good transparency in shock temperature measurement experiments. However, the transparency of sapphire was also questioned in later studies. Kondo [8] conducted an air gun shock loading experiment, and the results show that the impact radiation of sapphire may come from a long-lived triboluminescence mechanism and that the radiation temperature is abnormally high and irregular. Hare et al. [9,10] believed that the luminescence of sapphire under shock wave came from the non-uniform thermal radiation of the shear band, which played an important role in promoting the explanation of the radiation mechanism. They found that the radiation temperature was 4780 K under 45 GPa shock pressure for c-plane sapphire, which was in good agreement with Kondo. This was explained by the electroluminescence phenomena [11,12]. However, the radiation temperature is much higher than the melting temperature, which was computed by Wang et al. [13]. Zhou et al. [14,15,16,17] evaluated sapphire as a window material in the impact compression process by using light absorption measurement technology and determined the serious optical absorption properties of sapphire at 182 GPa. They supported the mechanism of adiabatic shear band radiation in the pressure range of 47–65 GPa by impact compression of sapphire in different shear directions. However, this experiment failed to explain the impact radiation temperature. Fat’yanov et al. [18] also reported an experiment carried out to study the optical transmission in sapphire using a sapphire flyer plate impacting a sapphire sample plate under shock stresses from 11.9 GPa to 26 GPa. The results indicate the sapphire is sufficiently transparent to be the window in shock wave experiments. By using a radiation pyrometer, Liu et al. [19,20,21,22] found that the impact apparent radiation of “interface and window” showed linear enhancement, and the color temperature of Al2O3 window radiation near 100 GPa was about 4000 K. In a recent study, Ostrik and Nikolaev [23] studied shock-induced melting of sapphire between 280–1350 GPa. Calculation of the melting curve of sapphire under high pressure fit well with the experiments, but a lack of data was observed below 150 GPa. The phenomenon of local radiation of transparent window materials under high speed impact attracts special attention, because it contains the micro or meso dynamic information of materials and affects the optical transparency under impact pressure. It is also the basic premise for measuring the impact radiation temperature of opaque materials. The phenomenon occurs in the process of momentum and energy transformation at the micro level, so the thermal radiation signal must contain some dynamic characteristics of the crystal material (such as yield strength, etc.) and crystal structure changes (high pressure melting, solid–solid phase transformation, etc.). For example, Fat’yanov et al. [24,25] reported light transmission measurement using the duration of optical techniques to study the sapphire. The result showed the light transmission of sapphire depends on time, stress, and orientation. It was suggested that shear strength decreases in different directions because of the micro-structural damage under shock loading. Bordzilovskii et al. [26,27] measured the brightness temperature of shock-compressed epoxy resin and water using a pyrometric method. They found the phase-transition is not apparent in the pressure-temperature of epoxy resin under shock. A new phenomenon appears for water temperature at a reflected-wave pressure of 79 GPa, which is much lower than the single shock. In this work, multi-spectral measurement technology based on an eight-channel radiation pyrometer is used to obtain the light radiation energy of materials under impact compression. This method has the advantages of high sensitivity, wide measurement range, and good accuracy.

2. Experiment

2.1. The Experimental Principle

Most of the transparent window materials have good transparency at normal temperature and pressure, but will lose transparency under shock compression. The compressed materials under high temperature in front of the shock wave tend to glow strongly and carry temperature information. In the design of shock wave measurement experiments, the thickness of the material sample determines that the time for shock wave temperature measurement is on a small order of magnitude, which requires that the response speed of the experimental test system be very fast, such as signal detection, data transmission, and recording in tens of nanoseconds or even several nanoseconds. According to this requirement, the shock wave temperature measurement that is widely used at present is multi-spectral measurement technology using a radiation pyrometer [23,24,25,26,27]. The radiation pyrometer is designed according to the functional relationship between radiation energy and temperature, which belongs to a lens-focused temperature sensor. The radiation temperature sensor focuses the radiation energy of the measured object through a lens on the thermal sensitive element, which converts the radiation energy into electrical parameters. This article uses a new eight-channel optical fiber pyrometer to measure spectrum intensity, in which the center of the filter wavelength values determines the wavelength of each channel that will be received. By measuring the radial brightness of the thermal shock compression layer, the corresponding temperature can be calculated with the Planck radiation law. The medium of transparent material in front of the shock wave array is transparent, and the light radiation emitted by the medium after the shock wave can be detected by a photoelectric probe through the wavefront medium. In this paper, the optical fiber is directly introduced into the radiation intensity of the compression layer, and the luminous intensity is photoelectrically converted by a pyrometer to obtain spectral information, which is recorded by an oscilloscope.

2.2. Design and Optimization of Optical Testing System

The shock-radiation properties of initially transparent materials are studied by a multichannel radiation pyrometer; as a result of measurements, the radiation intensity of the compressed layer is obtained directly through the fiber. However, in the actual experiment, it is found that if the flying plate is used to directly impact the transparent sample, there will still be thin gas residue in front of the flying plate. The strong radiation will be generated at the moment of the collision between the flying plate and the sample, which will cause errors in measuring the true radiation of transparent materials under impact compression. We should aim to avoid the strong interference signal caused by the direct collision between the flyer and the transparent window material. In Figure 1, the shock wave passes through the metal substrate into the window. However, the introduction of the metal substrate must take into account the gap problem. The effect of stray light is eliminated by controlling the interface contact between the substrate and window. To deduct the interface luminous contribution with the help of a physical model, the real radiation spectral characteristics of the transparent window can finally be obtained. Therefore, the following factors will be considered in the assembly process of the sample target: (1) The opaque material with relatively weak impact radiation is selected as the substrate. (2) The surface of the contact between the substrate and the transparent window is precisely polished to put forward higher requirements for the flatness and finish of the surface. (3) The air gap is eliminated at the contact interface with a reasonable pre-compaction scheme. (4) The size of the fly plate, base plate, and sapphire are optimized to avoid the influence of lateral release waves and overtaking release waves on radiation measurement. Figure 1 shows a schematic diagram of a measurement platform for the radiation characteristics of the metal–window interface under impact compression. The flyer is launched by the two-stage light gas gun and impact with the target plane substrate. The shock wave is generated and compressed on the metal substrate, and the shock wave is transmitted to the transparent window. The optical fiber bundle on top of the transparent material will record the luminescence effect generated by the interface during the shock wave compression process, which will be recorded by the multi-channel radiation pyrometer and finally imported into the computer.

3. Experimental Results and Discussion

3.1. Spectral Signal Measurement of Sapphire

In order to obtain the shock radiation characteristics of sapphire, it is necessary to achieve precise calibration of the pyrometer according to the radiance to obtain the emissivity measurement ability in the radiation model. As a result, the changing process of the signal source with time is obtained. In the experiment of measuring spectral radiation intensity with the pyrometer used in this paper, Figure 2 shows the scheme of the temperature calibration of the optical pyrometer. In order to obtain the response of the pyrometer to the known radiation energy of each channel, the WBr lamp with known energy is selected for field calibration. Based on this, when the optical fiber leads the optical signal for quantitative measurement, it is necessary to ensure that the geometrical shape of the optical fiber head during actual measurement is exactly the same as that during calibration. It is necessary to calibrate the original optical path and establish accurate alignment between the optical fiber head and the standard lamp. In the research scheme of this paper, the optical fiber is fixed on the sample bracket, and then the bracket and the gun barrel are adjusted. Finally, the standard lamp is moved to the front position for calibration. The sample is then exposed to the holder for positioning in order to determine good stability and reliability of the testing device.
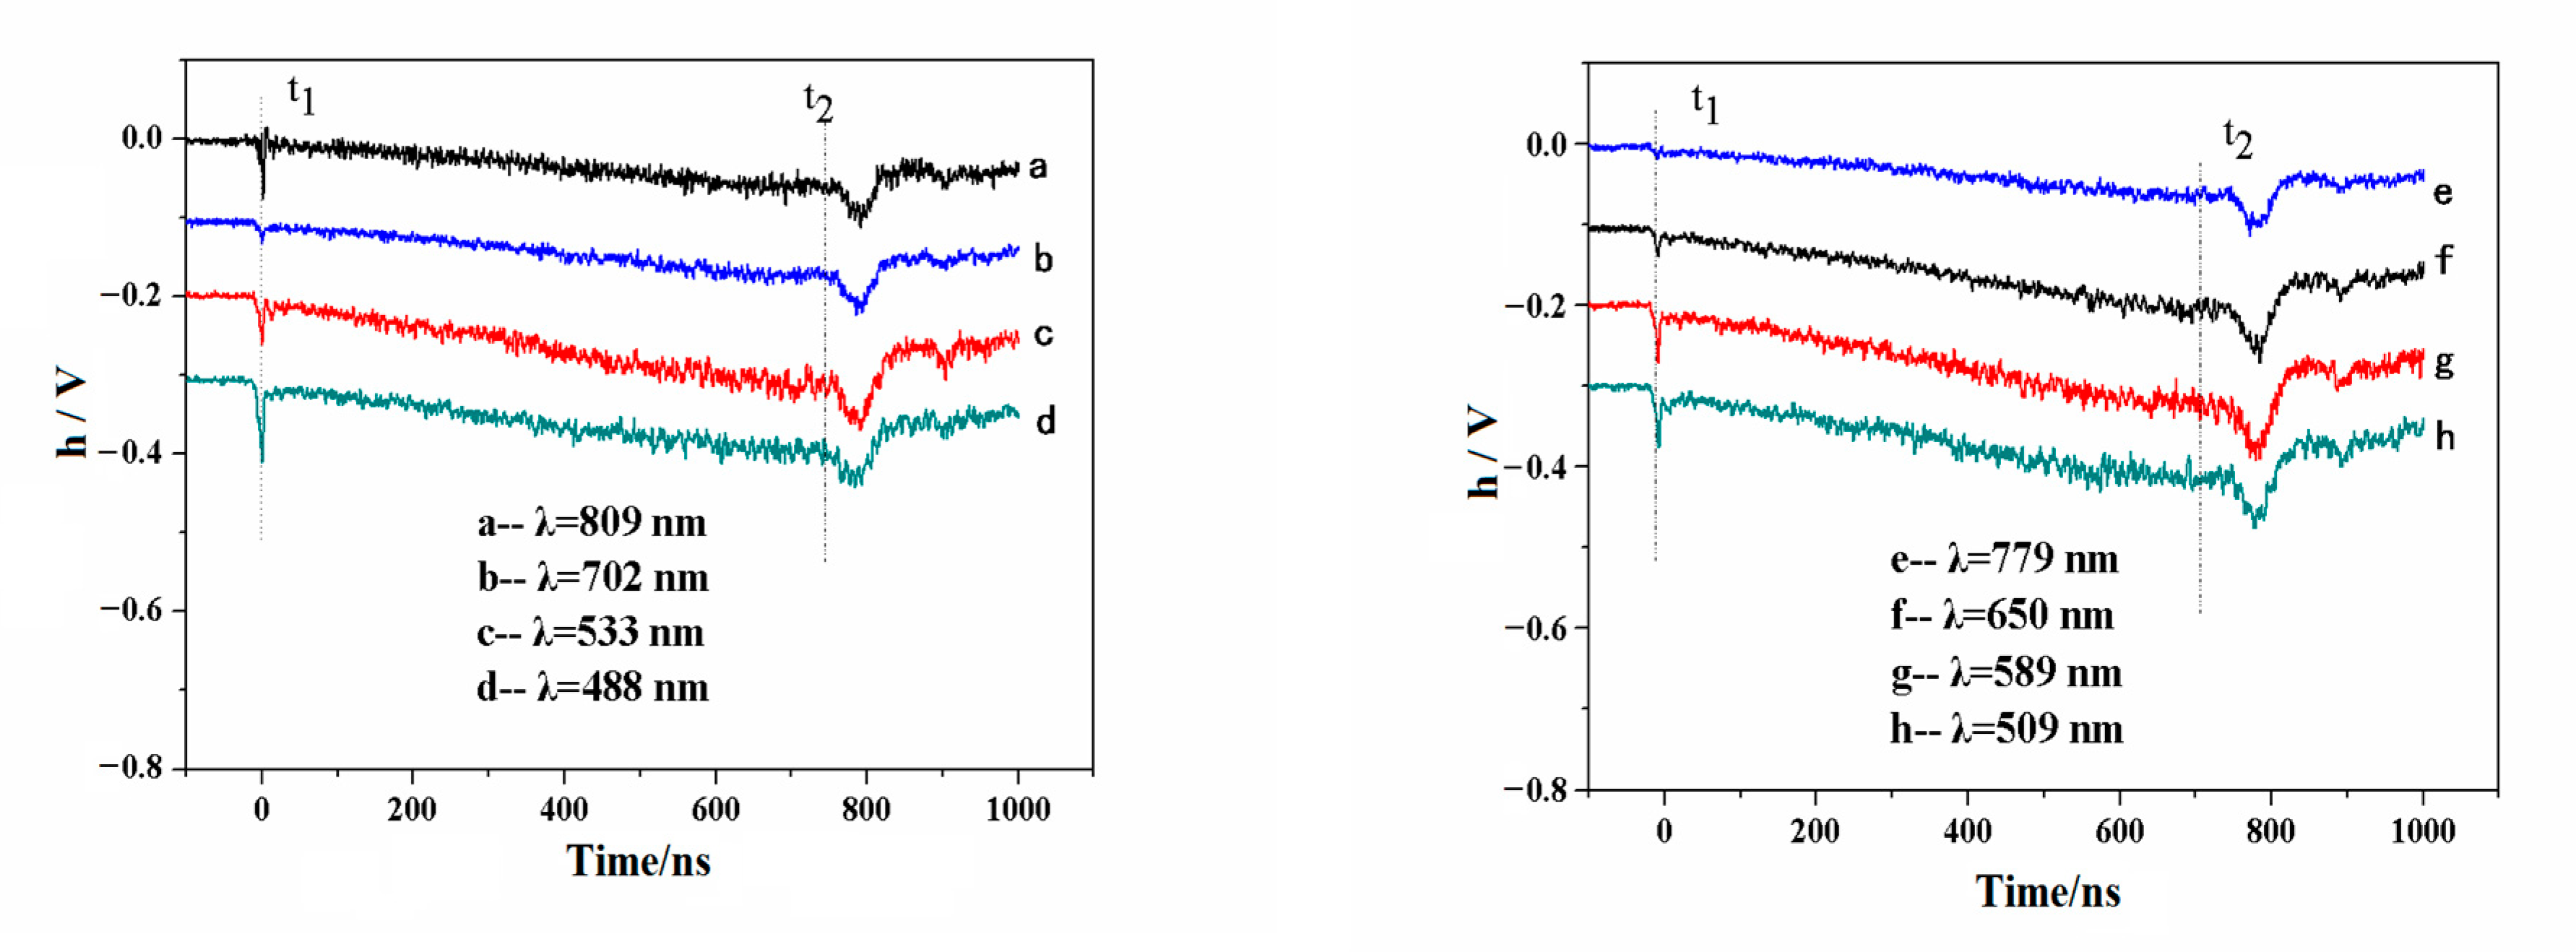
In this paper, sapphire is used as the shock radiation test sample. Sapphire has excellent optical transparency and mechanical strength under normal conditions. It is one of the important window materials for shock wave experiments [18,19,20,21,22,23]. In the experiment, an 8-channel radiation pyrometer was used to collect the radiation after impact, and the luminescence information was collected by the optical fiber bundle and then recorded by an oscilloscope through different wavelength channels of the pyrometer. Figure 3 shows the typical luminescent radiation signals recorded by an oscilloscope in 8 different wavelength channels. In this work, the c-cut sapphire was a 24 mm diameter disk with a thickness of 8 mm. The copper base plate was a 40 mm diameter disk with a thickness of 2 mm. The copper flyer was accelerated by a 25 mm bore light-gas gun. The flyer was 22 mm diameter disk with a thickness of 2 mm. The 1.72 km/s velocity of the flyer determined a shock pressures in the sapphire of 36.5 GPa, which was calculated with an impedance matching method [28]. According to the assembly of the experimental target and the characteristics of shock wave propagation, a one-dimensional plane shock wave is generated by the collision between the high-speed flyer and the metal substrate. After the shock wave propagates to the metal, a small radiation spike appears at the interface. When a shock wave passes through the boundary between the metal and the sapphire sample, a thin high-entropy layer of matter is formed at this boundary, heated more strongly than the rest of the matter behind the shock wave front [29]. After the spike, it is assumed that the effect of radiative heat transfer at the boundary, with the radiation dropping rapidly after t1. However, in a few nanoseconds, the radiation signal of each channel increases linearly with time. This indicates that transparent materials generate radiation under shock wave compression, and the radiation intensity increases linearly with the increase of compression thickness.
When the shock wave is transmitted to t2, the radiation information shows irregular transformation characteristics. According to the propagation speed of the shock wave in the transparent window, it can be inferred that the interface pressure is unloaded after the shock wave reaches the window at this moment, and the radiation recorded in the subsequent time may come from other stray light information in space. Accordingly, we believe that time from t1 to t2 represents the luminous radiation information of sapphire under shock wave compression.

3.2. Analysis of Luminescent Signal

According to the experimental principle of impact luminescence, the pyrometer signal obtained in the experiment is an optical signal radiated by the material through a photoelectric conversion sensor. When the sapphire is impacted into the high temperature and high pressure state and is in thermodynamic equilibrium, the emission signal is received by the pyrometer, and the radiation temperature value is obtained after fitting the radiation physical model. Specific analysis is as follows.
The value of spectral radiation intensity Ipl (λ, T) corresponding to a specific temperature T in Kirchhoff’s radiation law can be given by the Planck formula as follows:
I pl ( λ , T ) = C 1   λ 5   [ exp ( C 2 / λ T ) 1 ] 1
where C1 and C2 are constants, λ is the wavelength, Ipl (λ, T) refers to the spectral radiation whit the black body at temperature T, ε is the emissivity of the gray body; the spectral radiation intensity of gray body Ipl (λ, T) is as follows:
I grey ( ε , λ , T ) = ε I pl ( λ , T )  
The multi-channel radiation pyrometer measures the emission spectrum. The test calibration before the experiment is the key to obtain the final radiation temperature and other physical parameters. Using techniques covered earlier in this paper, the central wavelength value of the filter determines the wavelength to be received by each channel, and the response coefficient to known radiation energy must be obtained before use. According to the signal of eight channels obtained by the oscilloscope through the filter and fitted according to Equation (1), the response coefficient of radiation energy needs to be calibrated at each experimental site. The WBr lamp with known energy is selected for calibration of the experimental test system. l0 represents the distance between the optical fiber and the standard lamp. The energy received by the optical fiber from the light source is as follows:
E c ( λ ) = N r ( λ ) η ( λ )
where η refers the geometric factor of optical energy transmission system, and Nr(λ) refers the optical radiance value of the tungsten lamp in the system; its value is shown in Table 1.
In the experiment, load resistance with a high resistance value is matched to solve the problem of increasing multiples of calibration amplitude. At this time, the output signal can be displayed by the oscilloscope as follows:
h c = E c R c
The energy received by the corresponding optical fiber is as follows:
E c = η ( λ ) · I c · w · s 0 = η ( λ ) · I c 2 π ( 1 c o s θ ) · s 0
where   I c is the radiant energy captured by optical fibers, w is angle of acceptance of the fiber probe, θ is the numerical aperture angle of the optical fiber, s0 refers to an efficient lighting area can be received by optical fiber. The matching resistance RL is selected, and the output amplitude is as follows:
h e = E e R L
When the R L is the matching impedance, the radiation intensity of sample can be obtained as follows:
I exp = h e h c R c N r ( λ ) R L 2 π ( 1 c o s θ )
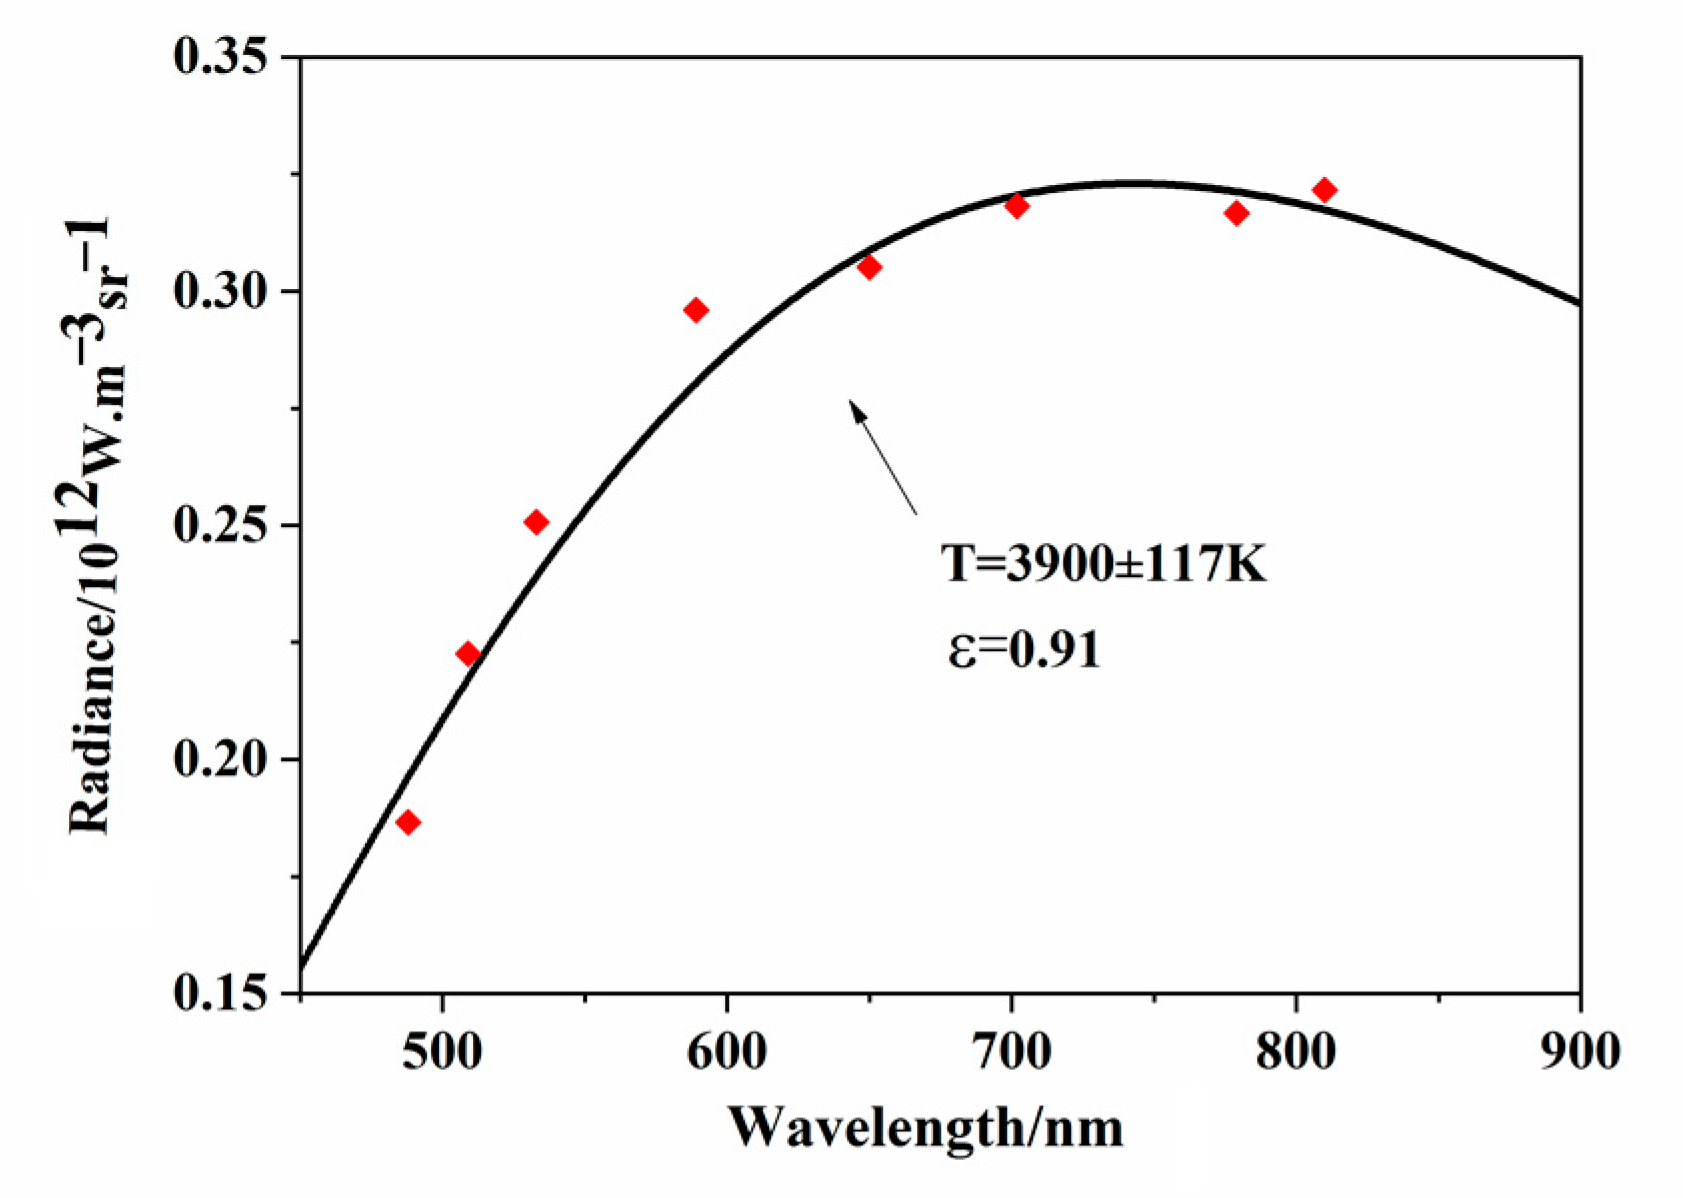
According to the calibration results of the impact experiment and the solution method of radiation intensity, the actual radiation intensity of the 8 channels of sapphire at the impact pressure of 36.5 GPa in Figure 3 is shown in Figure 4. In Figure 3, the vertical values are light radiation energies of the shock emission that passes through an optical transmission system to the pyrometer, which were recorded by an oscilloscope. In Figure 4, the vertical values are the actual energy spectrum radiation intensity of the sapphire, which were calibrated according to the light radiation energies (Figure 3), the light intensity calibrated by the pyrometer ( E c ( λ ) ), and the geometric parameters of the experimental setup ( l 0 , s 0 , θ , and others).

3.3. Inversion of Radiation Temperature

Planck’s law of radiation is applicable to the black body. In practice, the spectral radiance of object is closely related to spectral emissivity in addition to wavelength and temperature. If the temperature of the object is T , and the spectral emissivity is ε , then the actual luminance of the light radiation is as follows:
L aa ( λ , T ) = L bb ( λ , T ) ε = ε c 1 π λ 5 1 e x p ( c 2 λ T ) 1
According to the above equation, it can be seen that the luminance L aa and wavelength λ are the measured data of the experiment, while object temperature T and spectral emissivity ε are unknown. The spectral radiance Laa is usually measured by the shock radiation apparatus. When the luminance and wavelength of the spectral radiation are known, the spectral emissivity of the object becomes the only unknown factor in solving the temperature.
In the multi-channel radiation pyrometer, it is assumed that the number of channels is n; then, n channels can obtain n output signals at different wavelengths. When the real temperature is T, the output signal value can be measured in the channel i, and the signal value is Vi at this time, as shown in Equation (9):
V i = A λ i ε ( λ i , T ) λ i 5 e x p ( c 2 λ i T ) ( i = 0 , 1 , 2 , 3 , , n )
where ε ( λ i , T ) is the target spectral emissivity at the true temperature T; A λ i is verification constant.
By measuring the radiation energy at a certain wavelength, the same instrument measures the radiation energy at a certain temperature in the black body. If the measured values of the two are the same, the temperature that can be obtained from the definition of brightness temperature is as follows:
V i = A λ i λ i 5 e x p ( c 2 λ i T ) [ ε ( λ i , T ) = 1 ]
In a blackbody, the emissivity of the object material is approximately 1. If the temperature at this time is T0, then the output value measured in the same wavelength channel V i is as follows:
V i = A λ i λ i 5 e x p ( c 2 λ i T 0 ) [ ε ( λ i , T ) = 1 ]  
According to Equations (10) and (11), the following can be obtained:
V i V i = e x p ( c 2 / λ i T ) / e x p ( c 2 / λ i T 0 )
After the formula is deformed, we obtain the following:
1 T 0 1 T = λ i c 2 l n ( V i V i )  
Among the five parameters in the above formula, wavelength, black body temperature, the black body output signal, and the actual output signal can all be obtained by experimental measurement. The radiation brightness temperature of the object is an unknown quantity, and the value of this parameter can be obtained by solving the equation. Similarly, there is a certain mathematical relationship between radiant brightness temperature and real temperature:
1 T 1 T = λ i c 2 l n ε ( λ i , T )
In the formula, wavelength λ   and brightness temperature T   are measured data, while real temperature T and object emissivity ε   are unknown parameters. The multi-channel characteristic wavelength λ   can be obtained directly from the instrument calibration process. The radiation luminance temperature T   can be calculated. There are only two unknown parameters, true temperature T   and emissivity ε . Since the true temperature of the same object is measured experimentally, the true temperature of each channel in the ideal state is the same, so the formula can be obtained as follows:
i = 1 8 ( ( i = 1 8 T i ) / 8 T i ) 2 = 0
where, ( i = 1 8 T i ) / 8 is the mean value of the real temperature of each channel of the 8-channel radiation pyrometer. The difference is not equal to zero but is infinitely close to zero, and its value is the minimum value close to zero. Therefore, it can be transformed into an optimization solution problem, as shown below:
min f = i = 1 8 ( ( i = 1 8 T i ) / 8 T i ) 2
Substituting Equation (14) into the above equation, we obtain:
min f = i = 1 8 ( i = 1 8 ( 1 1 T + λ i c 2 l n ε ( λ i , T ) ) 8 1 1 T + λ i c 2 l n ε ( λ i , T ) ) 2
The Newton-Raphson method is adopted to solve the above equation [30] in this paper. Through computer iteration, Figure 5 shows the impact radiation temperature of sapphire obtained by the 8-channel radiation pyrometer in the experiment, and Figure 6 shows the fitting error between the experimental measured value and the standard Planck temperature spectrum. Considering the influence of side wave and chasing wave during the experiment, the shock wave should be most stable in the range of 300–500 ns when the sample is transmitted. When the shock wave enters the sample 300 ns, the fitting value of radiation temperature is 3900 K, and the emissivity is 0.91. The experimental fitting results show that the radiation temperature of sapphire does not change in the process of compression, but fluctuates in a small range. Compared with the physical model of transparent material impact radiation, this shows that the sapphire window is in a translucent state under the impact pressure, and the radiation belongs to the gray body radiation.

3.4. Radiation Temperature Analysis

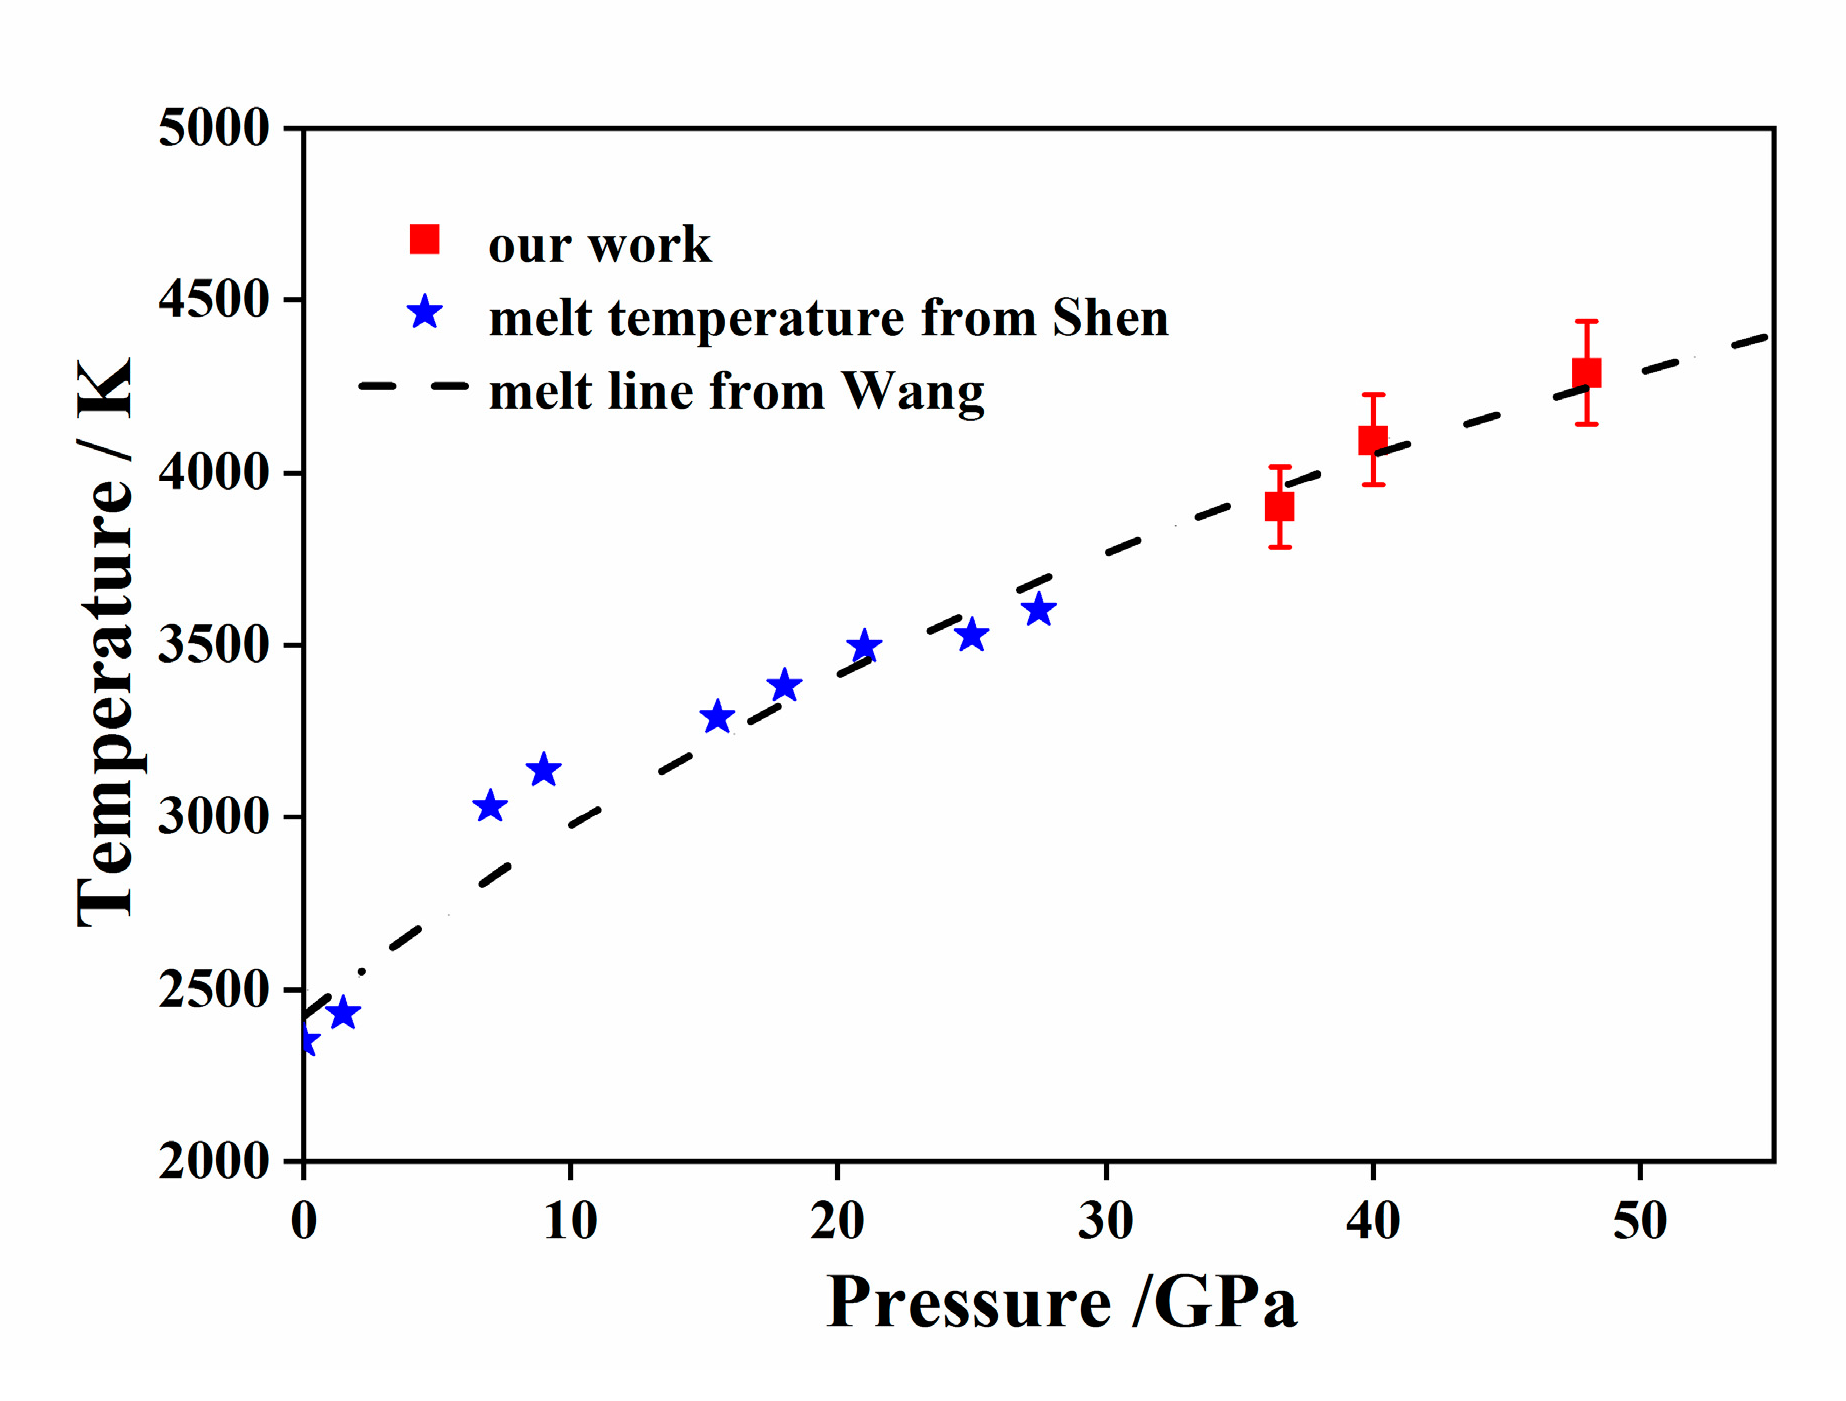
Table 2 shows the flyer velocity v, impact pressure of sample P, and fitting value of radiation temperature of pyrometer T. Each experiment uses the same standard lamp for uniform calibration. The fitting temperature of transient pyrometer T is compared with other research results, as shown in Figure 7.
In Figure 7, the radiation temperature values of sapphire in the 36–50 GPa compression region obtained in this paper are compared with other studies. The results include the melting temperature of static high-pressure sapphire reported by Shen [31] and the calculation results of high-pressure melting temperature of sapphire reported by Wang [19]. In the study of the impact radiation temperature of sapphire, Kondo and Hare conducted more systematic work. However, due to the imperfect experimental means, the radiation temperature of sapphire in the low-pressure region was abnormally high. Hare believed that the impact luminescence radiation of sapphire came from the adiabatic shear banding generated inside the material. In their opinion, the shear banding comes from plastic shear deformation, which is unstable in materials that thermally soften. There will be higher temperature in regions of shear flow. Most materials soften as the melting temperature is approached. A natural thermostat has source turn off (shear band temperature will decrease) and turn back (shear band temperature will increase), which tend to keep the shear band temperature near the melting temperature. Based on the multi-channel radiation pyrometer measurement setup, the radiation temperature and static pressure experiment and theoretical calculation results of the melting temperature are highly consistent through the optimization of the test system, in the absence of the phase transformation range compression for sapphire. The temperature is associated with the adiabatic shear band radiation model, which proves the sapphire physics mechanism of the impact of radiation.
Sapphire is a typical brittle glass material with a high HEL elastic limit; it is prone to dislocation slip and deformation twin defects under shock wave compression. The shock wave loaded by the gas gun will cause a severe deformation in the dislocation defect area and release the surrounding shear stress. In fact, plastic deformation occurs when the shear stress locally exceeds the elastic limit of the material. With the formation and movement of defects, many slip planes will appear along the direction of maximum shear stress. Because the shear strain near the slip plane is released, the area where the slip plane appears experiences drastic plastic deformation. Because the change area is very small, the transformation of plastic work into heat energy causes the local temperature to rise sharply. The local shear band will release a certain range of shear strain states, which can eliminate the driving force to form a new slip plane and inhibit the generation of new adiabatic shear bands nearby. Therefore, the sapphire impact adiabatic shear band is non-uniformly distributed in the local area of the material, which belongs to non-uniform thermal radiation luminescence.

4. Conclusions

The experimental measurement of shock wave temperature is an effective means to test the equation of state model, but there are still many problems in the measurement of the material shock temperature using the radiation method. It is very difficult to obtain the shock melting experiment of solid materials directly. In this paper, the multi-spectral measurement method based on the multi-channel radiation pyrometer is adopted. On the basis of optimizing the sample polishing process and target assembly process, the precision optical path calibration was carried out by using the light gas gun. The shock radiation information of typical transparent material sapphire is obtained. The radiation temperature is obtained by fitting the wavelength of eight channels. It is found that the shock radiation temperature during the loading process remains stable, which is a typical transport of radiation energy of translucent materials during compression. The results indicated that thermal radiation generated under impact loading only occurs in the local region. The shock radiation temperature is consistent with the melting temperature of sapphire measured by static high pressure and the theoretically calculated melting temperature, supporting the view that the impact loading forms an adiabatic shear band, and the shear band is in a molten state. Finally, the method and conclusion provide a new technical approach for measuring the high-pressure melting temperature of other transparent crystal materials.

Author Contributions

Conceptualization, N.Z. and D.L.; methodology, N.Z.; software, Z.G. and Y.L.; validation, Z.G. and P.W.; formal analysis, N.Z.; investigation, D.L.; resources, P.W. and F.L.; data curation, F.L.; writing—original draft preparation, Z.G.; writing—review and editing, D.L.; visualization, Z.G. and Y.L.; supervision, N.Z. and D.L.; project administration, Z.G.; funding acquisition, N.Z. and P.W. All authors have read and agreed to the published version of the manuscript.

Funding

This research was funded by National Natural Science Foundation of China: 12004292.

Institutional Review Board Statement

Not applicable.

Informed Consent Statement

Not applicable.

Data Availability Statement

Not applicable.

Acknowledgments

This work was supported by the Key Research Project of Shaanxi Province of China under Grant 2021KWZ-20, 2021GY-324, 2022GY-310 and the Natural Science Foundation of Shaanxi Provincial Department of Education 20JK0688.

Conflicts of Interest

The authors declare no conflict of interest.

References

  1. Capelle, G.A.; Mance, J.G.; Larson, E.D.; la Lone, B.M.; Stevens, G.D.; Turley, W.D.; Veeser, R.L. Simultaneous Raman and pyrometric temperature measurements in shock-wave-compressed toluene. J. Appl. Phys. 2019, 125, 225106. [Google Scholar] [CrossRef]
  2. Mao, H.; Chen, X.; Ding, Y.; Li, B.; Wang, L. Solids, Liquids, and Gases under High Pressure. Rev. Mod. Phys. 2018, 90, 015007. [Google Scholar] [CrossRef]
  3. Zel’dovich, Y.B.; Kormer, S.B.; Sinitsyn, M.V.; Kuryapin, A.I. Temperature and heat capacity of Plexiglas compressed by a shock wave. Dokl. Akad. Nauk. SSSR 1958, 122, 48–50. [Google Scholar]
  4. Kormer, S.B. Optical study of the characteristics of shock-compressed condensed dielectrics. Sov. Phys.—Uspekhi 1968, 11, 229–254. [Google Scholar] [CrossRef]
  5. Kondo, K.I.; Ahrens, T.J.; Sawaoka, A. Shock-induced Radiation Spectra of Fused Quartz. J. Appl. Phys. 1983, 54, 4382–4385. [Google Scholar] [CrossRef]
  6. Schmitt, D.R.; Ahrens, T.J. Temperatures of Shock-induced Shear Instabilities and Their Relationship to Fusion Curves. Geophys. Res. Lett. 2013, 10, 1077–1080. [Google Scholar] [CrossRef]
  7. Svendsen, B.; Ahrens, T.J. Shock-Induced Temperatures of MgO. Geophys. J. R. Astron. Soc. 1987, 91, 667–691. [Google Scholar] [CrossRef]
  8. Kondo, K.I. Window Problem and Complementary Method for Shock-temperature Measurements of Iron. AIP Conf. Proc. 1994, 309, 1555–1558. [Google Scholar]
  9. Hare, D.E.; Holmes, N.C.; Webb, D.J. Shock-wave-induced Optical Emission from Sapphire in th Stress Range 12 to 45 GPa: Images and Spectra. Phys. Rev. B 2002, 6, 81–88. [Google Scholar]
  10. Hare, D.E.; Webb, D.J.; Lee, S.H.; Holmes1, N.C. Optical Extinction of Sapphire Shock-Loaded to 250-260GPa. AIP Conf. Proc. 2002, 1231, 1231–1234. [Google Scholar]
  11. Brooks, W.P. Shock-induced luminescence in quartz. J. Appl. Phys. 1965, 36, 2788–2790. [Google Scholar] [CrossRef]
  12. Zel’dovich, Y.B. EMF produced by a shockwave moving in a dielectric. Sov. Phys. JETP 1968, 26, 159–162. [Google Scholar]
  13. Wang, Z.W.; Mao, H.H.; Saxena, S.K. The Melting of Corundum under High Pressure Conditions. J. Alloys Compd. 2000, 299, 287–291. [Google Scholar] [CrossRef]
  14. Liu, H.; Tse, J.S.; Nellis, W.J. The Electrical Conductivity of Al2O3 under Shock Compression. Sci. Rep. 2015, 5, 12823. [Google Scholar] [CrossRef] [PubMed]
  15. Liu, Q.C.; Zhou, X.M. Time-Resolved Light Emission of A, C and R-cut Sapphires Shock-compressed to 65 GPa. J. Appl. Phys. 2018, 123, 13–59. [Google Scholar] [CrossRef]
  16. Cao, X.; Wang, Y.; Li, X.; Xu, L.; Liu, L.; Yu, Y.; Qin, R.; Zhu, W.; Tang, S.; He, L.; et al. Refractive Index and Phase Transformation of Sapphire under Shock Pressures up to 210GPa. J. Appl. Phys. 2017, 121, 115903. [Google Scholar] [CrossRef]
  17. Cao, X.; Li, J.; Li, J.; Li, X.; Xu, L.; Wang, Y.; Zhu, W.; Meng, C.; Zhou, X. Refractive Index of R-cut Sapphire under Shock Pressure Range 5 to 65 GPa. J. Appl. Phys. 2014, 116, 093516. [Google Scholar] [CrossRef]
  18. Fat’yanov, O.V.; Webb, R.L.; Gupta, Y.M. Optical transmission through inelastically deformed shocked sapphire: Stress and crystal orientation effects. J. Appl. Phys. 2005, 97, 123529. [Google Scholar] [CrossRef]
  19. Hao, G.Y.; Liu, F.S.; Zhang, D.Y.; Zhang, M.J. Optical Emission of Directly Contacted Copper/Sapphire Interface under Shock Compression of Megabar. Appl. Phys. Lett. 2007, 90, 181–402. [Google Scholar] [CrossRef]
  20. Zhang, D.Y.; Liu, F.S.; Hao, G.Y.; Sun, Y.H. Shock Induced Emission from Sapphire in High-Pressure Phase of Rh2O3 (II) Structure. Chin. Phys. Lett. 2007, 24, 23–41. [Google Scholar]
  21. Zhang, N.; Liu, F.; Wang, W.; Sun, Y.; Liu, Q.; Peng, X.; Chen, J. Shock-Induced Optical Emission and High-pressure Phase Transformation of Sapphire. Phys. B Phys. Condens. Matter 2013, 429, 90–94. [Google Scholar] [CrossRef]
  22. Zhang, N.C.; Wang, P.; Hua, X.; Liu, F. Optical Radiation Characteristics and Structural Phase Transition of Sapphire under Megabar Pressure. Acta Opt. Sin. 2019, 39, 450–456. [Google Scholar]
  23. Ostrik, A.; Nikolaev, D. Shock induced melting of sapphire. J. Phys. Conf. Ser. 2022, 2154, 012010. [Google Scholar] [CrossRef]
  24. Fat’yanov, O.V.; Asimow, P.D. Contributed Review: Absolute spectral radiance calibration of fiber-optic shock-temperature pyrometers using a coiled-coil irradiance standard lamp. Rev. Sci. Instrum. 2015, 86, 101502. [Google Scholar] [CrossRef]
  25. Fat’yanov, O.V.; Asimow, P.D.; Ahrens, T.J. Thermodynamically complete equation of state of MgO from true radiative shock temperature measurements on samples preheated to 1850 K. Phys. Rev. B 2018, 97, 024106. [Google Scholar] [CrossRef]
  26. Bordzilovskii, S.A.; Karakhanov, S.M.; Khishchenko, K.V. Measurement of the brightness temperature of shock-compressed epoxy resin. Combust. Explos. Shock. Waves 2013, 49, 121–124. [Google Scholar] [CrossRef]
  27. Bordzilovskii, S.A.; Karakhanov, S.M.; Khishchenko, K.V. Brightness temperature of water compressed by a double shock to pressures of 60–79 GPa. Shock. Waves 2020, 30, 505–511. [Google Scholar] [CrossRef]
  28. Jing, F.Q. Introduction to Experimental Equation of State; Science Press Beijing: Beijing, China, 1999. [Google Scholar]
  29. Khishchenko, K.V.; Mayer, A.E. High- and low-entropy layers in solids behind shock and ramp compression waves. Int. J. Mech. Sci. 2021, 189, 105971. [Google Scholar] [CrossRef]
  30. Bruck, H.A.; Mcneill, S.R.; Sutton, M.A.; Peters, W.H., III. Digital Image Correlation Using Newton-Raphson Method of Partial Differential Correction. Exp. Mech. 1989, 29, 261–267. [Google Scholar] [CrossRef]
  31. Shen, G.; Lazor, P. Melting of Minerals under the Lower Mantle Conditions: Experimental result. J. Geophys. Res. 1995, 100, 17699–17713. [Google Scholar] [CrossRef]
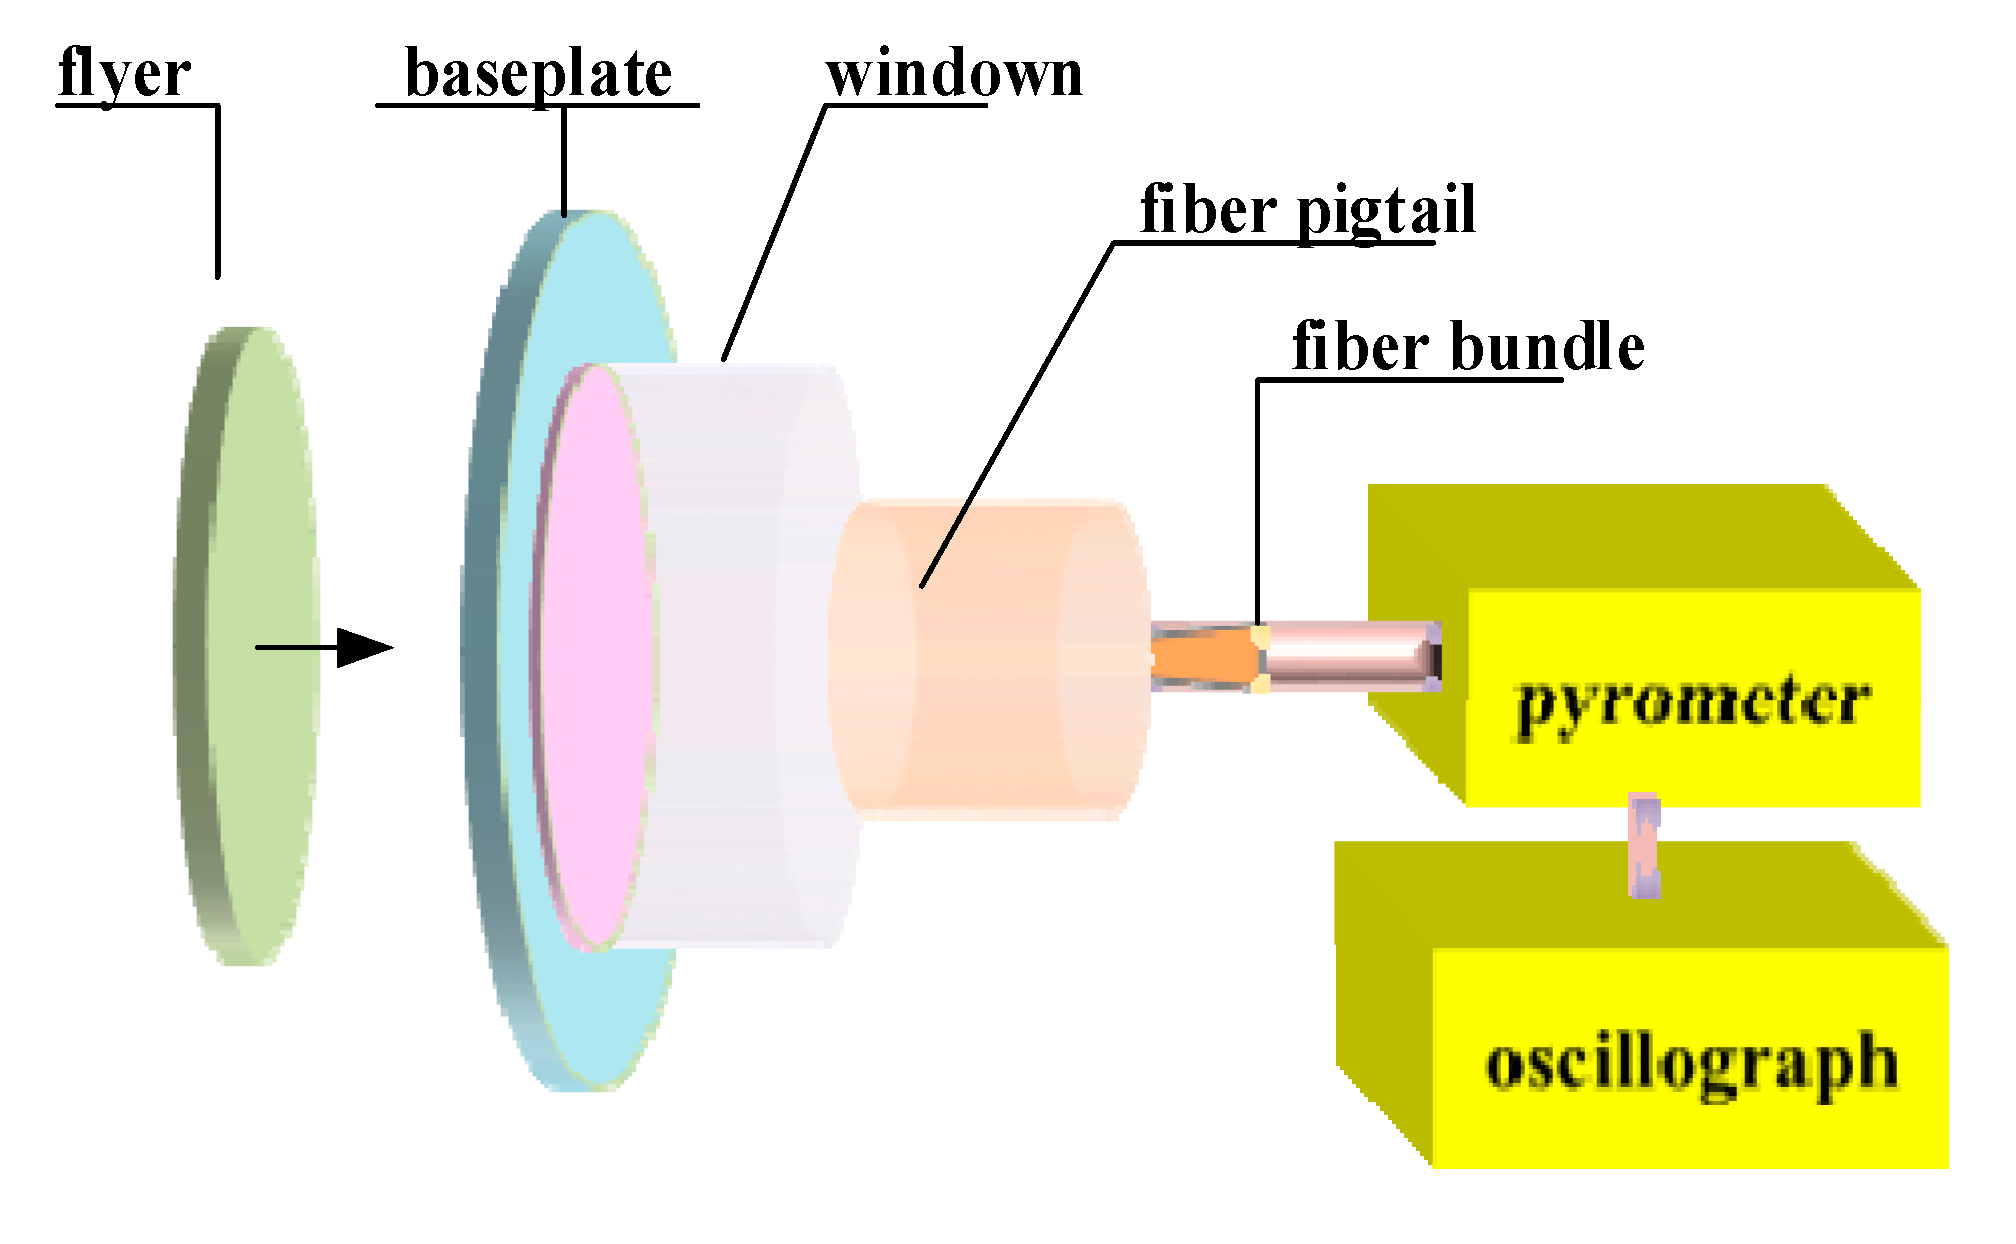
Figure 1. Schematic of light emission measurement system.
Crystals 12 01364 g001
Figure 2. The calibration system of optical measurement.
Crystals 12 01364 g002
Figure 3. Radiation intensity curves measured from the pyrometer (along the vertical axis, h is the magnitude of the signal from the oscilloscope, indicated in volts).
Crystals 12 01364 g003
Figure 4. Radiation intensity curve of sapphire.
Crystals 12 01364 g004
Figure 5. The fitting temperature.
Crystals 12 01364 g005
Figure 6. The fitting temperature and fitting error.
Crystals 12 01364 g006
Figure 7. Comparison between radiation temperature and high pressure melt line.
Crystals 12 01364 g007
Table 1. The standard calibration value of the bromine tungsten lamp Nr(λ).
λ (nm)809779702650589533509488
Nr
(μW/(cm−2.nm))
1.581.551.401.230.980.710.590.49
Table 2. Fitting results of experimental shock pressure and temperature of sapphire.
Exp No.Flyer
Material
Base Plate
Material
Flyer Size
Diameter∙Thickness
(mm)
Base Plate Size
Diameter∙Thickness
(mm)
c-Sapphire
Diameter∙Thickness
(mm)
Flyer
Velocity
(km/s)
Shock
Pressure
(GPa)
Radiation Temperature
(K)
No. 1coppercopper23∙2.040∙2.024∙8.01.7236.53900 ± 117
No. 2coppercopper23∙1.840∙2.124∙8.01.9640.24095 ± 131
No. 3coppercopper23∙1.840∙1.824∙8.02.2248.34290 ± 150
Publisher’s Note: MDPI stays neutral with regard to jurisdictional claims in published maps and institutional affiliations.