Article

Investigation of Fatigue Crack Growth in TA2 Cruciform Specimen with an Inclined Crack, Considering Stress Ratio and Biaxial Load Ratio

School of Mechanical and Power Engineering, Nanjing Tech University, Nanjing 211816, China
*
Author to whom correspondence should be addressed.
Crystals 2022, 12(11), 1530; https://doi.org/10.3390/cryst12111530
Submission received: 29 September 2022 / Revised: 20 October 2022 / Accepted: 25 October 2022 / Published: 27 October 2022
(This article belongs to the Special Issue Fatigue-Challenge of Structural Integrity)

Abstract

:
The biaxial fatigue crack growth behavior of commercial pure titanium TA2 of cruciform specimens with different crack inclination angles (β = 90°, 60°, 45°) under various biaxial load ratios (λ = 0, 0.5, 1) and different stress ratios (R = 0, 0.1, 0.3) is studied by an IPBF-5000 biaxial testing machine. The test results prove that the maximum tangential stress criterion is suitable for predicting the initiation angle of uniaxial and biaxial mixed-mode I–II fatigue cracks. The fatigue crack growth rate of a cruciform specimen with mode I and mixed-mode I–II cracks decreases with the increase of biaxial load ratio and increases with the stress ratio. The Walker model and Kujawski model have better compression effects on fatigue crack growth data than the Paris model.

1. Introduction

Pressure equipment is often subjected to complex alternating loads whilst in service. Due to various loading conditions, the pressurized equipment is more affected by multiaxial fatigue loads, which may cause serious accidents. Thus, the study of behavior of biaxial mixed-mode I–II crack growth is important [1].
Many scholars have investigated the influence of stress ratio R on fatigue crack growth rate (FCGR) under uniaxial load. Kalnaus [2] used circular compact tensile specimens of 304L stainless steel to explore the influence of R during fatigue crack growth (FCG). The results indicate that the higher the stress ratio R, the faster the FCGR of 304L stainless steel. Ma [3] used compact tension specimens made from 5083 aluminum alloy to conduct a FCG experiment under four stress ratios. It was found that the FCGR increases with R. Su [4] studied FCG behavior under normal temperature, using TA2. It was determined that the FCGR increases with R in the stable growth stage. Similarly, when Lu [5] studied the FCG behavior of TA2 base metal and welded joint, it was found that the FCGR increases with R. Wang [6] investigated the FCG behavior of 16MnR, where it was discovered that FCGR increases with R during the initial stage of crack growth, and that R has no significant influence on the FCGR during the stable crack growth stage. Hu [7] studied the FCG behavior of Inconel 625 and found that R affects FCG significantly at the beginning and stable growth stages, and FCG increases with R. Based on the classical Paris formula, Forman [8] considered the stress ratio effect and proposed the modified formula of FCGR, which can be applied to analyze FCG behavior more accurately. Rahman [9] used AISI-304 steel to consider the influence of R on the uniaxial mixed-mode I–II crack. It was determined that the increase of R results in the decrease of FCGR. Zhang [10] discussed the effect of negative stress ratio on the mixed-mode I–II FCGR of CP-Ti TA2 and found that no matter what the degree of initial crack inclination β, the FCGR decreases when the stress ratio increases.
Some scholars have studied the law of biaxial FCG. Liu and Dittmer [11] discussed the FCG of aluminum alloy under various biaxial load ratios λ. They concluded that the propagation direction and FCGR are controlled by a greater biaxial stress component, and the effect of stress consistent with the crack direction on the FCGR can be negligible. However, Hopper and Miller [12] thought that stress consistent with the crack direction will reduce the FCGR under biaxial mode I FCG. According to the biaxial mode I FCG of 304 stainless steel, analyzed by Yuuki [13], only the influence of λ on FCGR can be ignored at low stress levels, while at high stress levels the FCGR at λ = 0 and λ = 1 is obviously lower than that at λ = −1. Sunder [14] considered that the FCGR is very sensitive to biaxial loading when the load amplitude is invariant. The biaxial fatigue law of 7075-T651, proposed by Lee [15], shows that the FCG life of mixed-mode I–II fatigue cracks increases with λ under in-phase loading, that is, the FCGR increases with the decrease of λ, but the FCG life of mixed-mode I–II fatigue cracks under out-of-phase loading does not change much with the biaxial load ratio. Yamashita [16] investigated the biaxial mode I FCG of 316 austenitic stainless steel. The results show that at higher stress, the FCGR at λ = −1 is faster than that at λ = 0 and 1, and the FCGR is slowest at λ = 1; while at lower stress levels, the FCGR of the aforementioned are close. Shlyannikov [17] explored FCG behavior of 34XH3MA steel and found that the FCGR decreases with the increase of λ in pure mode I FCG. Anderson and Garrett [18] concluded that the higher the λ, the lower the FCGR of biaxial mode I crack propagation of low-carbon steel. Liu [19] also drew the conclusion that the decrease of λ will lead to the increase of FCGR for the mode I–II FCG of CP-Ti TA2. Misak [20] studied the biaxial mode I–II FCG of 7075-T6 and found that the FCGR is almost the same under equiaxial and uniaxial loading at the stable FCG stage. During the initial stage of FCG at λ = 1.5, the driving force of crack propagation at the same FCGR is minimum. Misak [21] studied the biaxial mode I and mixed-mode I–II FCG of 2024-T3, and it was found that uniaxial and biaxial FCGR is the same in the early stage of FCG. When entering the stable crack propagation stage, the FCGR is faster at λ = 1.5 under the same crack growth driving force. The FCGR is close to that at λ = 0, 0.5 and 1. Shewchuk [22] has studied the biaxial FCG of 2024-T351 under bending load, but mentioned that the higher the biaxial load ratio, the greater the FCGR.
The above shows that these researchers have established a good foundation on biaxial FCG. For the influence of λ on FCG behavior, different scholars have drawn different conclusions for different materials. Misak [20,21] obtained that biaxial load ratio at λ = 0 and 1 has no significant effect on mode I and mode I–II FCG behavior. However, when the biaxial FCG occurs in reference [15,16,17,18,19], the FCGR is obviously faster at λ = 0 than at λ = 1. In addition, Yamashita [16] and Shlyannikov [17] found that the difference in biaxial mode I FCGR is obvious in the early stage, but it is close in the later stage. Liu [19] found that the difference of biaxial mixed-mode I–II FCGR is obvious during the whole FCG. However, the biaxial FCGR studied by Shewchuk [22] is fastest at λ = 1, and the difference of biaxial mode I FCGR is obvious during the whole FCG. Thus, it can be seen that the conclusions are often different according to different experiments. The effect of R on mode I and I–II FCG under uniaxial loading has been fully studied. However, the study of stress ratio on mixed-mode I–II FCG behavior of CP-Ti under biaxial loading is not clear at present. In the present paper, cruciform specimens (CSs) of CP-Ti TA2 are used to analyze the FCGR of different stress ratios R, biaxial load ratios λ and crack inclination angles β, based on the results of mixed-mode I–II FCG tests under biaxial load. The effect of stress intensity factor amplitude on FCGR under different conditions is also analyzed, which provides a basis for defect assessment of CP-Ti pressurized structures.

2. Biaxial Fatigue Crack Growth Experiments

2.1. CP-Ti Properties

CS is made from CP-Ti, with elastic modulus E = 107.043 GPa, yield strength Rel = 404 MPa and tensile strength Rm = 496 MPa. Its chemical composition is Ti (99.816%), Fe (0.061%), C (0.028%), N (0.006%), H (0.002%) and O (0.087%).

2.2. Cruciform Specimen and Test Method

The IPBF-5000 series testing machine of Tianjin Kair Measurement and control company (Tianjin, China) and specimens used in this paper are shown in Figure 1 [23]. The loading frequency is 0.2 Hz. Waveform is sinusoidal. The peak load of Y axis should be constant at 270 MPa. The load of X axis can be changed with different biaxial load ratios λ and the crack inclination angles β = 90°, 60° and 45°, respectively. A crack with a length of about 0.2 mm is prefabricated along the initial direction of crack before FCGR test. The maximum stress intensity factor of the pre-crack is lower than that induced by the maximum load in the following FCG test [1], which can avoid the effect of the plastic zone on the FCG during the prefabrication stage. The variation of FCG is studied when β are 90°, 60° and 45°, respectively; the biaxial load ratios λ are 0, 0.5, 1; and the stress ratios R (R = Pmin/Pmax) are 0, 0.1 and 0.3. The test scheme is shown in Table 1. The crack is measured by VHX-950F digital microscope system. The measurement precision is 0.01 mm. A set of data is recorded every 0.1 mm. After the experiment, the true length of the crack is calculated whilst considering the crack propagation angle.
The overall size of the specimen is 100 × 100 (mm). The thickness is 1.2 mm. The center thickness is thinned to 0.4 mm, and the central observation area is a 15 × 15 mm2 The diameter of the hole in the observation area is about 0.5 mm, and the length of pre-crack of 3.2 mm is obtained by wire cutting. Before the experiment, the crack propagation zone of the specimen should be polished with sandpaper, from 400 to 2000 grit, in order to make it as smooth as possible, improve the surface quality, reduce the influence of surface roughness on FCG and to measure crack length easily.

3. Crack Initiation Angle θ0

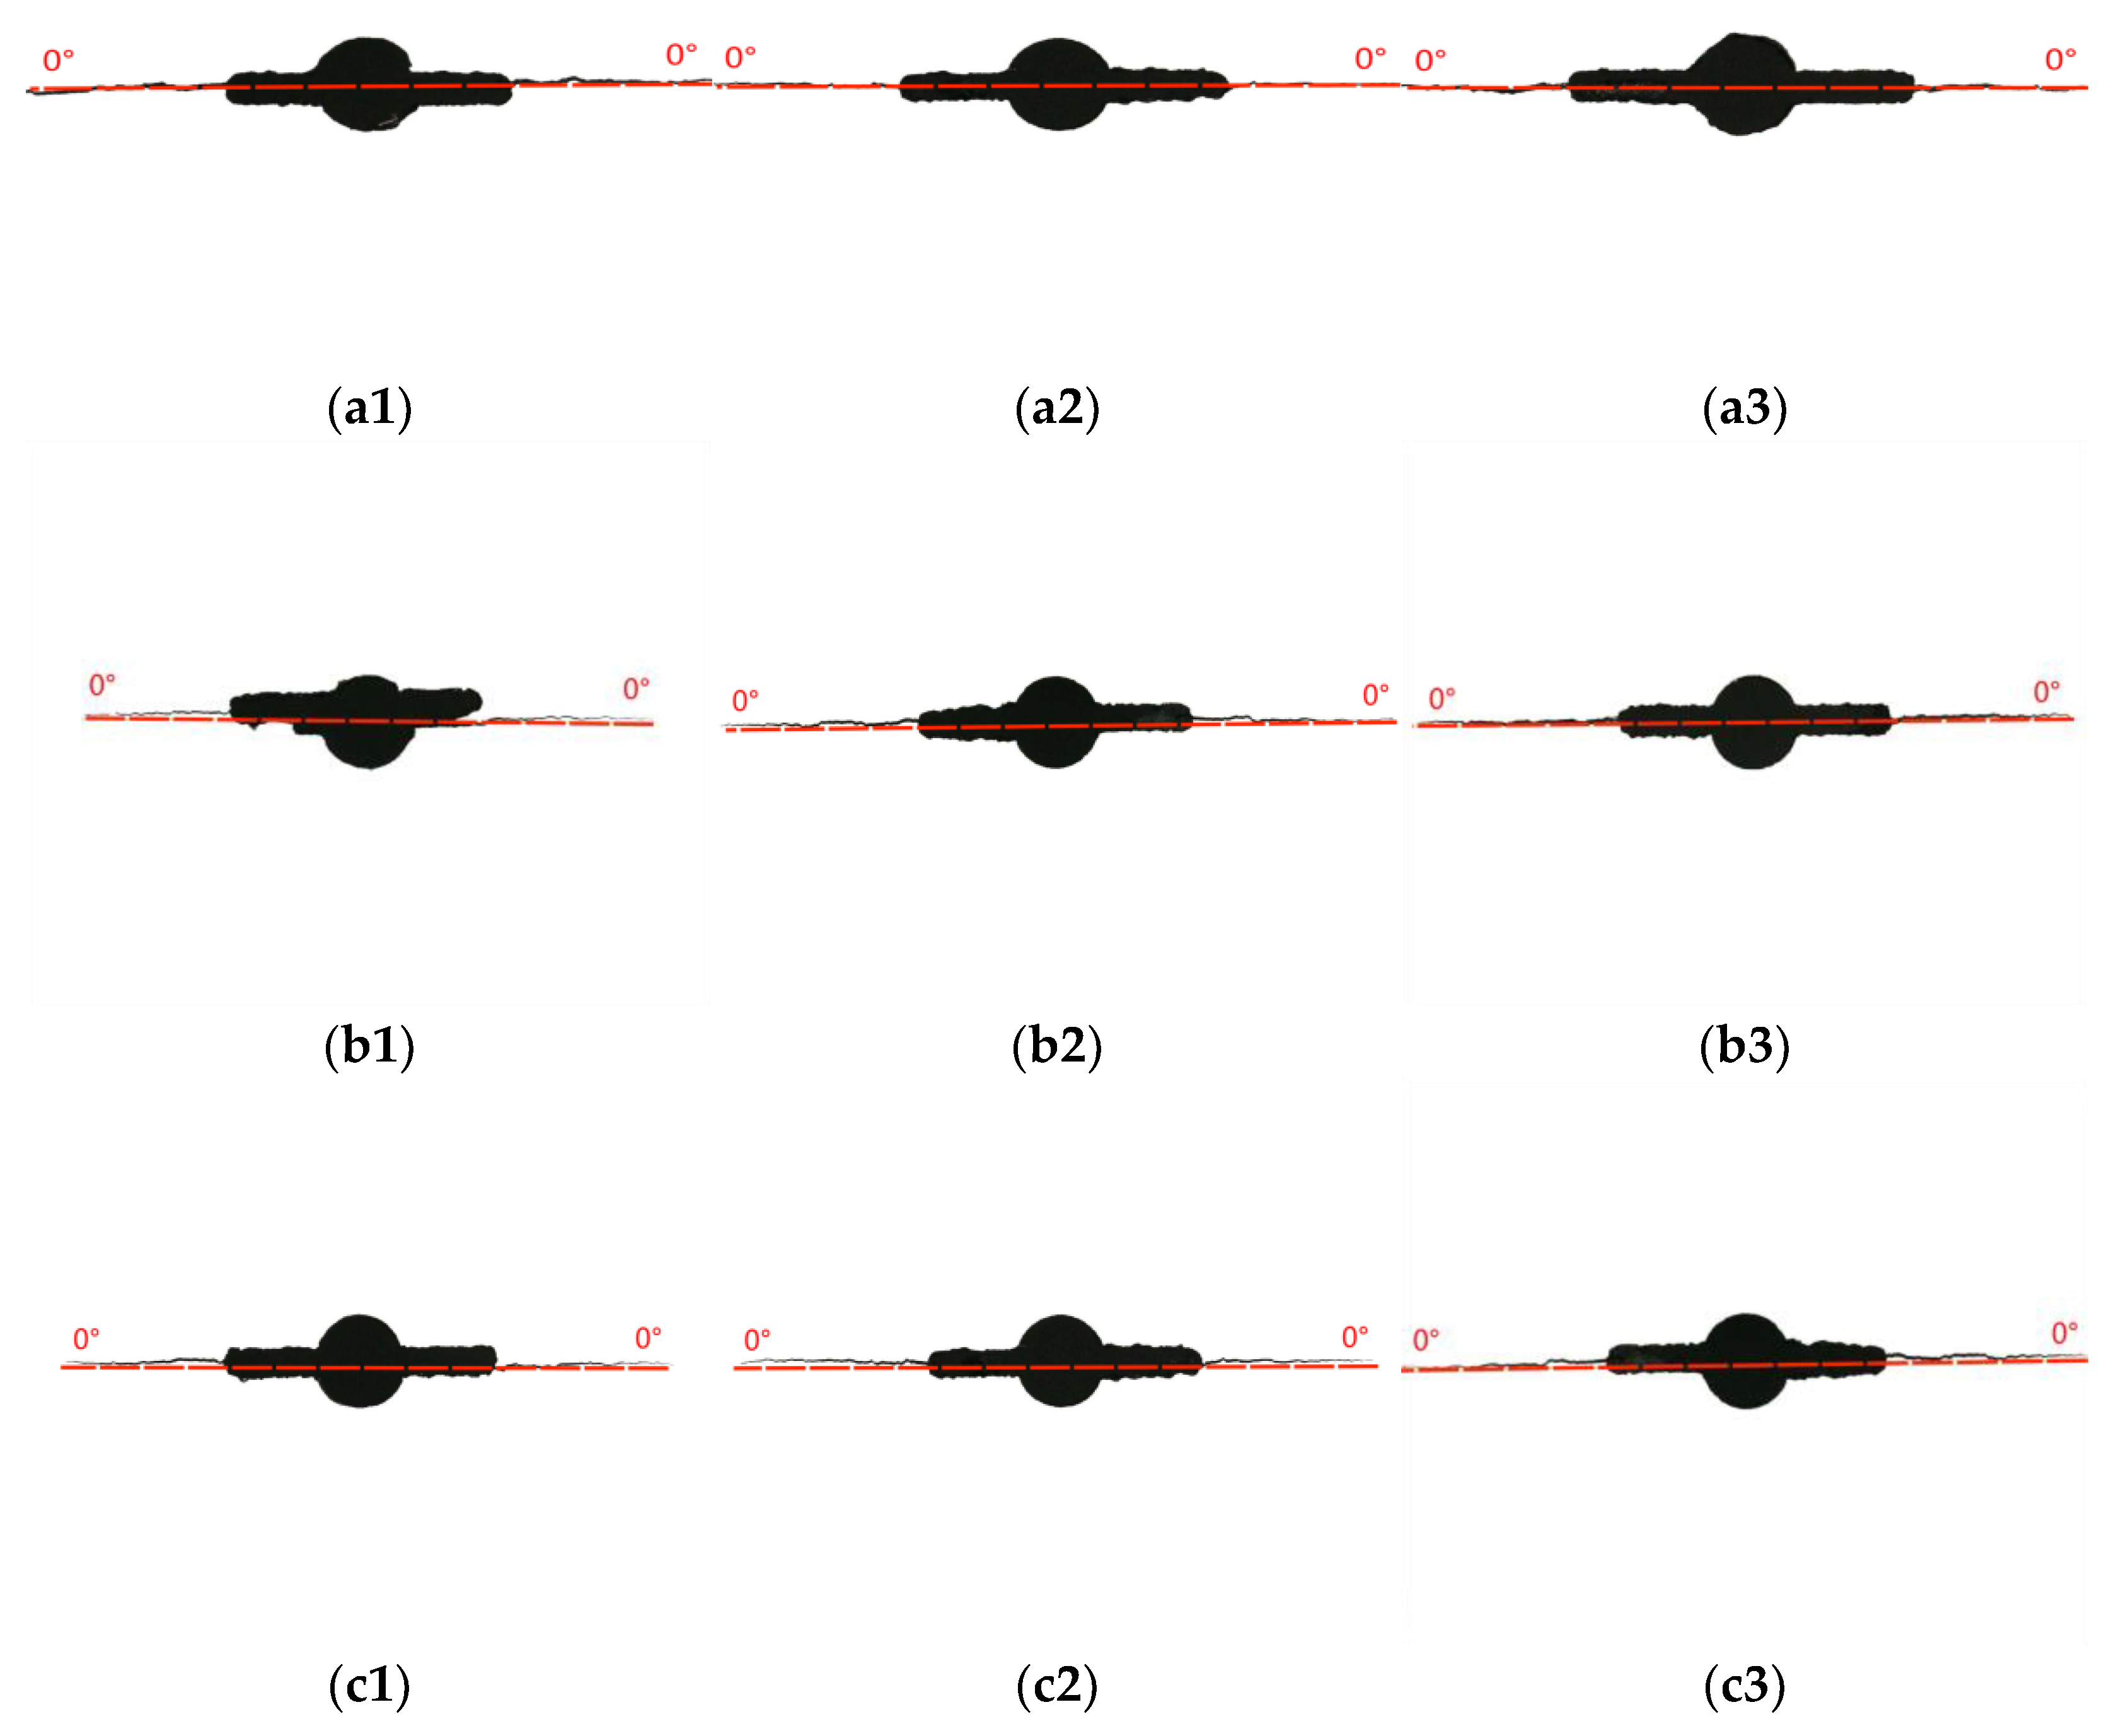
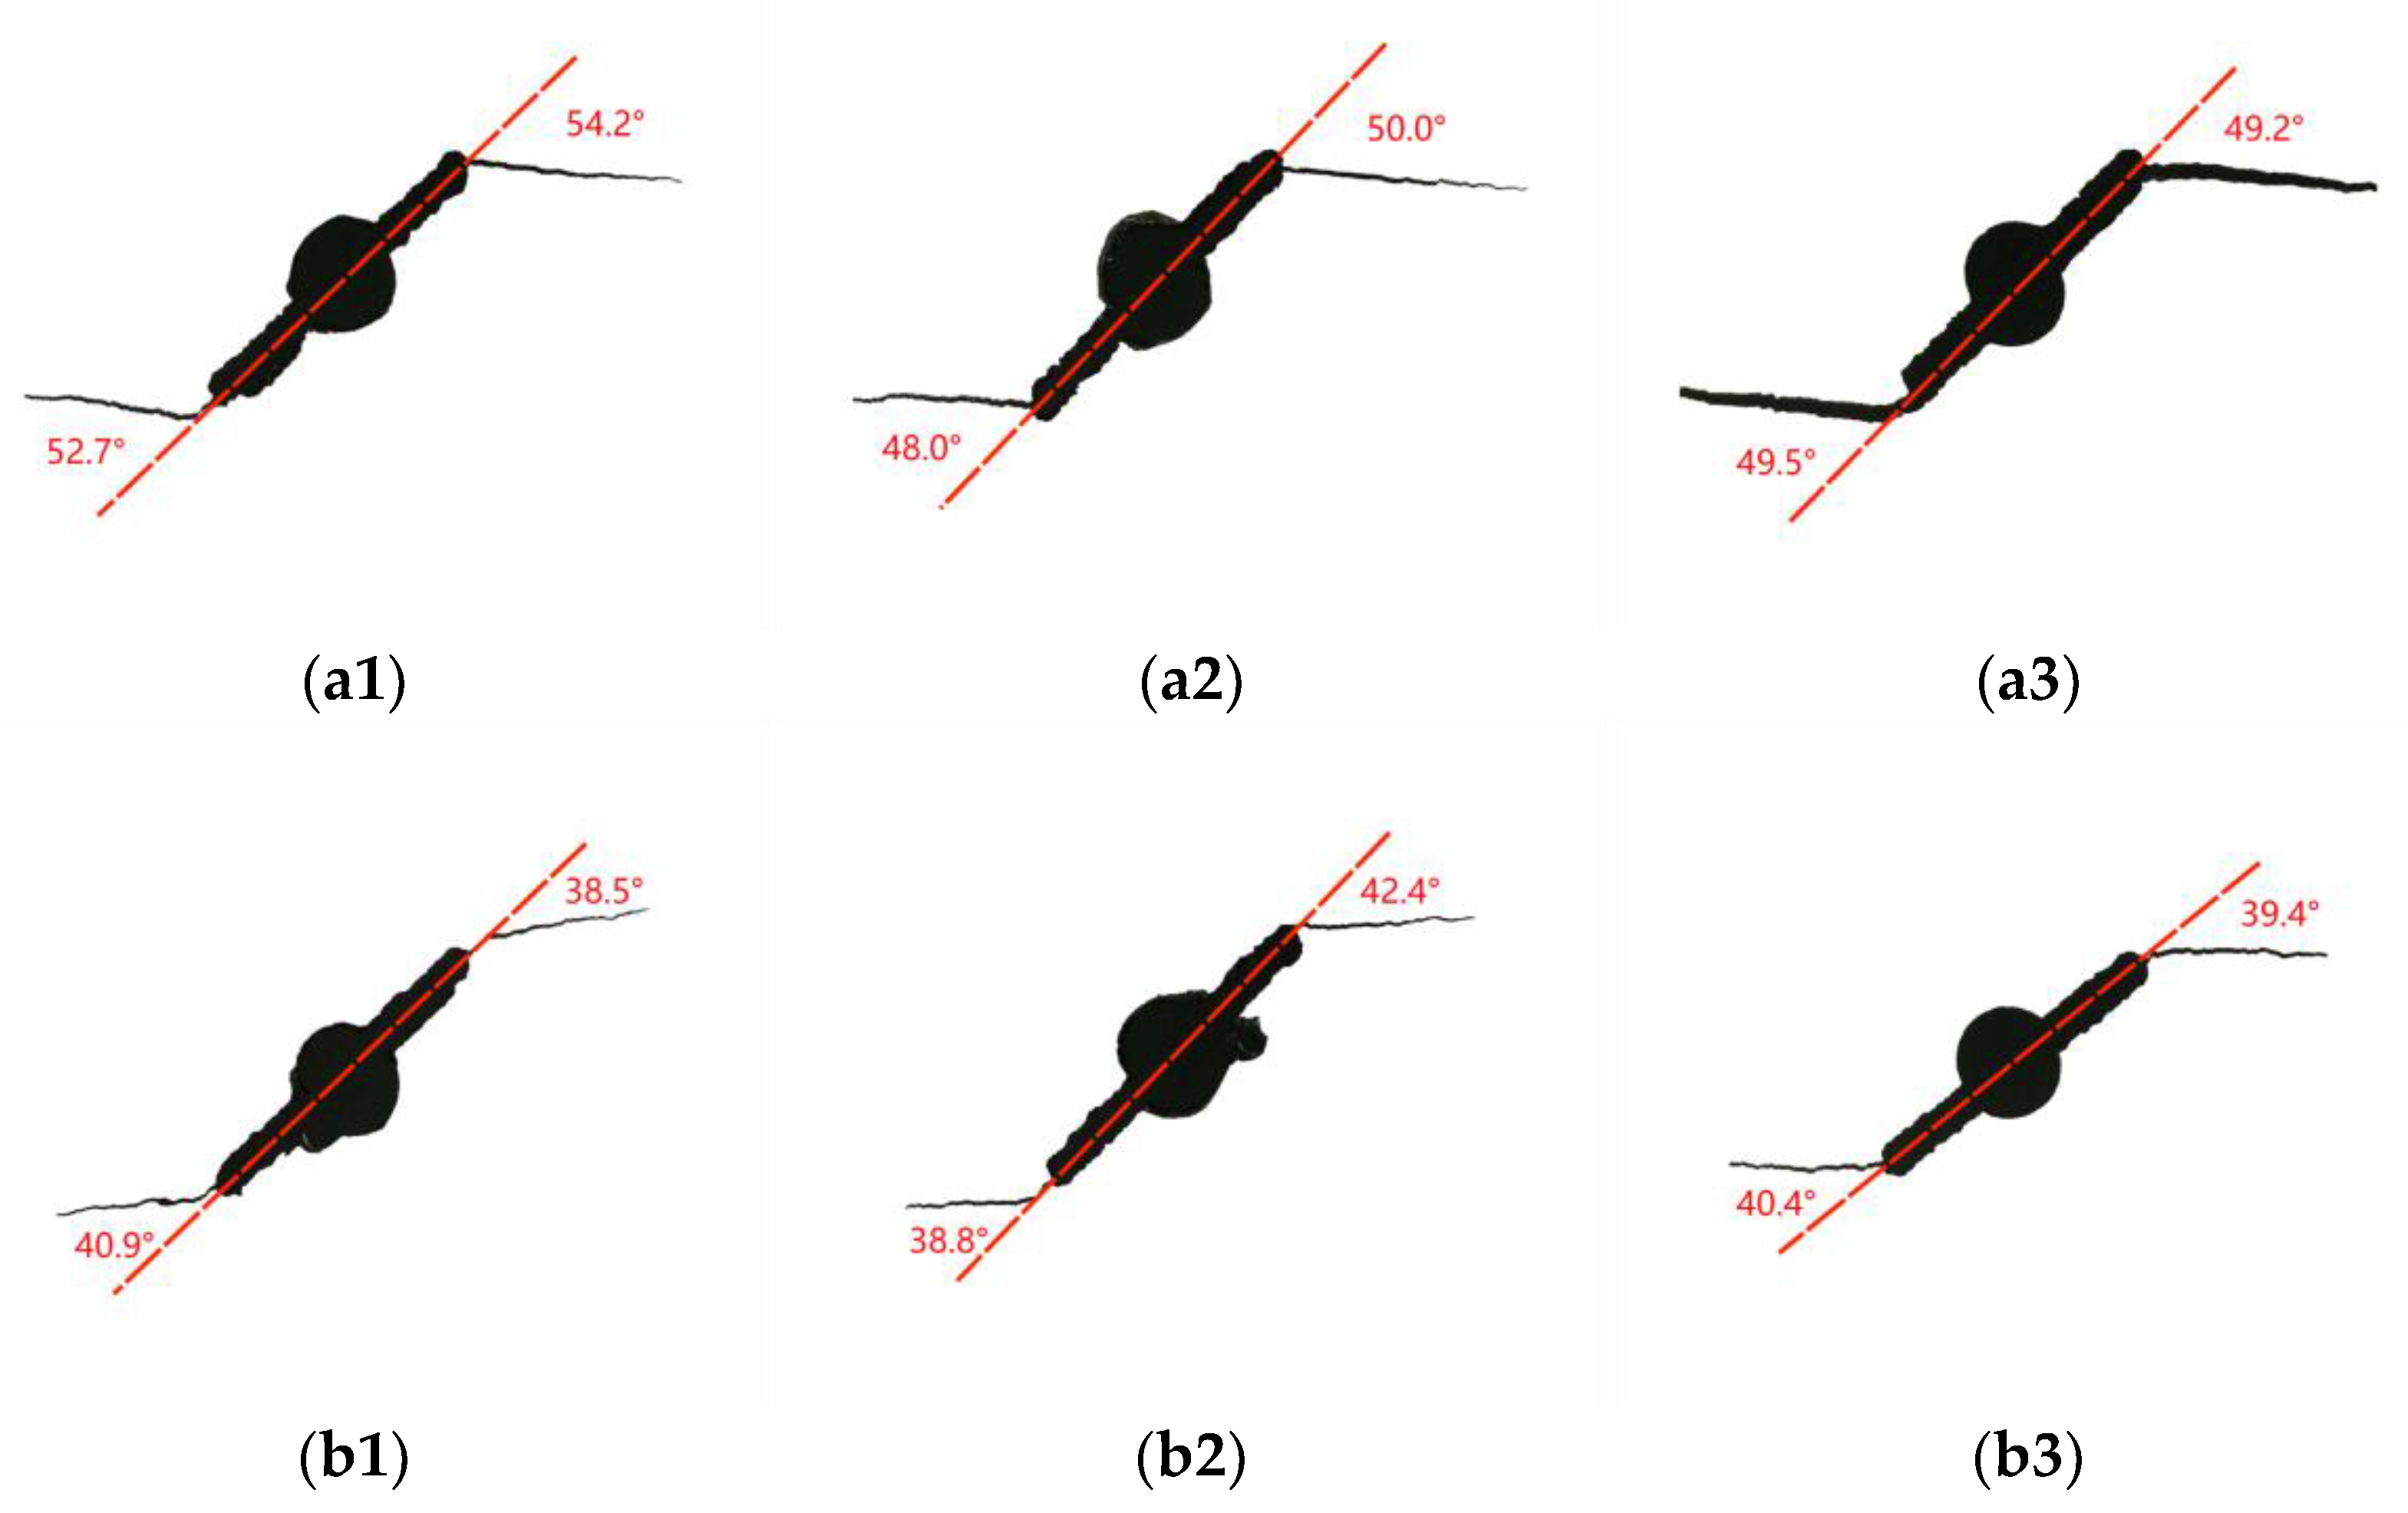
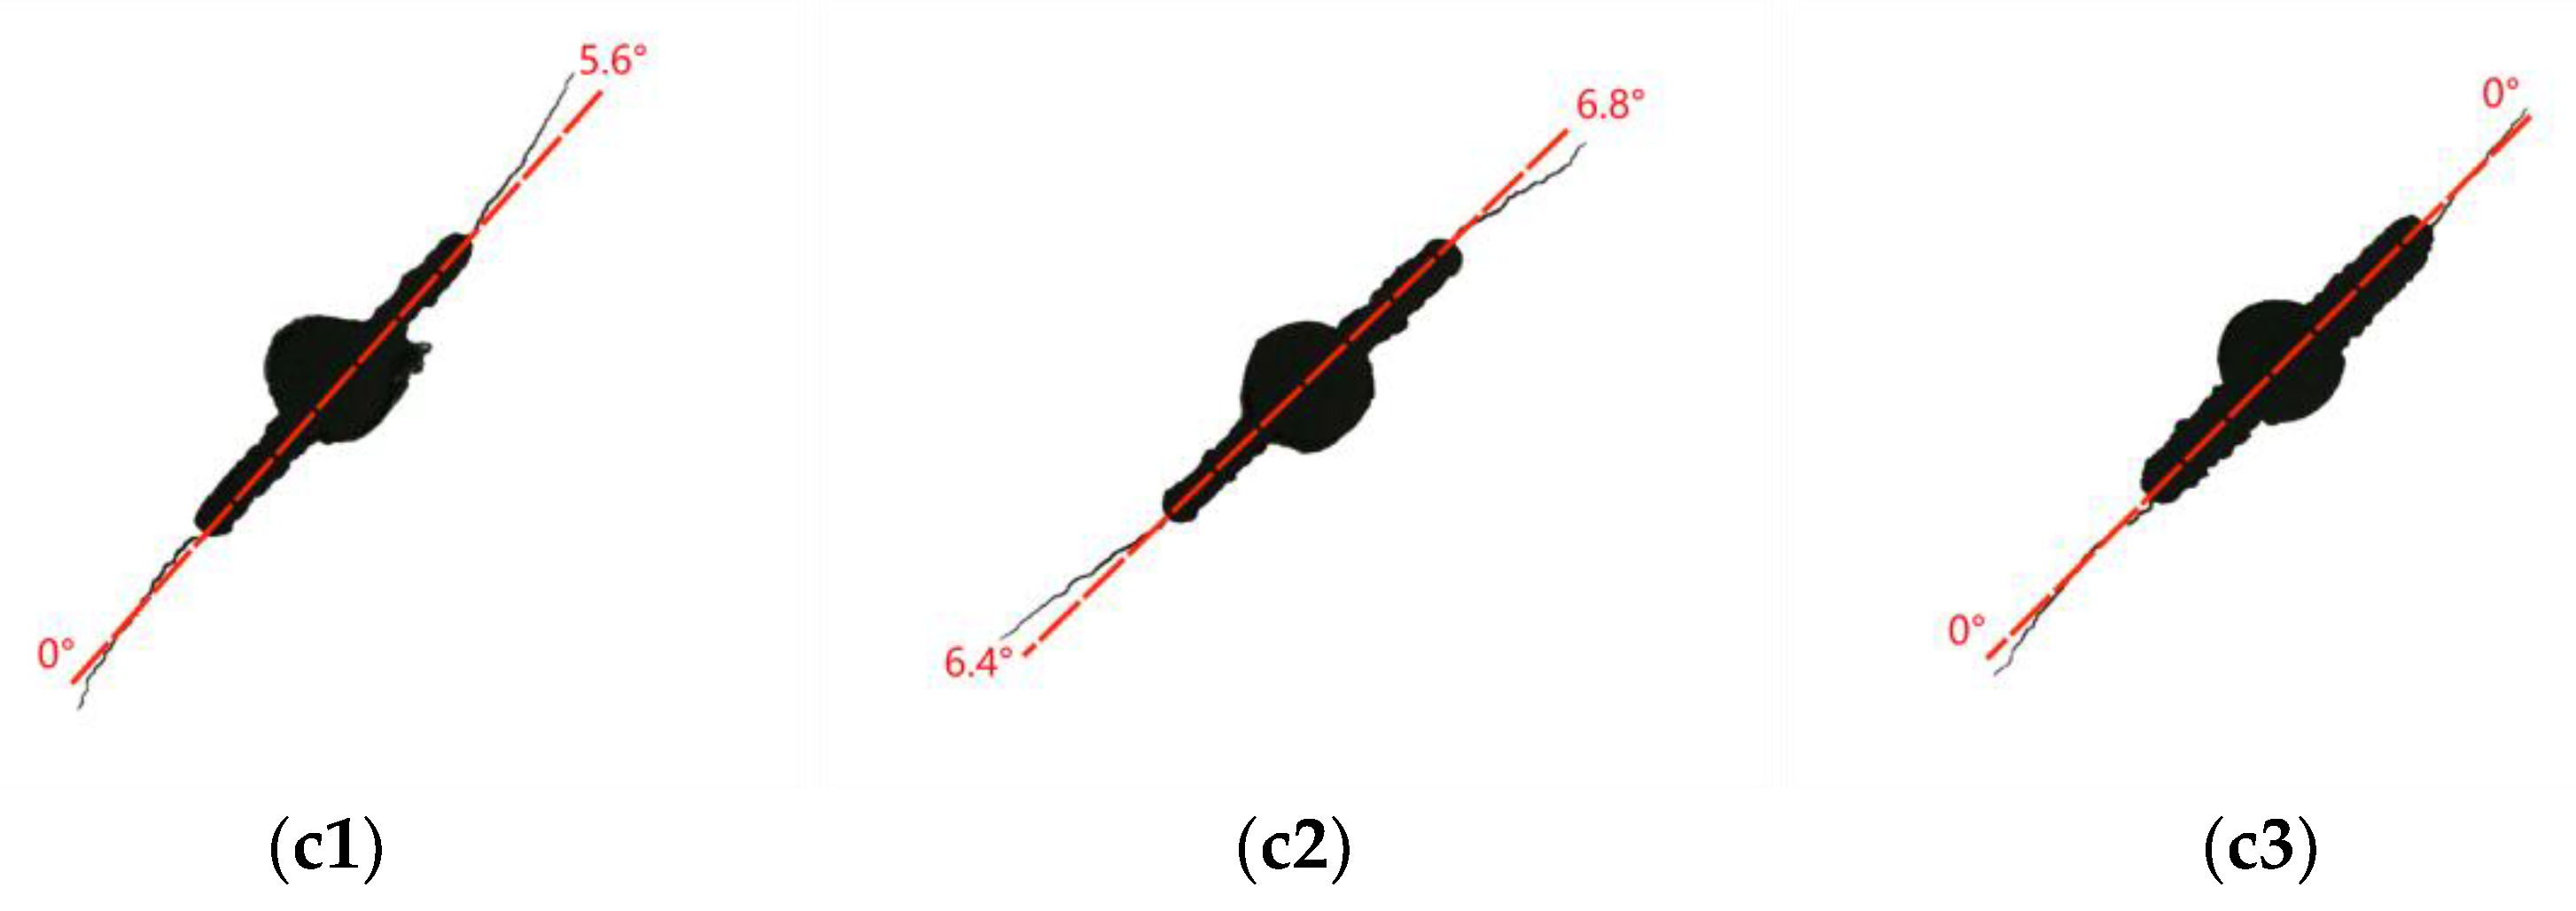
The crack growth paths are shown in Figure 2, Figure 3, Figure 4 and Figure 5 and initiation angles of 90°, 60° and 45° with various λ and R, respectively. It is seen that while β is 90°, the fatigue crack growth direction is always the same as the initial crack direction, there is no deflection and the FCG behavior is entirely dominated by stress intensity factor of mode I crack KI. However, when the inclined fatigue crack propagates, the crack propagation direction will change, thus deviating from the initial crack direction, which is due to the combined action of KI and KII during FCG. The crack is affected by the interaction of opening and shear [24].
The test results in Figure 2, Figure 3 and Figure 4 show that the change of R has no effect on the angle of crack initiation, that is, the stress ratio has no obvious influence on the FCG path, which is consistent with the conclusion obtained by Zhang [10] under uniaxial loading. The FCG path is not influenced by R under constant amplitude loading. At the same time, θ0 is greatly affected by β, and θ0 gradually increases with the decrease of β angle.
The maximum tangential stress (MTS) criterion by Leevers is applied to predict the initiation angle of FCG [25]. Hopper [12], Williams [26], Qian [27] and Richard [28] have proved by experiments that MTS criterion is consistent with the test results, and many scholars use the criterion to research the θ0 at present.
Biaxial FCG is usually controlled by λ, β, R and stress intensity factor. The mode I–II crack may occur in the process of FCG. θ0 is designated as the angle between the crack propagation direction and the initial direction. According to the MTS criterion, Erdogan and Sih [29] put forward Equation (1) to calculate the crack initiation angle.
θ 0 = 2 arctan ( 1 ± 1 + 8 ( K II K I ) 2 4 K II K I )
The θ0 is relative to the initial crack direction. When θ0 = 0, the crack expands in the direction of the initial crack. KI and KII are calculated according to the solutions of stress intensity factor in reference [19].
K I = Y I ( a / w ) × f ( λ , β ) × σ × π a × ( λ cos 2 β + sin 2 β )
K II = Y II ( a / w ) × f ( λ , β ) × σ × π a × ( 1 λ ) cos β sin β
In the above formula, YI(a/w) and YII(a/w) are the shape factors, f(λ,β) is the biaxial load factor, β represents initial crack inclination and a is the crack length.
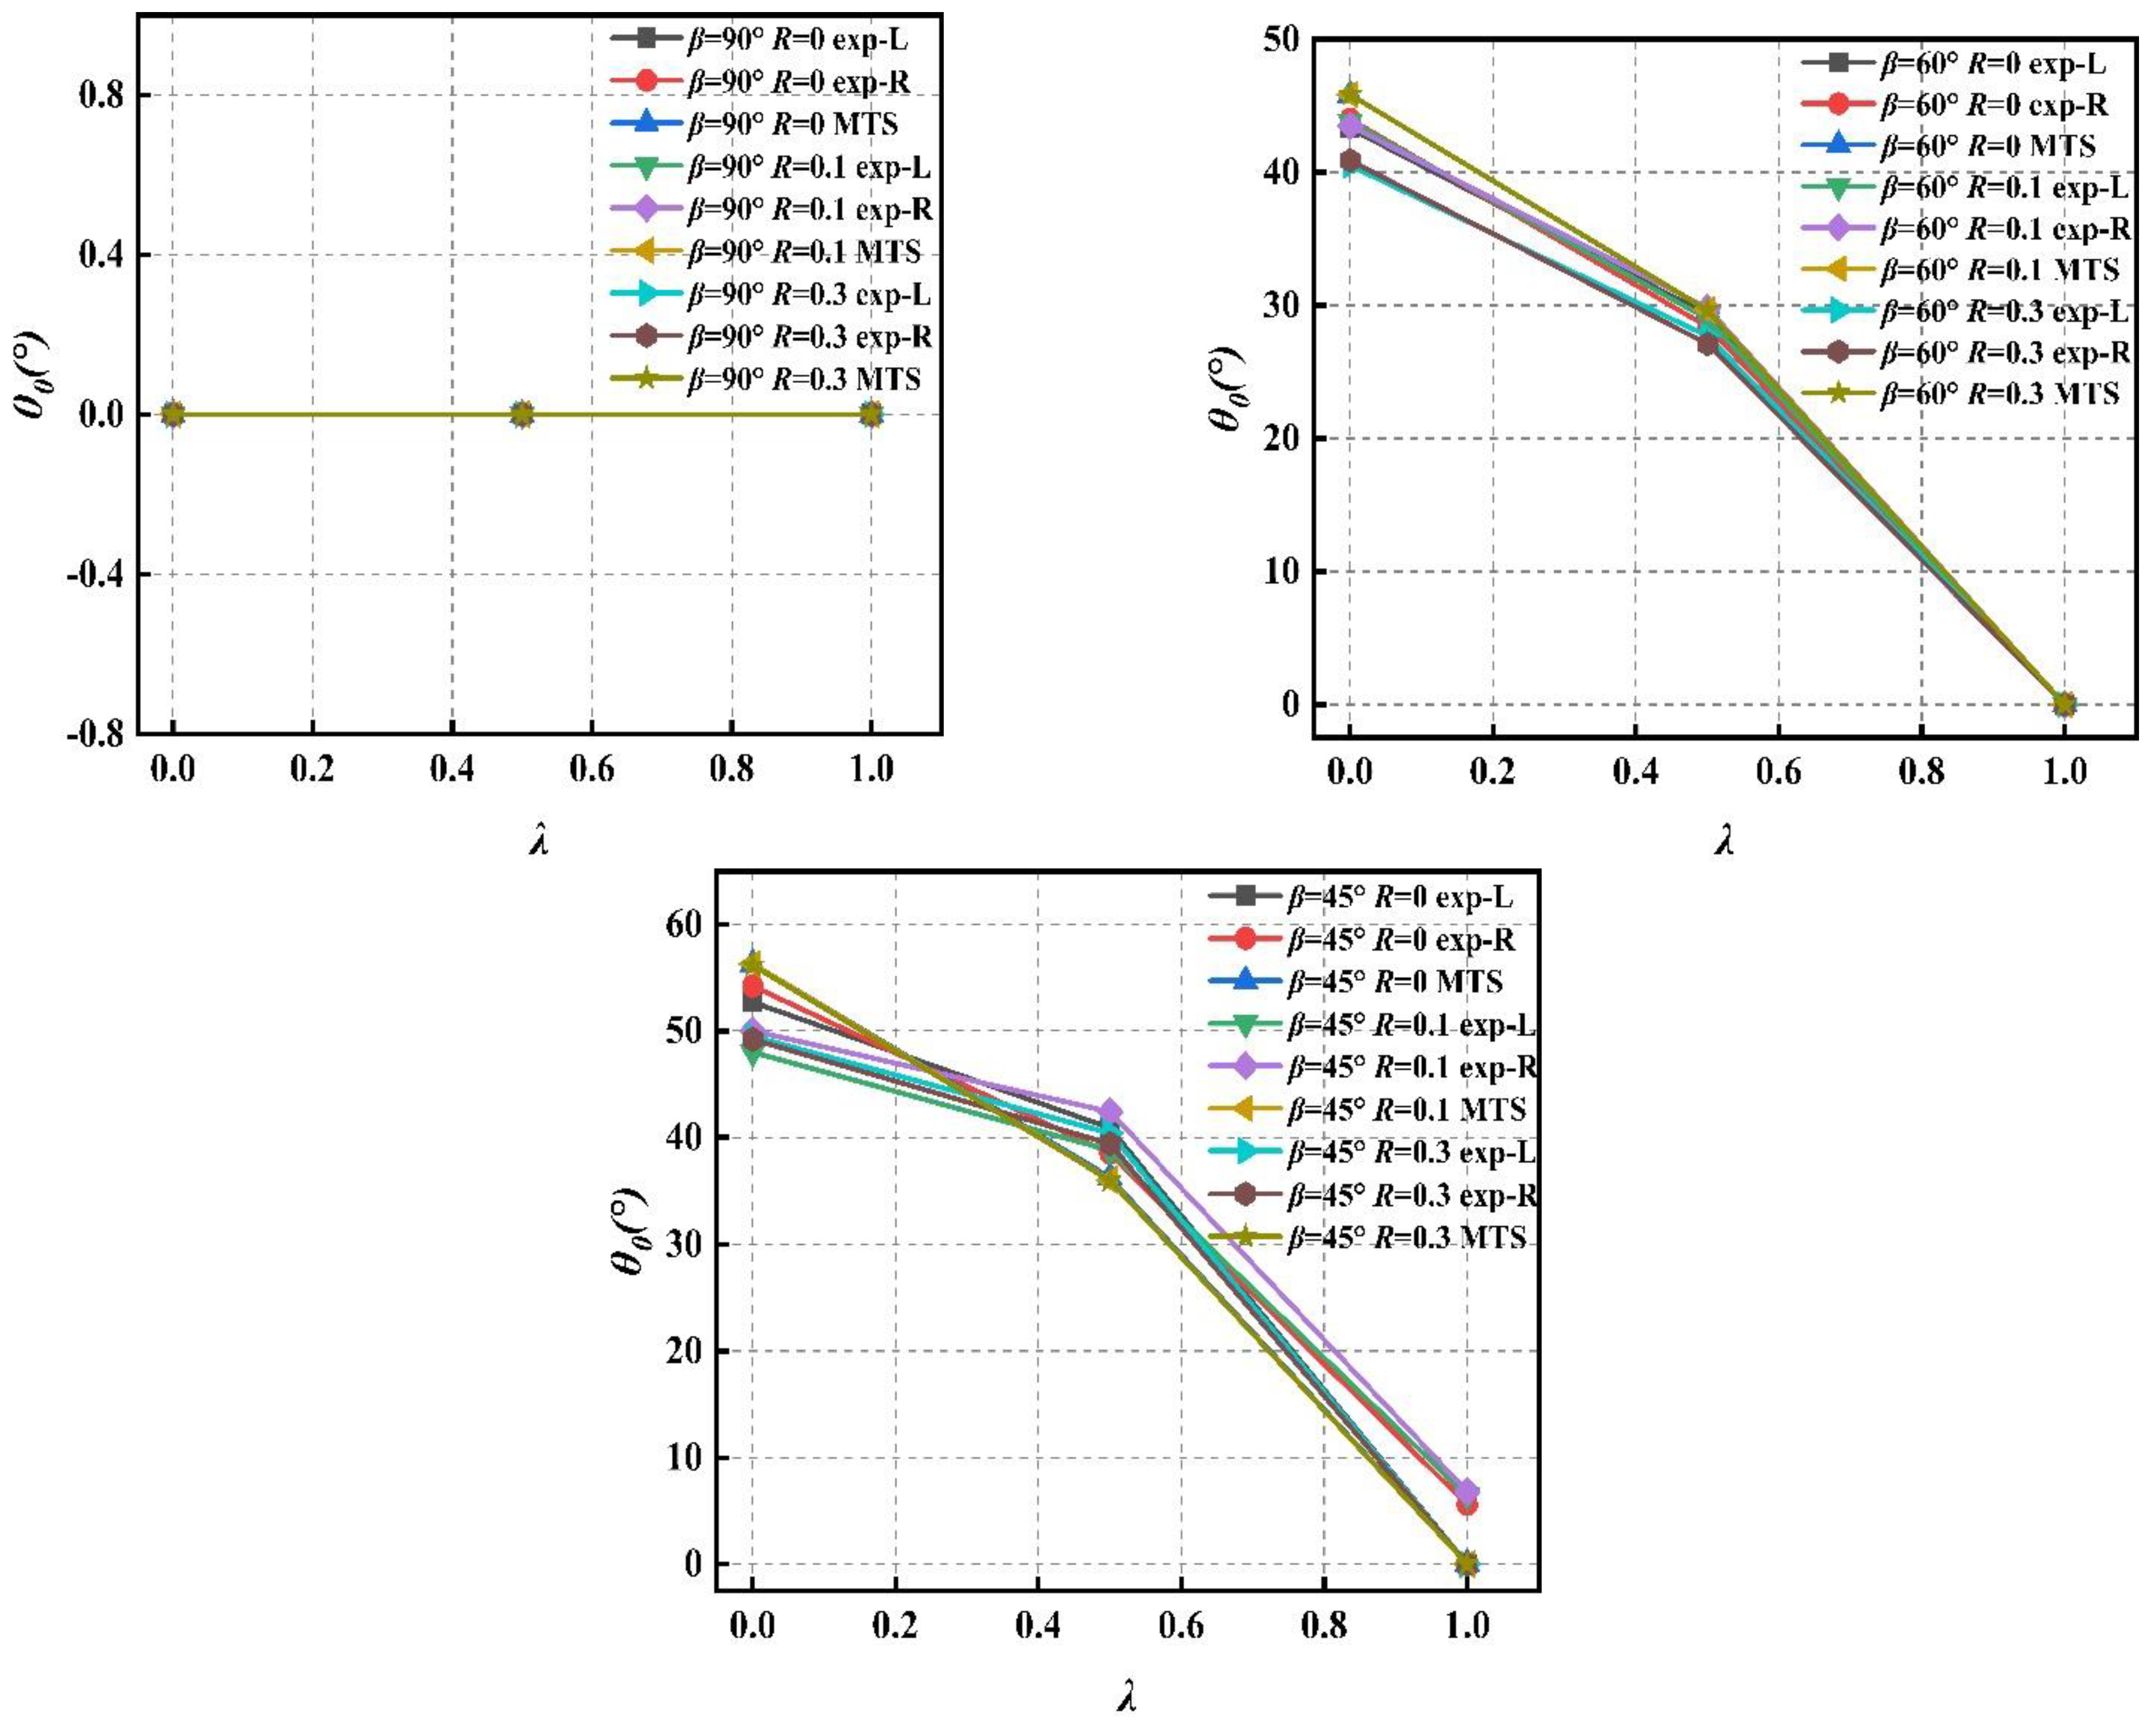
Figure 6 is a comparison of the predicted and experimental values of mixed-mode I–II fatigue crack initiation angles by the MTS criterion for various λ and different β. By comparison, it is found that the maximum error among the experiment and the calculation of the left θ0 is 17%, and the average error is 7%; the maximum error among the experiment and the calculation of the right θ0 is 15%, and the average error is 11%. Generally, the angle of crack initiation by the criterion is in accordance with the experimental results. When β = 90°, λ has no influence on the FCG path, and it means the FCG path is invariant. When β = 45° or 60°, it is seen from Figure 6 that θ0 increases with the decrease of λ, and θ0 increases with the decrease of β. When λ = 1, the crack is the mode I type and the crack growth path does not change, and all cracks propagate along the initial crack direction, which is consistent with the phenomenon observed by Leevers [25].

4. Experimental Results and Analysis

In Figure 2, Figure 3, Figure 4 and Figure 5, it is shown that after the crack deflection, the mixed-mode I–II crack will eventually tend toward the mode I crack.
When the crack is deflected, the inclination angle of the crack becomes the sum of β and θ0. The inclination angle for the crack after deflection is substituted into the above Equations (2) and (3), and the amplitudes of stress intensity factors ∆KI and ∆KII after crack deflection are obtained. Observing Figure 3, it is found that the deviation of crack growth path from mode I crack is the largest for the deflected crack with β = 60°, λ = 0 and R = 0.1 (Figure 3(a2)). Taking β = 60°, λ = 0, R = 0.1 as an example, ∆KI and ∆KII are calculated, as shown in Figure 7.
In Figure 7, N means cycle number and ∆Kv is the equivalent stress intensity factor amplitude proposed by reference [19].
Δ K v = Δ K I 2 + 2 Δ K II 2
At point A, da/dN = 0.003 (mm/cycle), ∆KI = 28.640 (MPa·m1/2), ∆KII = 5.996 (MPa·m1/2) and ∆KII/∆KI = 20.94%. According to Equation (4), ∆Kv = 1.04∆KI and the difference between ∆Kv and ∆KI is only 4%. Thus, under other conditions, the error between ∆Kv and ∆KI will be smaller and close to 0 (MPa·m1/2). Generally speaking, the proportion of ∆KII is relatively small after crack initiation and propagation, so ∆KI is used of instead equivalent stress intensity factor amplitude in the present paper.

4.1. FCGR under Different Stress Ratios

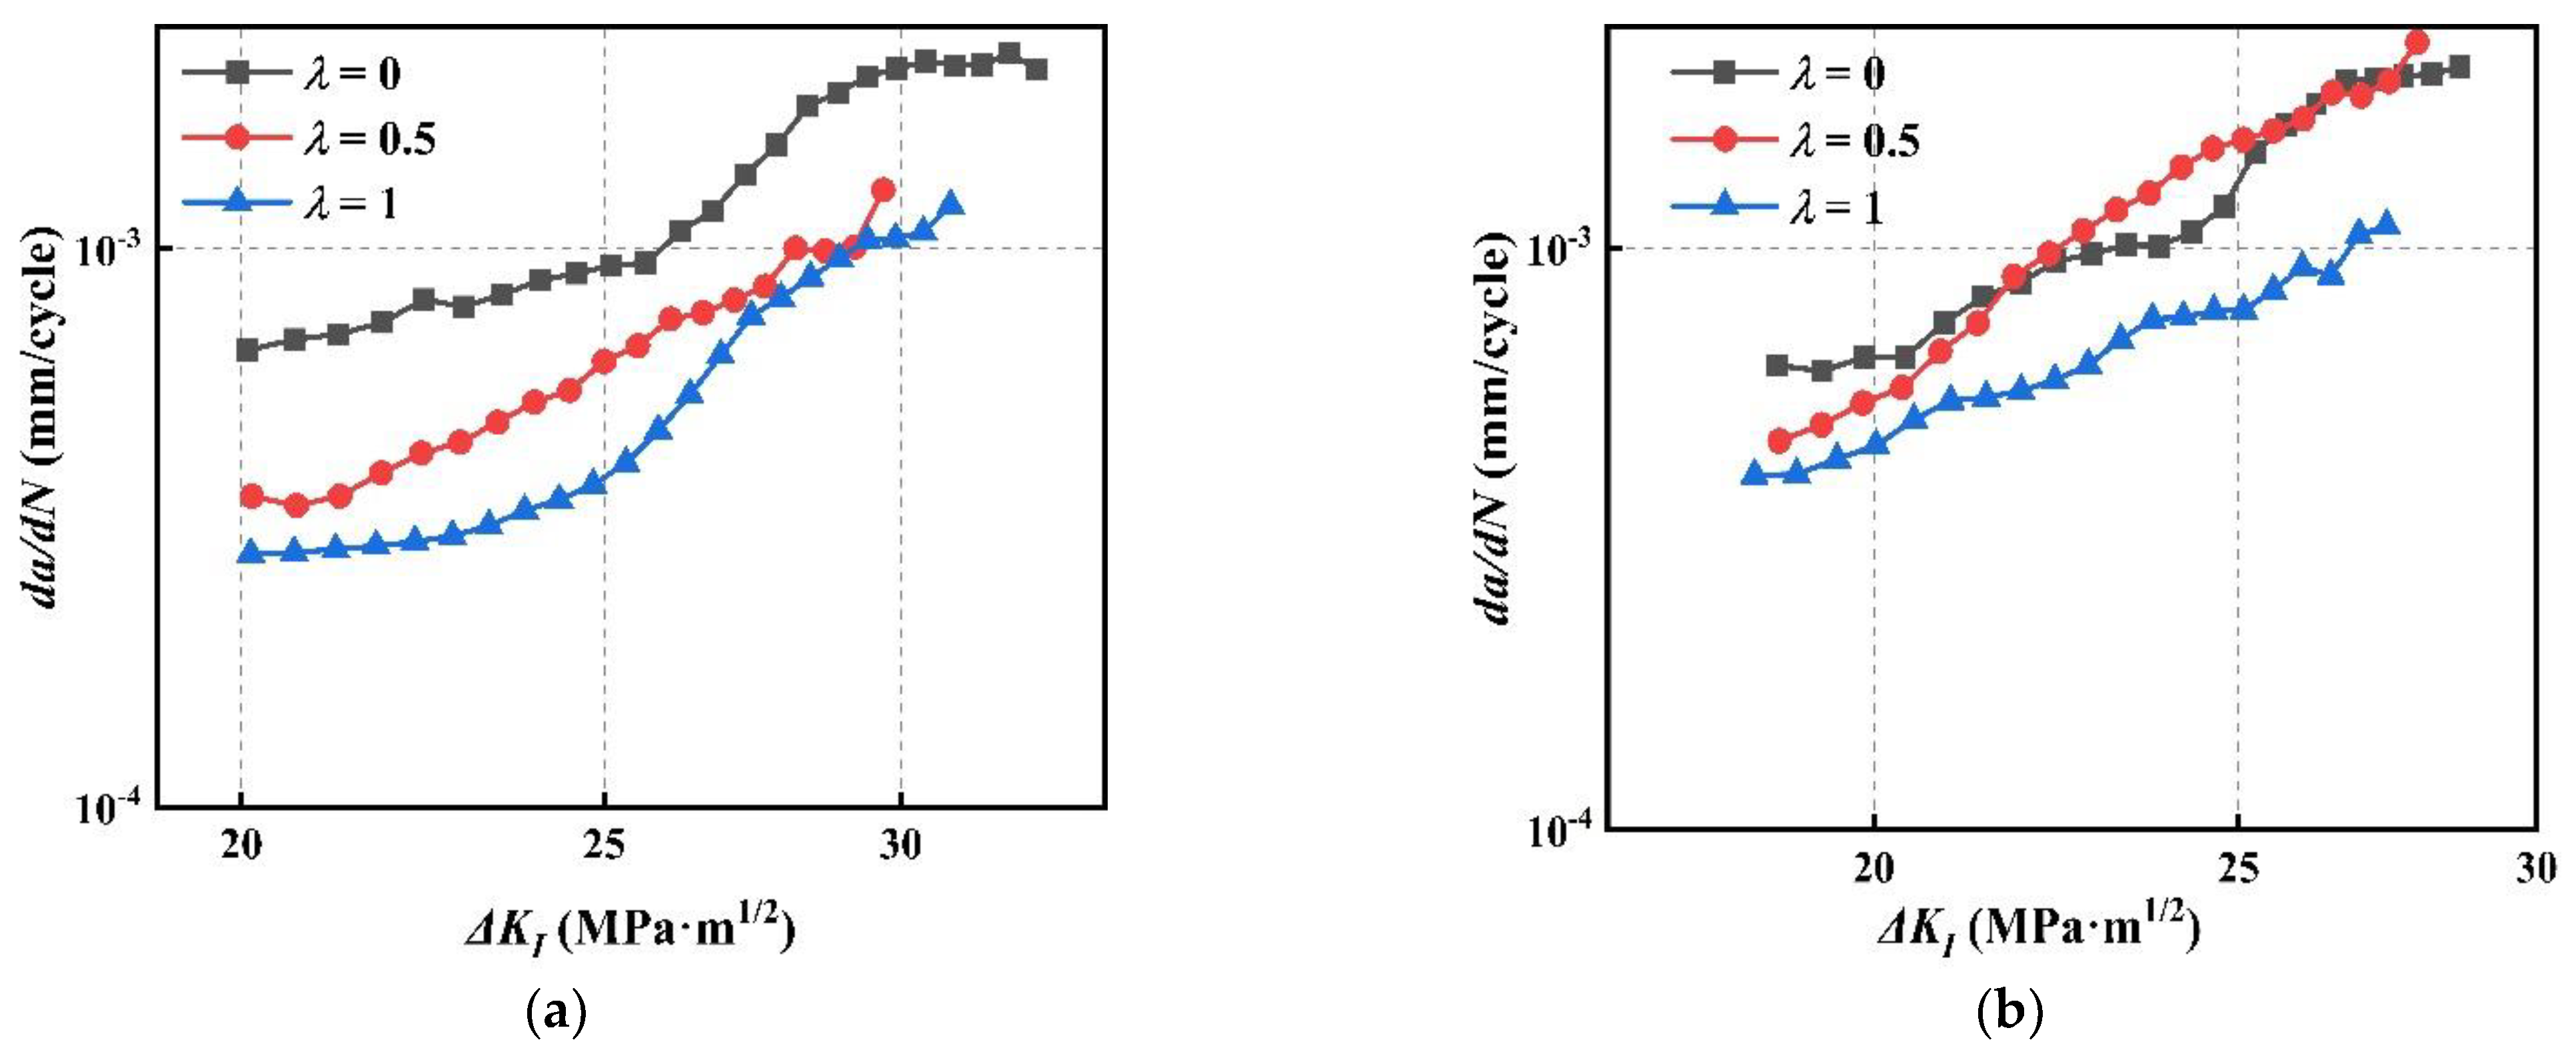
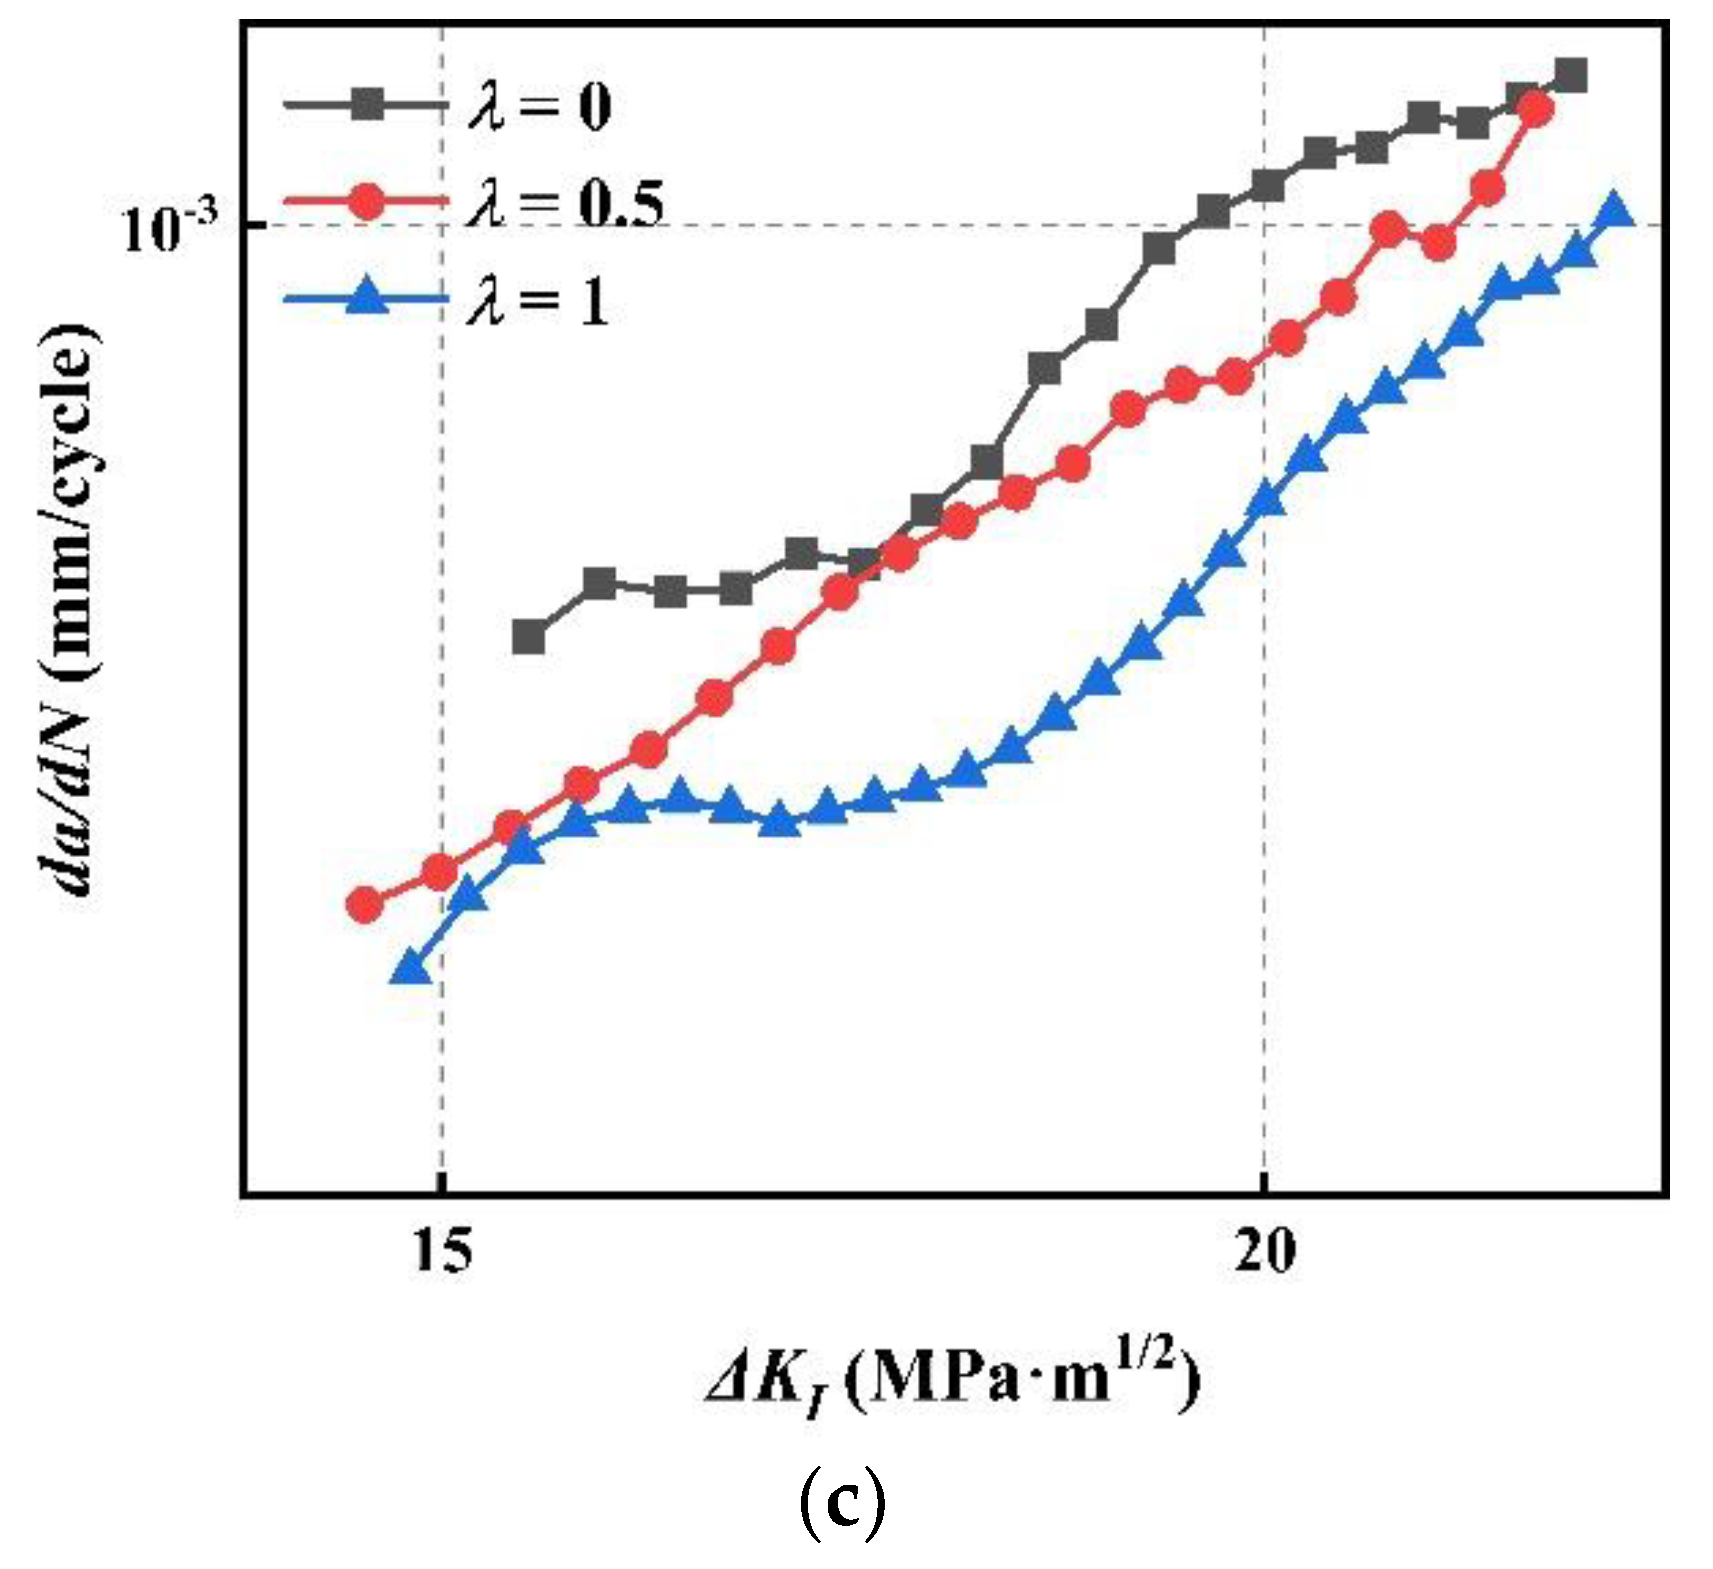
In Figure 8 is shown the propagation law of mode I FCGR under different stress ratios when the crack inclination angle is 90°. It can be found that the FCGR increases with R regardless of whether the biaxial load ratio λ is 0, 0.5 or 1. And the FCGR curve moves to the region of low stress intensity factor amplitude with R increasing, indicating that in order to obtain the same FCGR under high stress ratio, only a lower crack growth driving force is needed. There is a crack closure effect during crack growth, and the crack closure decreases with the increase of R. Therefore, under the same ∆K, the FCGR increases with stress ratio [30].
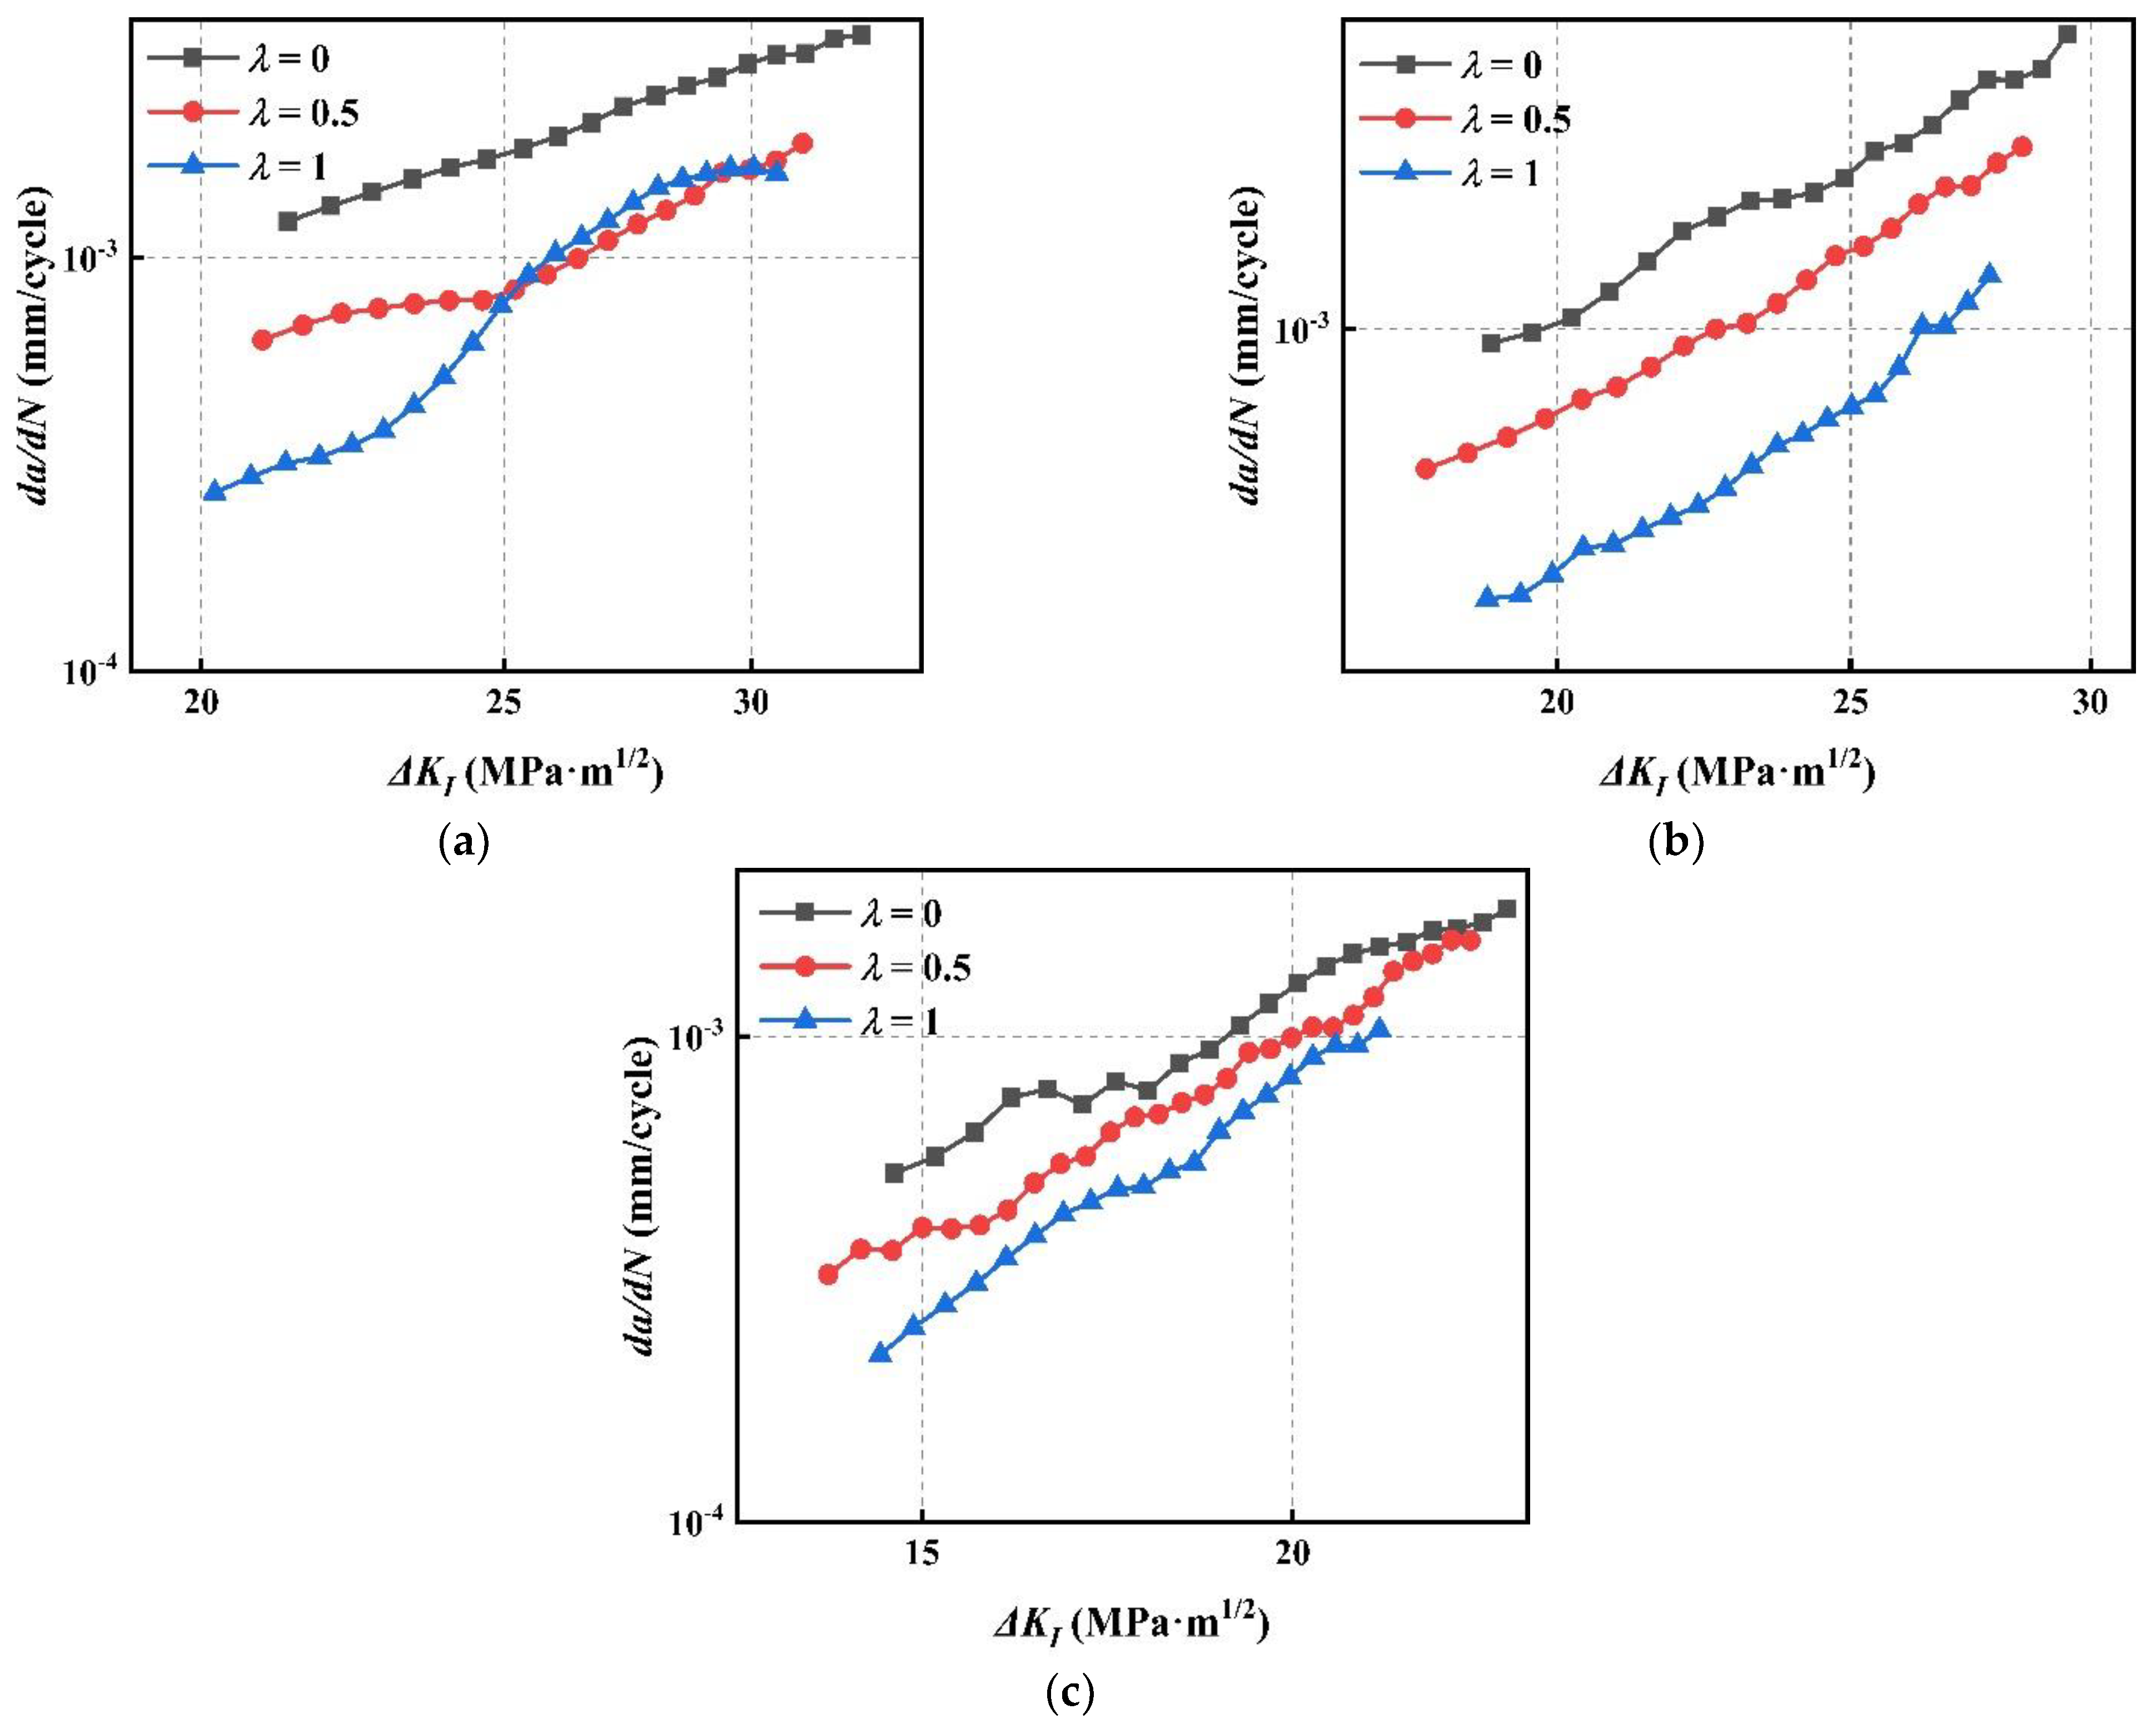
In Figure 9 (above) is shown the law of FCGR under different stress ratios with β = 60° and λ = 0 and 0.5, 1. For β = 60° and under the same driving force of crack propagation, the higher R can obtain the higher FCGR, and with the stress ratios increasing, the FCGR da/dN also increases. This is consistent with Figure 8. Dubey [31] obtained the same rule for Ti-6Al-4V alloy under various R.
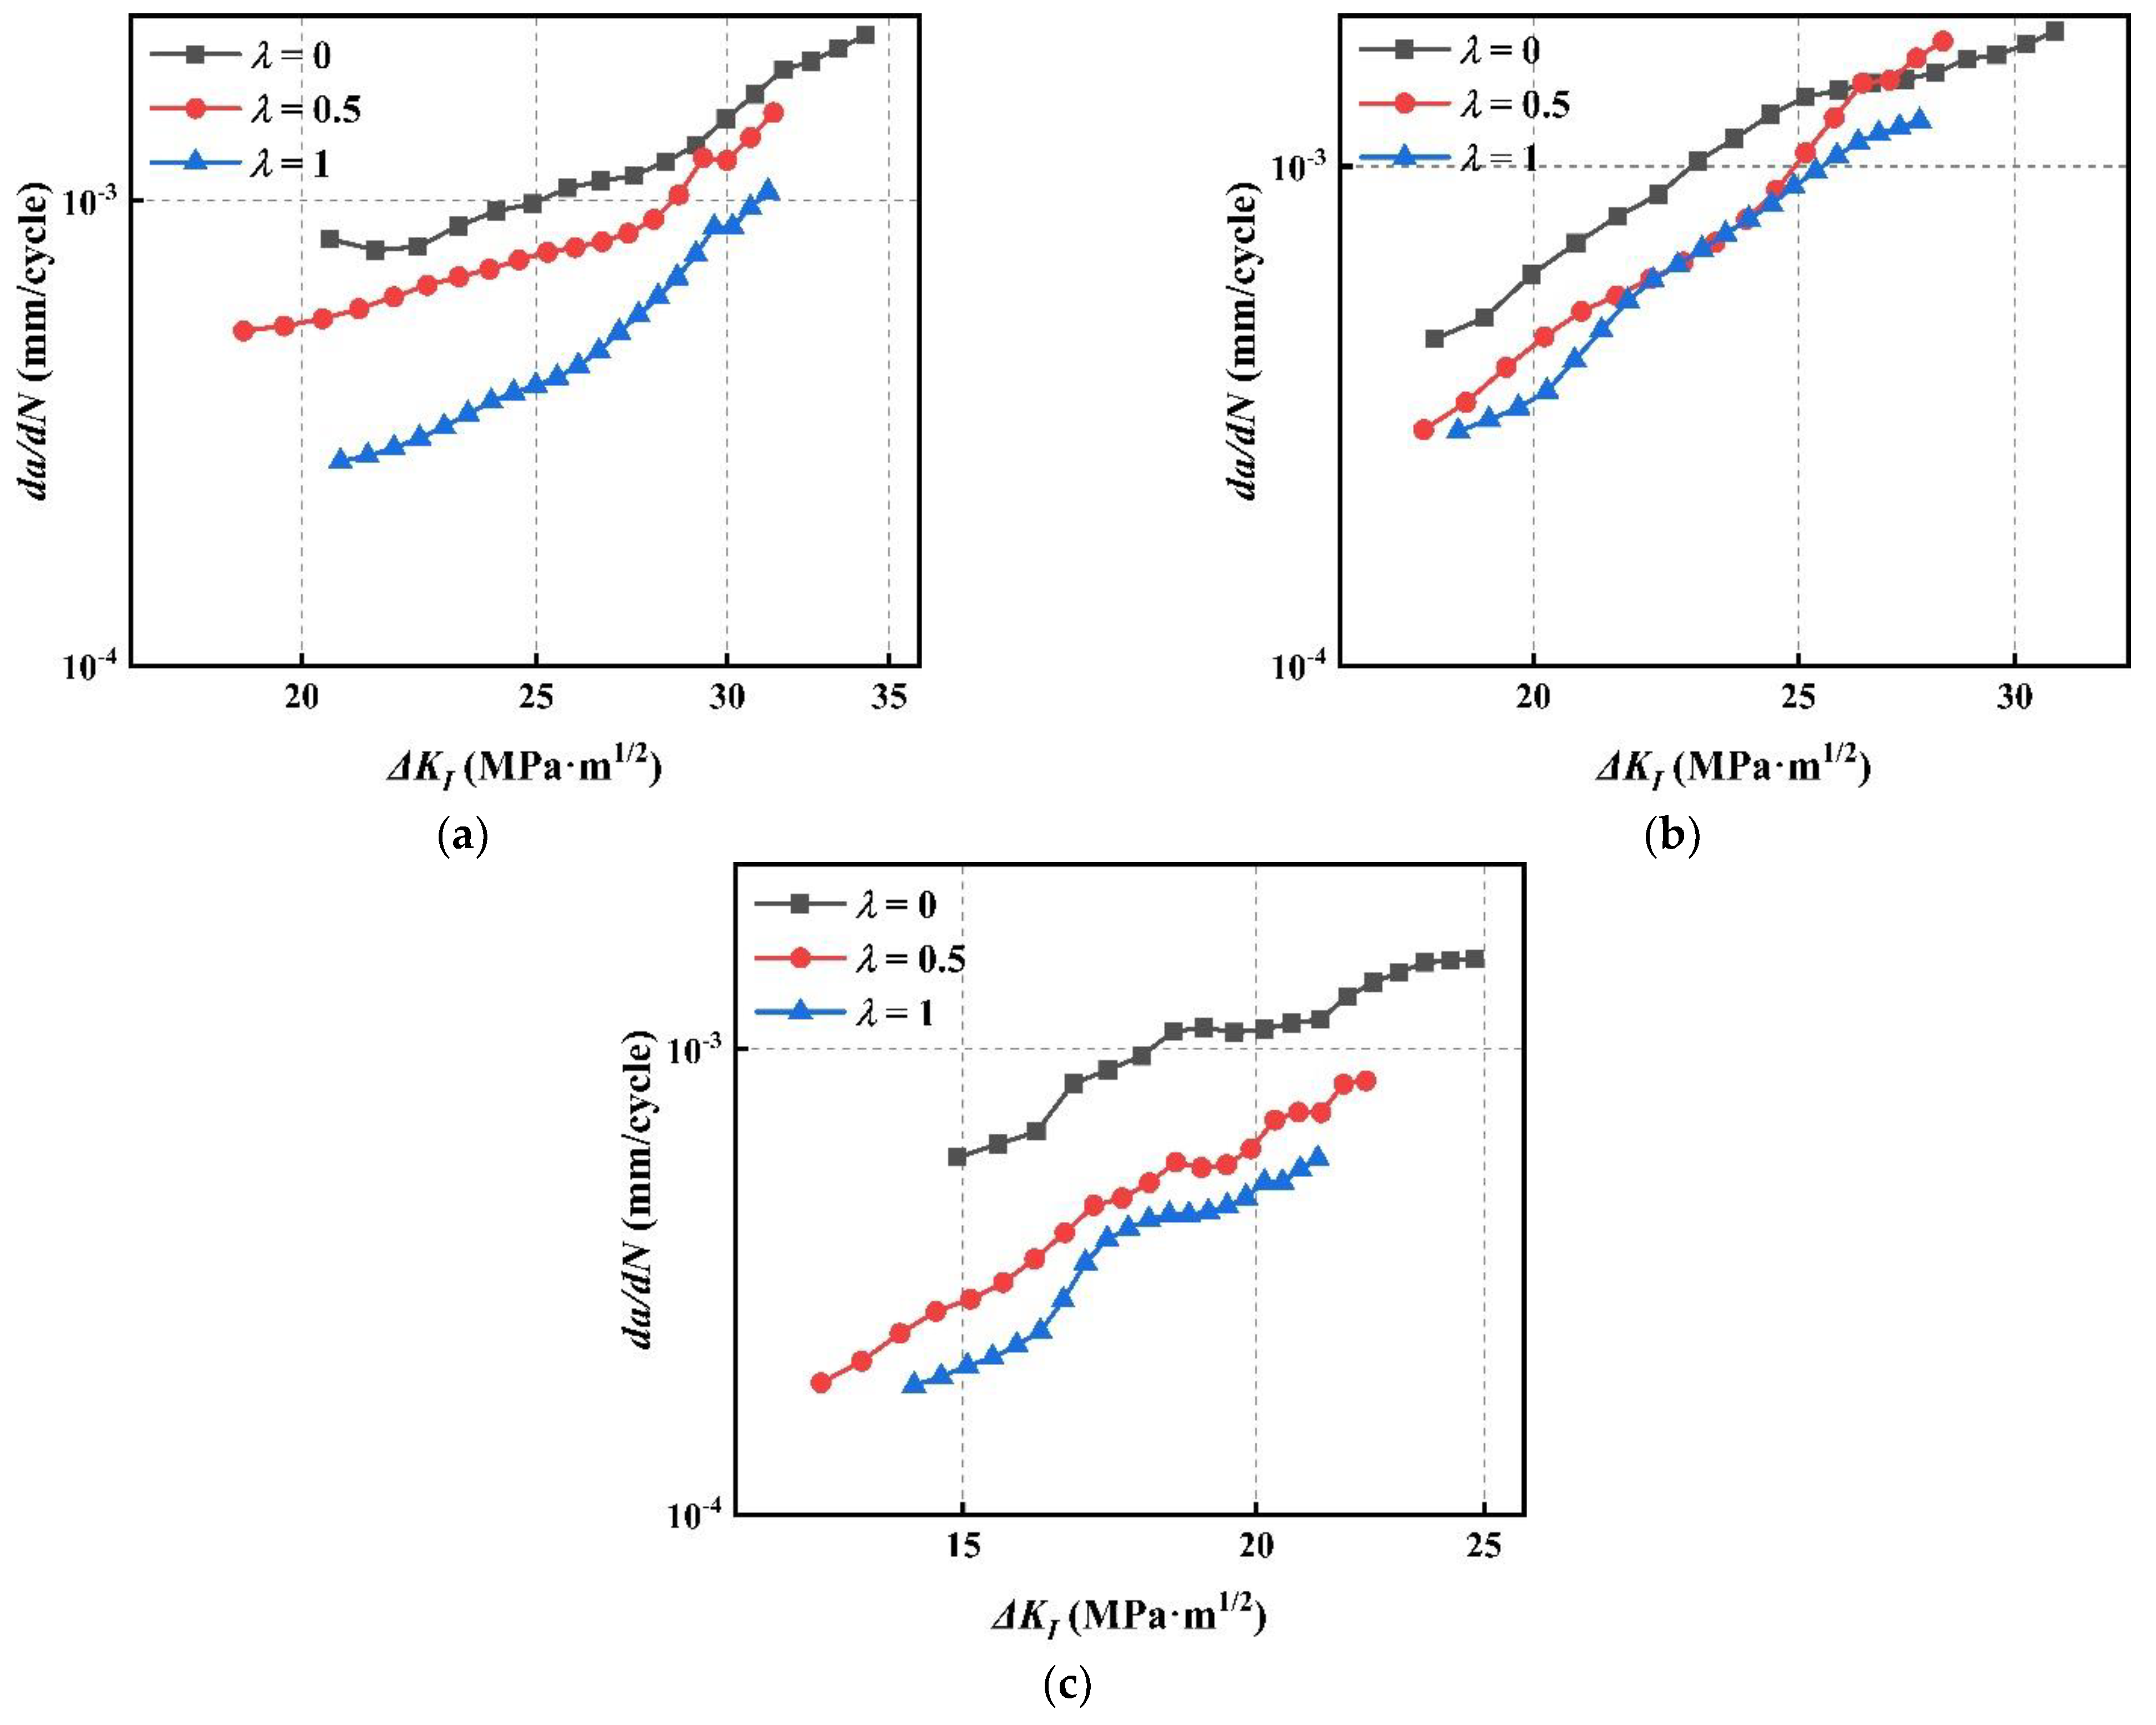
Figure 10 shows the law of FCG under various R when β = 45 °and λ = 0, 0.5 and 1. Although the FCGR at initial R = 0 is greater than that at R = 0.1 in Figure 10b, the FCGR increases with ∆KI, the FCGR of R = 0.1 soon exceeds that of R = 0 and the difference increases with ∆KI. In general, the FCGR increases with stress ratio R under various λ, which is consistent with the variation shown in Figure 8 and Figure 9. References [2,3,4] can also support present test results. Lu [5] studied the FCG behavior of TA2 base metal and welded joint, and also found that the FCGR increases with R.
In Figure 8, Figure 9 and Figure 10, although λ and β are different, the trends of FCGR under different stress ratios R are the same. The FCGR of both the mode I crack and mixed-mode I–II crack increases with stress ratio R, which is consistent with the results of researchers [30,32]. When β = 90°, 60° and 45° and R = 0.3, the fatigue crack propagates at a lower stress intensity factor amplitude, that is, when R = 0.3, the driving force required for crack growth is minimum. Thus, it is concluded that the stress ratio has an obvious influence on the FCGR of CP-Ti TA2. At the same time, the results above show that the FCGR curves of R = 0.3 shift obviously to the left compared with the curves of R = 0 and 0.1. It can be inferred that as the stress ratio continues to increase, the FCGR will be higher when the stress ratio is high. Therefore, in engineering, it is beneficial to reduce the stress level of the components, because a higher fatigue crack growth driving force ∆K is needed at a small stress ratio, which is consistent with the research results regarding many other titanium alloys [33,34].

4.2. FCGR under Various Biaxial Load Ratios

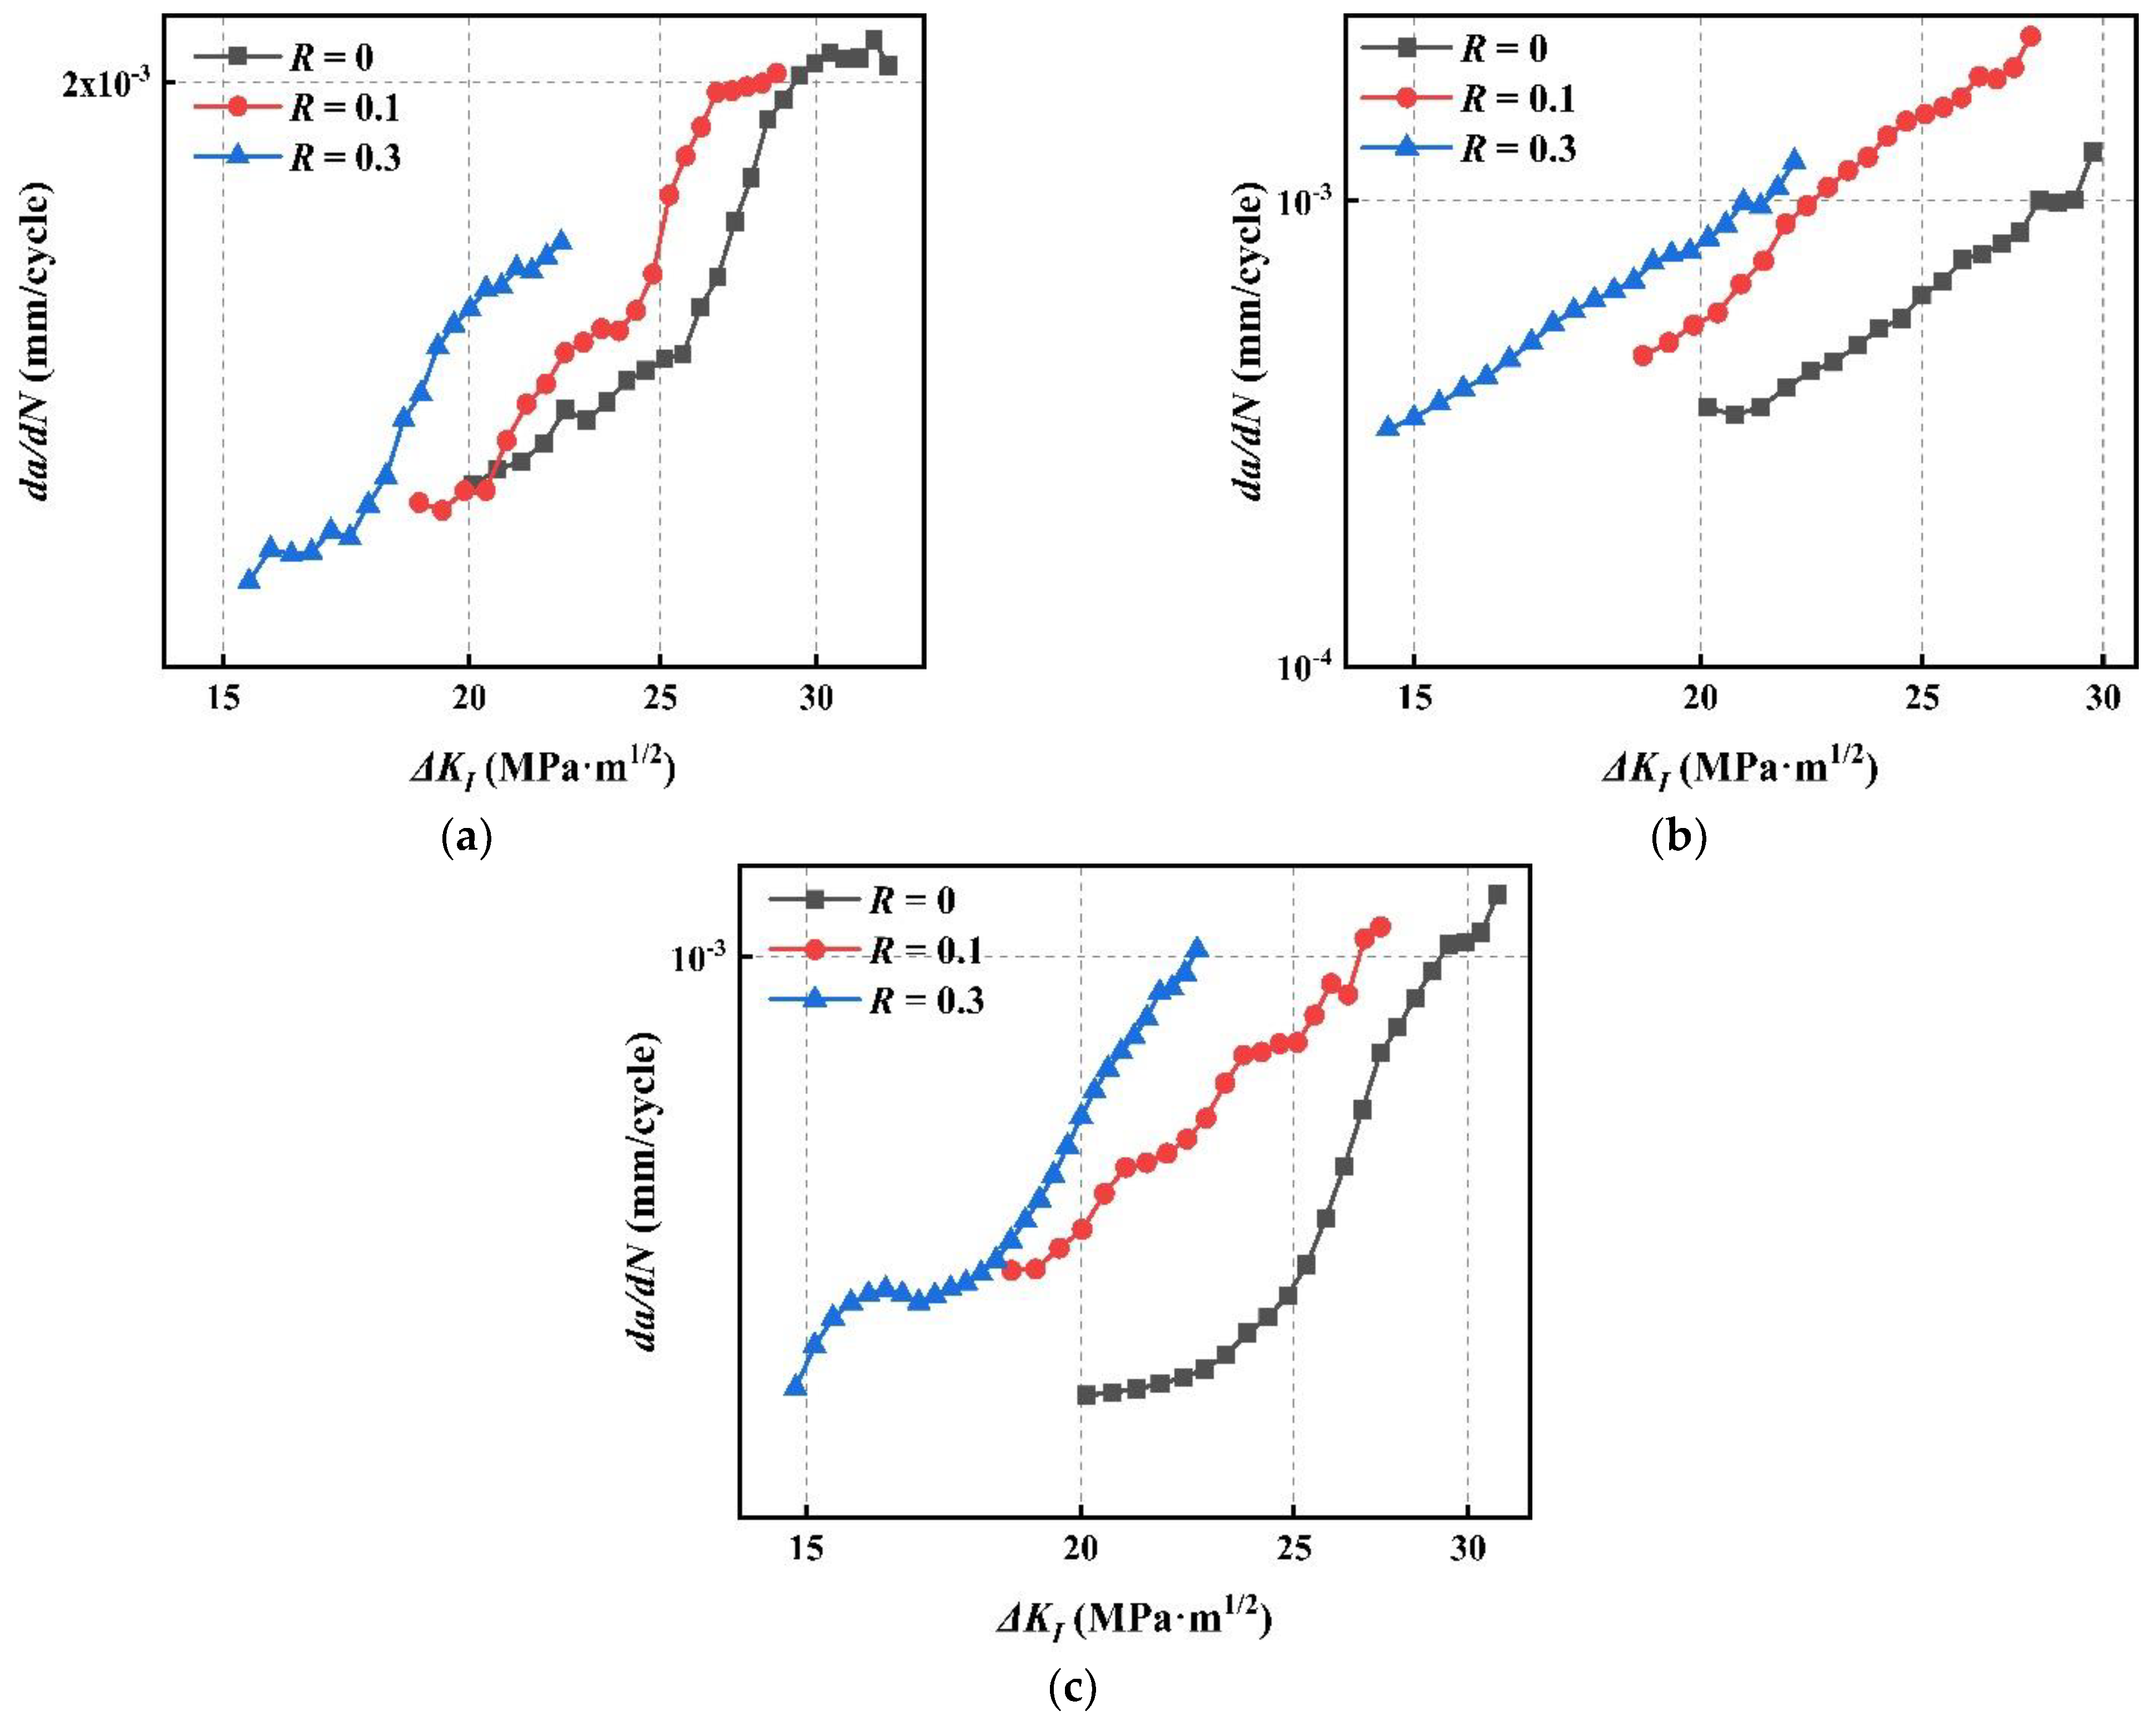
Figure 11 shows the FCG law under various λ when the inclination angle β = 90° and the stress ratio R = 0, 0.1 and 0.3. Figure 11a,c shows that the FCGR decreases with biaxial load ratio λ increasing, no matter whether R is 0, 0.1 or 0.3. Although the curve da/dN of λ = 0 in Figure 11b shows that the curve at low ∆KI is lower than that of λ = 0.5, it may be that the larger grains hinder the crack growth during crack growth, resulting in a temporary decrease of the da/dN curve for λ = 0, then exceeding the da/dN curve of λ = 0.5. Therefore, from the overall trend, the FCGR increases with the decrease of biaxial load ratio λ, that is, under the same crack growth driving force, the FCGR is the highest under uniaxial load. Anderson and Garrett [18] also found a similar phenomenon: that the higher the λ, the lower the FCGR.
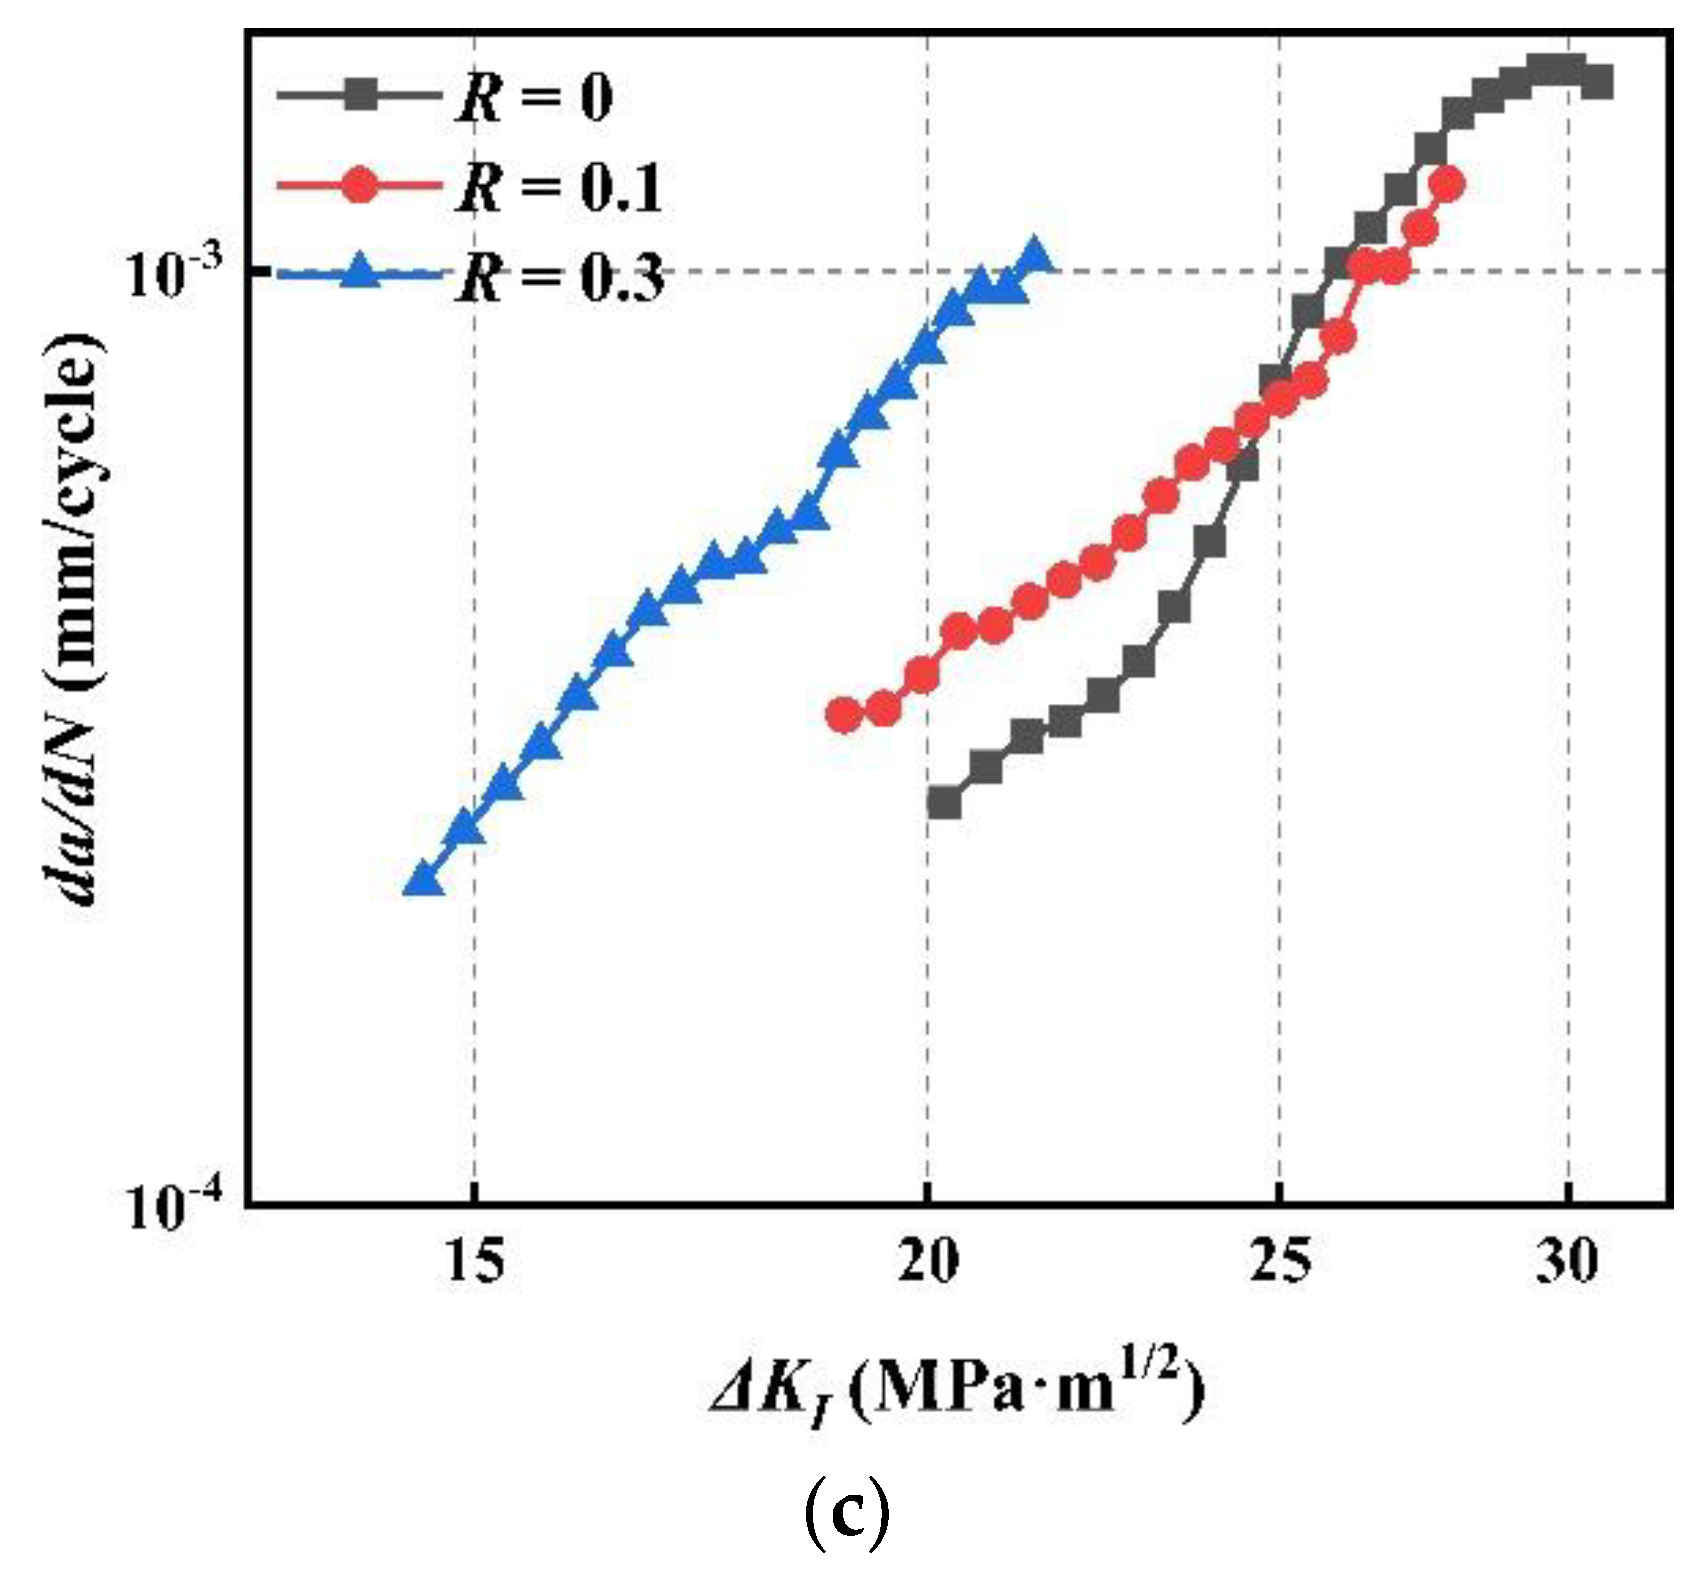
Figure 12 shows the law of FCG under various λ when β is 60° and the stress ratio is 0, 0.1 and 0.3. It is seen that while β = 60° and the driving force of crack growth is the same, a higher FCGR can be obtained at a lower biaxial load ratio, and with the λ increasing, the FCGR becomes lower, which is consistent with the trend in Figure 11. It is shown that when 0 ≤ λ ≤ 1, the load perpendicular to the crack surface decreases with λ increasing, and the load parallel to the crack surface increases with λ. This agrees with the result obtained by Hopper [12]: that the FCGR decreases due to the load parallel to the crack.
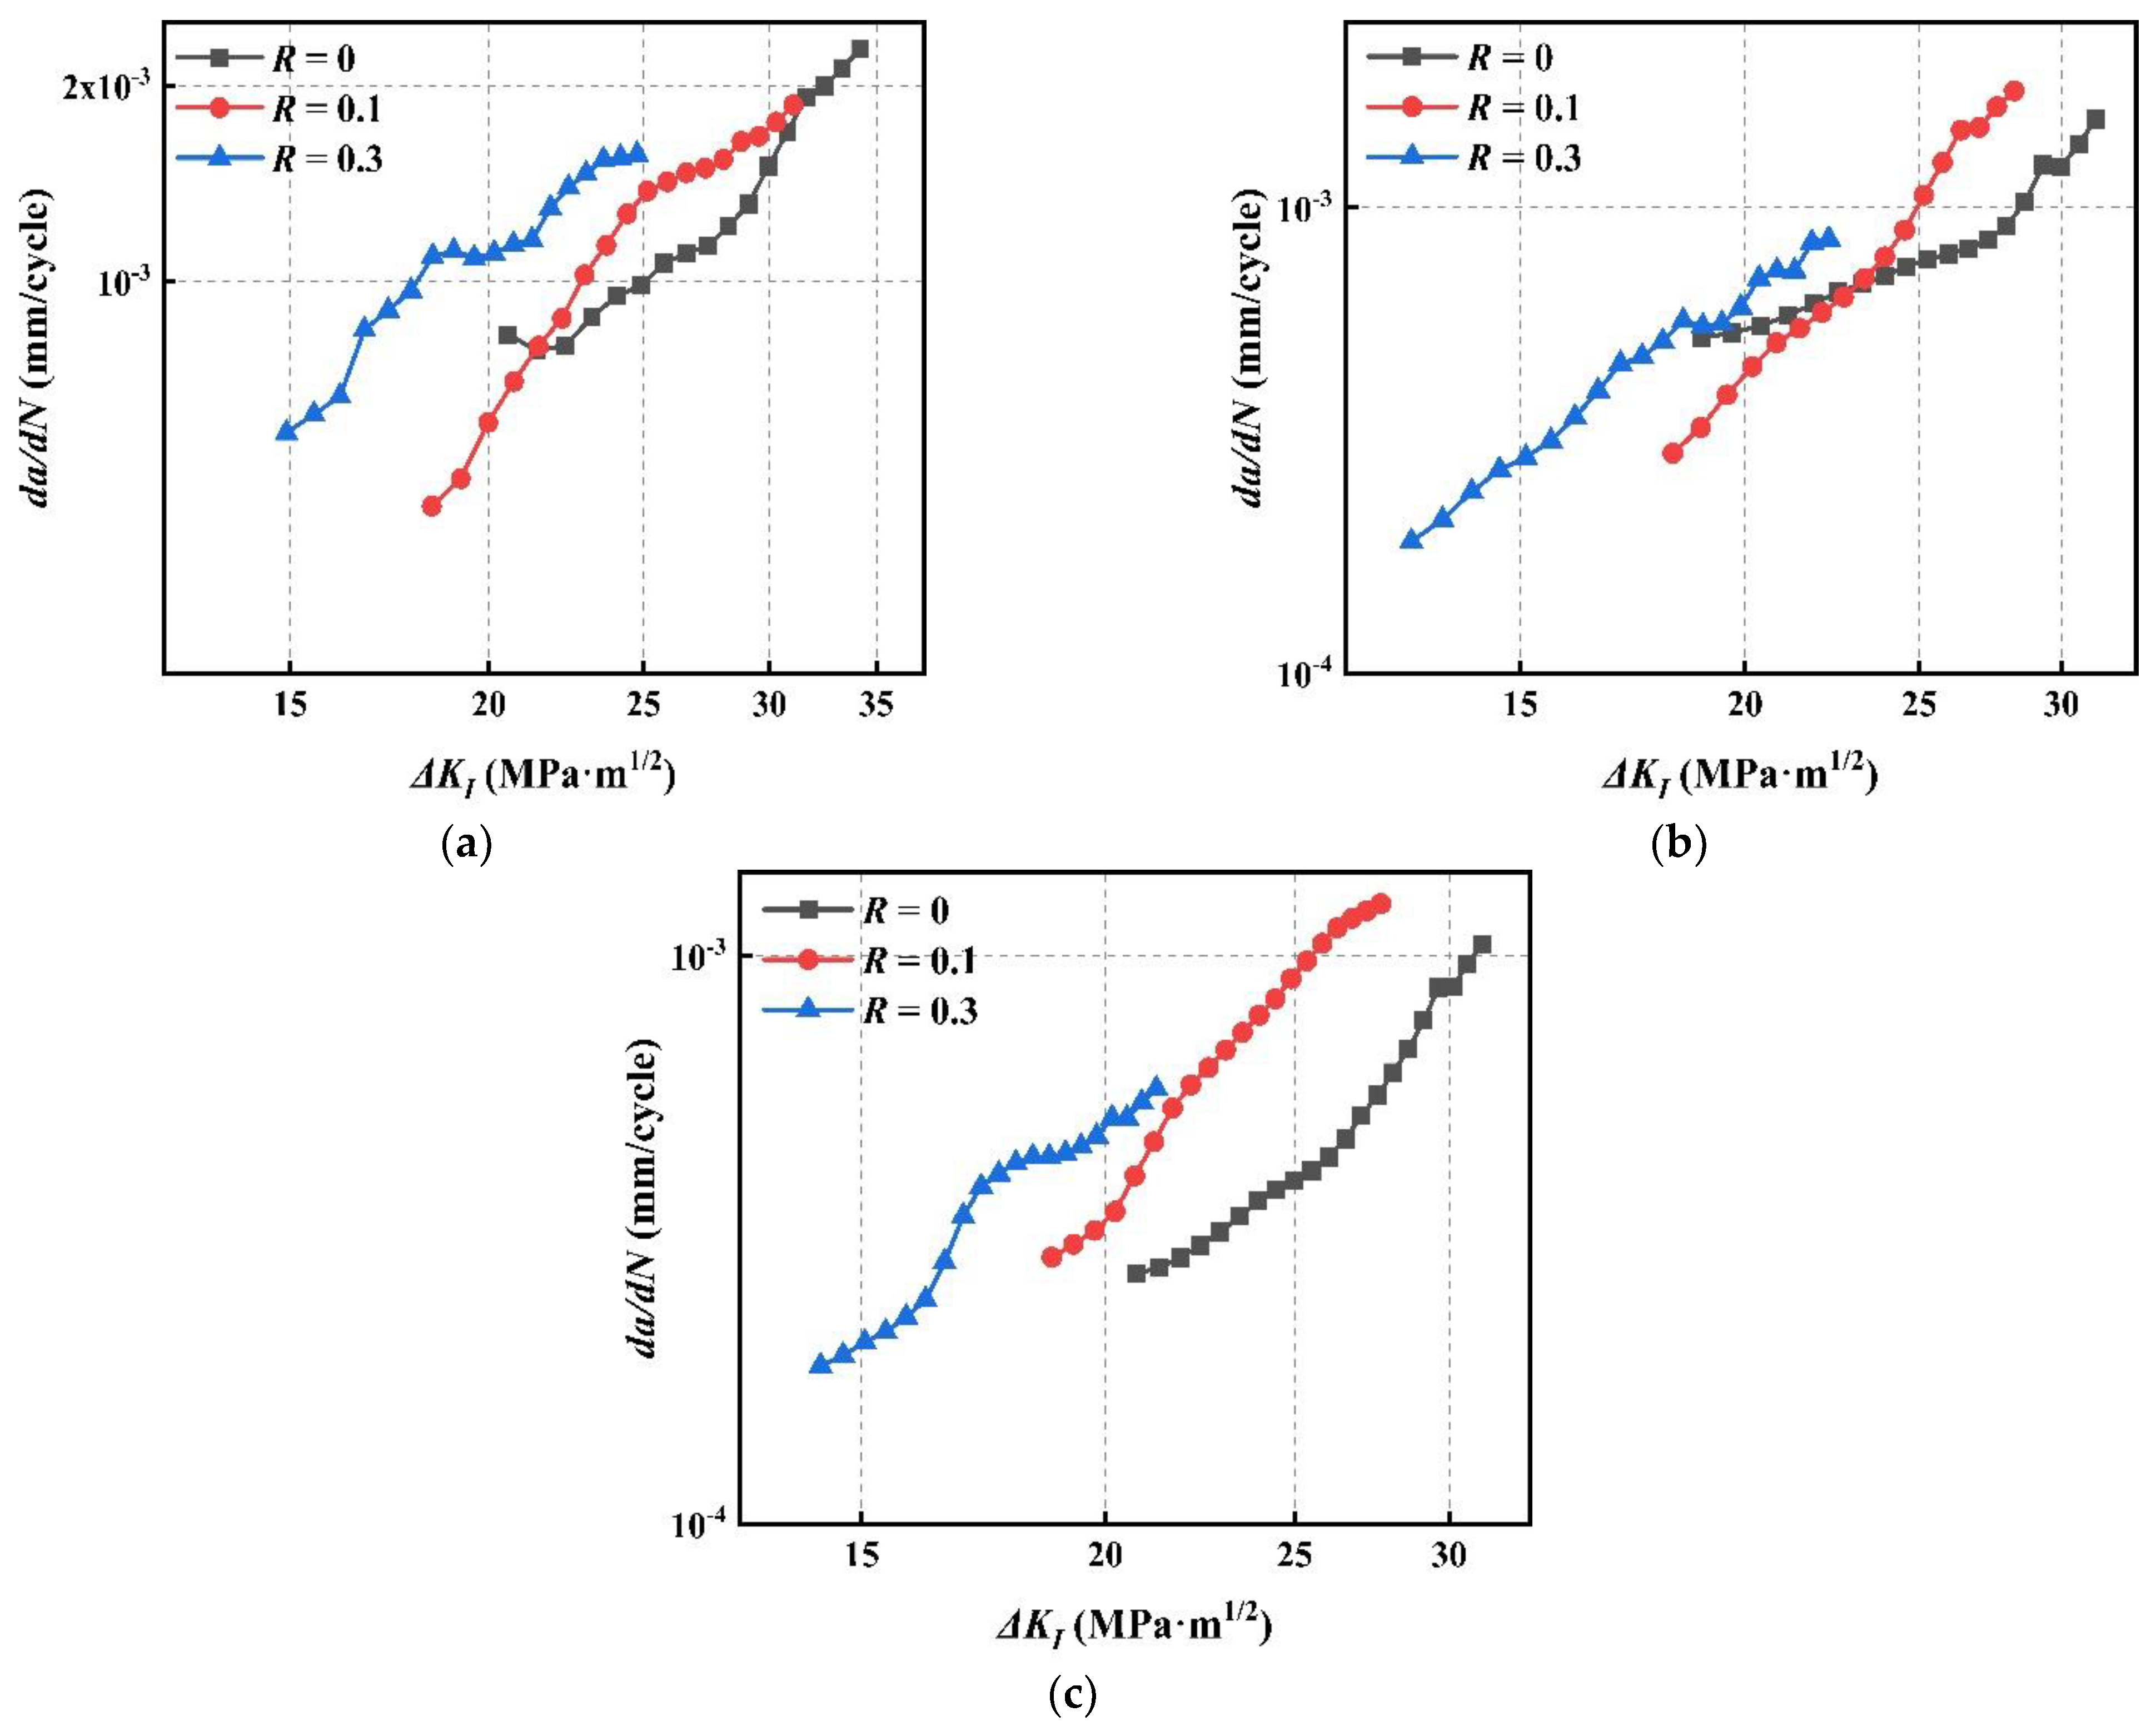
Figure 13 shows the law of FCG under various λ when the angle β is 45°. From the general trend, under different λ, the FCGR decreases with λ increasing, which is consistent with the law obtained in Figure 11 and Figure 12. The biaxial fatigue law of 7075-T651, proposed by Lee, [15] shows that the mixed-mode I–II FCGR increases with the decrease of λ.
In Figure 11, Figure 12 and Figure 13, the variation of FCGR under different biaxial load ratios is the same. It shows that the FCGR of both mode I cracks and mixed-mode I–II cracks decreases with the increase of biaxial load ratio λ, which is consistent with the conclusion studied by Liu at R = 0 [19]. Therefore, λ has significant influence on the FCGR of CP-Ti TA2. While 0 ≤ λ ≤ 1, the risk of fatigue crack under uniaxial tensile loading is greater than that under biaxial tensile loading.

5. Fatigue Crack Growth Rate Model

The FCGR of CP-Ti TA2 under different initial crack inclinations, different stress ratios and different biaxial load ratios was studied. The Paris model [35], Kujawski model [36] and Walker model [37] were analyzed based on ∆KI. The Paris formula first expresses the driving force of crack growth as ∆K, which is suitable for the stable stage of FCG without considering the stress ratio. However, the influence of the stress ratio on most materials cannot be ignored, and the classical Paris formula becomes less fitting. For plastic materials, the main driving force of crack propagation is ∆K, and for brittle materials, the main driving force of crack propagation is Kmax [36]. The effect of ∆K and Kmax on crack growth may also depend on the experimental environment and material cycle properties. The Kujawski model takes into account the influence of ∆K and Kmax, which makes the modified Paris formula more applicable. The Walker model adds the influence of stress ratio to the Paris formula, which makes the prediction result of the FCGR model more accurate.

5.1. Paris Model

With the combination of FCGR da/dN and ∆KI, the Paris formula is obtained.
d a / d N = C ( Δ K I ) m
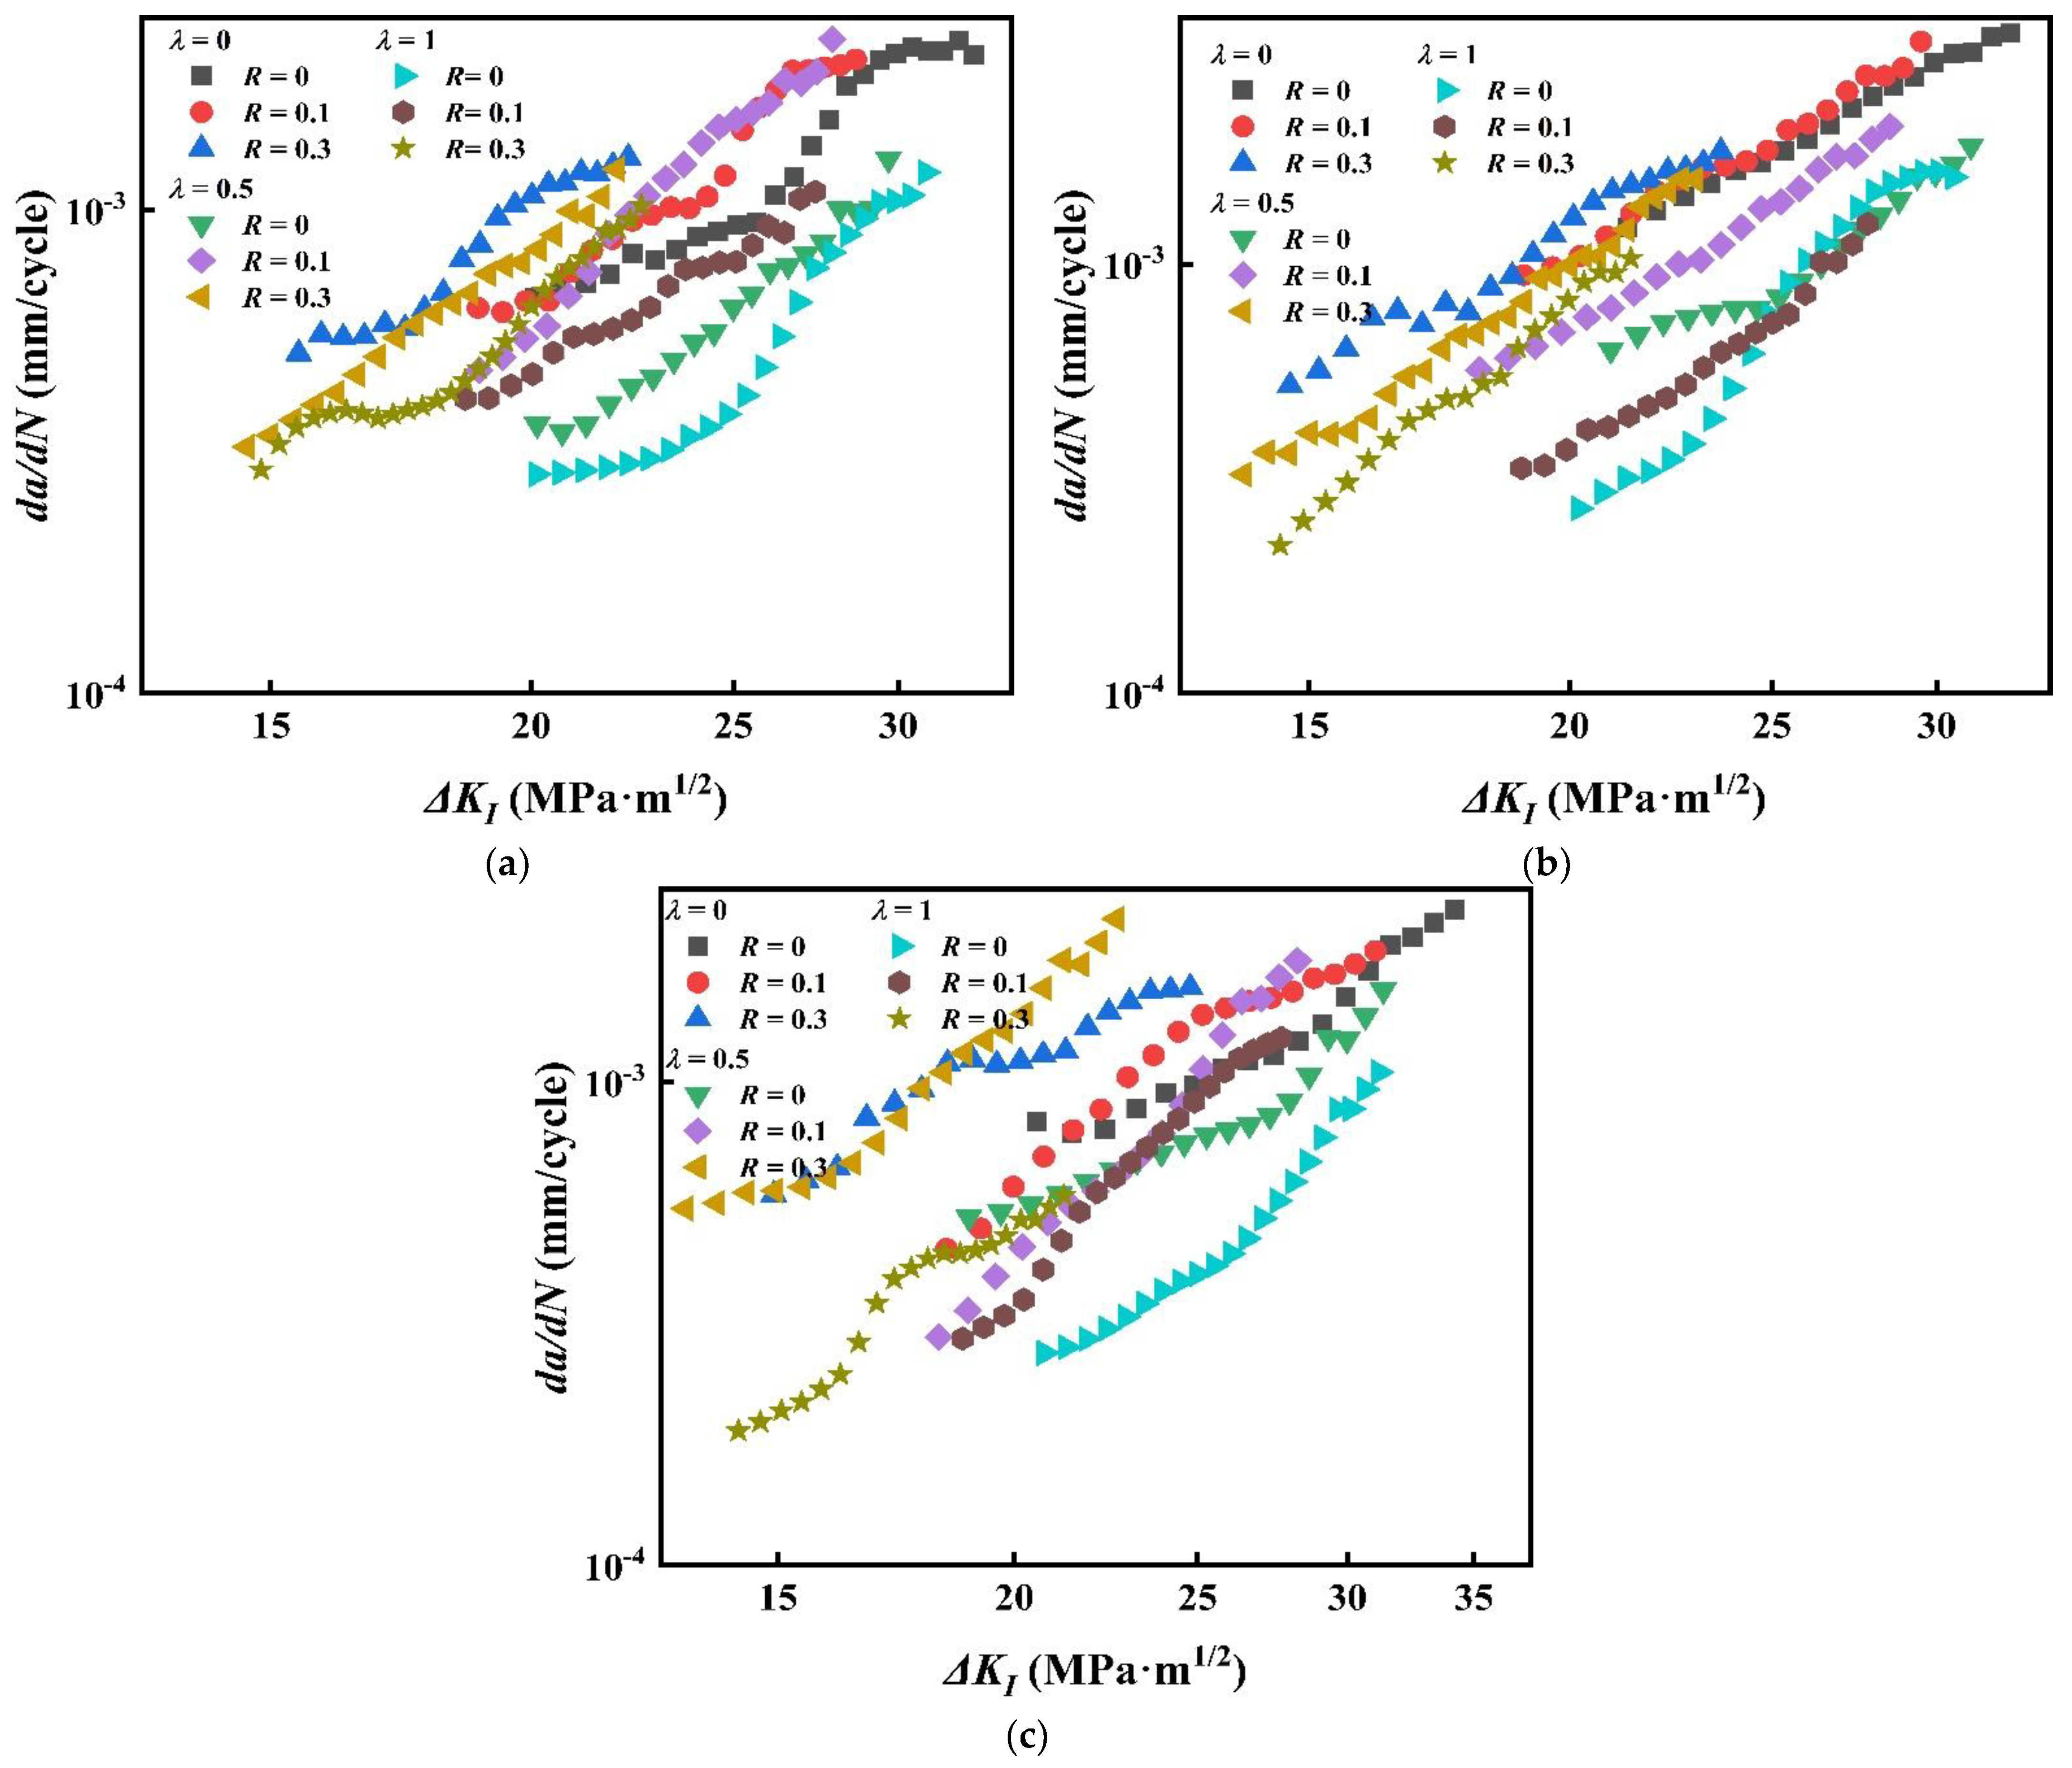
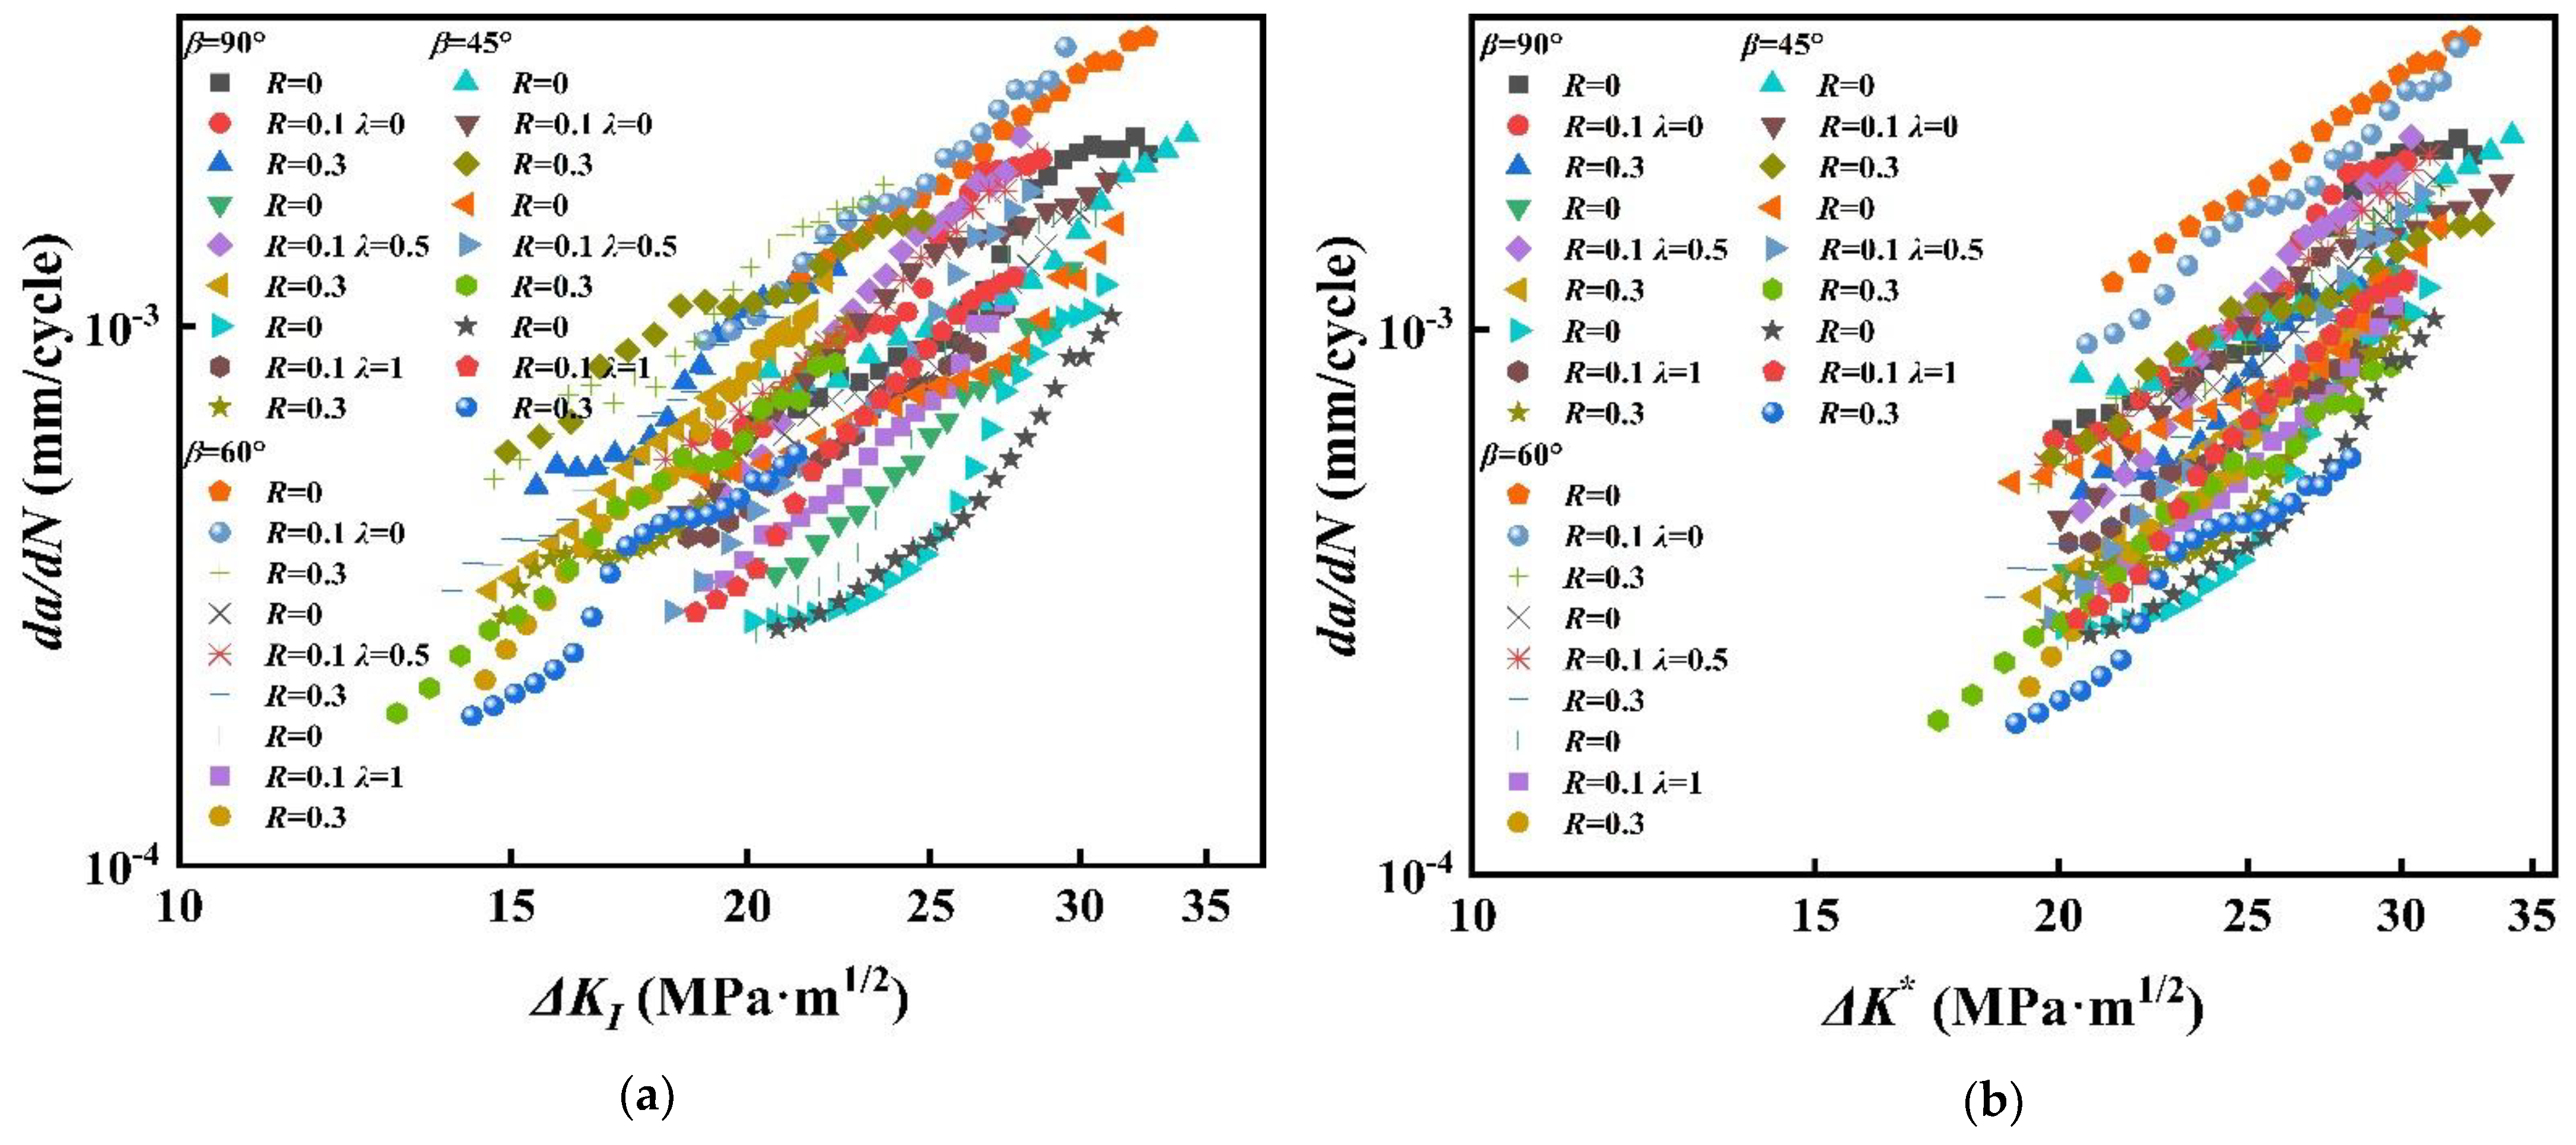
In the above formula, C and m are both material constants. The results of FCGR obtained from the experiment are fitted by the Paris formula to obtain C = 1.079 × 10⁻⁶ and m = 2.131. The data of FCGR obtained are modified by the Paris model and expressed in double logarithmic coordinates in Figure 14.
In Figure 14, the FCGR curves under different stress ratios and biaxial load ratios are compressed into a band, so as to reduce the influence of different factors on the FCGR. But the effect is not ideal. It is found that no matter how the initial inclination of the crack changes, the curve of biaxial load ratio λ= 0, R = 0.3 is at the top, while the curve of biaxial load ratio λ = 1, R = 0 is at the bottom; they are more separate than other data. Through this observation, the effect of the Paris-based model on the FCGR curve under biaxial loading cannot be compressed into a narrow band under different stress ratios. To compare and illustrate the compression curves of the FCGR model more simply and clearly, the discrete error is introduced here. The discrete error S, defined among the FCGR curves under different stress ratio R and under the FCGR curve under stress ratio R = 0 for different models after the test data compression, is shown in Equation (6):
S = i = 1 n [ ( d a / d N ) i ( d a / d N ) R = 0 ] 2 n
In the formula, (da/dN)R=0 is the FCGR of stress ratio R = 0 after compression. (da/dN)i represents the FCGR under different stress ratios after modified fitting and n means the counting points of data.

5.2. Kujawski Model

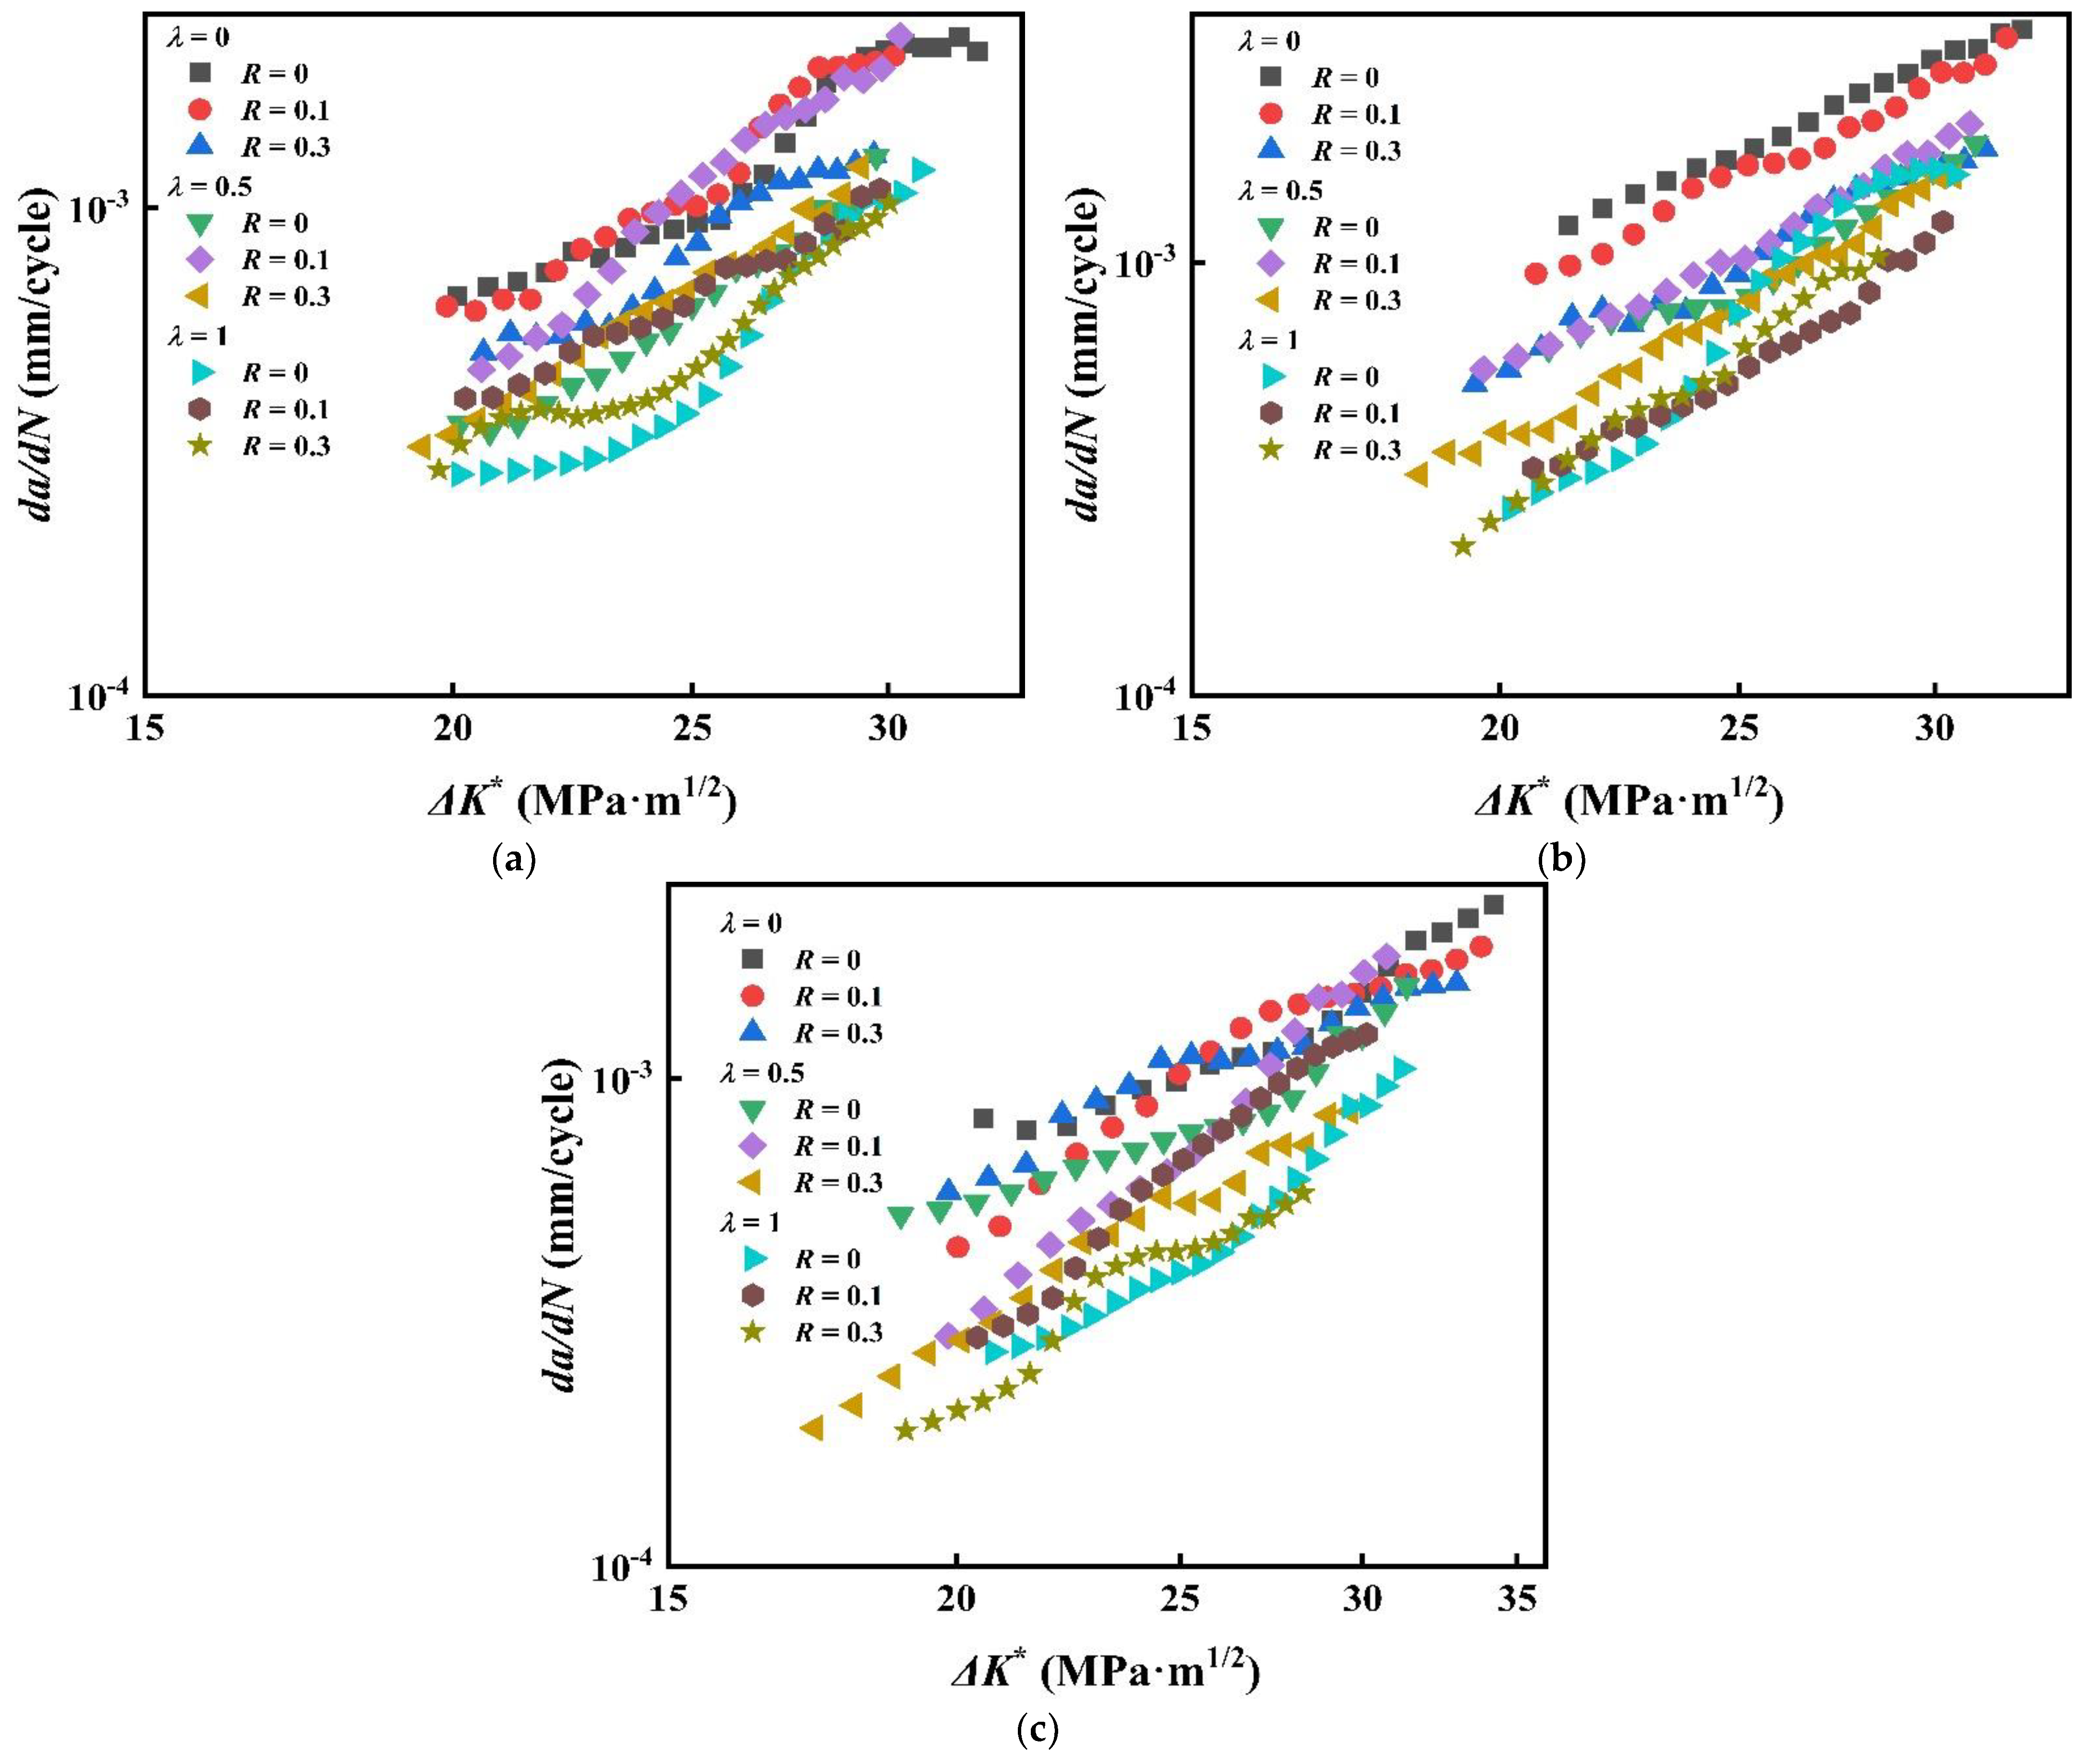
Kujawski [36] put forward a new driving force parameter ∆K* of FCG, which can explain well the FCG behavior of six kinds of aluminum alloys, and why the influence of R on FCG is reduced, that is, the effect of R is reduced. Kujawski found that the crack closure effect wasn’t taken into consideration in the model, which was better than some FCGR models that incorporated the concept of crack closure [38,39,40]. The Kujawski model is followed in Equations (7) and (8). Ck = 1.161 × 10⁻⁸ and mk = 3.452. In this paper, ∆K+ is ∆KI.
d a / d N = C k ( Δ K ) m k
Δ K = ( K max Δ K + ) 0.5
K* is the product index of Kmax and ∆K+, which is 0.5. Kujawski also modified the crack ∆K*, using the parameter αk to consider the relative contribution of Kmax and crack ∆K+ during fatigue crack growth, and developed the driving force parameter model into a more general parameter form, such as Equation (9):
Δ K = ( K max ) α k ( Δ K + ) 1 α k
The parameter αk characterizes the sensitivity of Kmax and ∆K*, which depends on the material and environment. For the FCGR curves of CP-Ti TA2, the parameter αk which can reach the minimum S is 0.78. The FCGR data obtained are modified by the Kujawski model and expressed in Figure 15.
Through the modification of the FCGR data by the Kujawski model, it can be found that, compared with the Paris model, the compressibility of the data is improved and the data discretization error is reduced. Figure 15 shows that no matter what the crack inclination angle is, the discretization degree of the Paris model is higher than that of the Kujawski model, so it is concluded that the Kujawski model could further compress the test data, and the effect is better than that of the Paris model.

5.3. Walker Model

In 1970, Walker [37] put forward an FCGR model considering the effect of R, in order to improve the deficiency of the Paris model. Walker proposed a modified parameter ∆Kw, including R, which can calculate well the FCG behavior with various stress ratios R. The modified parameter ∆Kw formula of driving force proposed by Walker for the Paris model is as follows:
Δ K w = Δ K v ( 1 R ) 1 γ w
It can be modified into the form of Equation (11) by combining it with the Paris formula.
d a / d N = C w ( Δ K v ( 1 R ) 1 γ w ) m w
Among them, Cw, mw is the parameter related to the material and γw is the parameter of the Walker model.
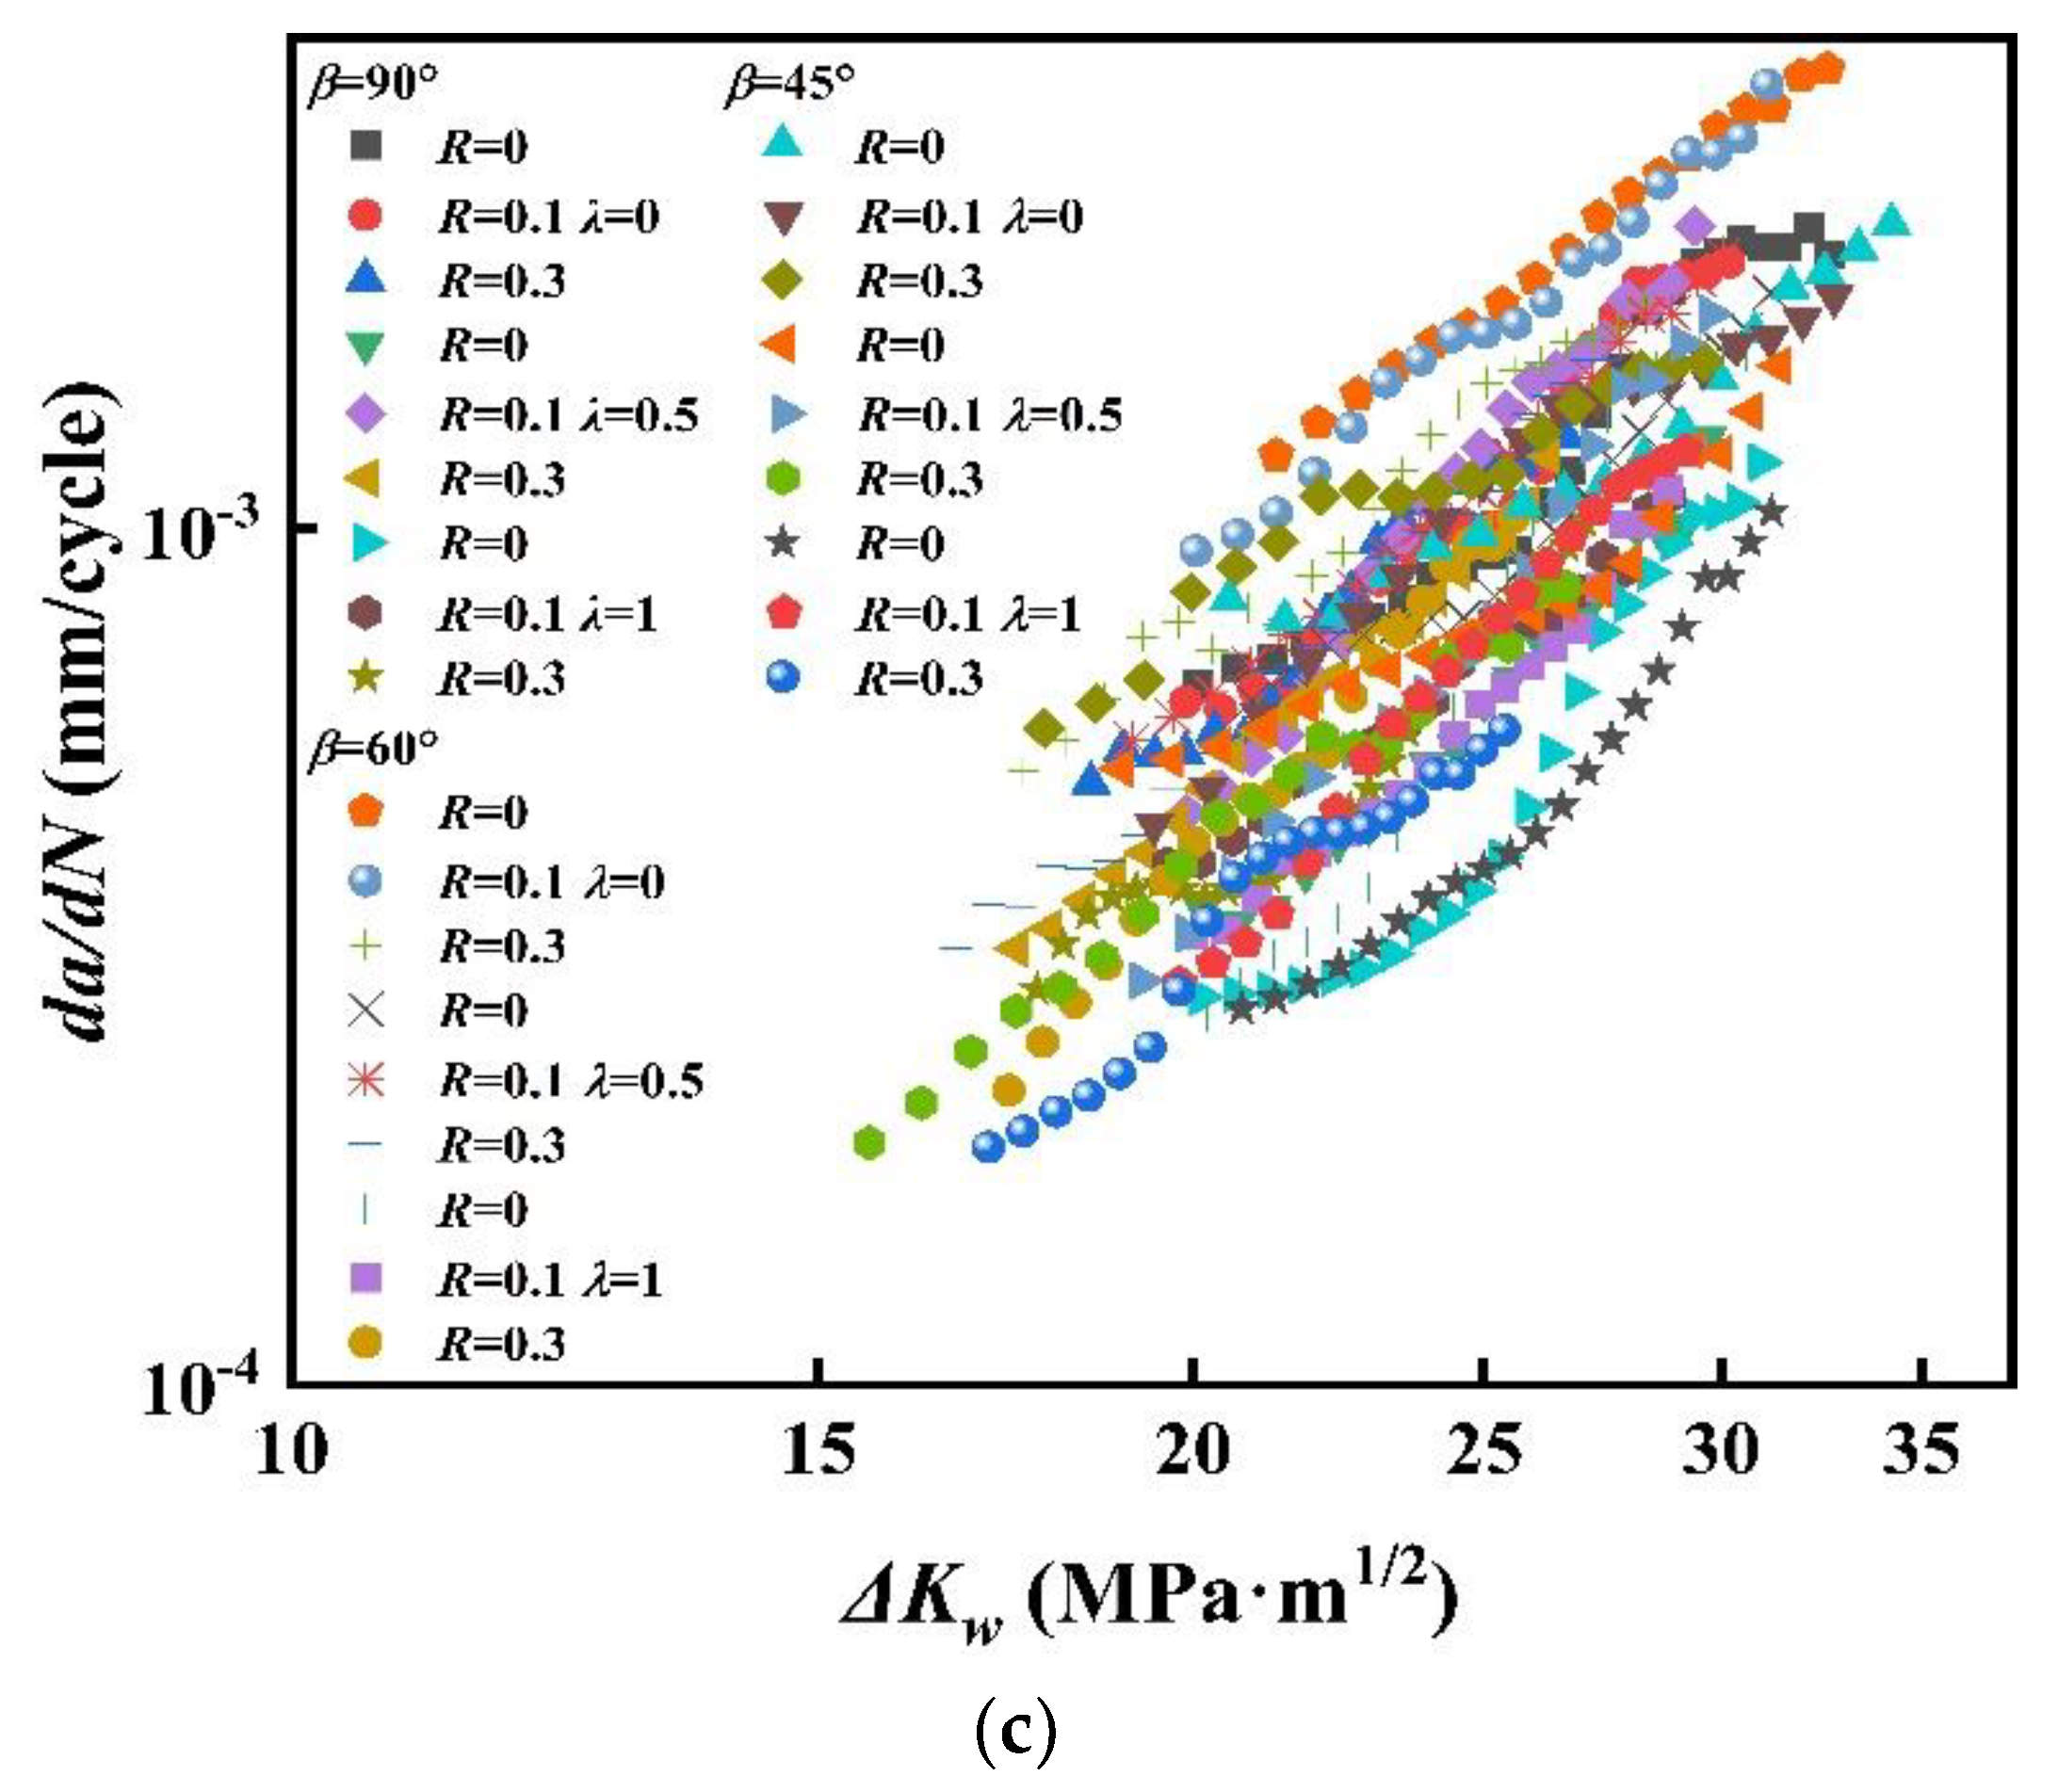
In this paper, the discretization error S can be minimized when the value range of γw is between 0 and 1. For the FCGR data of commercial pure titanium TA2, the γw value with the best compression effect is 0.52. The relationship between the FCGR curve and the inverse ∆Kw is represented in a double logarithmic coordinate system, and Cw = 3.676 × 10⁻⁸, mw = 3.141, as shown in Figure 16.
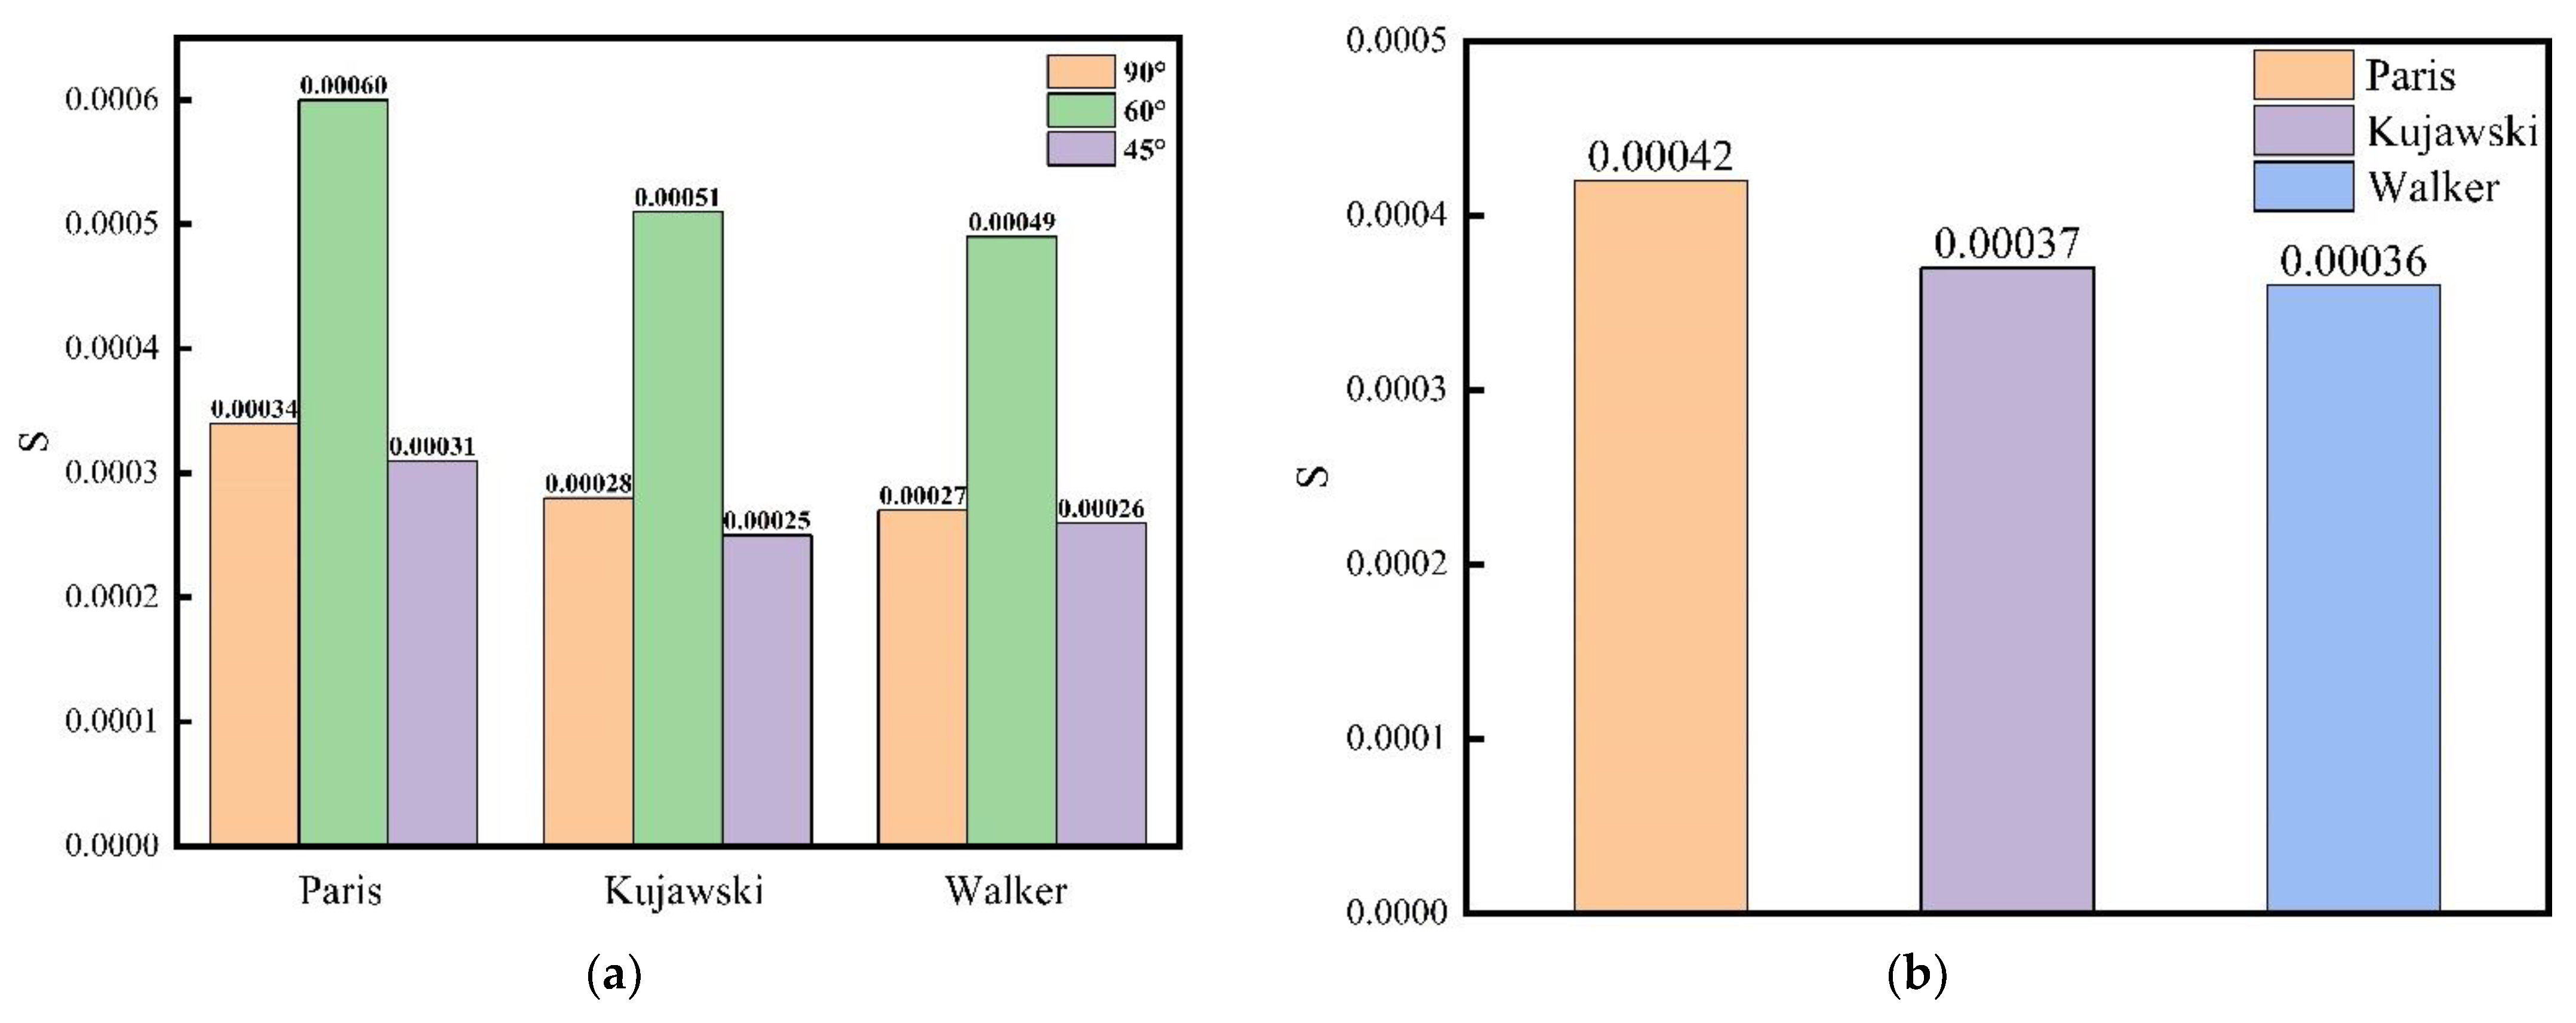
As shown in Figure 16, the FCGR curve has better convergence and compression described by the Walker model than by the Paris model, and slightly better compression compared with the Kujawski model. Figure 17a shows the discrete error histogram of the Paris model, Kujawski model and Walker model. From the chart, it shows that the discretization errors of the Walker model and Kujawski model are similar and better than those of the Paris model. In addition, the discretization error of the Walker model is slightly smaller than which of the Kujawski model at 90° and 60°, while that of the Walker model is slightly higher than that of the Kujawski model when crack inclination angle is 45°.
In Figure 18, all FCGR curves of the Paris model, the Kujawski model and the Walker model are compressed. It shows that the compression effect of the Walker model after considering R is obviously better than that of the Paris model and is equivalent to that of the Kujawski model. Figure 17b is the total discrete error analysis of the Paris model, Kujawski model and Walker model. It clearly shows that the Walker model has a lower discrete error than the Kujawski model. Therefore, it is concluded that both the Walker model and Kujawski model are more suitable than the Paris model, and the Walker model is a little better than the Kujawski model in terms of the discrete error.
By comparing the above three models, it is not difficult to find that they are essentially modifications to the ∆K in the Paris model. Kujawski modifies it to ∆K* and Walker modifies it to ∆Kw, so the nature of these models is consistent, but with their own driving parameters. By fitting a large number of these parameters, the optimal solution is obtained, which can minimize the effect of different factors on FCG.
To sum up, the classical model based on Paris has poor compressibility for biaxial FCGR curves under different initial crack inclination angles and stress ratios. The compressibility of the FCGR curve of the Kujawski model and the Walker model is better than that of the Paris model. Although there is little difference in the data compression effect between the Walker model and the Kujawski model, the Walker model is a little better than the Kujawski model, according to discrete error.

6. Conclusions

In the present paper, the FCG behavior of CP-Ti TA2 under different crack inclination angles, stress ratios and biaxial load ratios is studied. Through the FCG experiment under biaxial loading, the conclusions are as follows:
  • The MTS criterion can be used to predict the propagation initiation angle of uniaxial and biaxial mixed-mode I–II fatigue cracks. The angle of crack initiation increases with initial angle β for crack inclination decreases, and the larger the biaxial load ratio λ is, the smaller the crack initiation angle θ0 is.
  • The mode I and mixed-mode I–II FCGR increases with stress ratio R, and the driving force of crack growth at high R is smaller than that at low R.
  • As a whole, the mode I and mixed-mode I–II FCGR of CS decreases with the increase of λ, while the FCGR curves may cross at the beginning of FCG.
  • The Walker model with stress ratio R and the Kujawski model have better compression effects on fatigue crack growth data than the Paris model. When considering discrete error, the Walker model is more suitable for a biaxial mixed-mode I–II FCGR model of CP-Ti TA2.

Author Contributions

W.-J.B.: conception, methodology, experiment, writing—manuscript and research design. J.-Y.L., Z.-L.T. and G.-Z.Z.: experiment. C.-Y.Z.: formal analysis, conception, investigation and funding acquisition. All authors have read and agreed to the published version of the manuscript.

Funding

This paper was funded by National Natural Science Foundation of China (51975271).

Institutional Review Board Statement

Not Applicable.

Informed Consent Statement

No Applicable.

Data Availability Statement

The data that support the findings of this study are available from the corresponding author upon reasonable request.

Acknowledgments

The authors gratefully acknowledge the financial support of the National Natural Science Foundation of China (51975271).

Conflicts of Interest

The authors declare that they have no conflict of interest.

Abbreviations

FCGfatigue crack growth
FCGRfatigue crack growth rate
CScruciform specimen
MTSmaximum tangential stress
βinitial crack inclination angle
λbiaxial load ratio
Rstress ratio
θ0crack initiation angle
KIstress intensity factor of mode I crack
KIIstress intensity factor of mode II crack
KIstress intensity factor amplitude of mode I crack
KIIstress intensity factor amplitude of mode II crack
Kvequivalent stress intensity factor amplitude
Sdiscrete error

References

  1. Wang, Q.; Liu, X.; Wang, W.; Yang, C.; Xiong, X.; Fang, H. Mixed mode fatigue crack growth behavior of Ni-Cr-Mo-V high strength steel weldments. Int. J. Fatigue 2017, 102, 79–91. [Google Scholar] [CrossRef]
  2. Kalnaus, S.; Fan, F.; Jiang, Y.; Vasudevan, A.K. An experimental investigation of fatigue crack growth of stainless steel 304L. Int. J. Fatigue 2009, 31, 840–849. [Google Scholar] [CrossRef]
  3. Ma, M.Y.; Wang, B.; Liu, H.Q.; Yi, D.Q.; Shen, F.H.; Zhai, T.G. Investigation of fatigue crack propagation behavior of 5083 aluminum alloy under various stress ratios: Role of grain boundary and Schmid factor. Mater. Sci. Eng. A 2020, 773. [Google Scholar] [CrossRef]
  4. Su, C.Y.; Zhou, C.Y.; Lu, L.; Li, J.; Sun, P.Y.; He, X.H. Effect of Temperature and Dwell Time on Fatigue Crack Growth Behavior of CP-Ti. Metals 2018, 8, 1031. [Google Scholar] [CrossRef] [Green Version]
  5. Lu, L.; Li, J.; Su, C.Y.; Sun, P.Y.; Chang, L.; Zhou, B.B.; He, X.H.; Zhou, C.Y. Research on fatigue crack growth behavior of commercial pure titanium base metal and weldment at different temperatures. Theor. Appl. Fract. Mech. 2019, 100, 215–224. [Google Scholar] [CrossRef]
  6. Wang, X.G.; Gao, Z.L.; Zhao, T.W.; Jiang, Y.Y. An Experimental Study of the Crack Growth Behavior of 16MnR Pressure Vessel Steel. J. Press. Vessel. Technol. 2009, 131, 021402. [Google Scholar] [CrossRef]
  7. Hu, X.A.; Xue, Z.Y.; Ren, T.T.; Jiang, Y.; Dong, C.L.; Liu, F.C. On the fatigue crack growth behaviour of selective laser melting fabricated Inconel 625, Effects of build orientation and stress ratio. Fatigue Fract. Eng. Mater. Struct. 2020, 43, 771–787. [Google Scholar] [CrossRef]
  8. Forman, R.G.; Kearney, V.E.; Engle, R.M. Numerical Analysis of Crack Propagation in Cyclic-Loaded Structures. J. Basic Eng. 1967, 89, 459–463. [Google Scholar] [CrossRef]
  9. Rahman, S.; Mohammad, E. Effects of mixed-mode overloading on the mixed-mode I+II fatigue crack growth. Arch. Appl. Mech. 2013, 83, 987–1000. [Google Scholar]
  10. Zhang, P.; Xie, L.Q.; Zhou, C.Y.; He, X.H. Experimental and numerical investigation on fatigue crack growth behavior of commercial pure titanium under I–II mixed mode loading at negative load ratios. Int. J. Fatigue 2020, 138, 105700. [Google Scholar] [CrossRef]
  11. Liu, A.; Dittmer, D. Effect of Multiaxial Loading on Crack Growth. In Volume 2 Compilation of Experimental Data; Northrop Corp.: Hawthorne, CA, USA, 1978; Volume 635. [Google Scholar]
  12. Hopper, C.D.; Miller, K.J. Fatigue crack propagation in biaxial stress fields. J. Strain Anal. Eng. Des. 1977, 12, 23–28. [Google Scholar] [CrossRef]
  13. Yuuki, R.; Akita, K.; Kishi, N. The effect of biaxial stress and changes of state on fatigue crack growth behaviour. Fatigue Fract. Eng. Mater. Struct. 1989, 12, 93–103. [Google Scholar] [CrossRef]
  14. Sunder, R.; Ilchenko, B.V. Fatigue crack growth under flight spectrum loading with superposed biaxial loading due to fuselage cabin pressure. Int. J. Fatigue 2010, 33, 1101–1110. [Google Scholar] [CrossRef]
  15. Lee, E.U.; Taylor, R.E. Fatigue behavior of aluminum alloys under biaxial loading. Eng. Fract. Mech. 2010, 78, 1555–1564. [Google Scholar] [CrossRef]
  16. Yamashita, K.; Endo, M.; McEvily, A.J. OS4-2-1 A Method for the Evaluation of Fatigue Crack Growth Rate under Biaxial Loading. In The Abstracts of ATEM, Proceedings of the International Conference on Advanced Technology in Experimental Mechanics: Asian Conference on Experimental Mechanics 2007.6, Fukuoka, Japan, 12–14 September 2007; The Japan Society of Mechanical Engineers: Tokyo, Japan, 2007; Volume 6, pp. 1–6. [Google Scholar]
  17. Shlyannikov, V.N.; Tumanov, A.V.; Zakharov, A.P. The mixed mode crack growth rate in cruciform specimens subject to biaxial loading. Theor. Appl. Fract. Mech. 2014, 73, 68–81. [Google Scholar] [CrossRef]
  18. Anderson, P.R.G.; Garrett, G.G. Fatigue crack growth rate variations in biaxial stress fields. Int. J. Fract. 1980, 16, 111–116. [Google Scholar] [CrossRef]
  19. Liu, J.Y.; Bao, W.J.; Zhao, J.Y.; Zhou, C.Y. Fatigue Crack Growth Behavior of CP-Ti Cruciform Specimens with Mixed Mode I–II Crack under Biaxial Loading. Materials 2022, 15, 1926. [Google Scholar] [CrossRef]
  20. Misak, H.E.; Perel, V.Y.; Sabelkin, V.; Mall, S. Crack growth behavior of 7075-T6 under biaxial tension-tension fatigue. Int. J. Fatigue 2013, 55, 158–165. [Google Scholar] [CrossRef]
  21. Misak, H.E.; Perel, V.Y.; Sabelkin, V.; Mall, S. Biaxial tension–tension fatigue crack growth behavior of 2024-T3 under ambient air and salt water environments. Eng. Fract. Mech. 2014, 118, 83–97. [Google Scholar] [CrossRef]
  22. Joshi, S.R.; Shewchuk, J. Fatigue-crack propagation in a biaxial-stress field. Exp. Mech. 1970, 10, 529–533. [Google Scholar] [CrossRef]
  23. Zhu, Z.K.; Lu, Z.; Zhang, P.; Fu, W.; Zhou, C.Y.; He, X.H. Optimal Design of a Miniaturized Cruciform Specimen for Biaxial Testing of TA2 Alloys. Metals 2019, 9, 823. [Google Scholar] [CrossRef]
  24. Miao, X.T.; Yu, Q.; Zhou, C.Y. Experiment and numerical investigation on fracture behavior of I–II mixed mode crack for commercial pure Titanium. Theor. Appl. Fract. Mech. 2018, 96, 202–215. [Google Scholar] [CrossRef]
  25. Leevers, P.S.; Radon, J.C.; Culver, L.E. Fracture trajectories in a biaxially stressed plate. J. Mech. Phys. Solids 1976, 24, 381–395. [Google Scholar] [CrossRef]
  26. Williams, J.G.; Ewing, P.D. Fracture under complex stress-The angled crack problem. Int. J. Fract. 1984, 26, 346–351. [Google Scholar] [CrossRef]
  27. Qian, J.; Fatemi, A. Mixed mode fatigue crack growth: A literature survey. Eng. Fract. Mech. 1996, 55, 969–990. [Google Scholar] [CrossRef]
  28. Richard, H.A.; Fulland, M.; Sander, M. Theoretical crack path prediction. Fatigue Fract. Eng. Mater. Struct. 2005, 28, 3–12. [Google Scholar] [CrossRef]
  29. Erdogan, F.; Sih, G.C. On the Crack Extension in Plates Under Plane Loading and Transverse Shear. J. Basic Eng. 1963, 85, 519–525. [Google Scholar] [CrossRef]
  30. Meng, Y.X.; Gao, H.; Yan, Y.Z.; Gao, L.L. Effects of phase difference and stress ratio on biaxial tension–tension fatigue crack propagation behavior of rolled ZK60 magnesium alloy. Mater. Today Commun. 2020, 24, 101159. [Google Scholar] [CrossRef]
  31. Dubey, S.; Soboyejo, A.B.O.; Soboyejo, W.O. An investigation of the effects of stress ratio and crack closure on the micromechanisms of fatigue crack growth in Ti-6AL-4V. Acta Mater. 1997, 45, 2777–2787. [Google Scholar] [CrossRef]
  32. Ahmed, T.; Yavuz, A.; Turkmen, H.S. Fatigue crack growth analysis of biaxially loaded hole-edge cracks using boundary cracklet method (BCM). Fatigue Fract. Eng. Mater. Struct. 2021, 44, 2693–2705. [Google Scholar] [CrossRef]
  33. Jha, S.K.; Ravichandran, K.S. Effect of Mean Stress (Stress Ratio) and Aging on Fatigue-Crack Growth in a Metastable Beta Titanium Alloy, Ti- 10V-2Fe-3Al. Metall. Mater. Trans. A Phys. Metall. Mater. Sci. 2000, 31, 703–714. [Google Scholar] [CrossRef]
  34. Zhang, Z.H.; Yang, S.; Lin, J.W. Fatigue crack growth rate of Ti-6Al-4V considering the effects of fracture toughness and crack closure. Chin. J. Mech. Eng. 2015, 28, 409–415. [Google Scholar] [CrossRef]
  35. Paris, P.; Erdogan, F. A Critical Analysis of Crack Propagation Laws. J. Basic Eng. 1963, 85, 528–533. [Google Scholar] [CrossRef]
  36. Kujawski, D. A fatigue crack driving force parameter with load ratio effects. Int. J. Fatigue 2001, 23, 239–246. [Google Scholar] [CrossRef]
  37. Walker, K. The Effect of Stress Ratio During Crack Propagation and Fatigue for 2024-T3 and 7075-T6 Aluminum. ASTM STP 1970, 462, 1–14. [Google Scholar]
  38. Krenn, C.R.; Morris, J.W. The compatibility of crack closure and K max dependent models of fatigue crack growth. Int. J. Fatigue 1999, 21, 147–155. [Google Scholar] [CrossRef]
  39. Newman, J.C. A finite element analysis of fatigue crack closure. ASTM STP 1976, 590, 281–301. [Google Scholar]
  40. Schijve, J. Some formulas for the crack opening stress level. Eng. Fract. Mech. 1981, 14, 461–465. [Google Scholar] [CrossRef]
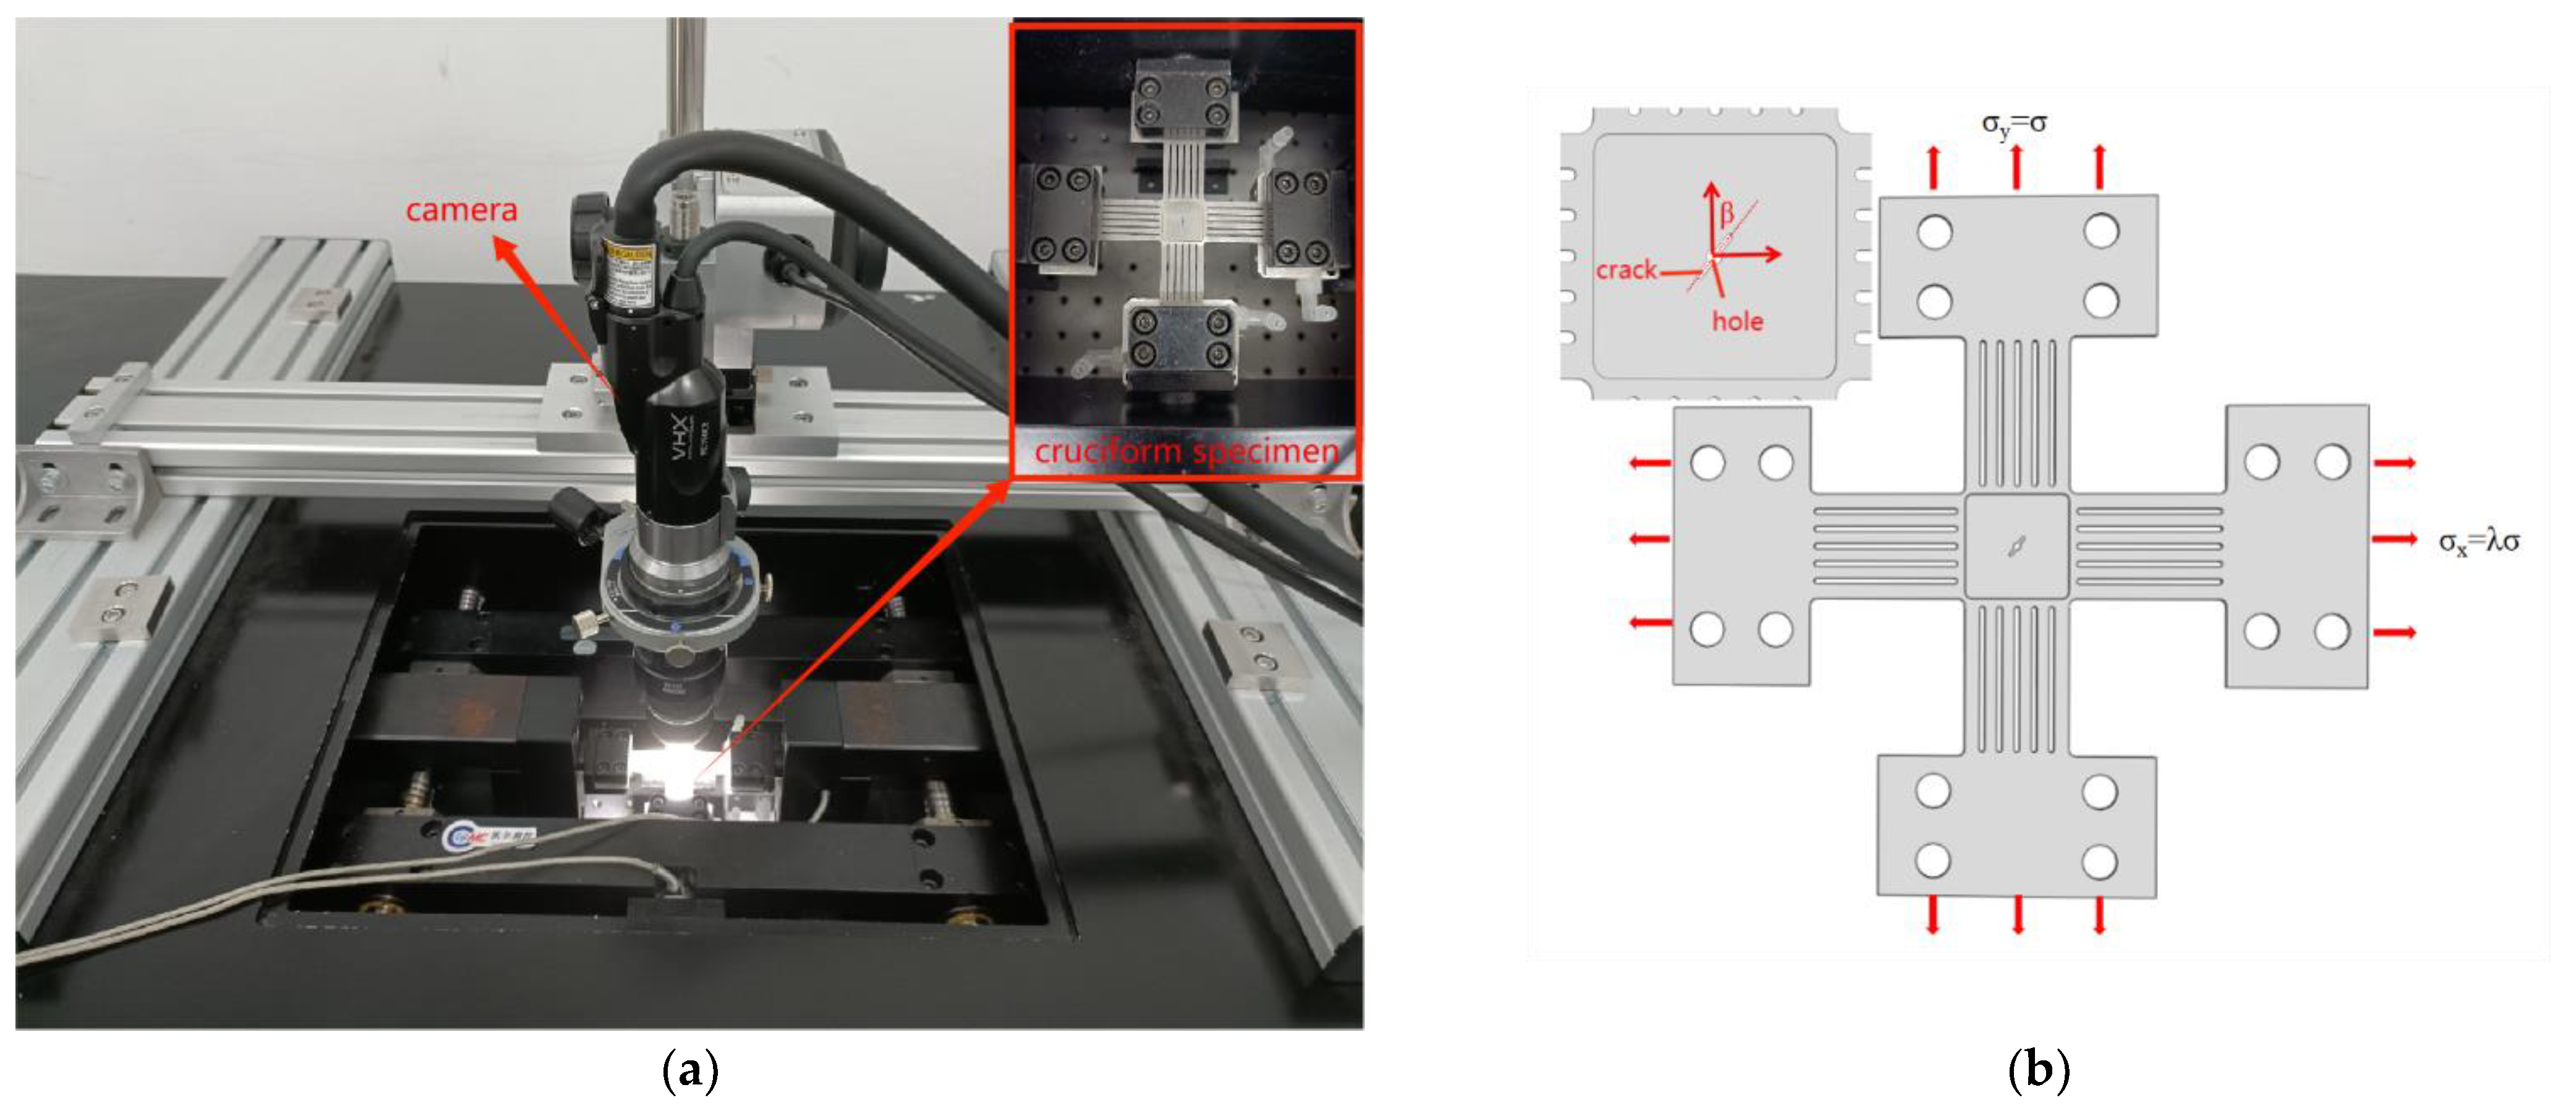
Figure 1. (a) Biaxial fatigue test machine. (b) The cruciform specimen (λ = 0, 0.5 and 1).
Crystals 12 01530 g001
Figure 2. Propagation path under crack inclination angle 90°. (a1) β = 90°, λ = 0, R = 0. (a2) β = 90°, λ = 0, R = 0.1. (a3) β = 90°, λ = 0, R = 0.3. (b1) β = 90°, λ = 0.5, R = 0. (b2) β = 90°, λ = 0.5, R = 0.1. (b3) β = 90°, λ = 0.5, R = 0.3. (c1) β = 90°, λ = 1, R = 0. (c2) β = 90°, λ = 1, R = 0.1. (c3) β = 90°, λ = 1, R = 0.3.
Crystals 12 01530 g002
Figure 3. Propagation path under crack inclination angle 60°. (a1) β = 60°, λ = 0, R = 0. (a2) β = 60°, λ = 0, R = 0.1. (a3) β = 60°, λ = 0, R = 0.3. (b1) β = 60°, λ = 0.5, R = 0. (b2) β = 60°, λ = 0.5, R = 0.1. (b3) β = 60°, λ = 0.5, R = 0.3. (c1) β = 60°, λ = 1, R = 0. (c2) β = 60°, λ = 1, R = 0.1. (c3) β = 60°, λ = 1, R = 0.3.
Crystals 12 01530 g003
Figure 4. Propagation path under crack inclination angle 45°. (a1) β = 45°, λ = 0, R = 0. (a2) β = 45°, λ = 0, R = 0.1. (a3) β = 45°, λ = 0, R = 0.3. (b1) β = 45°, λ = 0.5, R = 0. (b2) β = 45°, λ = 0.5, R = 0.1. (b3) β = 45°, λ = 0.5, R = 0.3. (c1) β = 45°, λ = 1, R = 0. (c2) β = 45°, λ = 1, R = 0.1. (c3) β = 45°, λ = 1, R = 0.3.
Crystals 12 01530 g004aCrystals 12 01530 g004b
Figure 5. Photos for propagation path under crack inclination angles 90°, 60° and 45°. (a) β = 90°, λ = 0.5, R = 0.1. (b) β = 60°, λ = 0.5, R = 0.1. (c) β = 45°, λ = 0.5, R = 0.1.
Crystals 12 01530 g005
Figure 6. Comparison of experiment and predicted values for crack initiation angle.
Crystals 12 01530 g006
Figure 7. Where β = 60°, λ = 0, R = 0.1, the relationship between ∆KI, ∆KIIand ∆Kv.
Crystals 12 01530 g007
Figure 8. Where β = 90°, the relationship between FCGR and ∆KI under different biaxial load ratios (a) λ = 0 (b) λ = 0.5 (c) λ = 1.
Crystals 12 01530 g008
Figure 9. Where β = 60°, the relationship between FCGR and ∆KI under different biaxial load ratios (a) λ = 0 (b) λ = 0.5 (c) λ = 1.
Crystals 12 01530 g009aCrystals 12 01530 g009b
Figure 10. Where β = 45°, the relationship between FCGR and ∆KI under different biaxial load ratios (a) λ = 0 (b) λ = 0.5 (c) λ = 1.
Crystals 12 01530 g010
Figure 11. Where β = 90°, the relationship between FCGR and ∆KI under different stress ratios (a) R = 0 (b) R = 0.1 (c) R = 0.3.
Crystals 12 01530 g011aCrystals 12 01530 g011b
Figure 12. Where β = 60°, the relationship between FCGR and ∆KI under different stress ratios (a) R = 0 (b) R = 0.1 (c) R = 0.3.
Crystals 12 01530 g012
Figure 13. Where β = 45°, the relationship between FCGR and ∆KI under different stress ratios (a) R = 0 (b) R = 0.1 (c) R = 0.3.
Crystals 12 01530 g013
Figure 14. The relationship between ∆KI and da/dN, based on the Paris model. (a) β = 90° (b) β = 60° (c) β = 45°.
Crystals 12 01530 g014
Figure 15. The relationship between ∆KI and da/dN, based on the Kujawski model. (a) β = 90° (b) β = 60° (c) β = 45°.
Crystals 12 01530 g015
Figure 16. The relationship between ∆KI and da/dN, based on the Walker model. (a) β = 90° (b) β = 60° (c) β = 45°.
Crystals 12 01530 g016
Figure 17. (a) Discrete error diagram of Paris, Kujawski and Walker models (b)Total discrete error histogram of Paris, Kujawski and Walker models.
Crystals 12 01530 g017
Figure 18. FCGR curve under Paris (a), Kujawski (b) and Walker (c) models.
Crystals 12 01530 g018aCrystals 12 01530 g018b
Table 1. Test scheme of biaxial fatigue crack growth of cruciform specimen.
βλ (λ = σx/σy)Pmax/NR (R = Pmin/Pmax)
90°/60°/45°020000/0.1/0.3
0.5
1
Publisher’s Note: MDPI stays neutral with regard to jurisdictional claims in published maps and institutional affiliations.