Article

Effect of Laser Traverse Speed on the Metallurgical Properties of Fe-Cr-Si Clads for Austenitic Stainless Steel Using Directed Energy Deposition

1
Department of Joining Technology, Korea Institute of Materials Science, Changwon 51508, Korea
2
School of Mechanical Engineering, Pusan National University, Busan 46241, Korea
*
Authors to whom correspondence should be addressed.
Crystals 2022, 12(11), 1531; https://doi.org/10.3390/cryst12111531
Submission received: 26 September 2022 / Revised: 25 October 2022 / Accepted: 25 October 2022 / Published: 27 October 2022

Abstract

:
This study investigated the microstructural and compositional behavior of Fe-Cr-Si clads produced in stainless steel (STS) 316 L with a decreased laser traverse speed using directed energy deposition (DED). The substrate of all specimens was mostly composed of austenite, while the clad region consisted of the δ-ferrite, martensite, and a small amount of retained austenite. The reduced heat input by increasing the laser traverse speed resulted in decreased dilution of the Ni component and the substrate’s unmixed zone, resulting in a gradual decrease (16−1%) in the face-centered cubic (FCC: austenite) phase of the clad region. In addition, in the clad region composed of body-centered cubic (BCC), the fraction of martensite decreased, but the fraction of the δ-ferrite increased by decreasing the heat input. The reason for this was that dense martensite was formed in the entire clad region owing to a sufficient cooling rate for phase transformation and dilution of the Ni component in the 12 mm/s specimen with the highest heat input. Therefore, to predict the corrosion and wear characteristics of the Fe-Cr-Si multilayer clad manufactured in STS316L, the formation of martensite by the dilution of the Ni component should be sufficiently considered.

1. Introduction

Thermoelectric power plants, most petrochemical and nuclear industrial plants operate in extreme environments such as high temperature and pressure, and corrosive contact mediums. As a result, corrosion and cracking or failure may occur in various pressure-retaining parts [1,2,3,4,5]. Therefore, these structural materials require excellent creep properties and wear resistance to withstand extreme temperatures [6,7]. Austenitic stainless steel (STS), used previously as a piping material for high-temperature applications, has excellent corrosion resistance and heat resistance. However, when exposed to extreme environments for a long time, material deterioration may occur due to thermal deformation and oxidation [8,9,10,11,12]. Thus, the use of structural materials with superior high-temperature characteristics is required.
Iron-chromium (Fe-Cr) alloys with excellent creep strength and heat resistance are in the spotlight as materials that can replace austenitic stainless steel [13,14]. To utilize Fe-Cr alloys as nuclear materials, many studies have been conducted on the addition and content control of alloying elements, such as Cr, Si, Al, and Mo [15,16], including evaluating their weldability [17,18]. In addition, studies on the evaluation of microstructure behavior and mechanical properties of Fe-Cr-based alloys according to heat input have been published [19,20,21]. As a result, Fe-Cr alloys, particularly Fe3Si and Cr3Si, formed by adding Si components, were obtained with excellent corrosion and wear resistance [22,23]. Although, many studies are underway to use Fe-Cr alloys and Fe-Cr-Si alloys as nuclear materials, very few have evaluated the wear resistance and corrosion properties of functional layers obtained using Fe-Cr-Si powder [24].
Therefore, this study was conducted as a prior experiment before evaluating the high-temperature and corrosion properties of the deposition specimens obtained using Fe-Cr-Si powder. Fe-Cr-Si single-line clads with various laser traverse speeds were fabricated, and their microstructures and component behaviors were investigated. In addition, the corrosion resistance and abrasion resistance of the Fe-Cr-Si functional layer was predicted through these results.

2. Materials and Experimental Procedures

The Fe-12Cr-2Si powder used in this study was prepared by gas atomization. The particle size distribution was between 60 μm (D10) and 173 μm (D90), with an average diameter of 120 μm for DED-additive manufacturing, as shown in Figure 1. The powder and substrate were Fe-12Cr-2Si and 316L stainless steel, respectively, and their compositions were displayed in Table 1. Each substrate was entirely cleaned and degreased with ethanol prior to deposition. Single-line clads of Fe-Cr-Si were fabricated using N1000 equipment (Makers & Solutions, Korea) equipped with a 1 kW diode-fiber laser system as the radiation source and with a laser diameter of 1.2 mm. In addition, the laser wavelength was 1.64 μm and focal position relative to the surface was 9 mm. The processing conditions for making single-line clads were as follows: laser power of 500 W, powder feed rate of 6 g/min, and laser traverse speed of 12–16 mm/s for the change in the heat input. In addition, to prevent oxidation, an argon atmosphere was applied during the fabrication of single-line clads. The schematics of DED additive manufacturing for the fabrication of single-line clads were shown in Figure 2. To analyze the microstructural and componential behavior, the cross-sections of the clad specimens were mechanically polished using silicon carbide papers (400–1200 grit), followed by diamond suspensions of 3 and 1 μm. Finally, the microstructure was observed by polishing for 30 min through colloidal silica. The macroscopic shapes of the single-line cladding were observed using the backscattered electron (BSE) mode of scanning electron microscopy (SEM, MIRA I LMH, Tescan, Brno, Czech Republic). To confirm the component behavior of each clad specimen by decreasing the laser traverse speed, line and mapping analyses were performed using electron probe microanalysis (EPMA, JXA-8530F, JEOL, Tokyo, Japan) with an acceleration voltage of 15 kV, a probe current of 100 nA, and a holding time of 20 ms, respectively. In addition, electron backscattered diffraction (EBSD with orientation imaging microscopy (OIM) analysis) was applied to observe the phase and microstructural behavior, such as the growth behavior of dendrites and the phase content.
The hardness distribution of each cladding due to the heat input increase was determined by measuring the hardness at 70 μm intervals from the upper bead of the clad to the substrate. At this time, the Vickers hardness (LM-248AT, LECO, St. Joseph, MI, USA) was performed using a load of 100 gf (0.98 N) with 10 s loading cycles. Subsequently, a precise microstructure analysis was performed, using SEM to distinguish the phases according to the hardness.

3. Results and Discussion

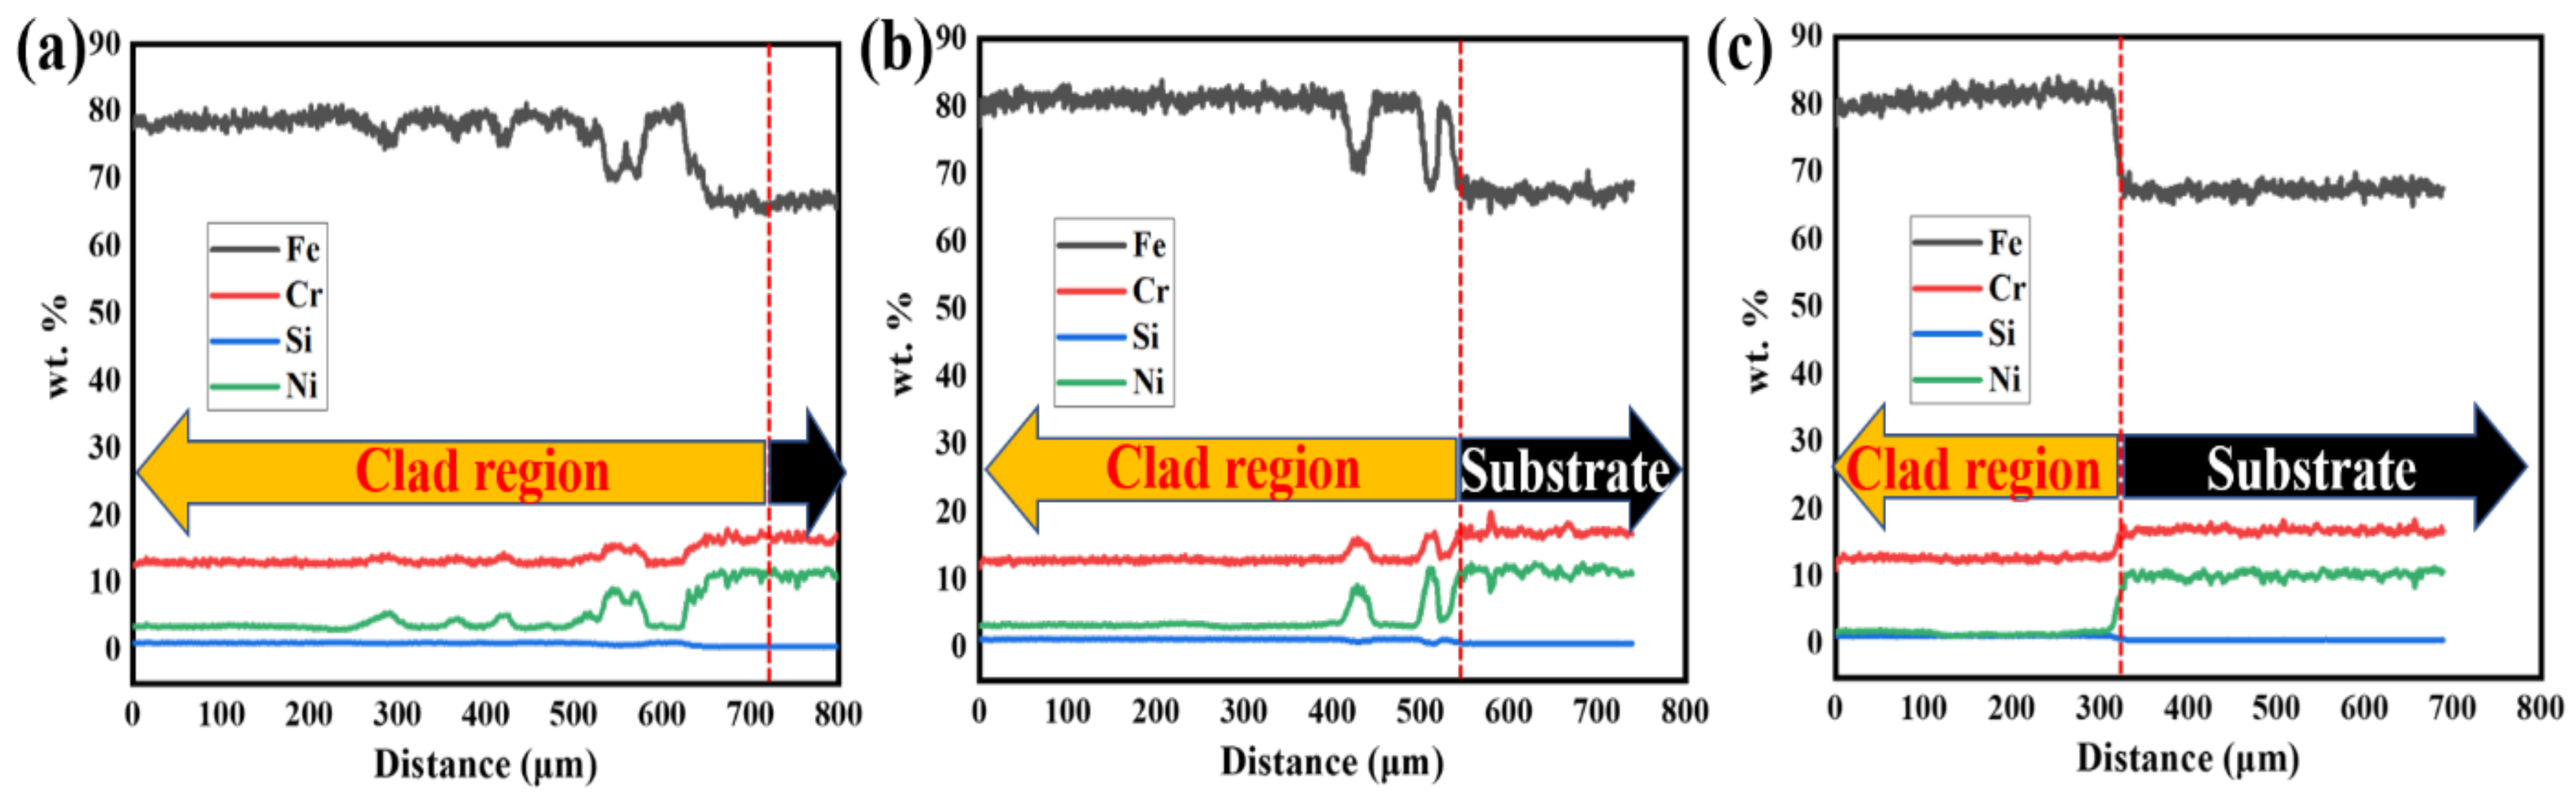
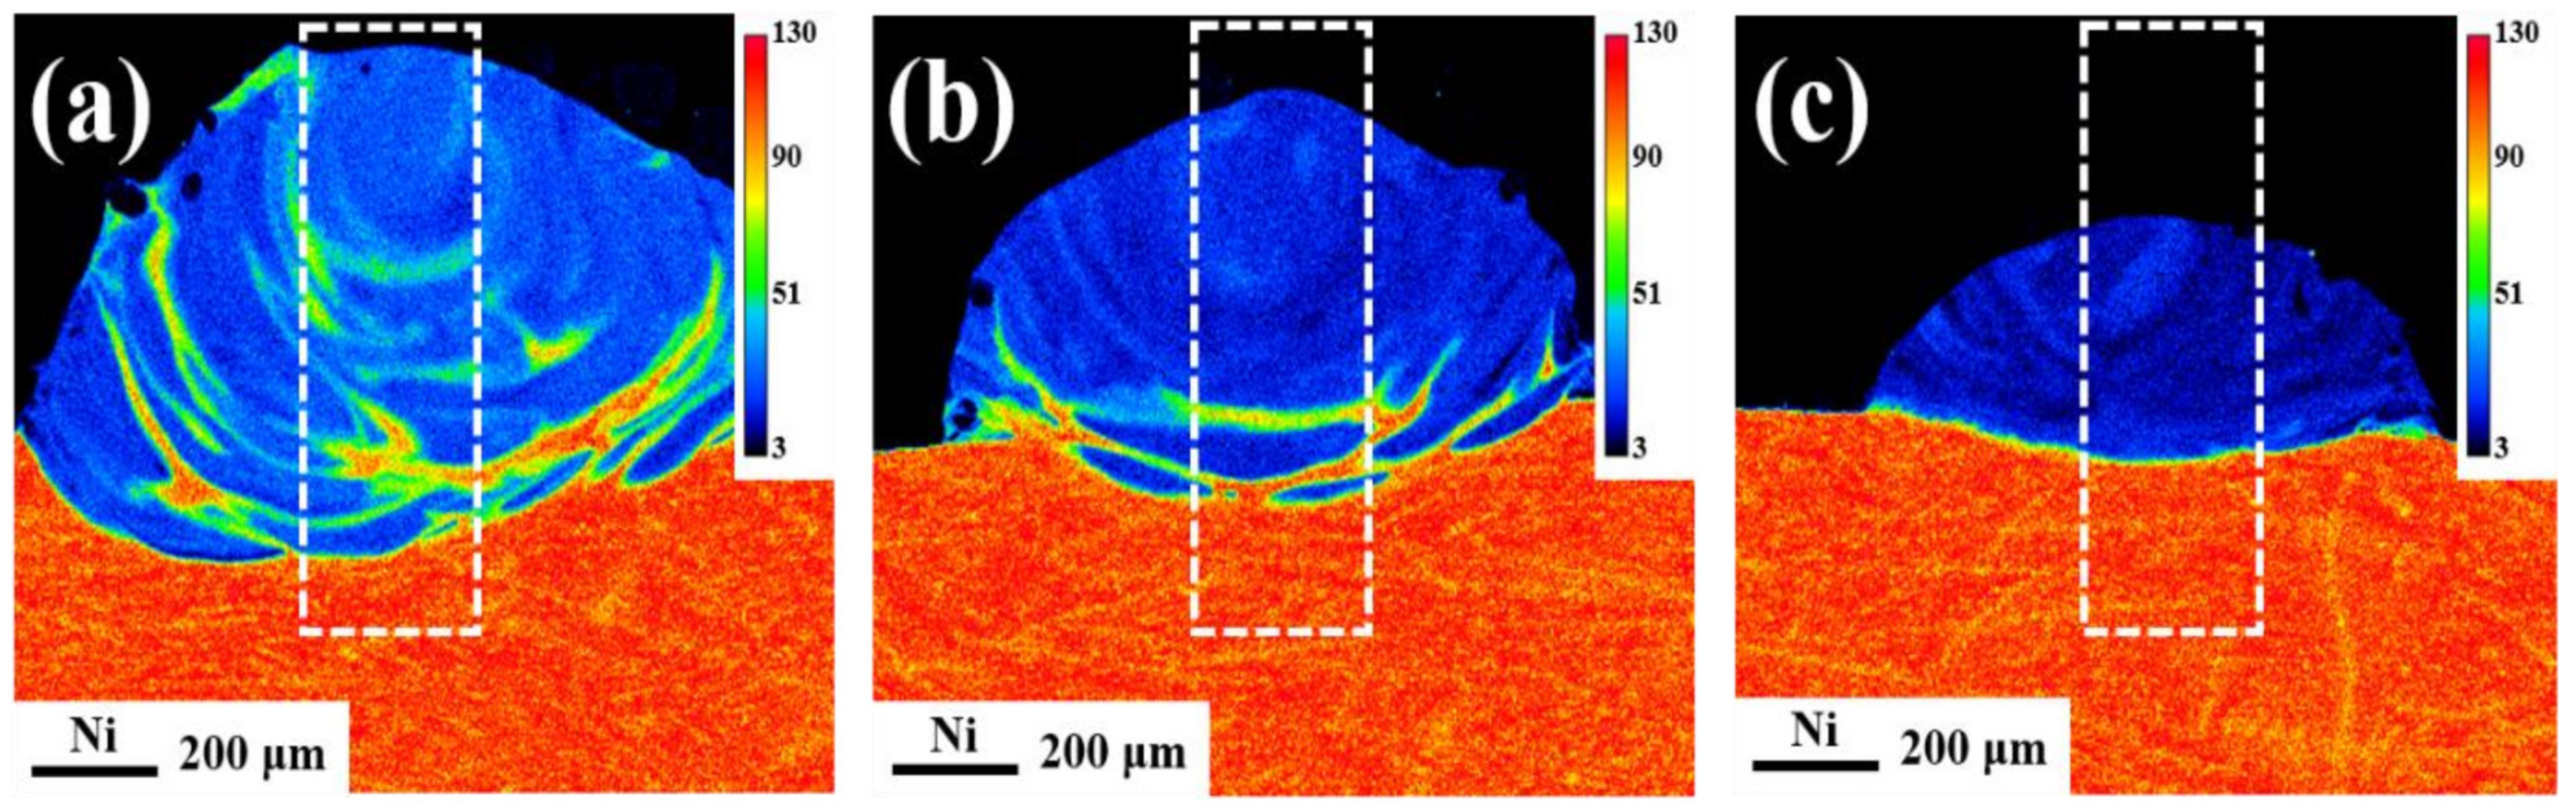
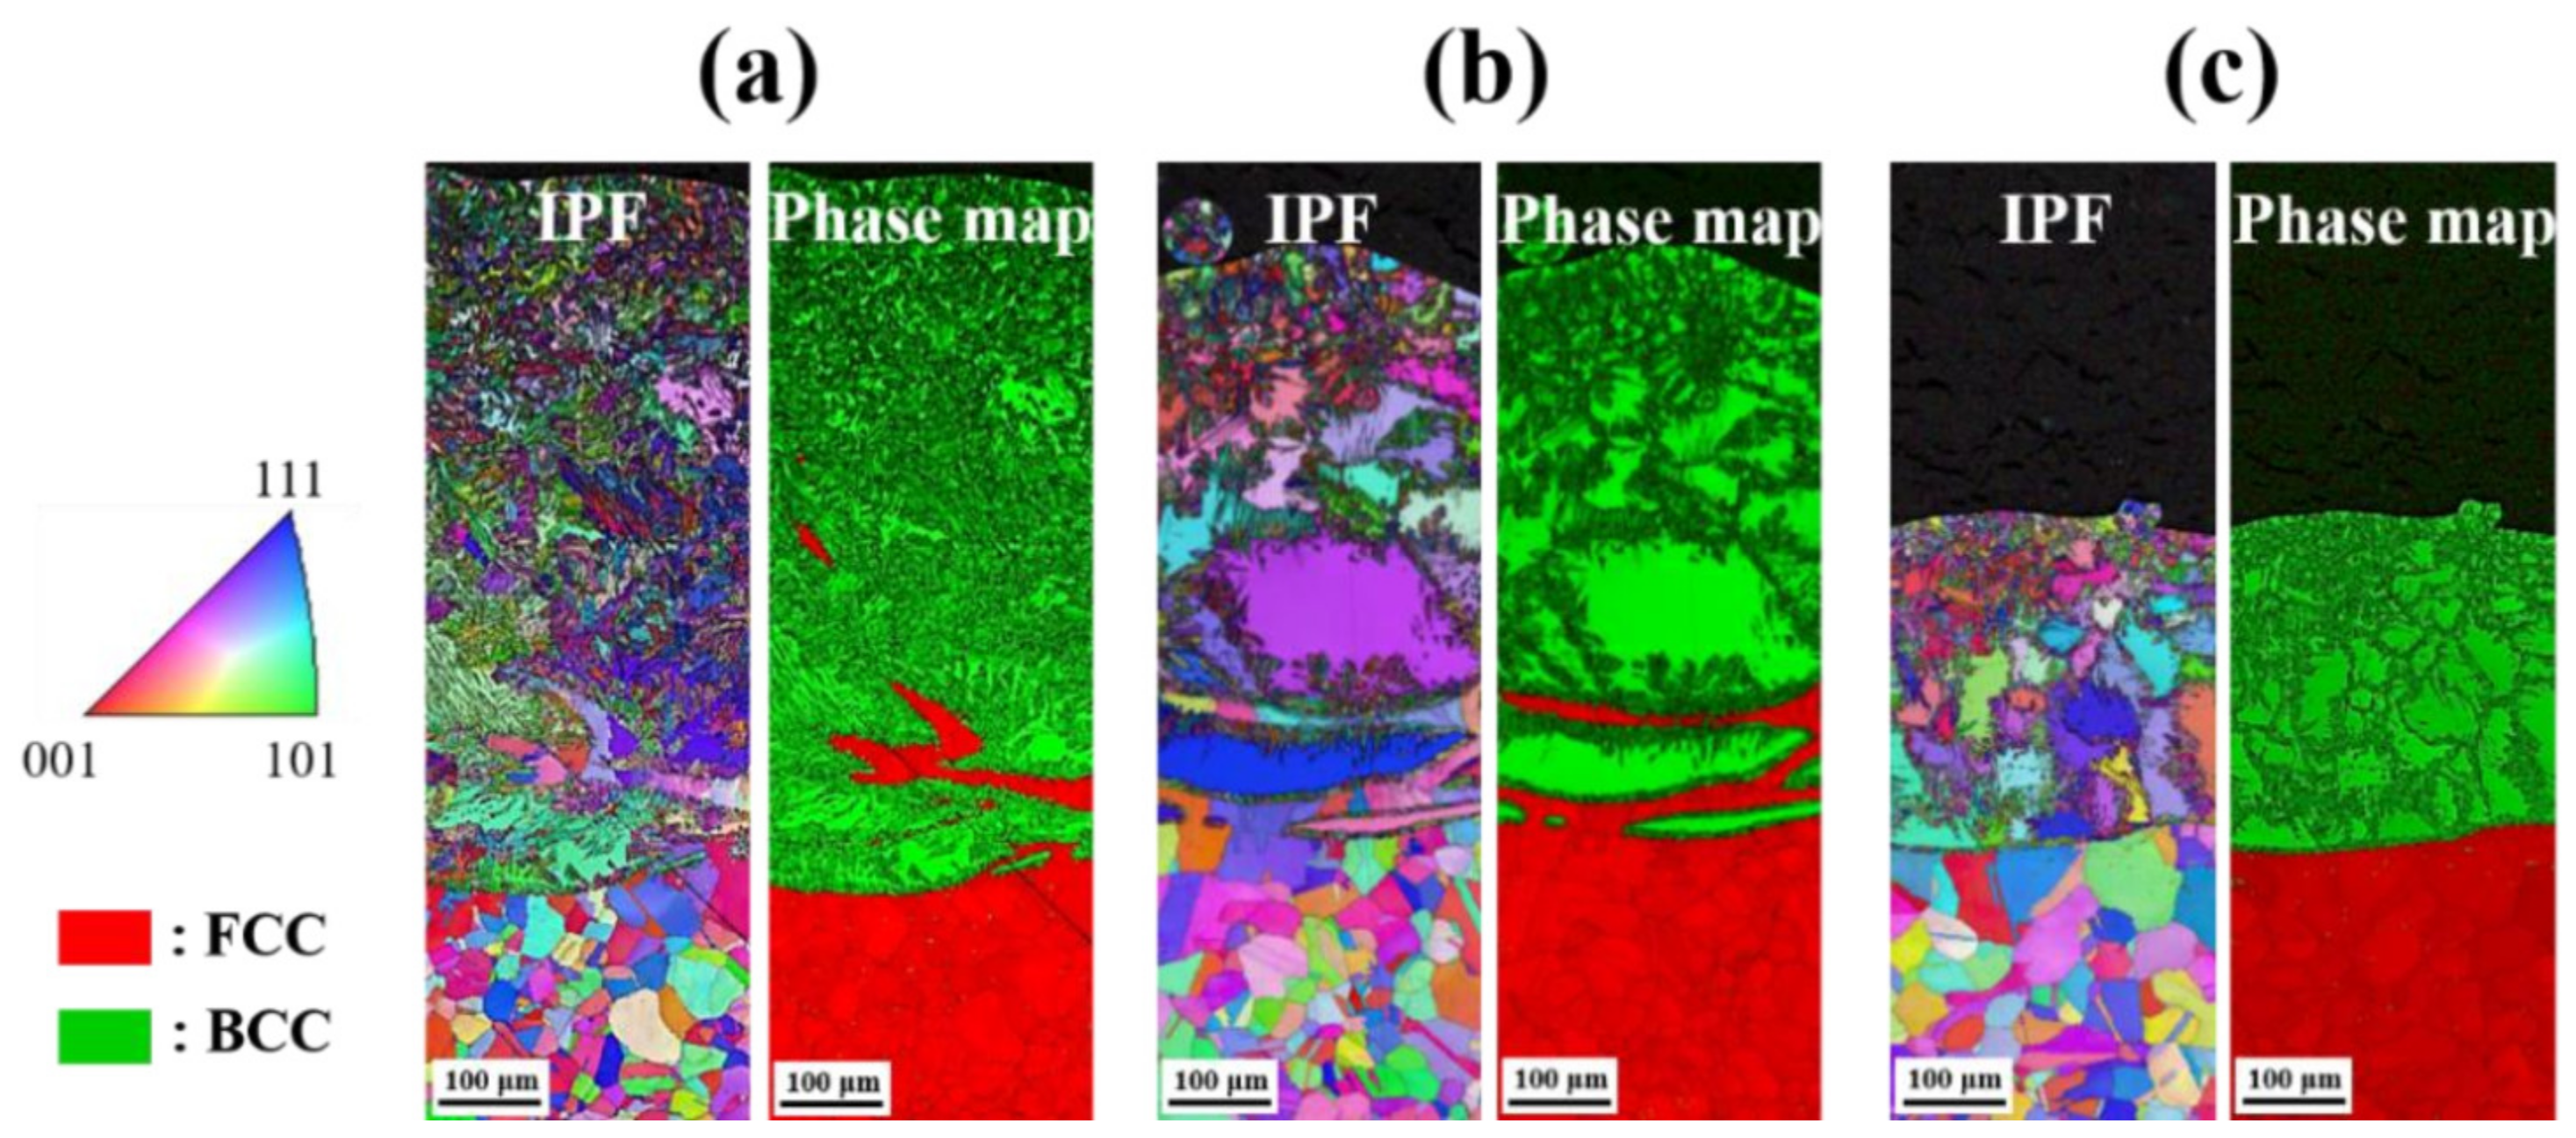
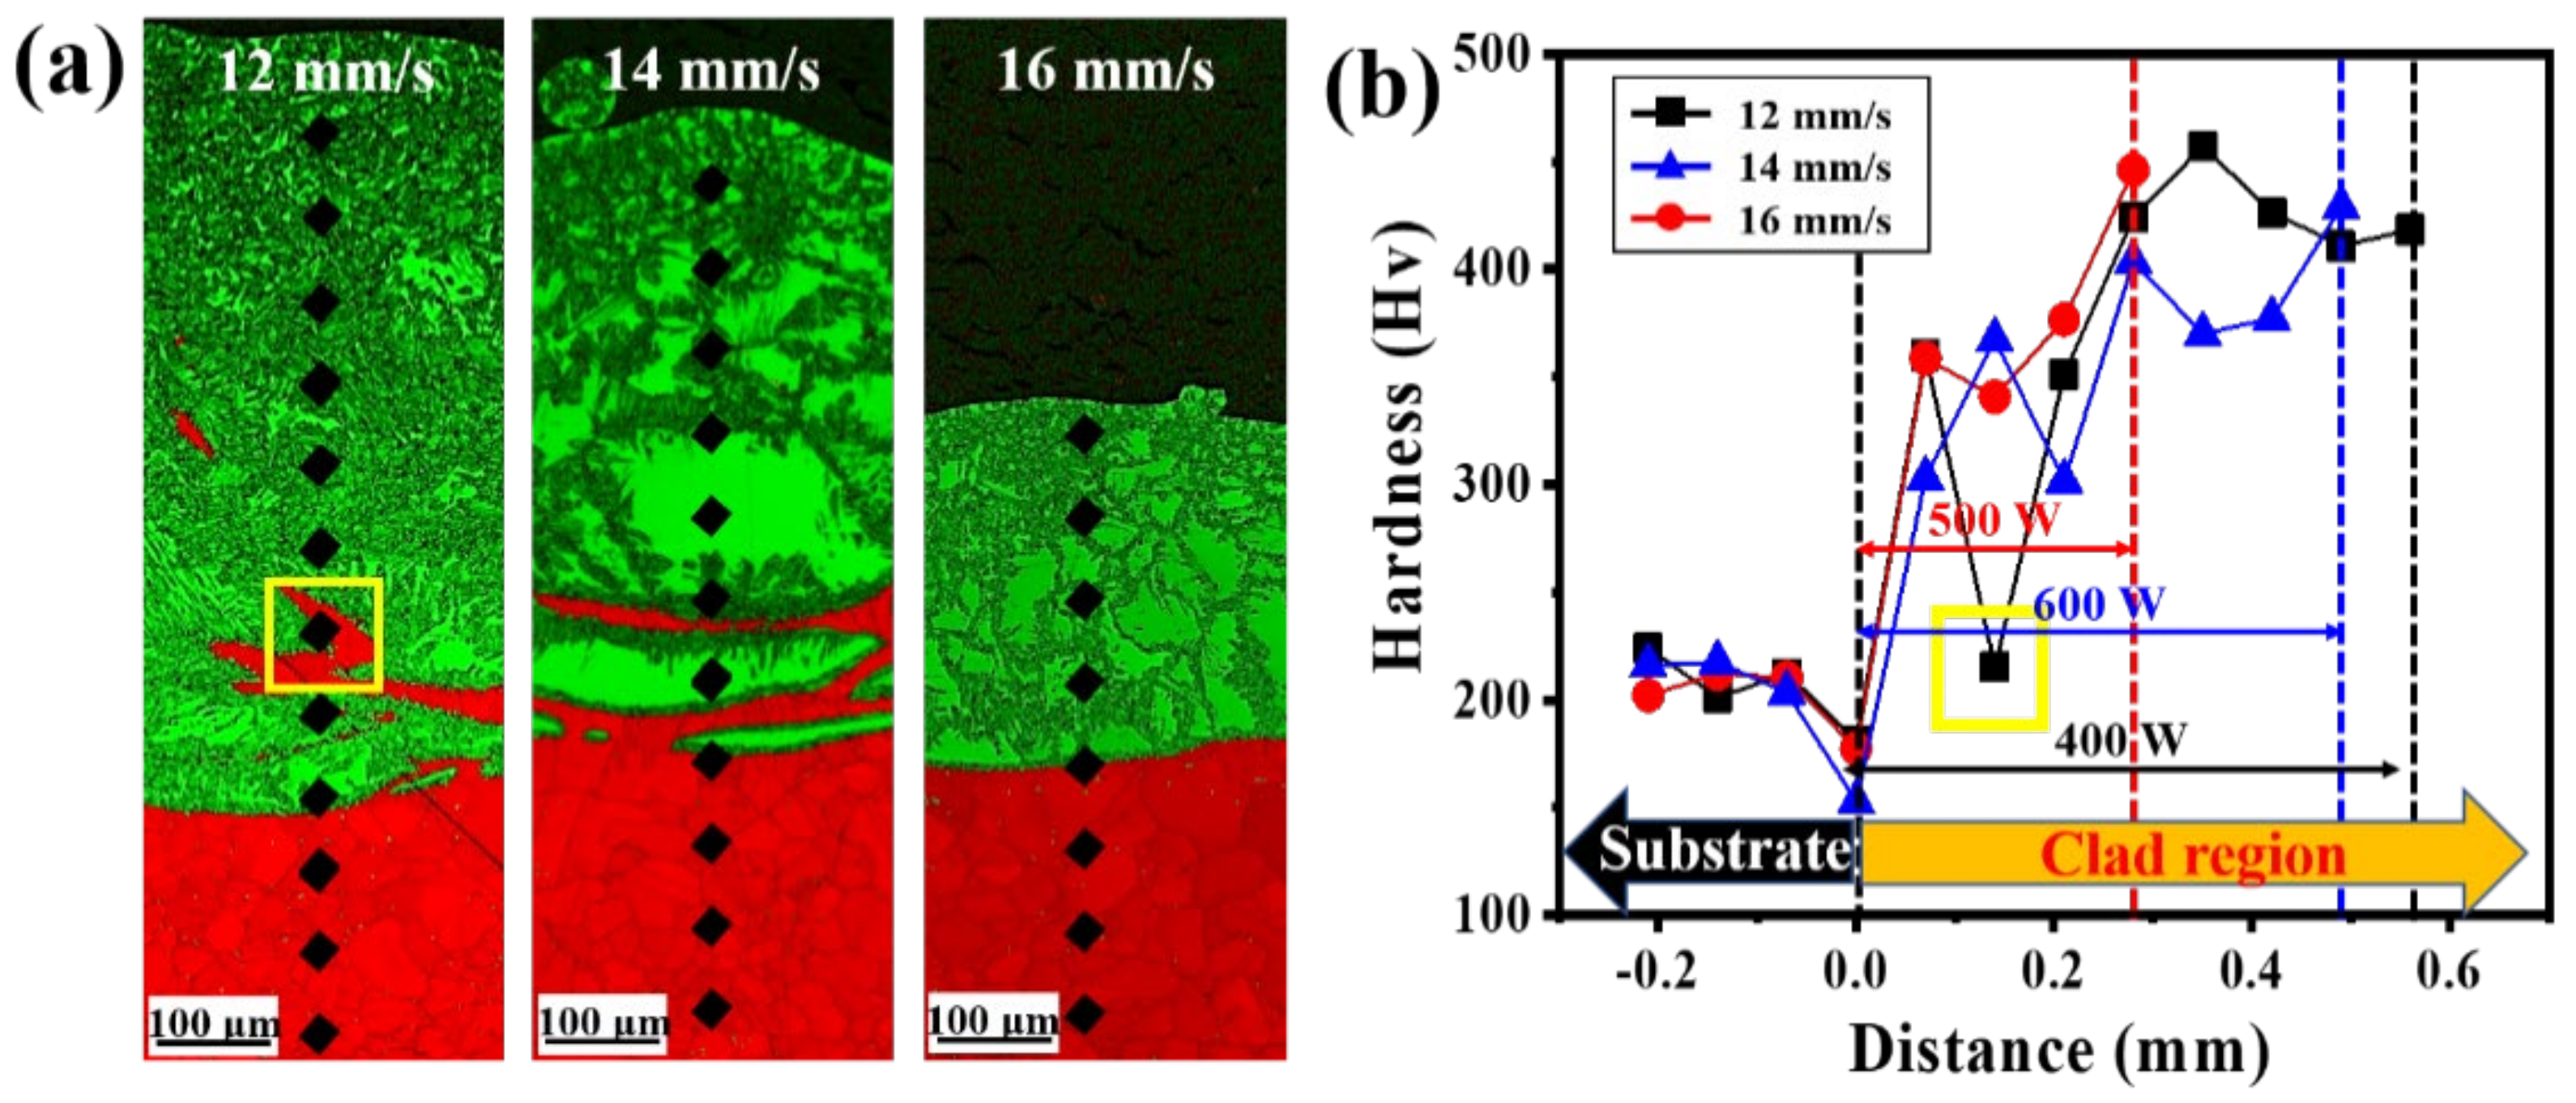
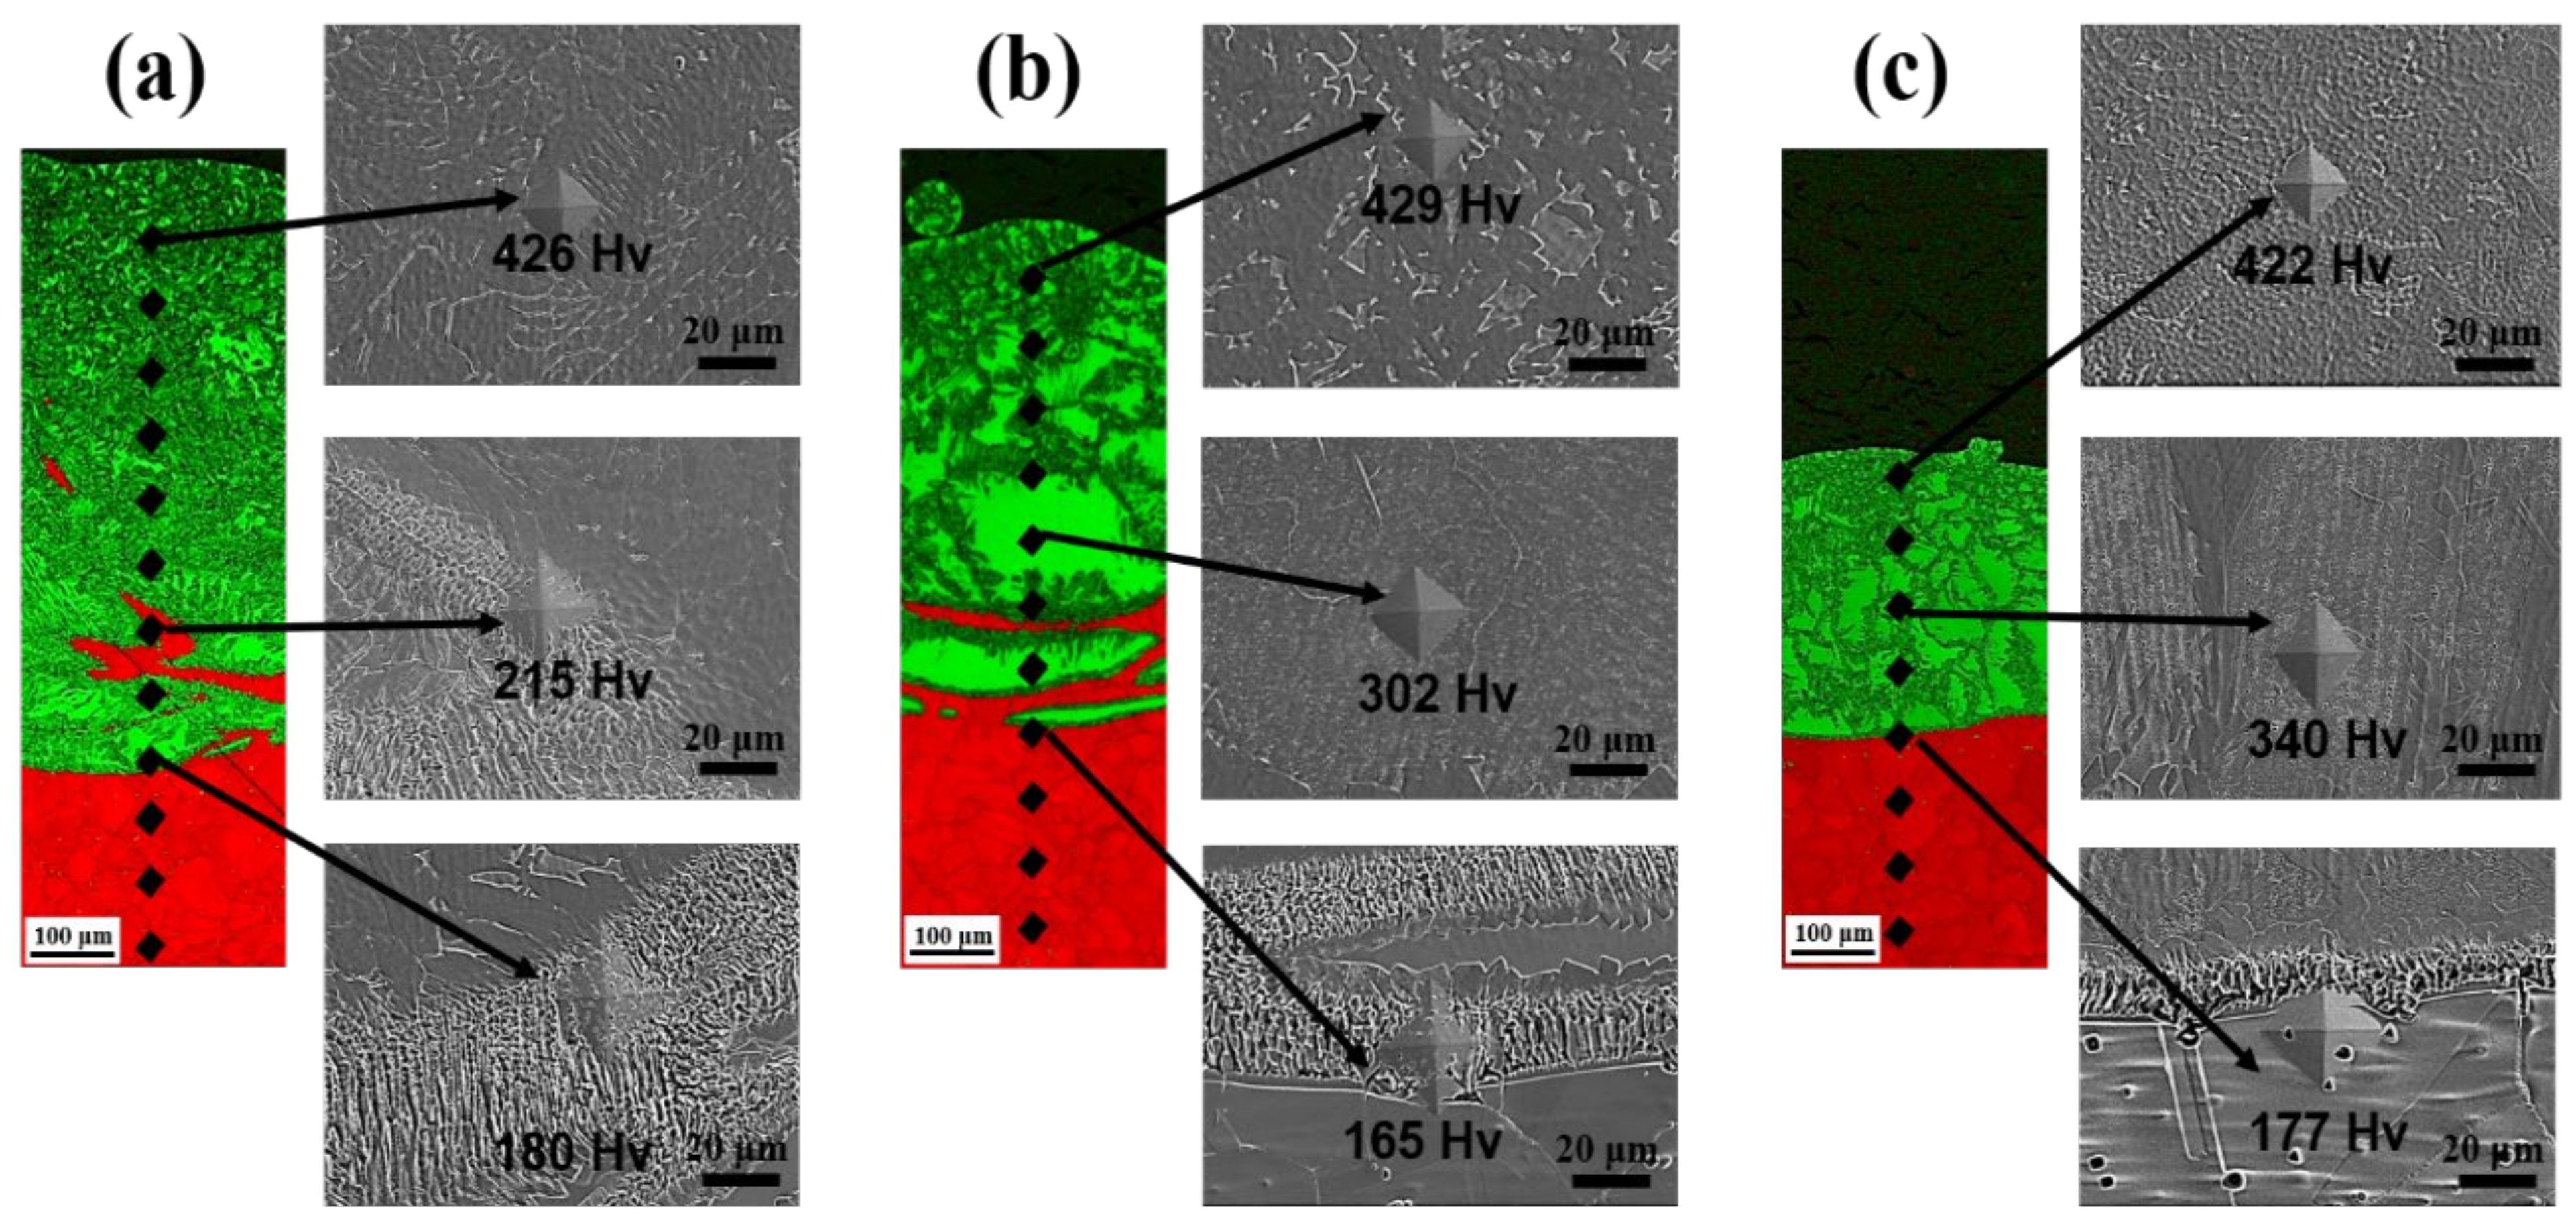
Microstructural and Compositional Behavior of Each Clad by Laser Traverse Speed

Figure 3 shows the melt pool shapes of each single-line cladding according to the change in the laser traverse speed. All molten pools revealed a typical elliptical shape with a shallow penetration depth. Based on the laser traverse speed, defect-free, single-line clads were obtained without macro-defects, such as cracks and internal pores. As the laser traverse speed increased (12–16 mm/s), the molten pool size tended to decrease. This was because the heat input decreased as the laser traverse speed increased. In other words, the bead width, height, and penetration depth of each clad region decreased from 1190, 588, and 146 μm to 1034, 457, and 87 μm, respectively, owing to a decrease in the heat input by decreasing the laser traverse speed. In addition, the fraction of the bright band generated at the interface between the substrate and clad region also decreased according to the reduced input heat.
Figure 4 shows the results of the line component analysis through the EPMA of each clad according to the laser traverse speed. Line analysis was performed along the red line from the upper regions of each cladding to a specific area in the substrate, as shown in Figure 3. The powder constituting the clad was mainly composed of Fe, Cr, and Si. Therefore, only the Fe, Cr, Si, and Ni components were analyzed to confirm the presence or absence of the diluted Ni component from the substrate to each clad region. As shown in Figure 3a, the bright band formed at the interface of the clad region, and the substrate was transferred to the upper region of the clad in the 12 mm/s specimen with the slowest laser traverse speed. It was observed that the Ni component was diluted to the upper region of the clad, and other Fe, Cr, and Si components also showed irregular dilution rates with decreasing laser traverse speed. However, as the laser traverse speed increased, the bright band’s position changed to the lower region of the clad, which was the interface between the substrate and clad region. In addition, the dilution amount of Ni in the clad region decreased, owing to the decline in the laser traverse speed. Additionally, the region showing irregular periods of Fe, Cr, Si, and Ni components was limited to the lower position of the clad. Therefore, the bright band in the clad region observed in Figure 3a was caused by the dilution of the Ni component of the substrate, generated by the heat input applied during the cladding.
Figure 5 shows the segregation behavior of the Ni components in each cladding region according to the laser traverse speed. The dilution of the Ni component of the substrate was observed using an EPMA mapping analysis, as shown in Figure 4. The dilution and segregation degree of Ni component can be seen through the color level bar in the upper right of Figure 4. The color level bars indicate the degree of Ni segregation of the clad specimen by counting each color, representing the level as a dot. Therefore, the degree of dilution and segregation of Ni can be predicted through the color-level bar. As shown in Table 1, the substrates of all specimens with STS 316 L had a high Ni content in the austenite-stabilizing element. The Ni component of the substrate diluted to the clad region by the heat input during the cladding process tended to increase as the heat input increased. The Ni content was high in the clad region because the Ni component of the substrate was diluted in the upper region of the clad in the 12 mm/s specimen with the highest heat input. However, the dilution of the Ni component in the clad region tended to gradually decrease due to the heat input decline. In particular, it was confirmed that dilution of the Ni component hardly occurred in the 16 mm/s specimen. Therefore, because the heat input of each specimen was decreased by increasing the laser traverse speed, the dilution rate of Ni in the cladding region also decreased. Thus, an increase in the dilution amount of the Ni component with a heat input increase can significantly affect the microstructure behavior of the clad region.
Figure 6 shows the phase transformation behavior of each clad region with increasing laser traverse speed. Phase analysis using EBSD was performed from the upper region of each cladding to the region containing a part of the substrate along the box. This analysis is indicated by the white dotted line in Figure 5. The substrate and cladding regions of each specimen were composed of face-centered cubic (FCC) and body-centered cubic (BCC) phases, respectively, owing to the difference in the content of austenite-stabilizing element such as Ni. Although the heat input was decreased by increasing the laser traverse speed, the range of the unmixed zone in which the FCC phase of the substrate reached the clad region was limited to the region below the cladding. The unmixed zone was the region formed because a part of the substrate was not completely melted while the powder was melted during the cladding process. In Figure 5, the orange region in which parts of the substrate and cladding were irregularly mixed was the FCC region at the interface between the substrate and cladding region. In addition, the area separated by a lighter color than the orange region represents the degree of dilution of the Ni component. The FCC region observed in the cladding region of each specimen identical to the Ni segregation region in orange (See Figure 5). Further, we confirmed that the unmixed zone, which started at the interface between the substrate and clad region, propagated to the central region (FCC fraction: 16.5%) of the clad in the 12 mm/s specimen with the highest heat input. Additionally, because the Ni component was diluted in the entire region of the clad, as shown in Figure 5a, dense martensite was formed in the entire clad region (Figure 6a). However, the range of unmixed zone formation was limited to the lower region (FCC fraction: 5.4%) of the clad bead in the 14 mm/s specimen. As the Ni dilution was concentrated in the upper/lower regions of the clad (Figure 5b), dense martensite was locally generated in the upper/lower regions, as shown in Figure 6b. As the dilution of Ni hardly occurred (FCC fraction: 1%) in the 16 mm/s specimen with the lowest heat input, the substrate and cladding regions comprised FCC and BCC, respectively, as shown in Figure 6c. In the 16 mm/s specimen with the lowest heat input, it was confirmed that the diluted Ni component was locally segregated at the grain boundary between the primary δ-ferrites to form martensite. The primary δ-ferrites became coarser with increased heat input in the 14 mm/s specimen. In the 12 mm/s specimen with the highest heat input, the primary δ-ferrites were expected to be coarser; however, the results were contrary to expectations. In the specimen with low heat input, because the dilution rate of the Ni component was low, dense martensite was mainly formed at the grain boundaries of the primary δ-ferrites and in the upper region of the bead. Conversely, dense martensite was formed in the entire cladding region, except for the local area in the 12 mm/s specimen, due to the large amount of Ni dilution in that region. These results show that the dilution of Ni, rather than the rapid cooling rate of the laser cladding, was the driving force for martensite formation. In general, it is known that the fraction of δ-ferrite and martensite is determined according to the cooling rate in welds of Fe-Cr-based low-alloy steel [19,20,21]. In the welds of the gas tungsten arc welding (GTAW) with high heat input and laser welding with low heat input, it was confirmed that the δ-ferrite fraction of laser weld with a relatively fast cooling rate was higher than that of GTA weld [20]. This result occurred because the high-temperature δ-ferrite was not sufficiently transformed into austenite in the two-phase region of δ + γ during cooling because equilibrium solidification was not possible due to the fast cooling rate after welding [21]. Therefore, the residual δ-ferrite fraction at the interface between the molten pool and the base metal with a fast cooling rate is higher than the central region of the weld and upper clad bead with a slow cooling rate [21]. In addition, the austenite-stabilizing element was added to improve the corrosion resistance of Fe-Cr-based low-alloy steel, and the fraction of retained austenite was increased because the martensite initiation (Ms) temperature was decreased due to the addition of Ni content higher than 2% [25]. Therefore, it is possible to explain the effect of the cooling rate and Ni dilution by the laser traverse speed on the microstructure behavior of the clad specimen.
Figure 7a,b show the hardness measurement area and distribution of each clad specimen by increasing the laser traverse speed, respectively. The STS316L plate used as a substrate in all specimens had an average hardness of 210 ± 1 HV0.1, and approximately 185 ± 2 HV0.1 was measured near the interface between the substrate and the clad region. In the 12 mm/s specimen with the highest heat input, the hardness of the clad region was more than 350 HV0.1 except for a specific area. The cause was that the hardness value of the square box area indicated with the yellow solid line in which the incompletely mixed unmixed zone (FCC phase) propagated from the substrate to the center area of the clad was measured to be identical to the average hardness of the substrate. However, the high hardness value (350~457 HV0.1) was measured because dense martensite was formed due to the dilution of Ni component in the entire clad region. In the 14 mm/s specimen, the hardness of 300 HV0.1 was measured in the coarse primary δ-ferrites formed in the middle and lower regions of the clad, but the upper portion of the clad with a high dilution rate of Ni component has an average hardness value of 400 HV0.1 due to the formation of martensite. The primary δ-ferrites of the 16 mm/s clad region with the lowest heat input have relatively smaller grains than those of the 14 mm/s clad. In the 16 mm/s clad, dilution of Ni component hardly occurred, but because martensite was formed on the grain boundaries of coarse δ-ferrites and at the upper region of the clad, hardness values of over 350 HV0.1 were measured.
Figure 8 shows the correlation between the hardness distribution and microstructure of a specific area in each clad specimen with increasing laser traverse speed. As dense martensite was formed in the upper region of all clads by dilution of the Ni component, a high hardness value of approximately ~426 HV0.1 was measured. In the 12 mm/s specimen with the highest heat input, a hardness value of ~215 HV0.1, similar to the substrate, was observed in the unmixed region in the lower region of the clad. However, a hardness of ~180 HV0.1, which is lower than the hardness of the substrate, was measured at the interface between the clad region and the substrate. The reason for this difference is that the hardness of the coarse grains formed by the heat-affected zone and the unmixed zone were simultaneously measured. The hardness of the upper cladding region and near the interface of all the specimens had approximately similar hardness values owing to the above-mentioned causes. In the central region of the clad with a relatively low heat input of 14 mm/s, a hardness value of 300 HV0.1 was observed because of the formation of coarse δ-ferrites, whereas, in the 16 mm/s clad, some martensite was mixed in the coarse δ-ferrite. Therefore, a hardness value 50 HV0.1 higher than the coarse δ-ferrite of the 14 mm/s specimen was measured. Therefore, the martensite fraction of the clad region was different because of the dilution of the Ni component according to the heat input. It should be noted that the formation of martensite has excellent wear resistance properties but may be vulnerable to corrosion.

4. Conclusions

In this study, the metallurgical properties of Fe-Cr-Si clads produced on STS316L with decreased laser traverse speeds were investigated. The microstructural and compositional behavior of Fe-Cr-Si single-line clads was investigated by decreasing the laser traverse speed. The following conclusions were drawn from the study results:
(1) A sound clad region without defects was obtained from all specimens, and because the substrate and clad regions of the specimen were composed of FCC and BCC, the interface between them was observed.
(2) As the laser traverse speed increased, the clad size and the dilution amount of the Ni component of the substrate and unmixed zone decreased owing to the heat input decline.
(3) As the heat input increased (16–12 mm/s), the primary δ-ferrites formed in the clad area were expected to have coarse grain sizes; however, dense martensite was formed by the dilution of the Ni component over the entire clad region in the 12 mm/s specimen with the highest heat input.
(4) Therefore, the formation of martensite by the dilution of the Ni component must be sufficiently considered to properly predict the corrosion and wear characteristics of the Fe-Cr-Si multilayer clad made of STS316L.

Author Contributions

T.H.: investigation, data curation, and writing—original draft. G.-D.K.: Investigation, resources, and formal analysis. S.-W.K.: Investigation and formal analysis. Y.H.M. conceptualized data curation. H.N.: Investigation, conceptualization, methodology, writing—original draft, writing—review, and editing. S.S.: Conceptualization, supervision, writing, review, and editing. All authors have read and agreed to the published version of the manuscript.

Funding

This study was supported by the Fundamental Research Program of the Korea Institute of Material Science (KIMS) (grant no. PNK 8210).

Institutional Review Board Statement

Not applicable.

Informed Consent Statement

Not applicable.

Data Availability Statement

The data presented in this study are available upon request from the corresponding author.

Conflicts of Interest

The authors declare no conflict of interest.

References

  1. Ramkumar, K.D.; Patel, S.D.; Praveen, S.S.; Choudhury, D.J.; Prabaharan, P.; Arivazhagan, N.; Xavior, M.A. Influence of filler metals and welding techniques on the structure–property relationships of Inconel 718 and AISI 316L dissimilar weldments. Mater. Des. 2014, 62, 175–188. [Google Scholar] [CrossRef]
  2. Hinojos, A.; Mireles, J.; Reichardt, A.; Frigola, P.; Hosemann, P.; Murr, L.E.; Wicker, R.B. Joining of Inconel 718 and 316 Stainless Steel using electron beam melting additive manufacturing technology. Mater. Des. 2016, 94, 17–27. [Google Scholar] [CrossRef] [Green Version]
  3. Michiuchi, M.; Kokawa, H.; Wang, Z.J.; Sato, Y.S.; Sakai, K.J.A.M. Twin-induced grain boundary engineering for 316 austenitic stainless steel. Acta Mater. 2006, 54, 5179–5184. [Google Scholar] [CrossRef]
  4. Walczak, M.; Pineda, F.; Fernandez, A.G.; Mata-Torres, C.; Escobar, R.A. Materials corrosion for thermal energy storage systems in concentrated solar power plants. Renew. Sustain. Energy Rev. 2018, 86, 22–44. [Google Scholar] [CrossRef]
  5. Oh, E.J.; Lee, D.H.; Cho, S.W.; Choi, Y.I.; Nam, K.W. Effect of the Holding Time during Solution Heat Treatment on Intergranular Corrosion of Unstabilized Austenitic Stainless Steel. J. Weld. Join. 2020, 38, 278–288. [Google Scholar] [CrossRef]
  6. Latha, S.; Mathew, M.D.; Parameswaran, P.; Rao, K.B.S.; Mannan, S.L. Thermal creep properties of alloy D9 stainless steel and 316 stainless steel fuel clad tubes. Int. J. Press. Vessels Pip. 2008, 85, 866–870. [Google Scholar] [CrossRef]
  7. Williams, R.J.; Al-Lami, J.; Hooper, P.A.; Pham, M.S.; Davies, C.M. Creep deformation and failure properties of 316 L stainless steel manufactured by laser powder bed fusion under multiaxial loading conditions. Addit. Manuf. 2021, 37, 101706. [Google Scholar] [CrossRef]
  8. Chao, Q.; Cruz, V.; Thomas, S.; Birbilis, N.; Collins, P.; Taylor, A.; Fabijanic, D. On the enhanced corrosion resistance of a selective laser melted austenitic stainless steel. Scr. Mater. 2017, 141, 94–98. [Google Scholar] [CrossRef]
  9. Liu, Y.; Liu, L.; Li, S.; Wang, R.; Guo, P.; Wang, A.; Ke, P. Accelerated deterioration mechanism of 316L stainless steel in NaCl solution under the intermittent tribocorrosion process. J. Mater. Sci. Technol. 2022, 121, 67–79. [Google Scholar] [CrossRef]
  10. Zhou, Y.; Liu, Y.; Zhou, X.; Liu, C.; Yu, J.; Huang, Y.; Li, W. Precipitation and hot deformation behavior of austenitic heat-resistant steels: A review. J. Mater. Sci. Technol. 2017, 33, 1448–1456. [Google Scholar] [CrossRef]
  11. Matsuoka, Y.; Iwasaki, T.; Nakada, N.; Tsuchiyama, T.; Takaki, S. Effect of grain size on thermal and mechanical stability of austenite in metastable austenitic stainless steel. ISIJ. Int. 2013, 53, 1224–1230. [Google Scholar] [CrossRef] [Green Version]
  12. Zhai, W.; Zhou, W.; Zhu, Z.; Nai, S.M.L. Selective Laser Melting of 304L and 316L Stainless Steels: A Comparative Study of Microstructures and Mechanical Properties. Steel Res. Int. 2022, 93, 2100664. [Google Scholar] [CrossRef]
  13. Tak, K.G.; Schulz, U.; Eggeler, G. On the effect of micrograin crystallography on creep of FeCr alloys. Mater. Sci. Eng. A 2009, 510, 121–129. [Google Scholar] [CrossRef]
  14. Jun, S.Y.; Im, S.Y.; Moon, J.; Lee, C.H.; Hong, H.U. Technical Issues in Fusion Welding of Reduced Activation Ferritic/Martensitic steels for Nuclear Fusion Reactors. J. Weld. Join. 2020, 38, 45–55. [Google Scholar] [CrossRef] [Green Version]
  15. Paczkowska, M.; Selech, J. Microstructure and Soil Wear Resistance of a Grey Cast Iron Alloy Reinforced with Ni and Cr Laser Coatings. Materials 2022, 15, 3153. [Google Scholar] [CrossRef] [PubMed]
  16. Romedenne, M.; Pillai, R.; Harris, B.; Pint, B.A. Compatibility of Fe-Cr-Al and Fe-Cr-Al-Mo oxide dispersion strengthened steels with static liquid sodium at 700 °C. J. Nucl. Mater. 2022, 569, 153919. [Google Scholar] [CrossRef]
  17. Regina, J.R.; Dupont, J.N.; Marder, A.R. The effect of chromium on the weldability and microstructure of Fe-Cr-Al weld cladding. Weld. J. N. Y. 2007, 86, 170–178. [Google Scholar]
  18. Park, S.Y.; Kang, Y.; Oh, D.; Song, S.; Hong, H.U. Solidification cracking susceptibility of the weld metal of additively manufactured 316L stainless steel. J. Weld. Join. 2021, 39, 45–50. [Google Scholar] [CrossRef]
  19. Sam, S.; Das, C.R.; Ramasubbu, V.; Albert, S.K.; Bhaduri, A.K.; Jayakumar, T.; Kumar, E.R. Delta ferrite in the weld metal of reduced activation ferritic martensitic steel. J. Nucl. Mater. 2014, 455, 343–348. [Google Scholar] [CrossRef]
  20. Jung, N.; Ahn, J.; Lee, M.; Kang, N.; Cho, K.M. Formation Behavior of δ ferrite Within LB and GTA Weld Zones of Mod. 9Cr-1Mo Steel in Terms of Thermal History. Korean J. Met. Mater. 2018, 56, 93–102. [Google Scholar] [CrossRef] [Green Version]
  21. Ahn, S.Y.; Kang, N. The Effects of δ-ferrite on Weldment of 9–12% Cr Steels. J. Weld. Join. 2013, 31, 8–16. [Google Scholar] [CrossRef]
  22. Koga, G.Y.; Ferreira, T.; Guo, Y.; Coimbrão, D.D.; Jorge, A.M.; Kiminami, C.S.; Botta, W.J. Challenges in optimizing the resistance to corrosion and wear of amorphous Fe-Cr-Nb-B alloy containing crystalline phases. J. Non-Cryst. Solids 2021, 555, 120537. [Google Scholar] [CrossRef]
  23. Pang, S.; Zhang, T.; Asami, K.; Inoue, A. New Fe-Cr-Mo-(Nb, Ta)-CB glassy alloys with high glass-forming ability and good corrosion resistance. Mater. Trans. 2001, 42, 376–379. [Google Scholar] [CrossRef] [Green Version]
  24. Idczak, R. High-temperature atmospheric corrosion of Fe-Cr-Si alloys studied by Mössbauer spectroscopy. Corrosion 2018, 74, 1083–1092. [Google Scholar] [CrossRef]
  25. Jeon, Y.T.; Park, Y.S. Effects of Alloying Elements on Corrosion Resistance and Microstructure of Fe-Cr Martensitic Stainless Steel. J. Corros. Sci. Soc. Korea 1997, 26, 368–380. [Google Scholar]
Figure 1. (a) Appearance morphology, and (b) particle size distribution of Fe-Cr-Si powder.
Crystals 12 01531 g001
Figure 2. Schematics of direct energy deposition process.
Crystals 12 01531 g002
Figure 3. Melt pool shape of Fe-Cr-Si single-line clads at various laser traverse speed: (a) 12 mm/s, (b) 14 mm/s, and (c) 16 mm/s.
Crystals 12 01531 g003
Figure 4. Component behavior of Fe-Cr-Si single-line clads at various laser traverse speeds: (a) 12 mm/s, (b) 14 mm/s, and (c) 16 mm/s.
Crystals 12 01531 g004
Figure 5. Ni segregation of Fe-Cr-Si single-line clads at various laser traverse speeds: (a) 12 mm/s, (b) 14 mm/s, and (c) 16 mm/s.
Crystals 12 01531 g005
Figure 6. Phase transformation behavior of Fe-Cr-Si single-line clads at various laser traverse speeds: (a) 12 mm/s, (b) 14 mm/s, and (c) 16 mm/s.
Crystals 12 01531 g006
Figure 7. Hardness behavior for various laser traverse speeds (12−16 mm/s): (a) hardness measurement area, (b) hardness distribution in the clad specimens.
Crystals 12 01531 g007
Figure 8. Correlation between the hardness distribution and microstructure of a specific area in each clad specimen at various laser traverse speeds: (a) 12 mm/s, (b) 14 mm/s, and (c) 16 mm/s.
Crystals 12 01531 g008
Table 1. Chemical compositions of Fe-Cr-Si powder and 316L stainless steel substrate.
Composition (wt.%)FeCrNiMoMnSiAlTiC
Powder (Fe-Cr-Si)85.0712.25---2.5---
Substrate (STS 316L)67.1716.8610.962.891.540.550.020.0010.01
Publisher’s Note: MDPI stays neutral with regard to jurisdictional claims in published maps and institutional affiliations.

