Article

Study of the Thermal Properties and Lattice Disorder Effects in CdTe–Based Crystals: CdBeTe, CdMnTe, and CdZnTe

1
Institute of Physics, Faculty of Physics, Astronomy and Informatics, Nicolaus Copernicus University in Toruń, ul. Grudziądzka 5, 87-100 Toruń, Poland
2
Engineering Science for Energy Lab, National School of Applied Sciences, Chouaib Doukkali University of El Jadida, El Jadida 24000, Morocco
*
Author to whom correspondence should be addressed.
Crystals 2022, 12(11), 1555; https://doi.org/10.3390/cryst12111555
Submission received: 16 September 2022 / Revised: 22 October 2022 / Accepted: 24 October 2022 / Published: 31 October 2022
(This article belongs to the Special Issue Feature Paper in "Materials for Energy Applications" 2022–2023)

Abstract

:
Mixed semiconductor ternary crystals were grown using the Bridgman–Stockbarger method. This is a high–temperature and high–pressure crystal growth method. Cd1–xBexTe crystals were grown in the range of composition 0 < x < 0.1, such as 0.00, 0.01, 0.03, 0.05, and 0.1. The main goal of this paper was to compare the thermal properties of CdBeTe with previously grown CdMnTe and CdZnTe–mixed ternary crystals. The photopyroelectric technique was applied to examine the thermal properties. The thermal diffusivity and effusivity values were obtained after testing all the samples, and the thermal conductivity was calculated then. As such, a complete thermal characterization of the crystals was carried out. For further characterization, the thermal conductivity versus composition was checked by applying the Sadao Adachi model. Thanks to that, we were able to determine the total thermal resistivity of the crystals and the additional resistivity which arises from the lattice disorder. As such, the disorder effects arising from substituting the native atom with a foreign one were characterized for all crystals. We were looking for the best substitution of the Cd atom in the CdTe matrix based on the compounds’ thermal properties. It turned out that Zn and Mn introduce a similar disorder, with Be being the highest one.

1. Introduction

II–VI mix6ed crystals found several applications in modern optoelectronics, including the construction of visible radiation sources [1], photodetection [2], green laser diodes [3], electro–optic modulators [4], solar cells [5], and infrared devices [6]. Essential properties of ternary and quaternary compounds are changes in the energy band gap and lattice constant values with a bit of compositional modification. Many scientific groups are working to find bulk, high–quality crystals to produce different gamma and X–ray radiation detectors using CdTe–based materials [7,8,9]. Cadmium and telluride possess high atomic numbers (Z), which is essential in sensing applications. Additionally, the CdTe compound is characterized by a sufficiently large band gap and high electron mobility. Cadmium telluride provides a good performance in a wide range of temperatures. The CdTe binary crystal, with a small amount of zinc, manganese, or beryllium, makes good solid–state X–ray and gamma–ray detectors.
Nowadays, the new II–VI semiconductor BeTe has received attention. It is intriguing for optoelectronic applications because it crystallizes in a zincblende structure and has various technologically appealing features [10]. The lattice constant of BeTe is 5.627Å, which is very near to the ZnSe and GaAs, and the bond energy is significant. The degree of covalency is much higher than other wide band gap semiconductors such as ZnSe or CdTe because this material’s stability and hardness are also increased [11,12].
CdZnTe (CZT) has an excellent history of use in various optoelectronics applications [8]. In recent decades, these crystals have been one of the most usable and studied materials. The variation in composition allows for changing their energy band gap and lattice constant, which is very useful from an application point of view [13]. On the other hand, CdMnTe (CMT) crystals show desirable properties for spintronics applications due to their magneto–optical properties [14]. Manganese telluride MnTe with an indirect bandgap (0.86 eV) is a promising thermoelectric material and for x–ray and gamma–ray detectors [15]. Such sensors have enormous potential for astrophysical research, medical imaging, and process monitoring in the industry. These detectors can operate at room temperature while offering a high detection efficiency and good energy resolution [16].
In this paper, we compared the properties of the following crystals: CdBeTe (CBT) with previously grown CdZnTe and CdMnTe. We were looking for the best substitution of the Cd atom in the CdTe matrix based on the compounds’ thermal properties. Comparing CZT and CMT with CBT provides various advantages that make them good candidates for applications. The main goal of this work was to check whether CBT could potentially be good material in sensing applications. CdTe–based materials are now commercially used in the field of ionizing radiation sensing. Nevertheless, producing high–quality and homogenous crystals is problematic.
In contrast to Zn in CdTe, where the segregation coefficient is 1.35, Be has a close unity value [17]. Because of this distinction, Be distribution in CdTe is more uniform than the Zn distribution in CdTe, which exhibits a substantial variance. Because of the compositional homogeneity of CBT, it is possible to grow a large volume of uniform semiconductor crystals. This should help lower the cost of producing large–area detectors and boost the yield of semiconductor crystals for sensors.
This work used the high–pressure and high–temperature Bridgman technique to grow the crystals [7,8,18]. It is one of the oldest techniques for growing crystals and employs crystal growth from the melt. In a radiation detector incident, high–energy photons generate free charge carriers in the bulk of the semiconductor. The deposited charge’s detection is realized by applying a potential difference between the metal contacts. In the case of a parallel plate detector, the charge carrier movement causes a measurable current signal immediately after the generation and separation of the electron–hole pairs. Maximizing charge collection efficiency requires operating at a high electrical bias to minimize carrier trapping, which, in turn, requires semiconductors of very high resistivity in the range of 109–1010 Ωcm [19]. The Bridgman technique is very suitable for growing high–resistivity crystals and, for this reason, is commonly used to grow crystals considered as potential ionizing radiation detectors. This work intends to characterize the thermal properties of the CBT semiconductor crystal (thermal effusivity, thermal diffusivity, and thermal conductivity). Thermal diffusivity and thermal conductivity can explain the mechanism of thermal energy dissipation via these materials and structure modification.
The back (BPPE) and front (FPPE) configurations of the photopyroelectric (PPE) technology allowed us to measure the thermal parameters. The PPE method is a contact method that directly measures heat oscillations [20], among other photothermal methods, including photothermal radiometry [21], microphone detection, IR thermography, and photodeflection [22]. We can estimate the samples’ thermal diffusivity and effusivity using the thermal wave method, and the thermal conductivity can then be calculated.
The crystal’s quality is a critical property of the material used in many applications. The materials’ quality significantly impacts the prospective detector’s sensitivity and effectiveness. Therefore, the lattice disorder needs to be defined [9,23]. The acquired results were examined using the Sadao Adachi model [24] for mixed semiconductor crystals as the theoretical framework. Thanks to that, the impact of the lattice disorder on the crystal lattice’s thermal resistivity was determined. As such, the chemical disorder effects were characterized for all crystals. It turned out that Zn and Mn introduced similar disorders, among which the highest one is Be.

2. Materials and Methods

All CBT crystals were grown by the Bridgman–Stockbarger technique. It is a high–pressure and high–temperature technique of growing a crystal. The details describing the growth process were published elsewhere [25]. We prepared crystals with different Be content (x = 0.00, 0.01, 0.03, 0.05, and 0.1). The overpressure of the argon was applied during crystal growth to prevent evaporation. We mixed CdTe and Be high–purity powders in an appropriate proportion and placed them in the graphite crucible, heated to approximately 1315 K for a few hours, and then pulled down at the rate of 2.3 mm per hour. We obtained cylindrical shape crystals that were 8–10 mm in diameter and 40–50 mm in length. We cut the grown ingots perpendicular to the growth axis into plates of approximately 1.5 mm. The samples were first mechanically ground with Al2O3 powder, 10 μm, and polished with the same fine powder of granularity 1 μm. After polishing, we obtained the surface of crystals like a mirror. With one ingot, we were able to obtain up to 10 plates. Each sample’s thickness was measured at five different points (for averaging) using a micrometer device. The thickness of the pieces is presented in Figure 1 in mm; these values were used to calculate the thermal diffusivity of the samples.
The photopyroelectric method is generally based on pyroelectric detection [20]. The experimental setup consisted of a 300 mW blue diode laser with electrical modulation and an output wavelength of 405 nm. A dual–phase lock–in amplifier (SRS 830) and a 0.5 mm–thick (lithium tantalite oxide crystal) LiTaO3 detector were used. The pyroelectric sensor was coated with opaque electrodes (Cr+Au) to absorb the incident light. In this technique, the measuring setup largely determines when the excited radiation falls on the sensor or the sample. The back configuration is when the laser directly excites the specimen, generating heat that travels through the plate and is sensed by the detector (Figure 2). The measurements in this situation yield the thermal diffusivity [20].
The sample works as a heat sink when the laser directly excites the sensor. This is called front configuration. In this instance, the measurement yields the thermal effusivity. We used liquid ethylene glycol for good thermal contact between the specimen and the sensor for both measurement configurations. Providing good thermal contact is the main challenge of the PPE method in the case of a solid sample. It was previously shown that the underestimation of the thermal diffusivity arising from the presence of the coupling fluid could be minimized [26]. In order to normalize the signal for both measurement configurations, an empty sensor procedure was applied [26].
In the back PPE configuration, the sample s is placed on the pyroelectric sensor p (see Figure 2). Assuming a perfect thermal contact between the sample and the sensor and the one–dimensional model of the heat propagation, the complex signal in the back configuration is given by [20,26]:
V = 2 V 0 e σ s L s b s p + 1 1 e 2 σ p L p 1 + R s p e 2 σ p L p ( R s p + e 2 σ p L p ) e 2 σ s L s
where: V0 is an instrumental factor, s and p represent layers of the detection cell (sample and pyro), where Rsp = (bsp 1)/(bsp + 1) is the reflection coefficient of the thermal wave at the s/p interface, bsp = es/ep and e is the thermal effusivity, ap is reciprocal of the thermal diffusion length μp, ap = 1p, and μp = (2αp)1/2, ω is the angular modulation frequency and L is the thickness.
To eliminate the instrumental factor V0, an empty sensor normalization procedure was applied [26]. Assuming a thermally thick regime for both the detector and the sample (μs,p << Ls,p, the thermal wave was attenuated at least e times on the distance equal to the thickness of the sample), and the complex signal can be separated into the amplitude (2) and the phase (3):
l n | V n | = l n 2 b s p + 1 L s ( π f α s ) 1 / 2
Θ = Θ 0 L s ( π f α s ) 1 / 2
The thermal diffusivity value can be determined using both the amplitude and the phase of the pyroelectric signal. For this purpose, a measurement should be made as a function of the thickness of the test specimen or the modulation frequency. The first type of measurement is only possible for liquids; in the case of solids, a frequency scan is needed. The thermal diffusivity values presented in this work were obtained from the slope a of the phase plot as a function of the square root of the modulation frequency. The following formula can be used to calculate the thermal diffusivity αs of the sample if one knows the slope a:
α s = L s 2 π a 2
In the front configuration, the excitation light falls directly onto the pyroelectric sensor, while the sample placed on the opposite side acts as a heat sink. The complex pyroelectric signal after normalization (using the empty sensor procedure) in this case is given by the following formula [20,26]:
V n = 1 e σ p L p + R s p ( e 2 σ p L p e σ p L p ) 1 + R s p e 2 σ p L p
Assuming a thermally thick detector and the sample, we obtain the following:
V n = 1 ( 1 + R s p ) e σ p L p
It can be shown that in this case, the amplitude Vn and phase Θn of the pyroelectric signal can be expressed as [20,26]:
| V n | = [ ( 1 + R s p ) e a p L p s i n ( a p L p ) ] 2 + [ 1 ( 1 + R s p ) e a p L p c o s ( a p L p ) ] 2
Θ n = a r c t a n ( 1 + R s p ) e a p L p s i n ( a p L p ) 1 ( 1 + R s p ) e a p L p c o s ( a p L p )
The thermal effusivity of the test sample can be obtained by matching the previous theoretical relationships to the experimental points. If one knows the thermal parameters of the test sample, it is possible to determine the thermal properties of the detector itself. For the normalized phase using the empty sensor procedure, the following relationship is genuine [20,26]:
L p μ p = π α p = L p 2 f o π
where fo is the frequency, the phase crosses zero and becomes negative. This formula enables one to determine the thermal diffusivity of the detector.
The dynamic and static thermal parameters are interconnected. The thermal diffusivity and effusivity of the investigated crystals can be obtained during measurements. A simple formula gives the thermal diffusivity:
α = k ρ C
where: k is the thermal conductivity; ρ is the density; and C is the specific heat capacity. The thermal effusivity can be expressed as:
e = ( k ρ C ) 1 / 2
Using both expressions (10) and (11), one can eliminate the ρC factor and calculate the thermal conductivity k from a simply relation:
k = e α 1 / 2

3. Results

3.1. Thermal Parameters Determination

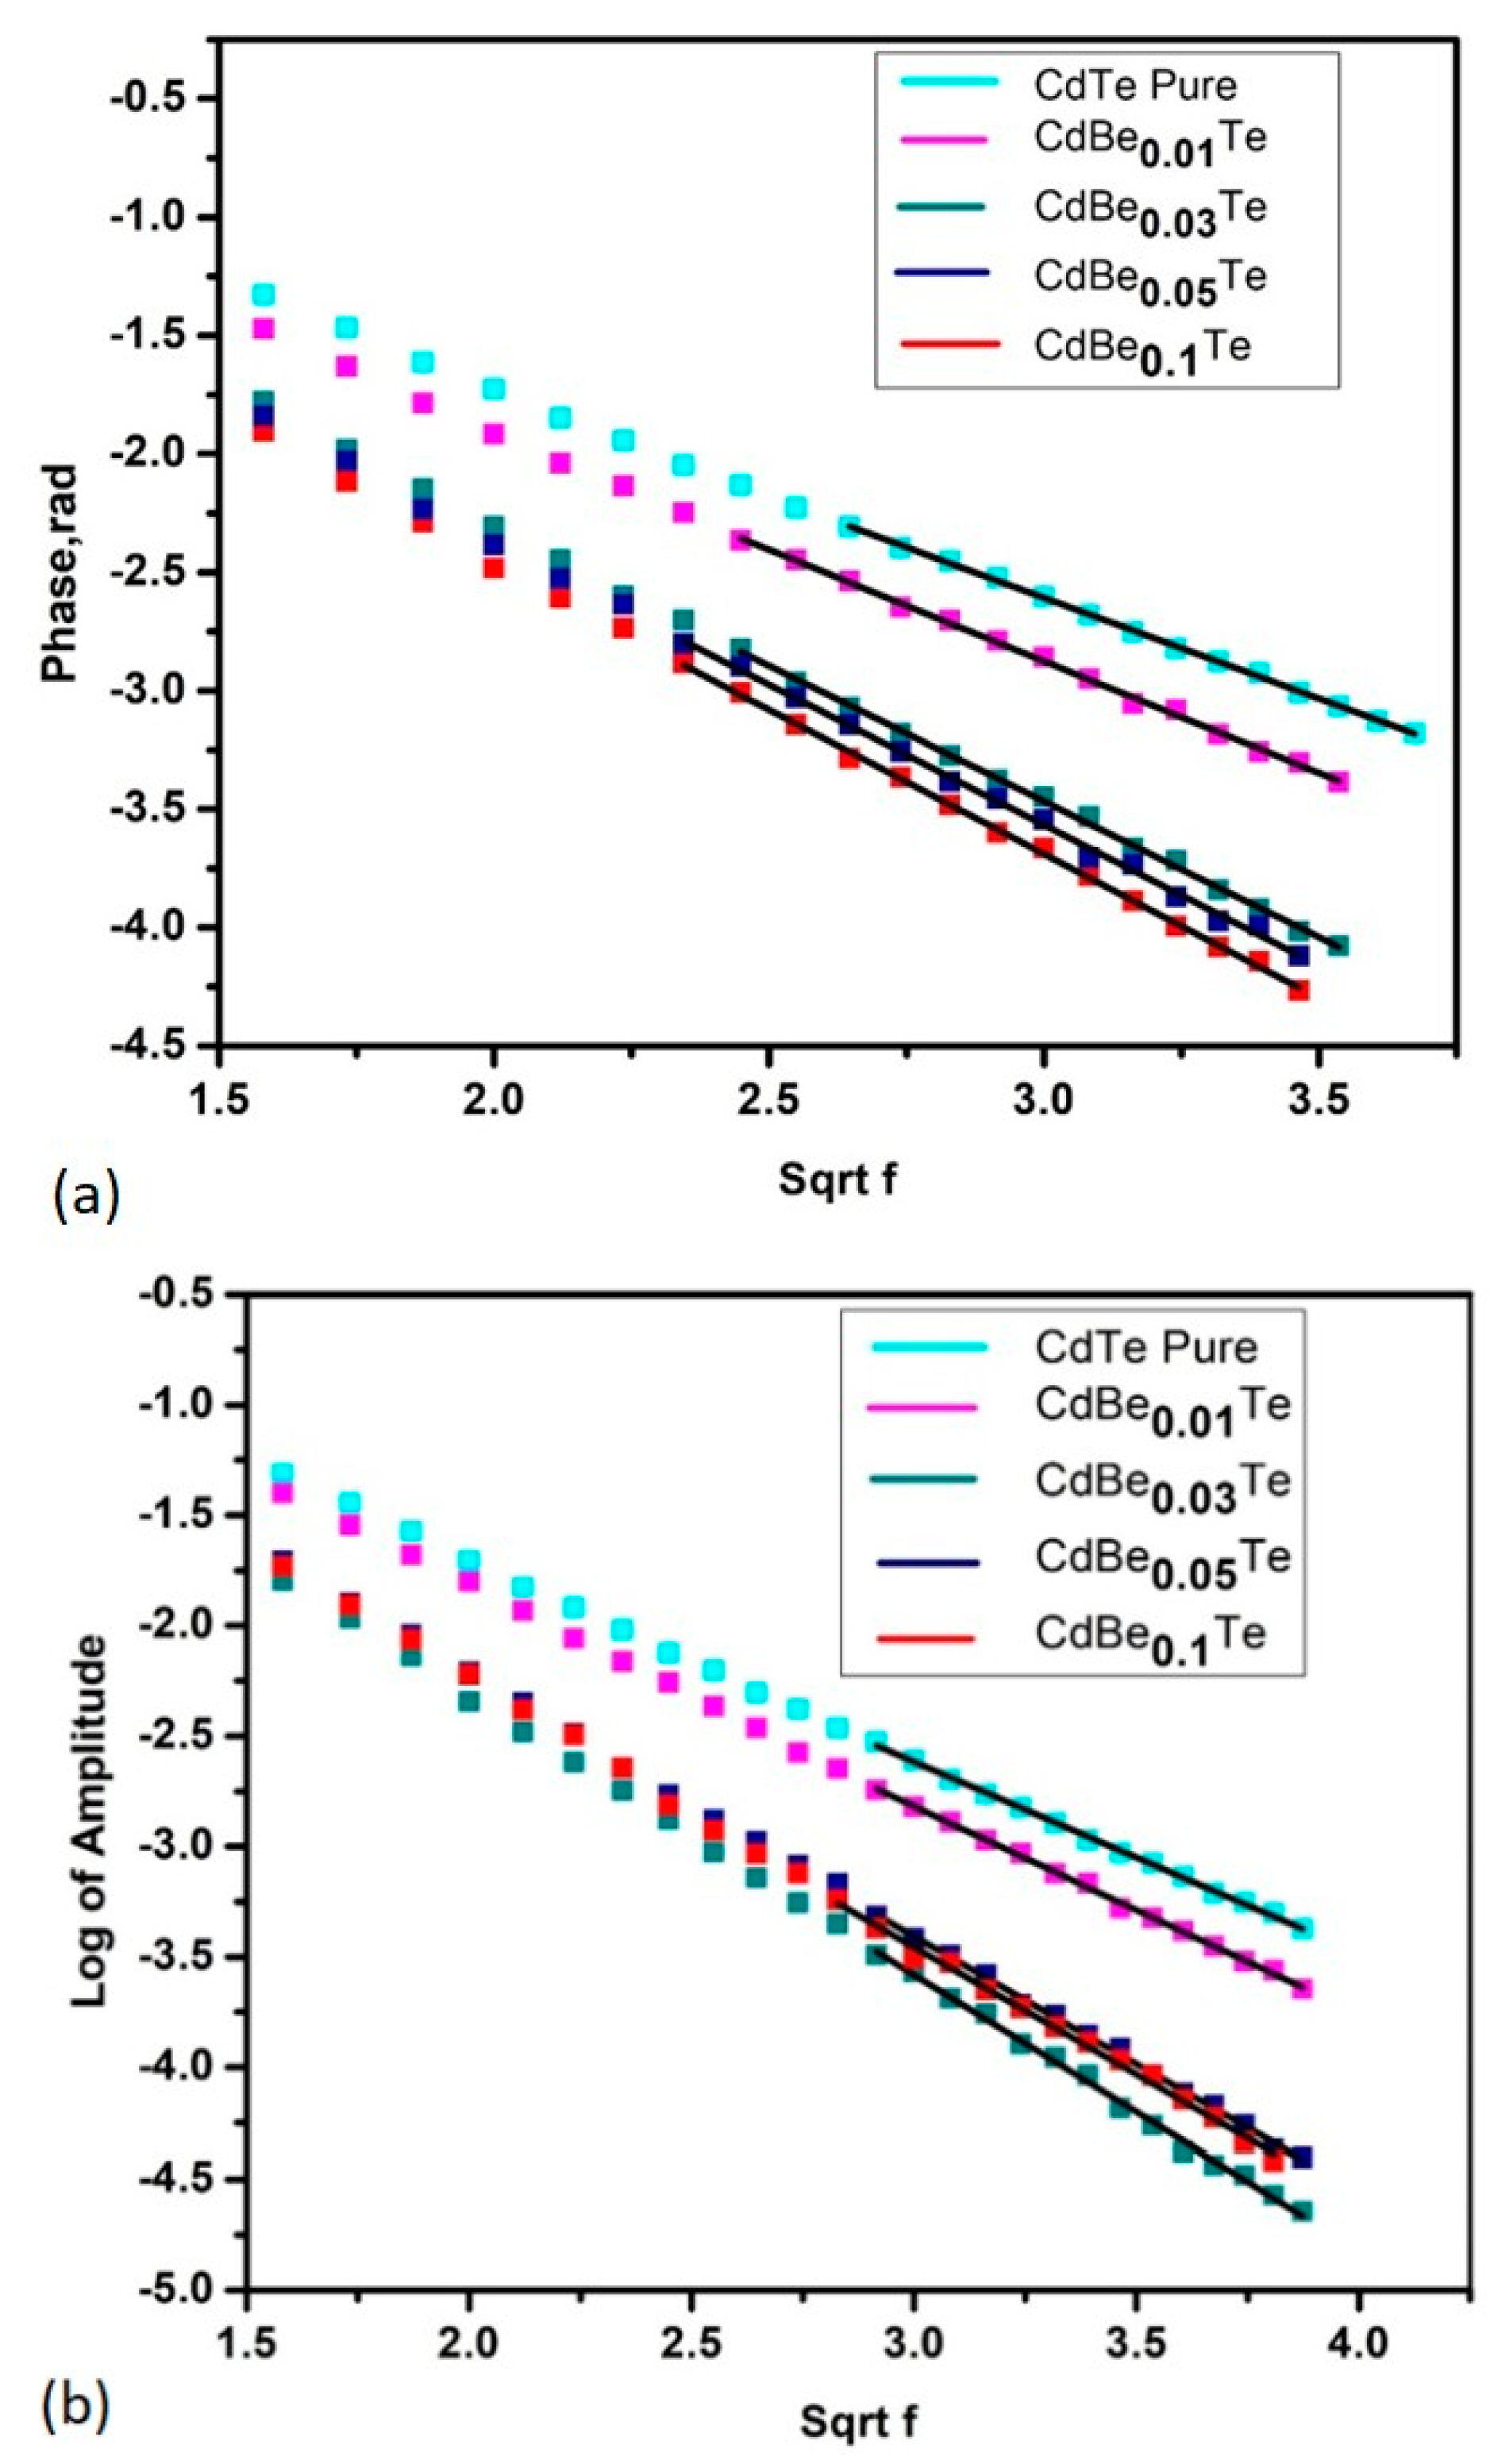
The back configuration was used to examine the phase (Figure 3a) and amplitude (Figure 3b) characteristics for all CBT samples as a function of the square root of the modulation frequency. When dealing with solid samples, a frequency scan is used in the PPE method if there is no way to change the thickness. During the frequency scan, the thermal character of the sample (and sensor) changes. For low frequencies, the sample and the detector are thermally thin, which means that excited surface thermal waves are not attenuated by the distance of the sample thickness. The amplitude of the thermal field drops by the e factor for a given frequency, and the sample then becomes thermally thick. To determine the specimen’s thermal diffusivity, one should measure the system’s response in back PPE configuration., whereas the sample’s thermal character should change from thermally thin to thermally thick. In such cases, the dependence of the signal’s phase or amplitude versus the frequency’s square root is linear. Therefore, the modulation frequency for all CBT crystals was changed from 0.5 up to 15 Hz. The thermal diffusivity of the sample can be calculated from the slope of the linear part and the plate’s thickness.
As shown in Figure 3 for different Be content, we can see different linear fits performed with the least square method, and points are just experimental data. The statistical determination coefficient R2 for all fits was close to 1 (better than 0.9999). The thickness Ls of all samples varies from 0.80 to 1.03 mm. Because the specimen or sensor is thermally thin (μs < Ls and μp < Lp), we can witness the nonlinear behavior of the sample for the low–frequency regime. According to the theoretical requirements, linear fits were performed where the sample and detector are both thermally thick (μ > L), usually from 5 to 6 Hz. The thermal diffusivity values were determined according to Equation (4). One can see the obtained thermal diffusivity values for all CdBeTe samples in Table 1. The thermal diffusivity values were determined by averaging the results from three independent measurements with a standard deviation as an uncertainty.
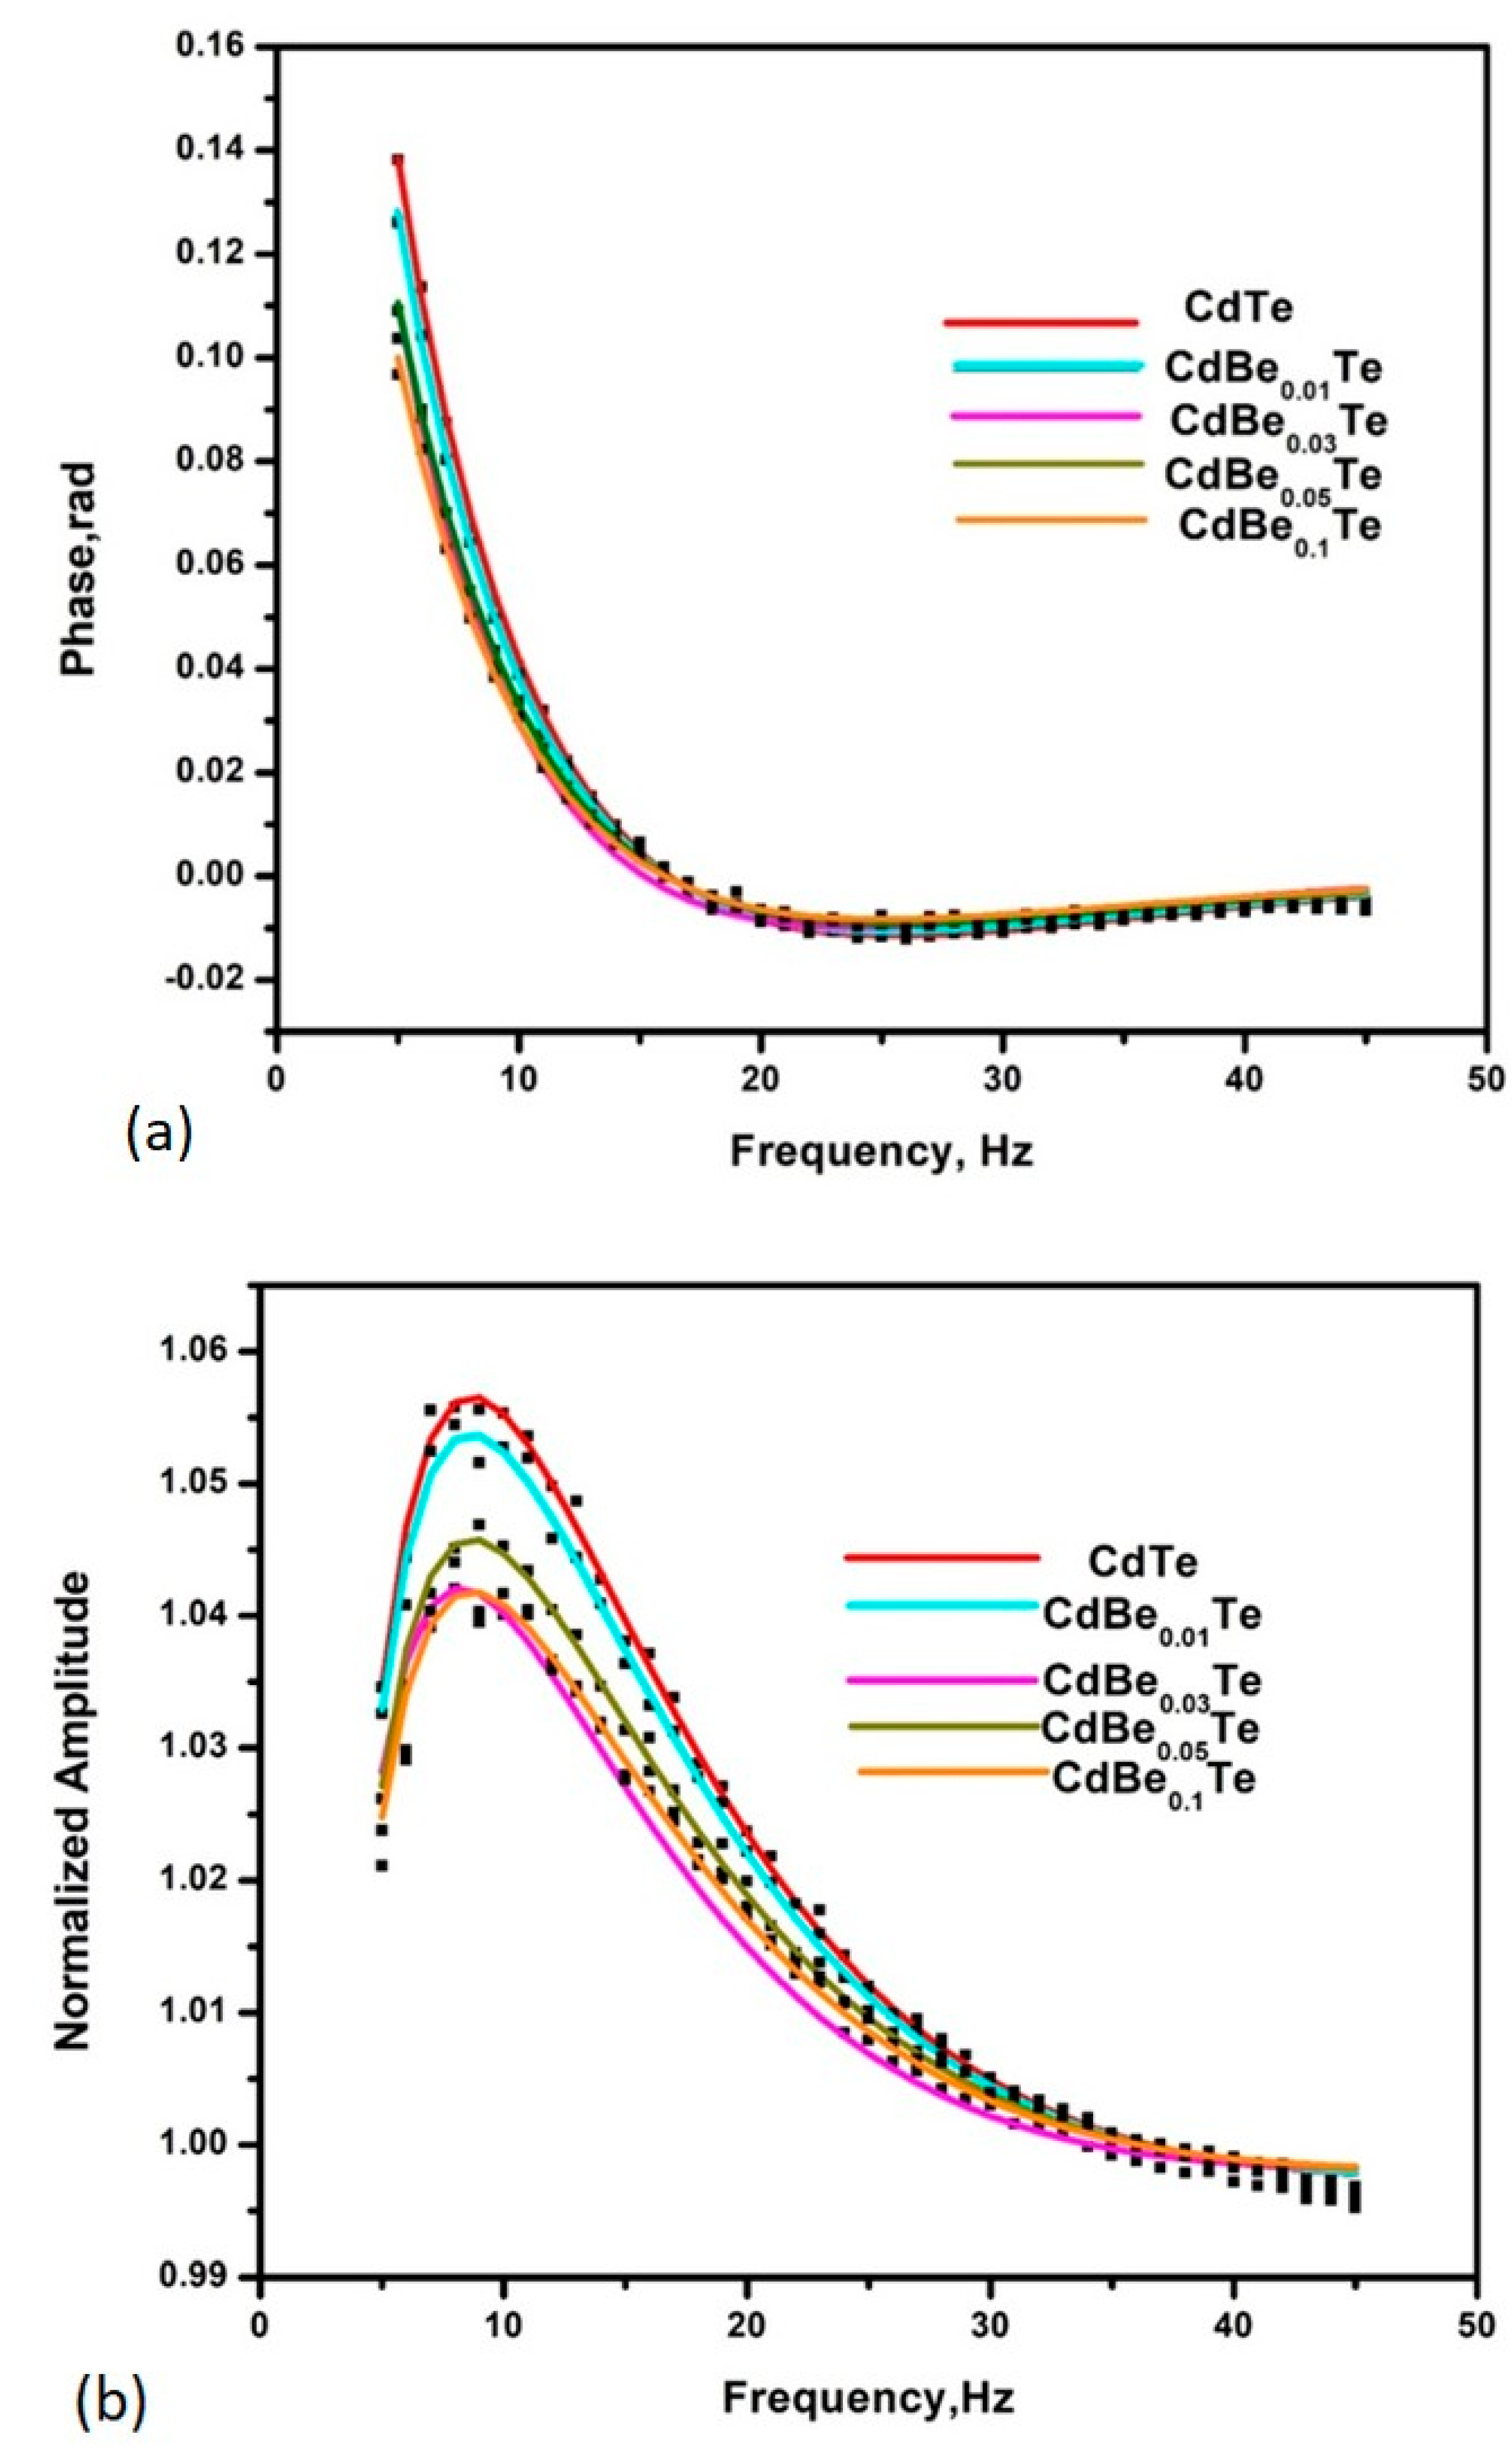
The thermal effusivity of CdBeTe crystals was calculated from the front configuration measurements with the frequency scanning procedure. Figure 4 displays the experimental phase (a) and amplitude (b) of the signal as a modulation frequency function. The points are experimental ones, and the lines are fits obtained using Equations (7) and (8) with the least square approach. The statistical determination coefficient R2 for all fittings was of the order 0.977–0.998 (see Table 1), a little bit smaller in the case of the amplitude than the phase.
This is to mention that only one unknown parameter was searched, namely the thermal effusivity of the solid sample. All others parameters were taken from the literature or measured. Both the phase and amplitude were normalized by applying the empty sensor procedure. For all CdBeTe samples, the behavior of the phase and the amplitude are similar. In the spectra presented in Figure 4, one can see the phase drop quickly, and then some broad minimum is observed.
On the other hand, in the case of amplitude, the maximum appears at approximately 10 Hz, and then the values monotonically go down. All samples’ phases cross the zero at more or less the same frequency (see Figure 4a). One can expect such behavior if the experiment is conducted correctly. This frequency can be used to determine/control the thermal effusivity of the detector itself, according to Equation (9).
The thermal effusivity values were determined with three independent measurements as average values with a standard deviation as uncertainty and are mentioned in Table 1. It is well known that all thermal parameters are internally connected with thermal relations. As such, after investigating the value of the thermal diffusivity and the thermal effusivity, we can easily calculate the thermal conductivity value with Equation (12). The error of determining the thermal conductivity values was calculated using the total differential method considering all uncertainties. As seen in Table 1, all thermal parameters quickly decrease as a function of the composition. The highest values can be observed for the pure binary CdTe sample (x = 0), and the lowest for 10% of Be (almost three times smaller). The transport properties of the solid specimen depend on the semiconductor crystals’ quality and fabrication process. The observed behavior testifies to the rapid degeneration of the quality of the crystal structure. The beryllium atom is much smaller than cadmium, therefore leading to the local crystal lattice tension. Introducing Be to the CdTe matrix causes many different types of defect generation. Similar behavior was previously observed for ZnBeSe mixed crystals [27].
If we compare the thermal conductivity of CBT with previously measured CZT and CMT, then according to the literature survey, we can see this in Table 2. It is evident that the thermal conductivity decreases after increasing the amount of Mn or Zn. We can say that both elements were incorporated into the crystal structure and led to the lattice disorder. Both CZT and CMT show similar behavior to CdBeTe. However, the general observation is that the CBT thermal conductivity is lesser than CZT and CMT as the function of the composition. Let us compare the thermal conductivity value of the CdTe matrix with Be, Zn, and Mn. We can see that the thermal conductivity value for the 10% Be content is 1.998 ± 0.043 W·s1/2·m−2·K−1, whilst for a similar Zn content, its value is 2.856 ± 0.012 W·s1/2·m−2·K−1. Even the value of the thermal conductivity for 27% of Mn is still more considerable (2.1 ± 0.0172 W·s1/2·m−2·K−1) when compared with Cd0.9Be0.1Te. This observation shows that adding beryllium causes the most significant disorder in the crystal lattice.

3.2. Thermal Resistivity

As we already mentioned, the thermal diffusivity and the thermal effusivity of the solid samples were determined using photopyroelectric techniques. The thermal parameters mainly depend on the crystals’ quality. Both thermal parameters (diffusivity and effusivity) are the averages of three independent values. After that, we calculated the thermal conductivity values for all samples. The conduction of heat in solids is a complex matter. However, in the case of the II–VI wide band gap semiconductors, we can consider only phonon transport [28], ignoring the role of the carriers. In such a case, Adachi provided a straightforward equation for mixed ternary compounds’ thermal resistivity W(x) [24]:
W ( x ) = x W A C + ( 1 x ) W B C + x ( 1 x ) C A B
where: WAC and WBC are the thermal resistivities (binary), and CA–B is a contribution arising from the lattice disorder. From Equation (13), we can also find the lattice thermal conductivity K(x):
K ( x ) = 1 W ( x ) = 1 x W A C + ( 1 x ) W B C + x ( 1 x ) C A B
For the lattice thermal conductivity of the semiconductor alloy, Equation (14) considers a contribution arising from providing a random distribution of constituent atoms in sublattice sites [24]. The lattice thermal conductivity versus the composition of the ternary CBT semiconductor is presented in Figure 5.
The starting and end parts of the curves are essential and symmetrical; on the other hand, there is a plateau in the middle. Thanks to that, one can obtain seeking parameters with reasonable accuracy, even if we do not have data in the whole composition range. The fitting presented in Figure 5 allowed us to determine the value of the additional thermal resistivity C C d B e which is connected with the chemical disorder. It was determined as 474 W−1·cm·K with the statistical determination coefficient of 0.953294. The error graph arising from the least square approach is presented in the inset of Figure 5.
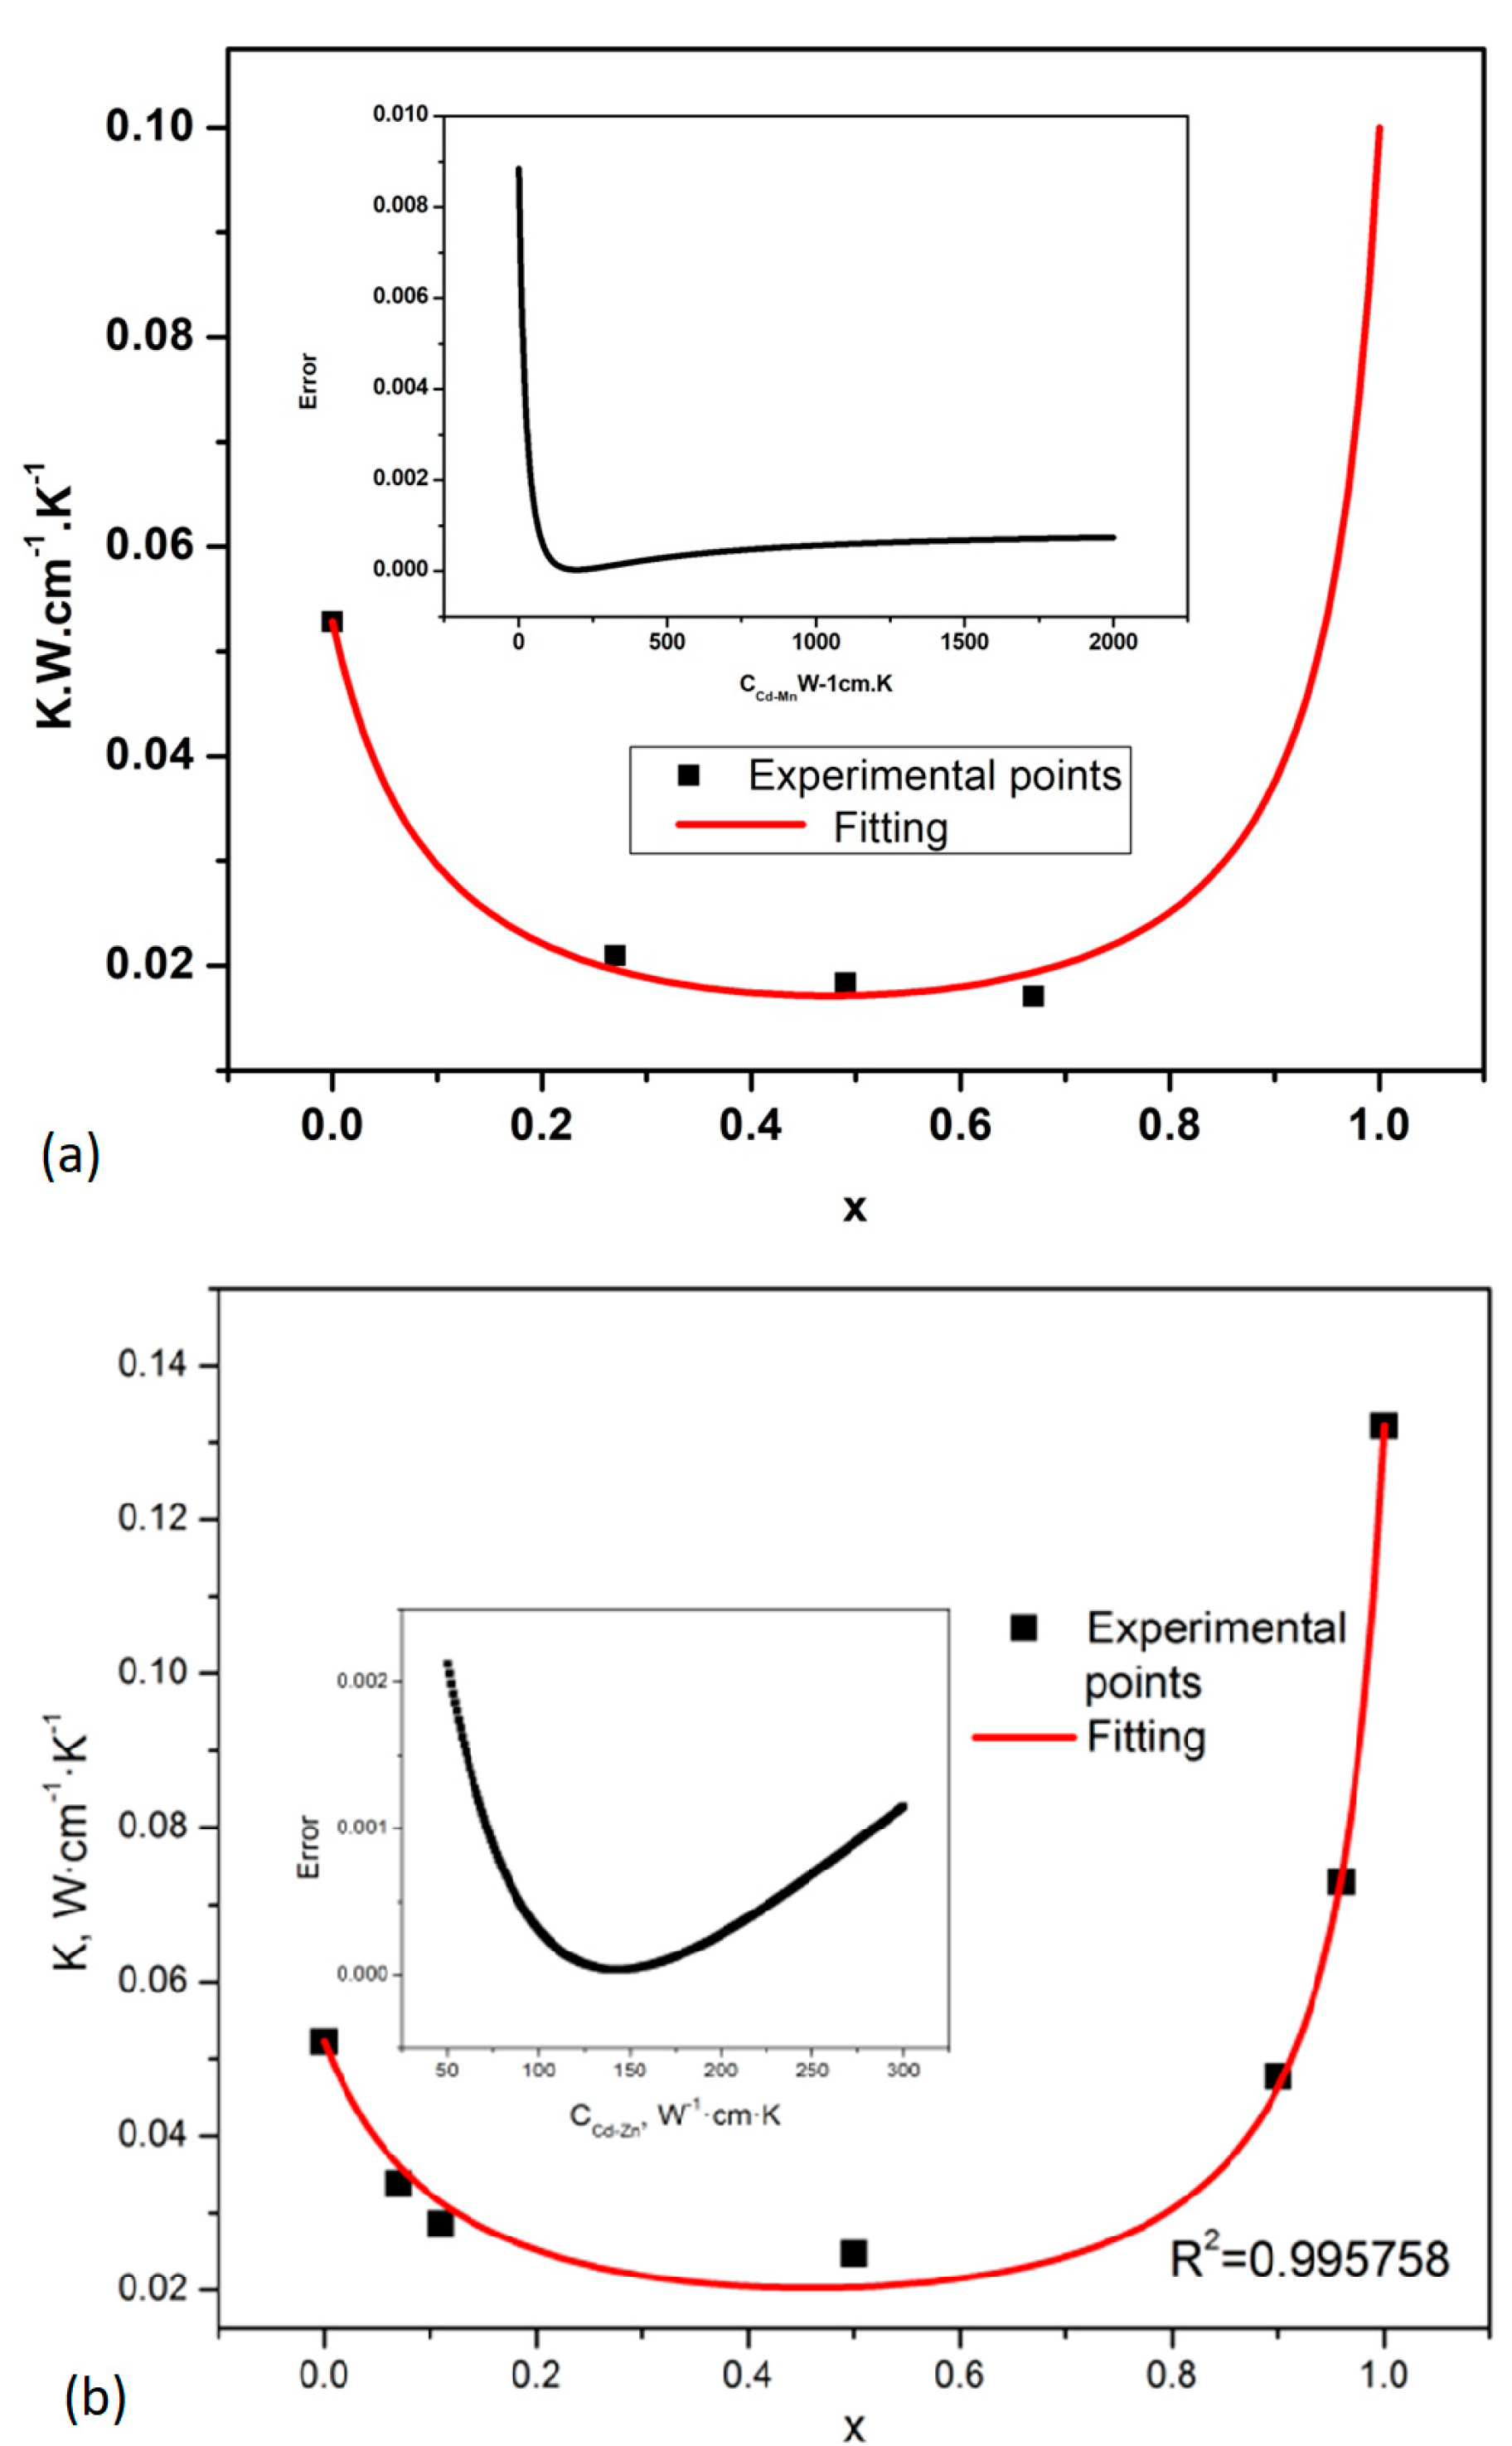
A similar procedure was also carried out for CZT (Figure 6a) and CMT (Figure 6b) mixed crystals. Additional thermal resistivities describing the lattice disorder were determined as 143 W−1·cm·K and 175 W−1·cm·K for the CZT and CMT compounds, respectively. These values are much lower if we compare them with the CBT case.
It was mentioned that the CBT crystal homogeneity is better than those of the CZT and CMT, however, at the same time, the crystal quality is getting worse. One can say that introducing Zn and Mn into the CdTe matrix generates similar disorder effects, while Be the highest one. However, beryllium can still be a good candidate since, to tune the energy gap or increase the CdTe crystal’s micro–hardness, one needs a much smaller concentration than in the case of zinc or manganese.

4. Conclusions

We studied the thermal properties and lattice disorder effects of ternary CdTe–based wide–band gap semiconductor compounds in this work. We grew crystals from the melt by high–pressure, high–temperature Bridgman technique. CBT crystals were produced for a different composition (x = 0.00, 0.01, 0.03, 0.05, and 0.1) and then prepared for characterization. We used the PPE technique to determine the thermal properties of the specimens under investigation. We derived the thermal diffusivity and effusivity from the back and front configurations. Because the thermal diffusivity and effusivity are interconnected, we calculated the thermal conductivity value. This way, a complete thermal characterization of the samples as a function of the composition was achieved.
We compared the obtained thermal parameters of the CBT alloy with the previously grown CMT and CZT mixed ternary crystals. We found the thermal conductivity of CBT to be generally less than the CMT and CZT as the function of composition. Introducing Be to the CdTe matrix caused many different types of defect generation within the crystal lattice. To quantitatively analyze this phenomenon, we applied the Adachi model. Thanks to that, we could find all compounds’ compositional dependence on the lattice thermal resistivity. It turned out to be possible, even without results for binary BeTe and MnTe. From the theoretical fitting to experimental points, we derived the following values of the additional thermal resistivity arising from the lattice disorder: CCd–Be = 474 W−1·cm·K, CCd–zn = 143 W−1·cm·K, and CCd–Mn = 175 W−1·cm·K for CBT, CZT, and CMT crystals, respectively. One can conclude that introducing Zn and Mn into the CdTe matrix generates similar disorder effects, while Be has much higher ones. However, we believe that beryllium can still be a good candidate to replace the zinc in the CdTe matrix. Tuning the energy gap or increasing the CdTe crystal’s micro–hardness should require a much smaller concentration of beryllium than zinc or manganese. To analyze this problem, we plan to conduct a more detailed characterization of grown CdBeTe crystals.

Author Contributions

Conceptualization, D.S. and K.S.; methodology, K.S. and A.A.-B.; validation, K.S.; formal analysis, D.S. and K.S.; investigation, D.S. and A.A.; resources, D.S. and K.S.; data curation, D.S.; writing—original draft preparation, D.S.; writing—review and editing, D.S., K.S., A.A. and A.A.-B.; visualization, D.S. All authors have read and agreed to the published version of the manuscript.

Funding

This research received no external funding.

Data Availability Statement

All data are fully available without restriction. The datasets used and/or analyzed during the current study are available from the corresponding author upon reasonable request.

Conflicts of Interest

The authors declare no conflict of interest.

References

  1. Fang, X.; Roushan, M.; Zhang, R.; Peng, J.; Zeng, H.; Li, J. Tuning and Enhancing White Light Emission of II–VI Based Inorganic–Organic Hybrid Semiconductors as Single–Phased Phosphors. Chem. Mater. 2012, 24, 1710–1717. [Google Scholar] [CrossRef]
  2. Ehinger, M.; Koch, C.; Korn, M.; Albert, D.; Nürnberger, J.; Hock, V.; Faschinger, W.; Landwehr, G. High quantum efficiency II–VI photodetectors for the blue and blue–violet spectral range. Appl. Phys. Lett. 1998, 73, 3562. [Google Scholar] [CrossRef]
  3. Ishibashi, A. Blue–Green Laser Diodes. IEEE J. Sel. Top. Quantum Electron. 1995, 1, 741. [Google Scholar] [CrossRef]
  4. Isshiki, M.; Wang, J. Wide–Bandgap II–VI Semiconductors: Growth and Properties. In Springer Handbook of Electronic and Photonic Materials; Springer Handbooks; Kasap, S., Capper, P., Eds.; Springer: Berlin/Heidelberg, Germany, 2017; pp. 365–384. [Google Scholar]
  5. Zyoud, S.H.; Zyoud, A.H.; Ahmed, N.M.; Abdelkader, A.F.I. Numerical Modelling Analysis for Carrier Concentration Level Optimization of CdTe Heterojunction Thin Film–Based Solar Cell with Different Non–Toxic Metal Chalcogenide Buffer Layers Replacements: Using SCAPS–1D Software. Crystals 2021, 11, 1454. [Google Scholar] [CrossRef]
  6. Lin, Y.; Qin, Q.; Wang, X.; Chen, J.; Li, L.; Jiang, J.; He, Y.; Wang, X.; Zhao, P.; Yuan, S. Effect of Annealing on the Structure of Composite Passivation Films Prepared by Magnetron Sputtering Deposition on the Surface of HgCdTe. Crystals 2022, 12, 983. [Google Scholar] [CrossRef]
  7. Szeles, C.; Soldner, S.A.; Vydrin, S.; Graves, J.; Bale, D.S. CdZnTe Semiconductor Detectors for Spectroscopic X–ray Imaging. IEEE Trans. Nucl. Sci. 2008, 55, 572. [Google Scholar] [CrossRef]
  8. Park, S.; Kim, H. Growth and Fabrication Method of CdTe and Its Performance As a Radiation. J. Korean Phys. Soc. 2015, 66, 27–30. [Google Scholar] [CrossRef]
  9. Roy, U.N.; Bolotnikov, A.E.; Camarda, G.S.; Cui, Y.; Hossain, A.; Lee, K.; Lee, W.; Tappero, R.; Yang, G.; Gul, R. High compositional homogeneity of CdTexSe1−x crystals grown by the Bridgman method. APL Mater. 2015, 3, 026102. [Google Scholar] [CrossRef]
  10. Yim, W.M.; Dismukes, J.P.; Stofko, E.J.; Paff, R.J. Synthesis and some properties of BeTe, BeSe and BeS. J. Phys. Chem. Solids 1972, 33, 501. [Google Scholar] [CrossRef]
  11. Waag, A.; Fischer, F.; Lugauer, H.J.; Litz, T.; Laubender, J.; Lunz, U.; Zehnder, U.; Ossau, W.; Gerhardt, T.; Landwehr, G. Molecular–beam epitaxy of beryllium chalcogenide based thin films and quantum well structures. J. Appl. Phys. 1996, 792, 792–796. [Google Scholar] [CrossRef]
  12. Nagelstraßer, M.; Dröge, H.; Steinrück, H.P.; Fischer, F.; Litz, T.; Waag, A.; Landwehr, G.; Fleszar, A.; Hanke, W. Band structure of BeTe: A combined experimental and theoretical study. Phys. Rev. B 1998, 58, 10394. [Google Scholar] [CrossRef] [Green Version]
  13. Strzałkowski, K. The composition effect on the thermal and optical properties across CdZnTe crystals. J. Phys. D Appl. Phys. 2016, 49, 435106. [Google Scholar] [CrossRef]
  14. Theurich, G.; Hill, N.A. First–principles approach to spin–orbit coupling in dilute magnetic semiconductors. Phys. Rev. B 2002, 66, 115208. [Google Scholar] [CrossRef]
  15. Strzałkowski, K.; Firszt, F.; Marasek, A. Thermal Diffusivity, Effusivity, and Conductivity of CdMnTe Mixed Crystals. Int. J. Thermophys. 2014, 35, 2140–2149. [Google Scholar] [CrossRef] [Green Version]
  16. Dong, J.; Sun, F.; Tang, H.; Hayashi, K.; Li, H.; Shang, P.; Miyazaki, Y.; Li, J. Reducing Lattice Thermal Conductivity of MnTe by Se Alloying toward High Thermoelectric Performance. ACS Appl. Mater. Interfaces 2019, 11, 28221–28227. [Google Scholar] [CrossRef]
  17. Yang, G.; Gu, G.; Bolotnikov, A.E.; Cui, Y.; Camarda, G.S.; Hossain, A. Structural, electrical, and optical properties of CdMnTe crystals grown by modified floating–zone technique. Electr. Mater. Lett. 2015, 11, 500–504. [Google Scholar] [CrossRef]
  18. Zaiour, A.; Charara, J.; Hamdoun, B.; Hamié, A.; Hage–ali, M. Electrical Properties Study of Three Highly Purified CdTe Ingots. Phys. Procedia. 2014, 55, 470–475. [Google Scholar] [CrossRef] [Green Version]
  19. Kamieniecki, E. Effect of charge trapping on effective carrier lifetime in compoundsemiconductors: High resistivity CdZnTe. J. Appl. Phys. 2014, 116, 193702. [Google Scholar] [CrossRef]
  20. Chirtoc, M.; Mihilescu, G. Theory of the photopyroelectric method for investigation of optical and thermal materials properties. Phys. Rev. B 1989, 40, 9606–9617. [Google Scholar] [CrossRef]
  21. Maliński, M.; Chrobak, Ł. Investigations and modeling aspects of the influence of the high energy and high dose implantation on the optical and transport parameters of implanted layers in silicon. Phys. B Condens. Matter 2020, 578, 411851. [Google Scholar] [CrossRef]
  22. Chrobak, Ł.; Korte, D.; Budasheva, H.; Maliński, M.; Rodič, P.; Milošev, I.; Janta–Lipińska, S. Investigations of the Thermal Parameters of Hybrid Sol–Gel Coatings Using Nondestructive Photothermal Techniques. Energies 2022, 15, 4122. [Google Scholar] [CrossRef]
  23. Bale, D.S.; Szeles, C. Electron transport and charge induction in cadmium zinc telluride detectors with space charge build up under intense x–ray irradiation. J. Appl. Phys. 2010, 107, 114512. [Google Scholar] [CrossRef]
  24. Adachi, S. Lattice thermal conductivity of group–IV and III–V semiconductor alloys. J. Appl. Phys. 2007, 102, 063502. [Google Scholar] [CrossRef] [Green Version]
  25. Firszt, F.; Łegowski, S.; Meczynska, H.; Szatkowski, J.; Paszkowicz, W.; Godwod, K. Growth and characterisation of Zn1−xBexSe mixed crystals. J. Cryst. Growth 1998, 184/185, 1335. [Google Scholar] [CrossRef]
  26. Strzalkowski, K.; Dadarlat, D.; Streza, M.; Firszt, F. On the optimization of experimental parameters in photopyroelectric investigation of thermal diffusivity of solids. Thermochim. Acta 2015, 614, 232–238. [Google Scholar] [CrossRef]
  27. Strzałkowski, K. Effect of lattice disorder on the thermal conductivity of ZnBeSe, ZnMgSe and ZnBeMgSe crystals. Mater. Chem. Phys. 2015, 163, 453–459. [Google Scholar] [CrossRef]
  28. Degheidy, A.R.; Elkenany, E.B.; Madkour, M.A.K.; Ahmed AbuAli, M. Temperature dependence of phonons and related crystal properties in InAs, InP and InSb zinc–blende binary compounds. Comput. Condens. Matter 2018, 16, e00308. [Google Scholar] [CrossRef]
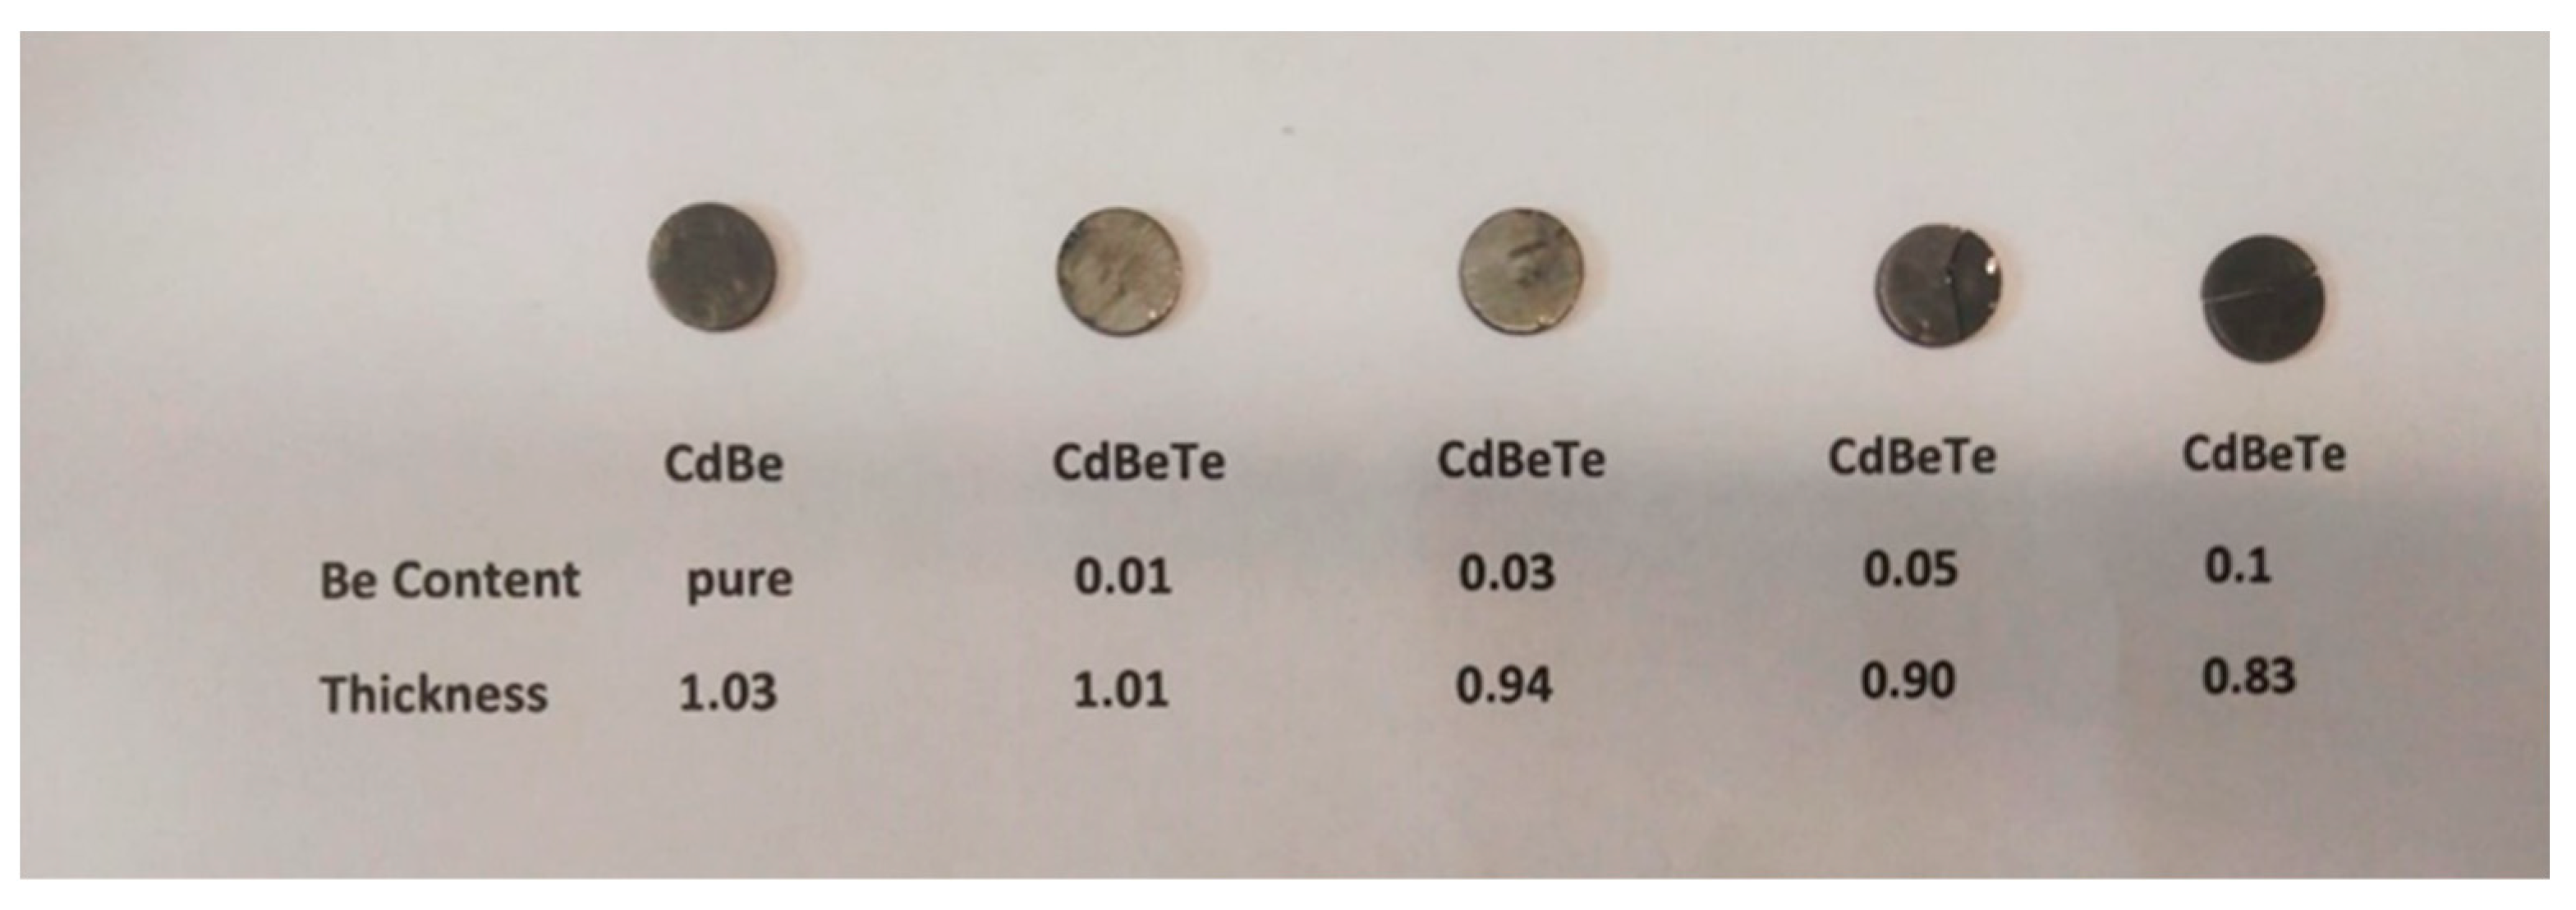
Figure 1. Prepared crystals for all the different Be content with thickness measurements.
Crystals 12 01555 g001
Figure 2. Front and back PPE detection configurations.
Crystals 12 01555 g002
Figure 3. Phase (a) and amplitude (b) characteristics of the CdBeTe samples for all Be content in case of back configuration. Squares refer to experimental points. Lines are linear fits.
Crystals 12 01555 g003
Figure 4. Phase (a) and amplitude (b) characteristics of CdBeTe crystals for front configuration as a function of the modulation frequency. Squares refer to experimental points, and lines are the best fits of Equations (7) and (8) performed with the least square method.
Crystals 12 01555 g004
Figure 5. Thermal conductivity curve versus composition for CBT mixed crystals. The points are the experimental data, and the line is fitted and obtained using Equation (14). The error graph arising from the least square approach is presented in the inset.
Crystals 12 01555 g005
Figure 6. Thermal conductivity curve versus composition for CMT (a) and CZT (b) mixed crystals. The points are the experimental data, and the line is fitted and obtained using Equation (14). The error graphs from the least square approach are presented in the inset.
Crystals 12 01555 g006
Table 1. Measured thermal parameters of Cd1–xBexTe crystals.
Crystal
Composition x
Thermal Diffusivity
(m2·s−1) ×10−6
Thermal Effusivity
(W·s1/2·m−2·K−1)
R2 (Effusivity from the Phase)Thermal Conductivity (W·m−1·K−1)
04.629 ± 0.0192656.0 ± 53.50.9985.714 ± 0.0.127
0.013.64 ± 0.0452323.8 ± 36.40.9954.437 ± 0.097
0.032.112 ± 0.1091725.8 ± 8.70.9822.516 ± 0.078
0.051.946 ± 0.0061730.0 ± 28.60.9902.413 ± 0.043
0.101.592 ± 0.0301613.8 ± 19.30.9771.998 ± 0.043
Table 2. Thermal conductivity of Cd1–xMnxTe [15] and Cd1–xZnxTe crystals [13].
CompoundxThermal Conductivity (W·m−1·K−1)
Cd1–xMnxTe0.272.1 ± 0.0172
0.491.84 ± 0.028
0.671.71 ± 0.0136
Cd1–xZnxTe0.073.374 ± 0.027
0.112.856 ± 0.012
0.502.473 ± 0.040
0.904.77 ± 0.050
0.967.294 ± 0.045
1.0013.214 ± 0.204
Publisher’s Note: MDPI stays neutral with regard to jurisdictional claims in published maps and institutional affiliations.