Abstract
In this paper, the sol-gel technique has been employed to prepare the pure and TM (Mn, Cr) doped BiFeO3 nanoparticles. The synthesized nanoparticles were characterized using X-ray diffraction, UV-vis spectroscopy, photoluminescence, and dielectric measurements. Crystal structural analysis infers that pure and TM-doped BiFeO3 nanoparticles displayed a rhombohedral distorted perovskite structure with R3c space group, along with a minor phase of Bi2Fe4O9. Lattice parameters have been found to decrease with TM doping. The particle size, measured with the help of the XRD spectra, was found to decrease from 54.4 nm to 38.7 nm with TM doping. The bandgap, determined using the UV-vis spectra, was observed to be 1.92, 1.66, and 1.54 eV for undoped, 5% Mn, and 5% Cr-doped BiFeO3 nanoparticles, respectively. The dielectric constant shows a normal dispersion behavior at room temperature and its value increases with TM doping. The ac conductivity also increases with TM doping in BiFeO3 nanoparticles.
1. Introduction
In the past few decades, nanomaterials have gained considerable attention in the scientific community because of their unique structural, chemical, and physical properties [1,2,3,4,5,6]. In particular, magnetic nanostructures are important due to their numerous advanced technological applications, such as high-density magnetic recording, catalysts, targeted drug delivery, genetic screening, biochemical, and toxicity cleansing, magnetic cell sorting schemes, magnetocytolysis agents for the treatment of localized cancerous tumors, multiferroic, microwave devices as well as their magnetic random access memory, disk-drive read heads, bolometers, and magnetic field sensors, magnetic Ferrofluids [7,8,9,10,11,12,13]. Furthermore, magnetic materials that have a spinel structure (AB2O4) and perovskite (ABO3) have shown remarkable physical properties, for example, colossal magnetoresistance (CMR), multiferroic, high sensitivity of magnetization to applied stress, excellent chemical stability, and a large magneto-optic effect [14,15,16,17]. Additionally, the co-existence of two ferroic orderings (known as multiferroic) in a single material creates a great probability for the fabrication of multifunctional devices that are appropriate for applications such as multistate memory devices, high energy density capacitors data storage, magnetoelectric sensor, etc. [18,19,20,21,22,23,24,25,26,27]. The BiFeO3 with a perovskite structure of ABO3 type has gained the attention of the researcher as a result of its high temperature G-type antiferromagnetic ordering (643 K) and ferroelectric (1100 K) transition temperature. The room temperature magnetoelectric behavior of BiFeO3 enhances its functionality and makes it the most suitable materials for device fabrication, which can be easily operated at or above room temperature. The BiFeO3 has a distorted rhombohedral structure with the R3c space group; it is very difficult to synthesize single phase crystal structures due to its thermal instability. Therefore, the growth of single phase BiFeO3 remains a challenge for researchers. However, it is reported that minor secondary phases, together with the distorted spiral spin structure of BFO, play an important role in the optimization of ferromagnetic properties, as well as in ferroelectric properties [18,24]. However, it is worth noting that the presence of a secondary phase creates the oxygen non-stoichiometry, and this results in a mixed oxidation state of Fe (Fe2+ and Fe3+). The presence of a mixed oxidation state of Fe is responsible for the low resistivity, and is therefore accountable for a large leakage current which impedes the ferroelectric properties of BiFeO3. In order to overcome these problems, some groups have suggested that the doping of transition metal (TM) ions at the B site or rare-earth (RE) ions B site can alter the ferroelectric and ferromagnetic properties of BiFeO3 [28,29,30,31,32]. Therefore, at present, the effect of TM (Cr and Mn) on the structural, optical and electrical properties of BiFeO3 are studied. The nanostructure of pure BiFeO3 and 5% Mn and Cr doped BiFeO3 were synthesized using sol-gel technique. Numerous characterization techniques were used to study the crystal structure, the optical and electrical properties of pure BiFeO3 and 5% Mn, and the Cr doped BiFeO3 nanoparticles.
2. Experimental Details
The Sol-gel technique was used to prepare the BiFe1−xTMxO3 (x = 0.0, and 0.5; and TM = Mn, Cr) nanoparticles. In this synthesis, bismuth nitrate pentahydrate (Bi(NO3)3·5H2O), iron nitrate nonahydrate (Fe(NO3)3·9H2O), manganese nitrate tetrahydrate (Mn(NO3)2·4H2O), and chromium nitrate nonahydrate (Cr(NO3)3·9H2O) were used as received from the company without any additional treatment. All the chemicals purchased from Sigma Aldrich were of 99.9% purity. All the reagents used in the synthesis were of analytical grade and purchased from Central Drug House (CDH), New Delhi, India. All of the chemicals were weighed in stoichiometric amounts and prepared in a solution of 0.1 M. An appropriate amount of citric acid (C6H8O7) was dissolved in double distilled water to obtain a solution of 0.1 M. Thereafter, the ratio of the citric acid and metal nitrates was retained at 1:1, and the mixture was stirred at room temperature to make a solvent for further reactions. Subsequently, the proper amount of bismuth nitrate pentahydrate was added to the solvent and some amount of concentrated nitric acid (HNO3) was also used to dissolve bismuth ferrite. As soon as Bi(NO3)3·5H2O was dissolved, then (Mn(NO3)2·4H2O), (Cr(NO3)3·9H2O) and (Fe(NO3)3·9H2O) were added, as per their pre-decided ratio, for the synthesis of % Mn and Cr doped BiFeO3 nanoparticles. Finally, the ethylene glycol was added to the mixture under vigorous stirring at 90 °C, to form a gel, and left to dry completely. The obtained product was ground well and calcined at 550 °C for 2 h. The crystal structure of the prepared pure and TM-doped BiFeO3 nanoparticles was studied using a Bruker AXS D8 X-ray diffractometer (MPD 3040, EA Almelo, The Netherlands) with Cu Kα radiation (λ = 1.54178 Å) in θ-2θ mode at room temperature. The optical properties of the prepared samples were studied using UV–vis absorption spectroscopy, executed using a Model LAMBDA 35, PerkinElmer (Waltham, MA, USA), at room temperature. The surface morphology of the TM-doped BFO was recorded via a field emission electron microscope (FESEM, JSM-7500, JEOL, Tokyo, Japan). The PL spectroscopy was studied by a luminescence spectrometer (JASCO, FP-6500), with a Xenon lamp as the excitation source, using the excitation wavelength of 325 nm. The dielectric properties were studied using a Novocontrol impedance analyzer at room temperature, in the frequency range of 1.0 Hz to 10 MHz. Before starting the dielectric measurements, the pallets of pure and TM-doped BiFeO3 were heated for 2 h at 100 °C to remove the moisture content and to homogenize the charge carriers. The surfaces of the circular disks were coated with conducting silver paste; which may act as good electrodes.
3. Results and Discussion
The crystal structure and phase identification of the pure and TM-doped BiFeO3 nanoparticles were studied using the X-ray diffraction (XRD) pattern. The XRD pattern, measured at room temperature in θ-2θ mode, is displayed in Figure 1a. The diffraction peaks observed in the XRD pattern demonstrate the polycrystalline nature of the nanoparticles. The XRD pattern was analyzed using the Rietveld refinement process, as shown in Figure 1a. The experimentally observed data points are represented by the black circle and the theoretically calculated pattern is indicated by the red solid line. The blue color lines show the difference between the theoretical and experimental data. Bragg’s positions of the crystal structure are demonstrated in the vertical pink color lines. The crystallographic parameters, determined from refinement, are presented in Table 1. In addition, χ2 demonstrates the quality and reliability of the refinement, as displayed in Table 1. All of the peaks in the XRD pattern have been allocated to the rhombohedral crystal structure with space group R3c. All of the diffraction peaks are consistent with the JCPDS number 86-1518. However, it is observed that a minor secondary phase of Bi2Fe4O9, with an orthorhombic crystal structure with space group Pbam is observed with small intensity, at ~28°. The peaks of the Bi2Fe4O9 phase match the JCPDS number 72-1832 [21]. The presence of a secondary phase can be attributed to the volatile nature of Bi3+ ions [33,34,35]. Moreover, the absence of any peak corresponding to Mn, Cr, or their oxides, clearly indicates that the TM ions replaced the Fe ions in the BiFeO3 lattice. The lattice parameters and unit cell volume, calculated from the XRD pattern, are shown in Table 1. The effect of TM doping on the crystallite size was studied using Scherrer’s formula (); here, K represents the shape factor and is the wavelength used to measure the XRD pattern. Furthermore, is the full width at half maximum (FWHM), and 2 highlights the Bragg’s angle. The calculated value of the crystallite sizes of pure, 5% Mn, and Cr doped BiFeO3 were found to be 54.4 nm, 46.4 nm, and 38.7 nm, respectively. The lattice strain (ε) was evaluated using the relation . It is observed that the strain increases with TM doping (see Table 1), from 2.27 × 10⁻³ to 3.68 × 10⁻³. From the analysis, it can be seen that the lattice parameters decrease with doping, and have the lowest value for 5% Cr doped BiFeO3. It is worth noting that the (012) peaks shift toward the higher 2θ with TM doping in BFO nanoparticles. The decrease in the lattice parameters and increase in the strain may be due to the difference in ion radii of Cr3+ (0.615 Å), Fe3+ (0.645 Å), and Mn2+ (0.80 Å) ions. Further, the lattice strain was calculated by fitting the peaks at ~22° and 32°, and averaging the value. As the lattice strain affects the lattice parameters and, in the present case, the lattice parameters have decreased, the results suggest that the nature of the lattice strain is compressive [36]. Figure 2a–c represent the scanning electron microscope (SEM) images of the undoped and doped BiFeO3. It can be seen from the SEM images that the TM-doped BFO samples are composed of nanocrystalline crystalline with a spherical morphology. The SEM images infer that the particles have agglomeration.
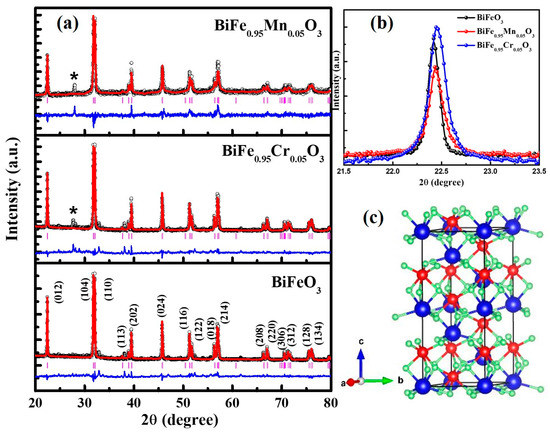
Figure 1.
(a) XRD pattern of pure, 5% Mn, and 5% Cr doped BFO nanoparticles along with secondary phase (Bi2Fe4O9) at 2θ = 28°, (b) peak shifting (012) plane of TM doped BFO nanoparticles, (c) Representation of unit cell structure of BFO nanoparticles.

Table 1.
Lattice parameters, crystallite size, strain and band gap of pure and TM doped BiFeO3 nanoparticles.
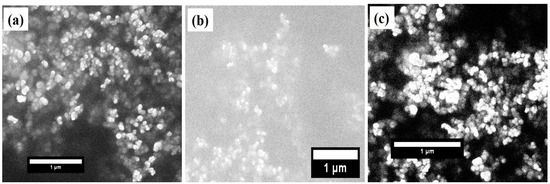
Figure 2.
SEM images of (a) pure BFO nanoparticles, (b) 5% Mn doped BFO nanoparticles, and (c) 5% Cr doped BFO nanoparticles.
The effect of TM doping on the optical properties of BiFeO3 was investigated using UV-vis spectroscopy at room temperature. Figure 3a highlights the absorption spectra of pure and TM-doped BiFeO3, recorded in the range of 500–800 nm. The absorption edges of pure and TM-doped BiFeO3 nanoparticles can be clearly seen in the wavelength range of 500–800 nm, which is the result of the d–d transitions of Fe3+ ions and the charge transfer excitations near the bandgap. Furthermore, the broad band around 700 nm is due to defect states (such as oxygen vacancies), or as a result of the on-site spin forbidden d–d crystal field excitations [35]. The Tauc’s plot ((αhν)2 = B (hν − Eg)) technique was utilized for the calculation of the band gap (Eg) of pure and TM-doped BiFeO3 nanoparticles [17], as shown in Figure 3b–d. Here, α is the absorption coefficient, h is Planck’s constant, B is the constant, and hν is the absorbed photon energy. The band gap was determined by extrapolating the fitted portion of the continuous linear region on the x-axis at zero absorption. The band gap, calculated using Tauc’s plot, were 1.92, 1.66, and 1.52 eV for pure, 5% Mn, and 5% Cr-doped BiFeO3 nanoparticles, respectively. The maximum bandgap is observed for pure BiFeO3 nanoparticles, which decrease with the TM doping bandgap. Several reasons have been discussed to explain the reduced band gap in the BFO nanoparticles. Gao et al. [36] reported the optical properties of Gd-doped BFO, performed using the first-principles calculation. They reported the bandgap decrease with Gd doping. They suggested that there is a formation of energy level in between Fe 3d and O 2p, due to hybridization associated with Gd3+ ions. Furthermore, Zhang [37] described the effect of A-site substitution of the structural and electronic properties of BFO. They observed that cations doping affects the bond length and the bond angle of Fe-O and Fe-O-Fe, and as a result, the band gap of BFO changes.
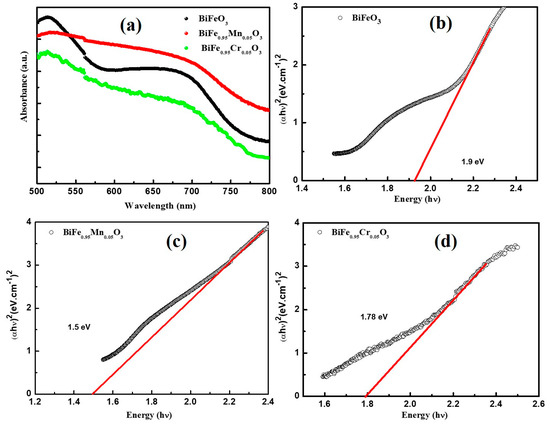
Figure 3.
(a) UV-Visible absorption spectra of pure BFO, Mn and Cr-doped BFO samples. (αhν)2 versus hν plots of (b) pure BFO nanoparticles, (c) 5% Mn nanoparticles, and (d) 5% Cr doped BFO nanoparticles.
Photoluminescence spectroscopy (PL) is an excellent tool for studying the band structure and defect states in materials science. Here, PL spectroscopy was utilized to further explore the band structure and defect states in pure and TM-doped BiFeO3 nanoparticles. Figure 4 shows the normalized PL response of pure and TM-doped BiFeO3 nanoparticles, measured in the wavelength range 375–650 nm. The PL spectra were recorded through the illumination of the nanoparticles, using the excitation wavelength of 325 nm. The PL spectra showed three bands in the wavelength range of 400–500 nm. The bands observed at 408 and 430 nm may be classified as UV emission bands, which is due to the electronic transitions between the conduction band and the valence band, whereas 456 nm lie in the visible region and can be called a visible emission band, which is produced by the luminescent centers [38]. The intensity of the PL spectra reflects the strength of the electronic transition and is associated with the recombination of the charge carriers. Here, it is evident that the intensity of the band decreases with TM doping, which infers that TM doping diminishes the recombination of the charge carriers.
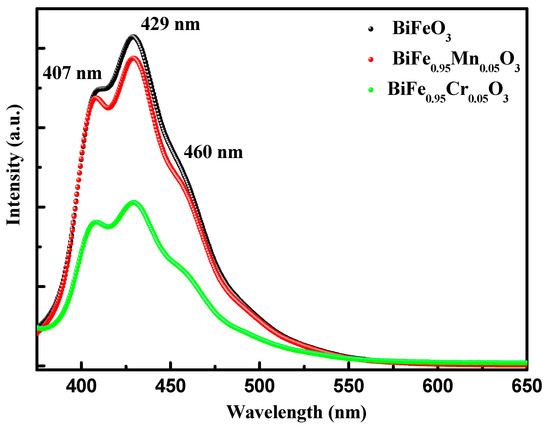
Figure 4.
Photoluminescence (PL) spectra of pure, 5% Mn, and 5% Cr doped BFO nanoparticles.
Dielectric spectroscopy has been used to study the effect of TM doping on the electrical properties of BiFeO3 nanoparticles, which are used to obtain information about the energy stored in the material. Figure 5 highlights the dielectric behavior of pure and TM-doped BiFeO3 nanoparticles, at room temperature, measured in the frequency range of 1.0 Hz to 10 MHz. The value of the dielectric constant (ε′) was determined using the relation , where C is the capacitance of the material under study, d and A are the thickness and area of the pellet, respectively. Furthermore, is the permittivity in a vacuum, equal to 8.854 × 10⁻¹² C2 N −1 m−2. It can be seen from Figure 5 that the dielectric constant of pure and TM-doped BiFeO3 nanoparticles shows normal dispersion behavior. It is observed that, at lower frequencies, the dielectric constant decreases rapidly, and this is ascribed to molecular polarization [39]. At the low frequency, these dipoles oscillate and align in the presence of an externally applied field. Moreover, it can be seen that the dielectric constant does not change at higher frequencies because the dipoles are not able to change their orientation with a rapidly oscillating electric field and fail to align with the applied field frequency. It is noteworthy that the dielectric constant increases with TM (Mn and Cr) doping in BiFeO3 nanoparticles. The value of the dielectric constant, measured at 100 Hz, was 47.0, 93.0, and 83 for pure, 5% Mn, and 5% Cr-doped BiFeO3 nanoparticles, respectively. Dielectric loss is one of the important physical properties for any device fabrication, which gives information about the loss of energy in materials that are dissipated into the form of heat. Figure 5 shows the variation in the dielectric loss () with its frequency at room temperature. It is found that the dielectric losses are higher at lower frequencies and decrease with increasing frequency. It is observed that the dielectric loss increases with TM doping (see inset in Figure 6) and has the maximum value for Cr-doped BiFeO3 nanoparticles. The increase in dielectric loss may be attributed to the relaxation polarization associated with the space charge regions. The doping may have increased the content of oxygen vacancies, resulting in the accumulation of charge carriers at the space charge regions. This may further increase the leakage density, resulting in a decrease in the dielectric loss. Figure 7 displays the ac conductivity (σac) versus frequency for pure and TM-doped BiFeO3 nanoparticles. The ac conductivity has been calculated using the relation σac = ε′ε0 ω tan δ. Here, ω = 2π f represents the angular frequency and tan δ is the loss tangent. It is found that ac conductivity increases with an increase in frequency. At lower frequencies, the ac conductivities of all of the samples merge; however, as the frequency increases, the curves diverge and separate with the increasing margins. Therefore, the ac conductivity has been found to increase with the increasing frequency for all of the samples, with the highest value observed for Mn-doped BiFeO3 nanoparticles.
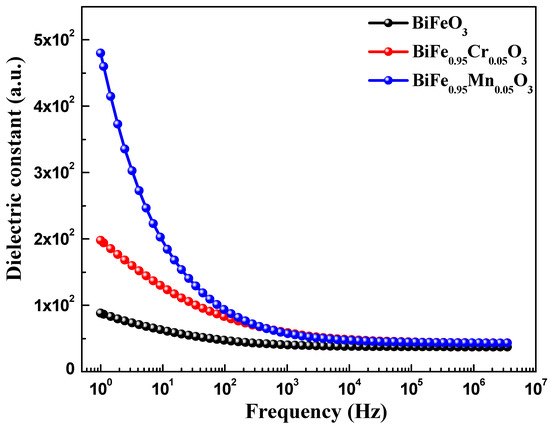
Figure 5.
Frequency dependent of dielectric constant pure, 5% Mn, and 5% Cr doped BFO nanoparticles.
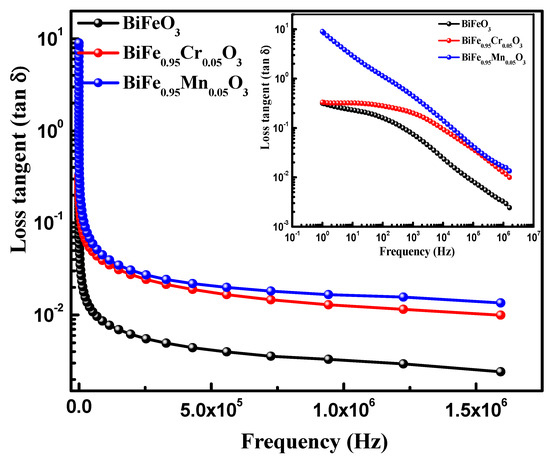
Figure 6.
Variations of loss tangent as functions of frequency of pure, 5% Mn, and 5% Cr doped BFO nanoparticles.
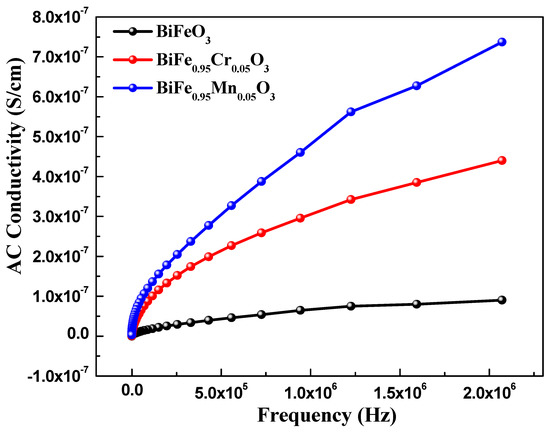
Figure 7.
AC conductivity of pure, 5% Mn, and 5% Cr doped BFO nanoparticles.
4. Conclusions
We have successfully synthesized pure and TM-doped BiFeO3 nanoparticles and investigated them using X-ray diffraction, UV-vis spectroscopy, photoluminescence, and dielectric measurements. The structural analysis revealed the rhombohedral distorted perovskite structure with R3c space group, along with a minor phase of Bi2Fe4O9, for pure and TM-doped BiFeO3 nanoparticles. The lattice parameters and particle sizes have been found to decrease with TM doping, as analyzed using XRD patterns. The bandgap was also found to decrease, by 1.90, 1.78, and 1.50 eV for undoped, 5% Cr, and 5% Mn-doped BiFeO3 nanoparticles, respectively, using a UV-vis spectra. The dielectric measurements at room temperature demonstrate that the dielectric constant shows a normal dispersion behavior, with an increasing value for TM doping. The ac conductivity was also found to increase with TM doping in BiFeO3 nanoparticles.
Author Contributions
Data curation, S.K.; Formal analysis, N.A.T. and S.K.; Funding acquisition, N.A.T. and A.A.; Methodology, A.A.; Resources, A.A.; Validation, S.K.; Visualization, S.K.; Writing—original draft, S.K.; Writing—review & editing, N.A.T., S.K. and A.A. All authors have read and agreed to the published version of the manuscript.
Funding
This work was supported by the Deanship of Scientific Research, Vice Presidency for Graduate Studies and Scientific Research, King Faisal University, Saudi Arabia [Project No. Grant1354], through its KFU Research Summer initiative.
Conflicts of Interest
The authors declare no conflict of interest.
References
- Nogués, J.; Sort, J.; Langlais, V.; Skumryev, V.; Suriñach, S.; Muñoz, J.; Baró, M. Exchange Bias in nanostructures. Phys. Rep. 2005, 422, 65–117. [Google Scholar] [CrossRef]
- Cai, W.; Wan, J. Facile Synthesis of Superparamagnetic Magnetite Nanoparticles in Liquid Polyols. J. Colloid Interface Sci. 2007, 305, 366–370. [Google Scholar] [CrossRef]
- Li, L.; Bi, H.; Gai, S.; He, F.; Gao, P.; Dai, Y.; Zhang, X.; Yang, D.; Zhang, M.; Yang, P. Uniformly Dispersed ZnFe2O4 Nanoparticles on Nitrogen-Modified Graphene for High-Performance Supercapacitor as Electrode. Sci. Rep. 2017, 7, 43116. [Google Scholar] [CrossRef]
- Hashim, M.; Kumar, S.; Shirsath, S.E.; Mohammed, E.M.; Chung, H.; Kumar, R. Studies on the Activation Energy from the Acconductivity Measurements of Rubber Ferrite Composites Containing Manganese Zinc Ferrite. Phys. B Condens. Matter 2012, 407, 4097–4103. [Google Scholar] [CrossRef]
- Sanyal, B.; Kumar, S.; Kumar, M.; Mittal, K.C.; Sharma, A. Alanine-EPR Dosimetry in 10 MeV Electron Beam to Optimize Process Parameters for Food Irradiation. Indian J. Pure Appl. Phys. 2012, 50, 870–873. [Google Scholar]
- Sharma, S.; Kumar, R.; Kumar, S.; Kumar, V.S.; Knobel, M.; Reddy, V.; Banerjee, A.; Singh, M. Magnetic Study of Mg0.95Mn0.05Fe2O4 Ferrite Nanoparticles. Solid State Commun. 2007, 141, 203–208. [Google Scholar] [CrossRef]
- Bric, J.M.; Bostock, R.M.; Silverstone, S.E. Rapid In Situ Assay for Indoleacetic Acid Production by Bacteria Immobilized on a Nitrocellulose Membrane. Appl. Environ. Microbiol. 1991, 57, 535–538. [Google Scholar] [CrossRef]
- Ishida, H.; Ishida, Y.; Kurosaka, Y.; Otani, T.; Sato, K.; Kobayashi, H. In Vitro and In Vivo Activities of Levofloxacin against Biofilm-Producing Pseudomonas Aeruginosa. Antimicrob. Agents Chemother. 1998, 42, 1641–1645. [Google Scholar] [CrossRef]
- Gabrielyan, L.; Hovhannisyan, A.; Gevorgyan, V.; Ananyan, M.; Trchounian, A. Antibacterial Effects of Iron Oxide (Fe3O4) Nanoparticles: Distinguishing Concentration-Dependent Effects with Different Bacterial Cells Growth and Membrane-Associated Mechanisms. Appl. Microbiol. Biotechnol. 2019, 103, 2773–2782. [Google Scholar] [CrossRef]
- Ranmadugala, D.; Ebrahiminezhad, A.; Manley-Harris, M.; Ghasemi, Y.; Berenjian, A. Magnetic Immobilization of Bacteria Using Iron Oxide Nanoparticles. Biotechnol. Lett. 2017, 40, 237–248. [Google Scholar] [CrossRef]
- Collins, D.; Luxton, T.; Kumar, N.; Shah, S.; Walker, V.K.; Shah, V. Assessing the Impact of Copper and Zinc Oxide Nanoparticles on Soil: A Field Study. PLoS ONE 2012, 7, e42663. [Google Scholar] [CrossRef]
- Rajeevan, N.E.; Pradyumnan, P.P.; Kumar, R.; Shukla, D.K.; Kumar, S.; Singh, A.K.; Patnaik, S.; Arora, S.K.; Shvets, I.V. Magnetoelectric Properties of BixCo2−xMnO4 (0 ≤ x ≤ 0.3). Appl. Phys. Lett. 2008, 92, 102910. [Google Scholar] [CrossRef]
- Kumari, S.; Sharma, P.; Yadav, S.; Kumar, J.; Vij, A.; Rawat, P.; Kumar, S.; Sinha, C.; Bhattacharya, J.; Srivastava, C.M.; et al. A Novel Synthesis of the Graphene Oxide-Silver (GO-Ag) Nanocomposite for Unique Physiochemical Applications. ACS Omega 2020, 5, 5041–5047. [Google Scholar] [CrossRef]
- Kim, G.W.; Kumar, S.; Chang, J.; Lee, C.G.; Koo, B.H. Magnetic and Electrical Properties of La0.7Ca0.3Mn0.95Co0.05O3 Epitaxial Layers by Pulsed Laser Deposition. Ceram. Int. 2012, 38, S443–S446. [Google Scholar] [CrossRef]
- Bian, J.L.; Seo, Y.J.; Kim, G.W.; Sung, C.H.; Kumar, S.; Lee, C.G.; Koo, B.H. Magnetoresistance Properties of 0.99La0.7(CaxSr1−x)0.3MnO3/0.01CuZnFe4O4 Composites. Ceram. Int. 2012, 38, S439–S442. [Google Scholar] [CrossRef]
- Kumari, A.; Kumari, K.; Ahmed, F.; Ahmad, M.M.; Sharma, J.; Vij, A.; Kumar, S. Role of Bi-Excess on Structural, Electrical, Optical, and Magnetic Properties BiFeO3 Nanoparticles. J. Mater. Sci. Mater. Electron. 2021, 32, 23968–23982. [Google Scholar] [CrossRef]
- Kumari, A.; Kumari, K.; Ahmed, F.; Alshoaibi, A.; Alvi, P.; Dalela, S.; Ahmad, M.M.; Aljawfi, R.N.; Dua, P.; Vij, A.; et al. Influence of Sm Doping on Structural, Ferroelectric, Electrical, Optical and Magnetic Properties of BaTiO3. Vacuum 2020, 184, 109872. [Google Scholar] [CrossRef]
- Gao, R.; Qin, X.; Wu, H.; Xu, R.; Liu, L.; Wang, Z.; Fu, C.; Cai, W.; Chen, G.; Deng, X. Effect of Ti Doping on the Dielectric, Ferroelectric and Magnetic Properties of Bi0.86La0.08Sm0.14FeO3 Ceramics. Mater. Res. Express 2019, 6, 106317. [Google Scholar] [CrossRef]
- Coondoo, I.; Panwar, N.; Rafiq, M.A.; Puli, V.S.; Katiyar, R.S. Structural, Dielectric and Impedance Spectroscopy Studies in (Bi0.90R0.10)Fe0.95Sc0.05O3 [R = La, Nd] Ceramics. Ceram. Int. 2014, 40, 9895–9902. [Google Scholar] [CrossRef]
- Rao, T.D.; Karthik, T.; Asthana, S. Investigation of Structural, Magnetic and Optical Properties of Rare Earth Substituted Bismuth Ferrite. J. Rare Earths 2013, 31, 370–375. [Google Scholar] [CrossRef]
- Kumar, A.; Varshney, D. Crystal Structure Refinement of Bi1−xNdxFeO3 Multiferroic by the Rietveld Method. Ceram. Int. 2012, 38, 3935–3942. [Google Scholar] [CrossRef]
- Sinha, A.; Bhushan, B.; Jagannath; Sharma, R.; Sen, S.; Mandal, B.; Meena, S.; Bhatt, P.; Prajapat, C.; Priyam, A.; et al. Enhanced Dielectric, Magnetic and Optical Properties of Cr-Doped BiFeO3 Multiferroic Nanoparticles Synthesized by Sol-Gel Route. Results Phys. 2019, 13, 102299. [Google Scholar] [CrossRef]
- Puhan, A.; Nayak, A.; Bhushan, B.; Praharaj, S.; Meena, S.; Rout, D. Enhanced Electrical, Magnetic and Optical Behaviour of Cr doped Bi0.98Ho0.02FeO3 Nanoparticles. J. Alloys Compd. 2019, 796, 229–236. [Google Scholar] [CrossRef]
- Matin, M.; Hossain, M.N.; Ali, A.; Hakim, M.; Islam, M. Enhanced Dielectric Properties of Prospective Bi0.85Gd0.15Fe1−xCrxO3 Multiferroics. Results Phys. 2019, 12, 1653–1659. [Google Scholar] [CrossRef]
- Seidel, J.; Maksymovych, P.; Batra, Y.; Katan, A.; Yang, S.-Y.; He, Q.; Baddorf, A.P.; Kalinin, S.V.; Yang, C.-H.; Yang, J.-C.; et al. Domain Wall Conductivity in La-Doped BiFeO3. Phys. Rev. Lett. 2010, 105, 197603. [Google Scholar] [CrossRef]
- Silva, J.; Reyes, A.; Esparza, H.; Camacho, H.; Fuentes, L. BiFeO3: A Review on Synthesis, Doping and Crystal Structure. Integr. Ferroelectr. 2011, 126, 47–59. [Google Scholar] [CrossRef]
- Spaldin, N.A.; Ramesh, R. Advances in Magnetoelectric Multiferroics. Nat. Mater. 2019, 18, 203–212. [Google Scholar] [CrossRef]
- Lee, C.-C.; Wu, J.-M. Studies on Leakage Mechanisms and Electrical Properties of Doped BiFeO3 Films. Electrochem. Solid-State Lett. 2007, 10, G58–G61. [Google Scholar] [CrossRef]
- Shami, M.Y.; Awan, M.; Anis-Ur-Rehman, M. The Effect of Heat Treatment on Structural and Multiferroic Properties of Phase-Pure BiFeO3. J. Electron. Mater. 2012, 41, 2216–2224. [Google Scholar] [CrossRef]
- Naganuma, H.; Miura, J.; Okamura, S. Ferroelectric, Electrical and Magnetic Properties of Cr, Mn, Co, Ni, Cu Added Polycrystalline BiFeO3 Films. Appl. Phys. Lett. 2008, 93, 052901. [Google Scholar] [CrossRef]
- Shannigrahi, S.R.; Huang, A.; Chandrasekhar, N.; Tripathy, D.; Adeyeye, A.O. Sc Modified Multiferroic BiFeO3 Thin Films Prepared through a Sol-Gel Process. Appl. Phys. Lett. 2007, 90, 022901. [Google Scholar] [CrossRef]
- Hu, G.D.; Cheng, X.; Wu, W.B.; Yang, C.H. Effects of Gd Substitution on Structure and Ferroelectric Properties of BiFeO3 Thin Films Prepared Using Metal Organic Decomposition. Appl. Phys. Lett. 2007, 91, 232909. [Google Scholar] [CrossRef]
- Wang, N.; Luo, X.; Han, L.; Zhang, Z.; Zhang, R.; Olin, H.; Yang, Y. Structure, Performance, and Application of BiFeO3 Nanomaterials. Nano-Micro Lett. 2020, 12, 81. [Google Scholar] [CrossRef] [PubMed]
- Kumar, S.; Srivastava, G.; Almutairi, G.; Ahmed, F.; Shaalan, N.M.; Dalela, S.; Kumar, R.; Kumar, A.P.; Alvi, P.; Chae, K.; et al. Electronic Structure and Electrochemical Properties of La-Doped BiFeO3 Nanoparticles. J. Electron Spectrosc. Relat. Phenom. 2021, 253, 147138. [Google Scholar] [CrossRef]
- Ramachandran, B.; Dixit, A.; Naik, R.; Lawes, G.; Rao, M.S.R. Charge Transfer and Electronic Transitions in polycrystalline BiFeO3. Phys. Rev. B 2010, 82, 012102. [Google Scholar] [CrossRef]
- Hongri, L.; Zuli, L.; Qing, L.; Kailun, Y. Electric and Magnetic Properties of Multiferroic (BiFeO3)1−x–(PbTiO3)x Films Prepared by the Sol–Gel Process. J. Phys. D Appl. Phys. 2006, 39, 1022–1027. [Google Scholar] [CrossRef]
- Zhang, Z.; Wu, P.; Chen, L.; Wang, J. Systematic Variations in Structural and Electronic Properties of BiFeO3 by A-Site Substitution. Appl. Phys. Lett. 2010, 96, 012905. [Google Scholar] [CrossRef]
- Kumari, K.; Aljawfi, R.N.; Chawla, A.; Kumar, R.; Alvi, P.; Alshoaibi, A.; Vij, A.; Ahmed, F.; Abu-Samak, M.; Kumar, S. Engineering the Optical Properties of Cu Doped CeO2 NCs for Application in White LED. Ceram. Int. 2020, 46, 7482–7488. [Google Scholar] [CrossRef]
- Arya, A.; Sharma, A.L. Structural, Electrical Properties and Dielectric Relaxations in Na+-Ion-Conducting Solid Polymer Electrolyte. J. Phys. Condens. Matter 2018, 30, 16. [Google Scholar] [CrossRef]


Publisher’s Note: MDPI stays neutral with regard to jurisdictional claims in published maps and institutional affiliations. |
© 2022 by the authors. Licensee MDPI, Basel, Switzerland. This article is an open access article distributed under the terms and conditions of the Creative Commons Attribution (CC BY) license (https://creativecommons.org/licenses/by/4.0/).