Article

Continuous Isolation of Particles with Varying Aspect Ratios up to Thin Needles Achieving Free-Flowing Products

Laboratory of Plant and Process Design, Department of Biochemical and Chemical Engineering, TU Dortmund University, D-44227 Dortmund, Germany
*
Author to whom correspondence should be addressed.
Crystals 2022, 12(2), 137; https://doi.org/10.3390/cryst12020137
Submission received: 29 December 2021 / Revised: 16 January 2022 / Accepted: 17 January 2022 / Published: 19 January 2022
(This article belongs to the Special Issue Recent Progress in Industrial Crystallization)

Abstract

:
The continuous vacuum screw filter (CVSF) for small-scale continuous product isolation of suspensions was operated for the first time with cuboid-shaped and needle-shaped particles. These high aspect ratio particles are very common in pharmaceutical manufacturing processes and provide challenges in filtration, washing, and drying processes. Moreover, the flowability decreases and undesired secondary processes of attrition, breakage, and agglomeration may occur intensively. Nevertheless, in this study, it is shown that even cuboid and needle-shaped particles (l-alanine) can be processed within the CVSF preserving the product quality in terms of particle size distribution (PSD) and preventing breakage or attrition effects. A dynamic image analysis-based approach combining axis length distributions (ALDs) with a kernel-density estimator was used for evaluation. This approach was extended with a quantification of the center of mass of the density-weighted ALDs, providing a measure to analyze the preservation of the inlet PSD statistically. Moreover, a targeted residual moisture below 1% could be achieved by adding a drying module (Tdry = 60 °C) to the modular setup of the CVSF.

Graphical Abstract

1. Introduction

The small-scale production of active pharmaceutical ingredients (APIs) has been traditionally performed in batch mode, including all process steps from raw material treatment to the final drug formulation [1,2,3]. Much effort has been made to mirror the progress achieved in continuous pharmaceutical reaction technology in the development of continuous crystallization apparatuses by realizing various concepts [1,4,5,6,7,8]. Since crystallization steps are included in more than 90% of API manufacturing processes, a high potential is seen in reliable continuous end-to-end manufacturing processes [5,9,10]. The major benefits of these integrated processes are the elimination of batch-to-batch variability, an increase in capacity either through parallelization of units or simply through longer plant run times, and a shorter time-to-market [5,6,11,12,13,14]. The latter arises with the opportunity to directly use the equipment designed in the research and development of a small-scale apparatus concept. Moreover, high-purity continuous crystallization is nowadays seen as the first downstream step to selectively determine the final product properties regarding the particle size distribution (PSD) and particle shape [1,4]. Thus, preserving the produced quality attributes is a crucial requirement for all subsequent isolation steps, namely, filtration, washing, and drying to achieve free-flowing particles usable for secondary processing.
Various research groups using different apparatuses showed recent advances in small-scale continuous product isolation. Alconbury Weston Ltd. launched the continuous filter carousel (CFC) to the market. A multitude of current publications shows the potential of automated, cyclic batch filtration in the CFC [9,15,16,17,18,19,20,21,22]. A second concept, the continuous rotary plate filter (CRPF) was invented as part of an integrated continuous manufacturing pilot plant of Continuus Pharmaceuticals. Recent studies showed the potential of combined filtration and washing in the CRPF as a part of an end-to-end continuous manufacturing process [10,23,24,25,26].
We developed the modular continuous vacuum screw filter (CVSF) in our research group and patented this innovative apparatus in 2021 [27]. The CVSF is used to efficiently perform all necessary product isolation steps after a preceding small-scale continuous crystallization in a fully continuous operation [27,28,29,30,31]. It provides salient features as its modularity allows a rapid adaption to varying material systems and throughputs. The CVSF is designed for a typical API production rate of 250–1000 kg per year, which can be transferred to an approximated volume flow rate of 10–100 mL min−1 of feed suspension [28]. It can be used in flexible modular connections of filtration, washing, and drying modules. The first characterization studies were performed with a well filterable model system of l-alanine/water resulting in bipyramidal particles [28,29]. For this system, suitable residual moistures of approx. 1% with a preserved PSD were obtained using two washing modules without an extra drying module [29]. Moreover, a narrow residence time distribution of the solid phase (RTDs) was defined as a fundamental requirement and thus, systematically proven in previous works [28,29]. A narrow RTDs is thereby explicitly demanded by the American Food and Drug Administration to ensure material traceability [32]. Furthermore, stable steady-state operation for more than one hour was demonstrated and product loss was negligible [29].
It is well known that particle bulk porosity, which is mainly defined by the particle shape and the width of the PSD, highly influences the processability with regard to filterability and solids handling [33]. To illustrate the dependence of particle shape on bulk properties, an analysis of five parameters (porosity, flowability, flow rate, tensile strength, and angle of internal friction) was performed by Pudasaini et al. using six different crystal habits of acetylic salicylic acid [34]. In general, higher aspect ratio shapes result in higher porosity and lower flowability. On the one hand, a higher porosity may influence the filterability of the crystals resulting in the potential need for additional modules to reach targeted residual moistures. On the other hand, a lower flowability may lead to breakage issues in the CVSF owing to increased compression.
Thereby, solid–liquid separation using filtration is highly dependent on the properties of the particles used. Besides device-specific constants (e.g., filter area, filter material, and pressure difference), the dehumidification challenges vary with particle size, cake porosity, and particle morphology [33]. Regarding the ‘crystal process chain’, these component-specific parameters are defined mainly by the preceding crystallization step. Thus, CVSF operability with various particle properties is an essential requirement for widespread industrial application. The above-mentioned bipyramidal l-alanine particles showed good filterability and a low breakage tendency due to their approximate spherical structure. However, for pharmaceutical crystals, smaller particle sizes between 50–500 µm and a mean particle size of around 80 µm is targeted to enable direct compression while still enabling dissolution in the human body [35]. Additionally, more anisotropic structures such as cuboid-shaped or needles-shaped particles are common for APIs [34,36,37]. The smaller particle size and varying shape result in a more challenging separation task defined by the filter cake resistance [33,38]. Referring to the Carman–Kozeny equation, higher residual moisture at the end of the filtration and washing process is expected for decreasing particle size, due to an increased filter cake resistance [33]. Therefore, a longer deliquoring time may be necessary. Moreover, for increasing aspect ratios the porosity often increases because particles with high aspect ratios tend to create high-porosity bulk solids [33]. This leads to a higher residual moisture at a constant liquid saturation degree after filtration or washing and therefore more pore liquid (higher free volume due to increased porosity) has to be evaporated during the subsequent drying process compared with spherical particles. Furthermore, for more elongated particles, major risks are particle breakage or increased attrition and agglomeration [39].
Especially for high aspect ratio particles, challenges regarding the measurement and evaluation are still remaining, since the calculation of the equivalent diameter deq as one-dimensional size descriptor is not suitable [39,40]. Therefore, various approaches for image-analysis-based measurements and simulations were developed in the past [38,40,41,42,43]. Especially in the group of Mazzotti [40,41,42], a multitude of scientific papers were published introducing the axis length distribution (ALD) as a two-dimensional approach using automated image analysis. ALDs show the corresponding particles with their respective major and minor axis lengths in a 2D illustration. From this, a sole qualitative comparison is possible and statements regarding changes in particle sizes are possible. Nevertheless, to the best of our knowledge, corresponding quantitative values as known from spherical particles (e. g., d50, d90–d10) have not yet been determined. However, this is an important prerequisite to being able to provide a quantitative statement about possible changes of the particle size before and after particle isolation.
The objective of this study is to demonstrate the broad applicability of CVSF for particles with varying aspect ratios and mean particle sizes while maintaining PSD and reducing residual moisture to free-flowing particles. As a first step, a quantitative measure is introduced enabling comparison of ALDs using 2D image analysis. Afterwards, crystal suspensions of l-alanine crystallized from aqueous solution with different l-glutamic acid concentrations were filtered. l-glutamic acid acts as a habit modifier and inhibits crystal growth selectively so that pure l-alanine crystals with varying shapes and sizes result. The following requirements are addressed:
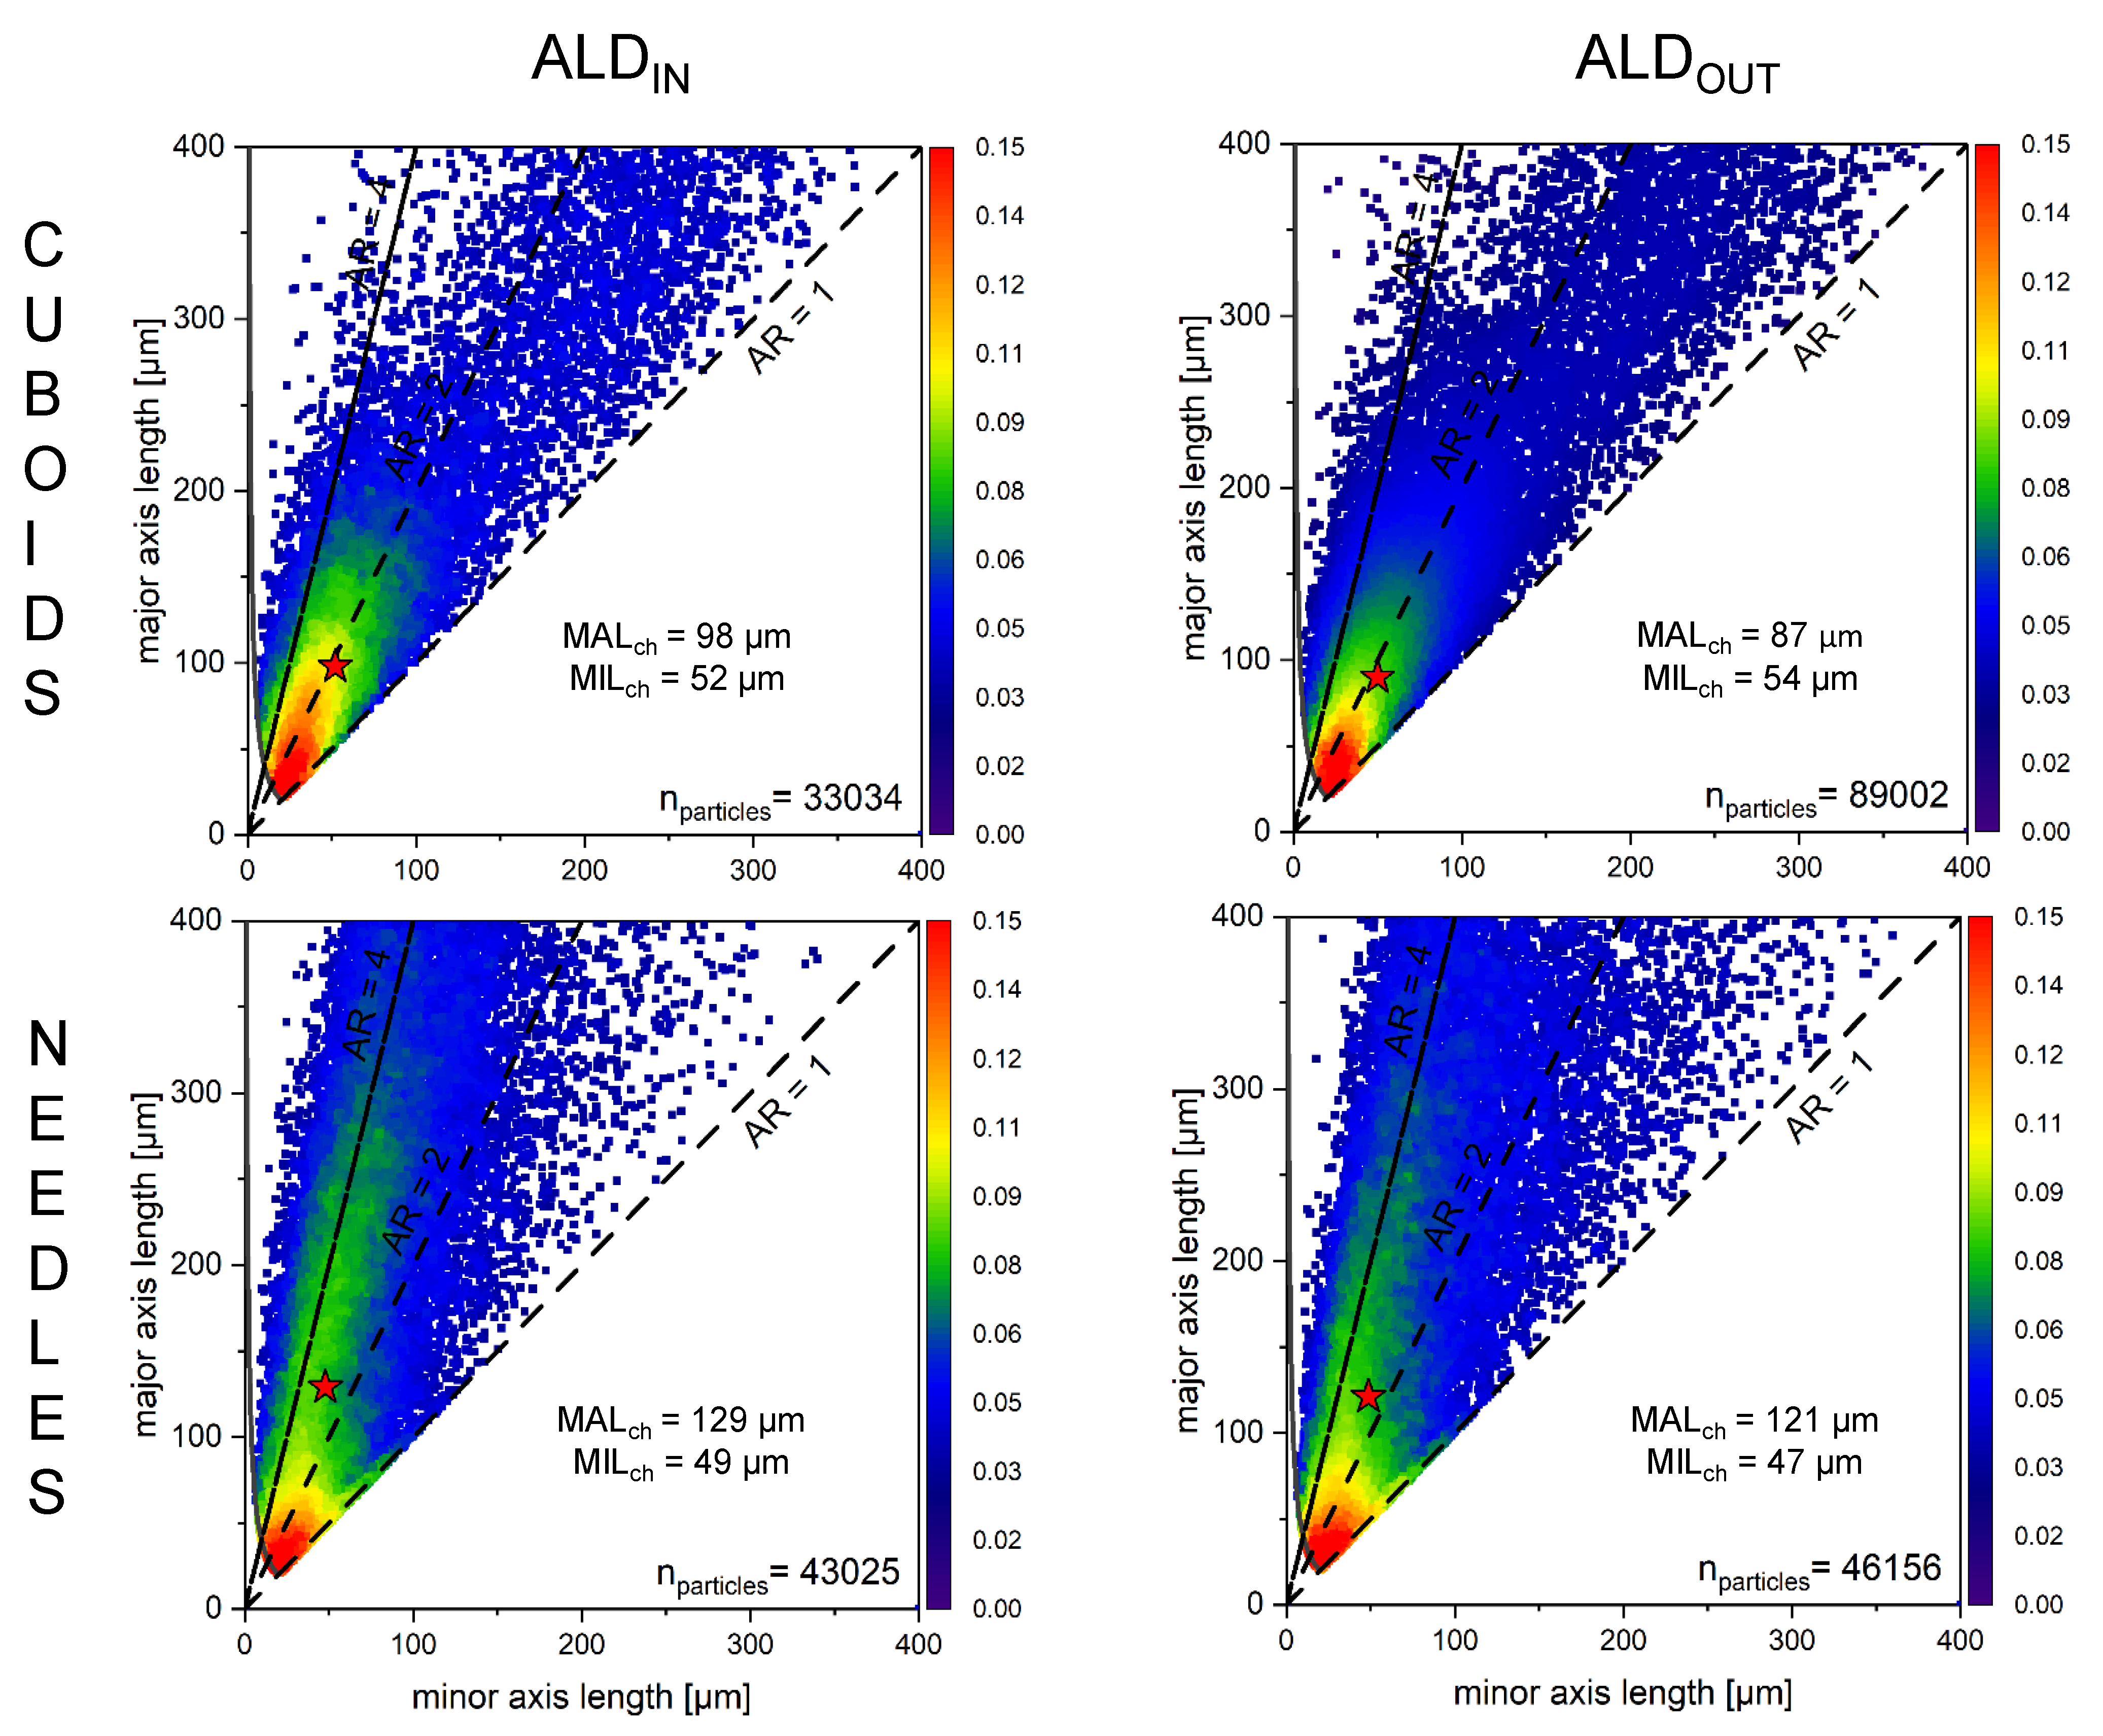
  • Maintaining ALD through particle isolation process
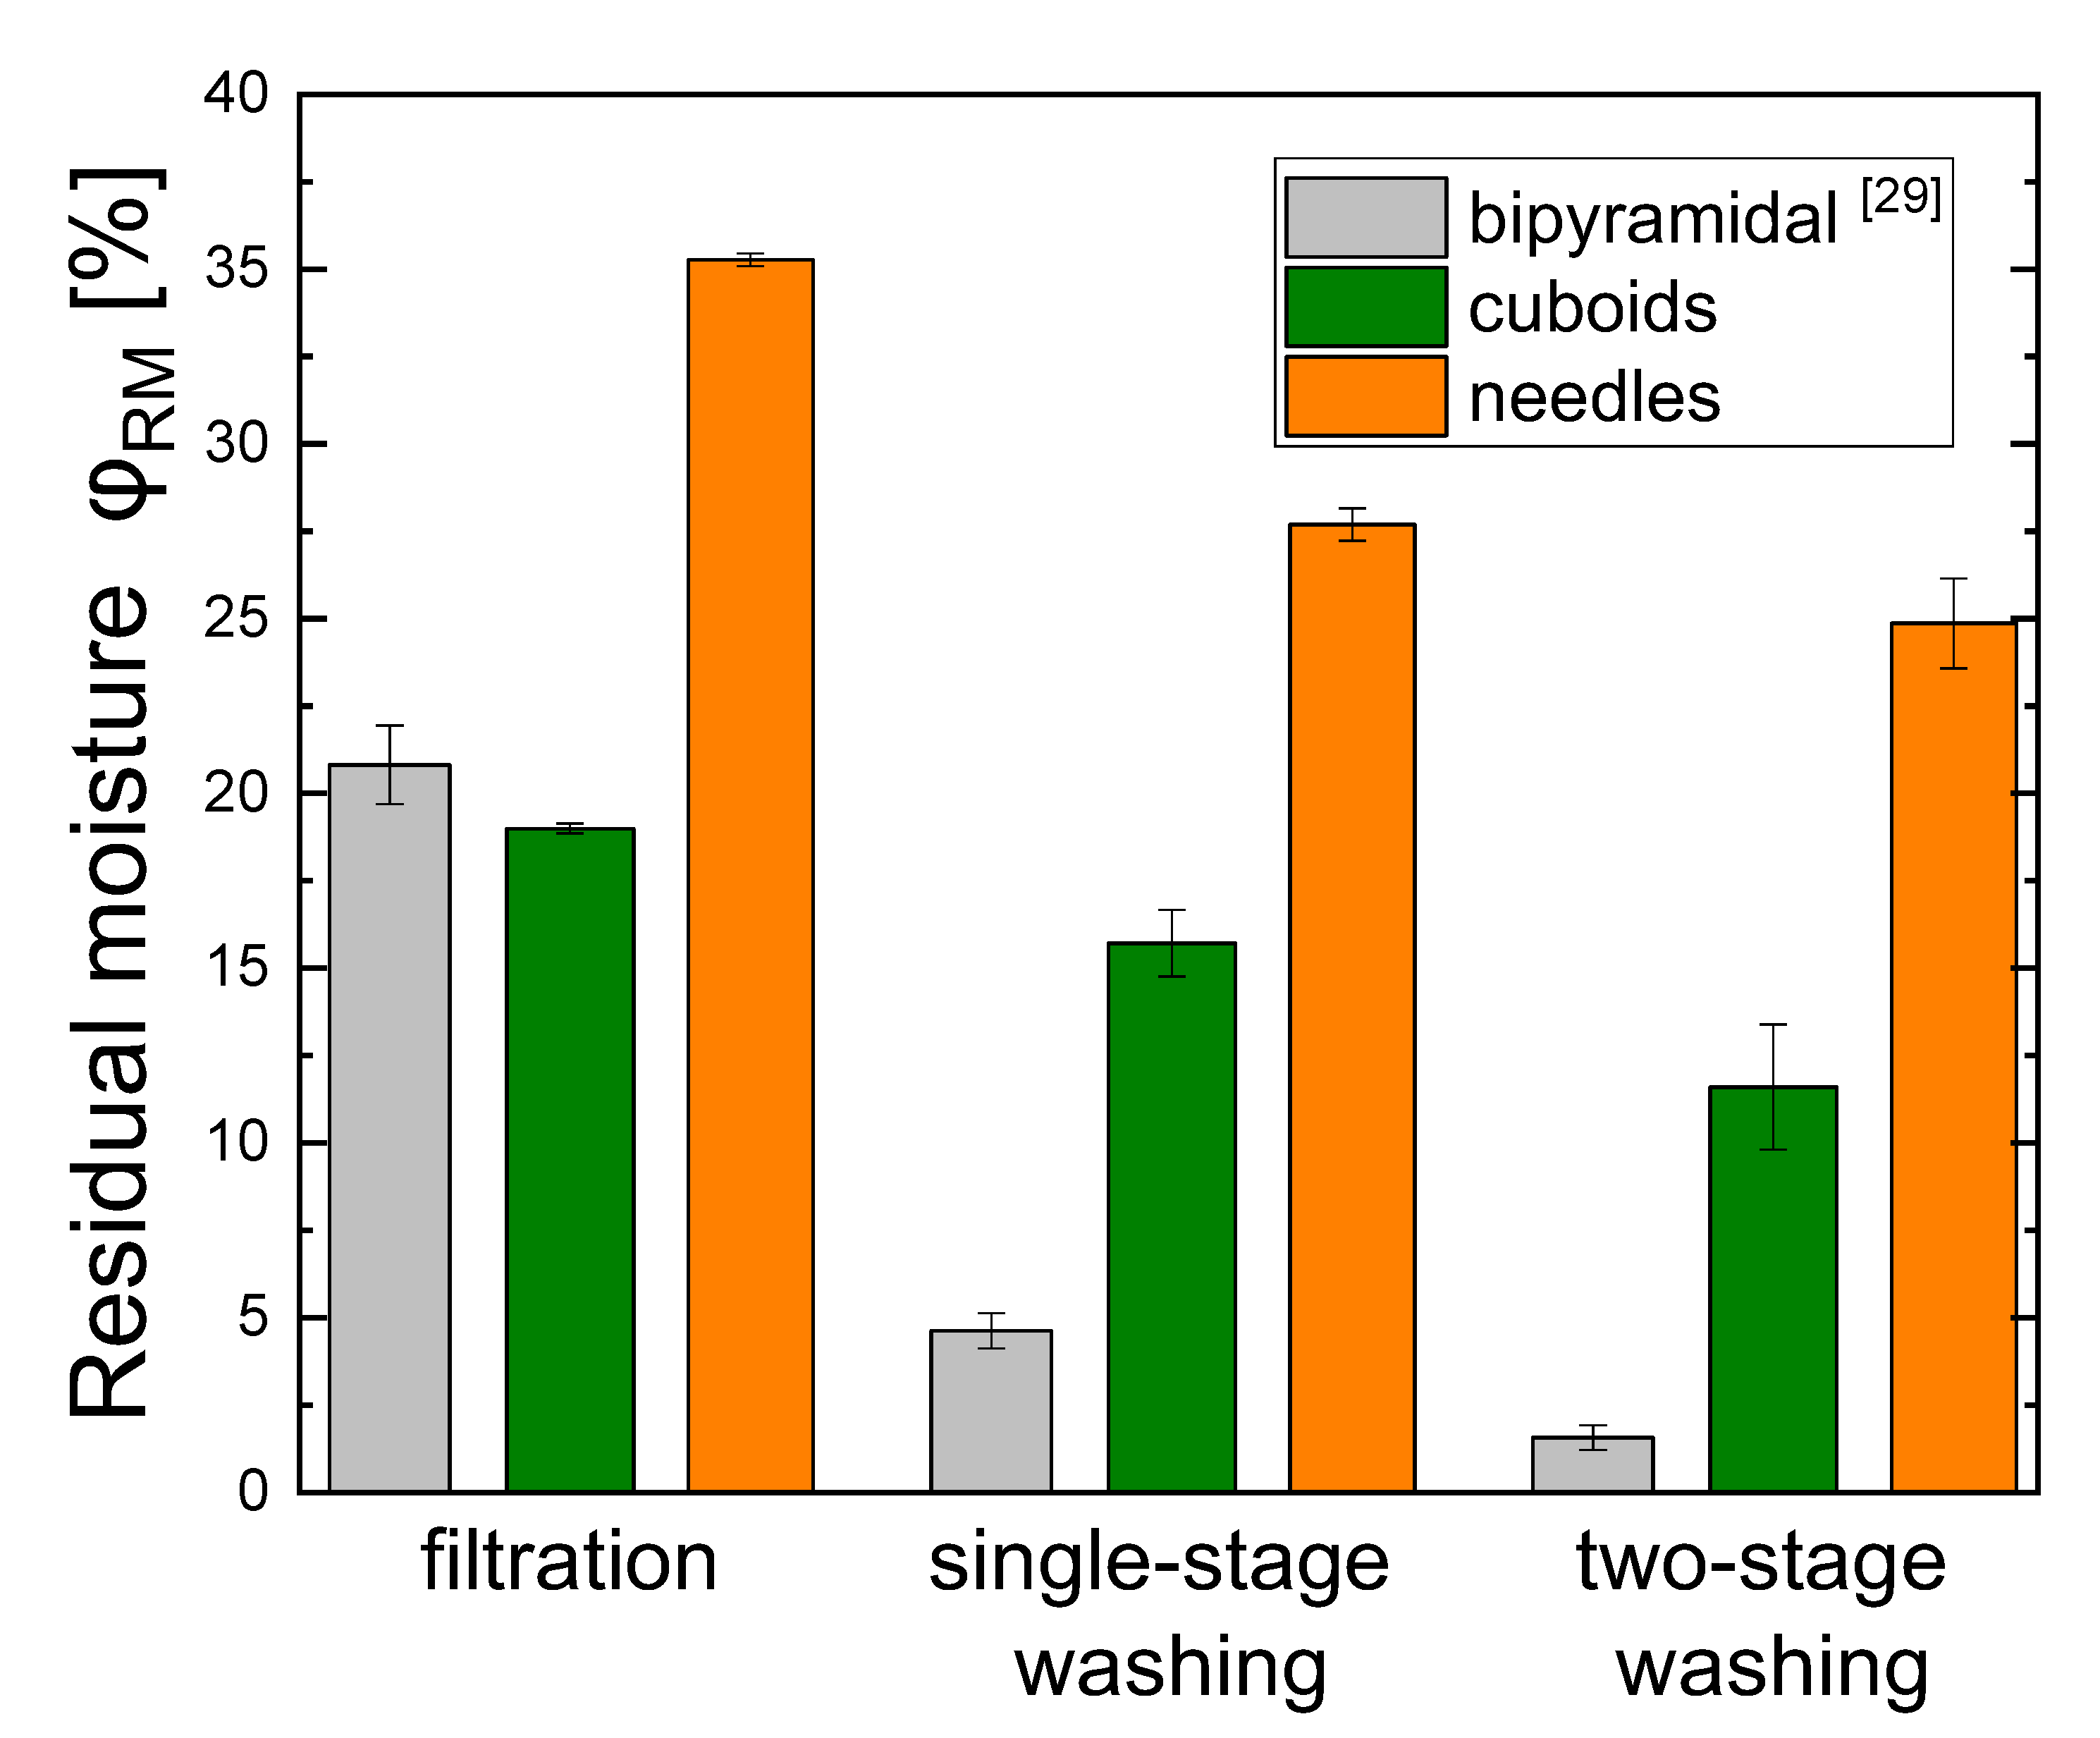
  • Reducing residual moisture also for higher aspect ratios

2. Materials and Methods

2.1. Substances Used

As model material system l-alanine/water is chosen. It presents an intensively investigated system at our group and is well-known regarding multiple properties such as aqueous solubility, crystal morphology, solids handling, and cooling crystallization behavior. As solely used in previous works regarding the CVSF, this model system is further used to increase the comparability to the results obtained. l-alanine is purchased from Evonik Industries AG, Essen, Germany (purity 99.7%). As solvent ultrapure, deionized and bacteria-free filtered water (Milli-Q® Advantage A10, 0.05 μS cm−1, Merck KGaA, Darmstadt, Germany) is used. The solubility curve c * of l-alanine/water can by approximated by Equation (1) [44].
c * ( g ala   g solution 1 ) = 0.11238 · exp ( 9.0849 · 10 3 · ϑ * ( ° C ) )
The density of a saturated l-alanine/water solution at ambient conditions (23 °C) is 1042 kg m−3 and the corresponding particle density of pure l-alanine amounts to 1420 kg m−3. To get l-alanine particles with varying particle shapes, l-glutamic acid (Acros OrganicsTM, purity 99%, Fisher Scientific GmbH, Schwerte, Germany) is added to the binary system which acts as a habit modifier.

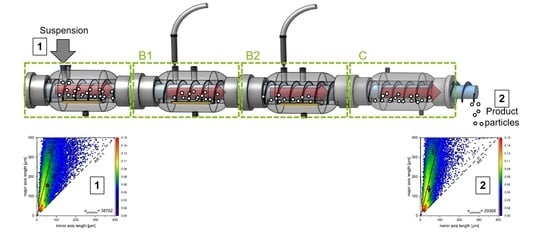
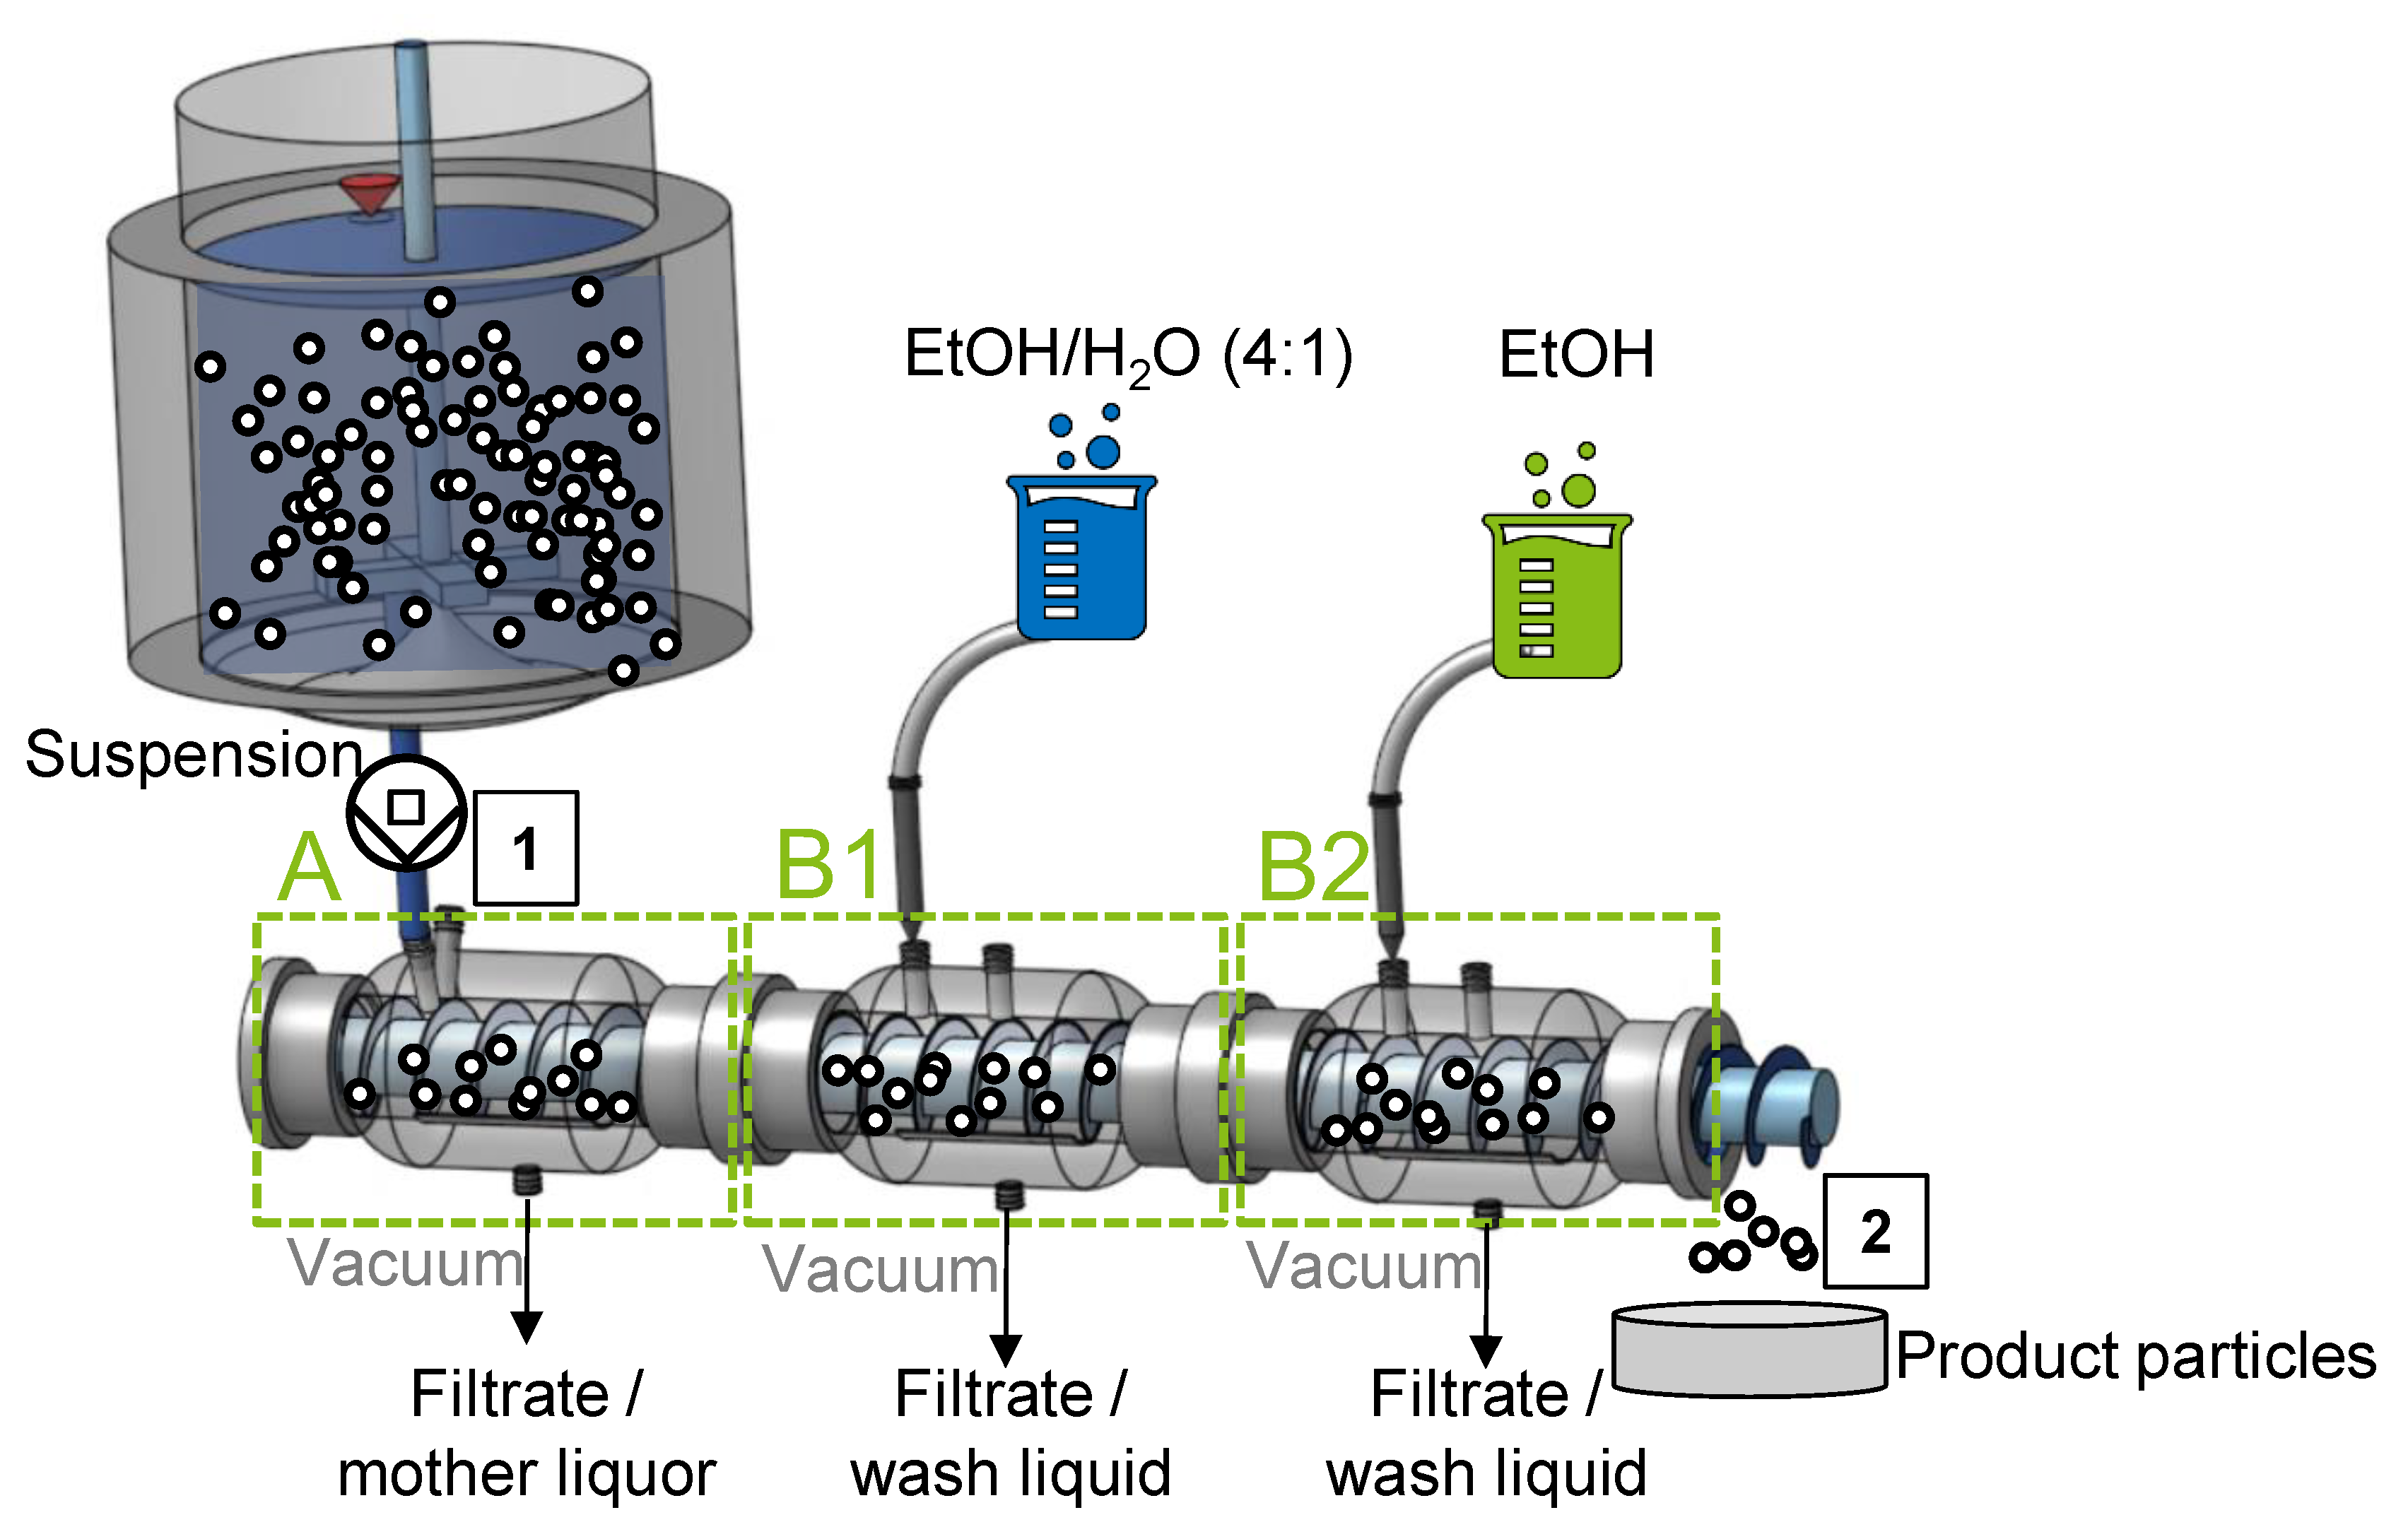
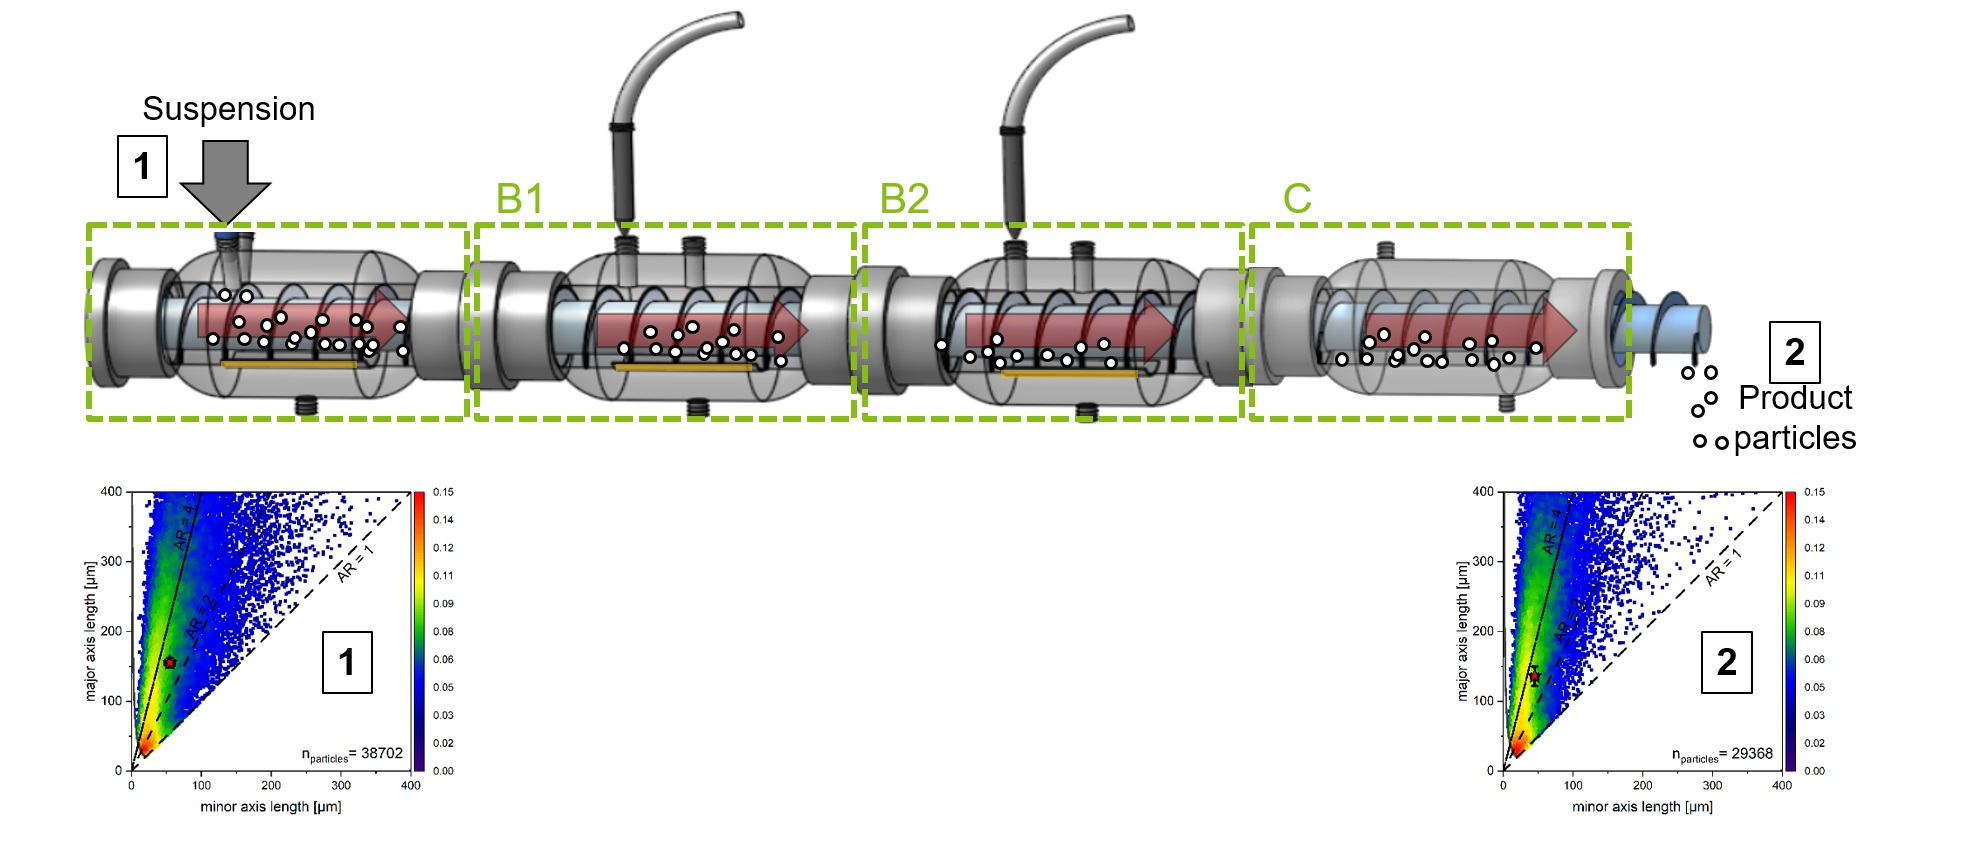
2.2. Experimental CVSF Setup

The experimental setup is schematically shown in Figure 1. The setup is the same as in our previous study [29] and therefore just briefly summarized here. From a 450 mL borosilicate glass suspension vessel equipped with a stirrer, vertical baffles, and a conical-shaped bottom (all out of borosilicate glass) developed by Lührmann et al. [45], the suspension is pumped (60 mL min−1) to the CVSFs inlet using a peristaltic pump (Ismatec, Wertheim, Germany, ISM597D, 2.79 mm Saint Gobain Tygon Tubing). The crystal suspension is discharged through a vertically adjustable outlet tube. Its opening is located 0.5 cm above the profiled bottom. The distance between the vessel and the pump, as well as the distance between the pump and the CVSF is 20 cm, respectively. The CVSF is mounted into an aluminum frame and consists of two basic elements: tubular, cylindrical modules (A, B1, and B2) and a rotating custom-made polytetrafluoroethylene (PTFE) screw (outer diameter 25 mm, distance to glass wall 0.2 mm, screw pitch 11 mm, and 33 screw coils for two-stage washing—11 screw coils per module) for axial transport of the particles in the inner part. All modules have an inner diameter of 25.4 mm (DN25), a length of 13 cm, and are made out of borosilicate glass. Porous glass frits (porosity 2, 40–100 µm, ROBU GmbH, Hattert, Germany) are installed as filter media and vacuum can be applied using vacuum pumps (Vacuubrand PC2004 Vario and Vacuubrand PC3002 Vario select, Wertheim, Germany). For axial transport of the particles, the PTFE screw can be rotated using a motor (Osmtec Nema Co., Ltd., 173 Nm, Nanjing, China). For washing in modules B1 and B2, a low-pressure flat-fan nozzle (Lechler, 610.145, Metzingen, Germany), adapted to fit into the respective inlets, is integrated at the top. The outer jackets of all modules are separated to prevent back-mixing of the withdrawn liquids and thus simplify solvent recovery (not conducted in this work).

2.3. Experimental Procedures

All experiments with varying particle shape and size are carried out at the same process conditions, only changing the particle shapes. Therefore, first the production of the particles with different shapes is described and then the procedure of the CVSF experiments is explained.

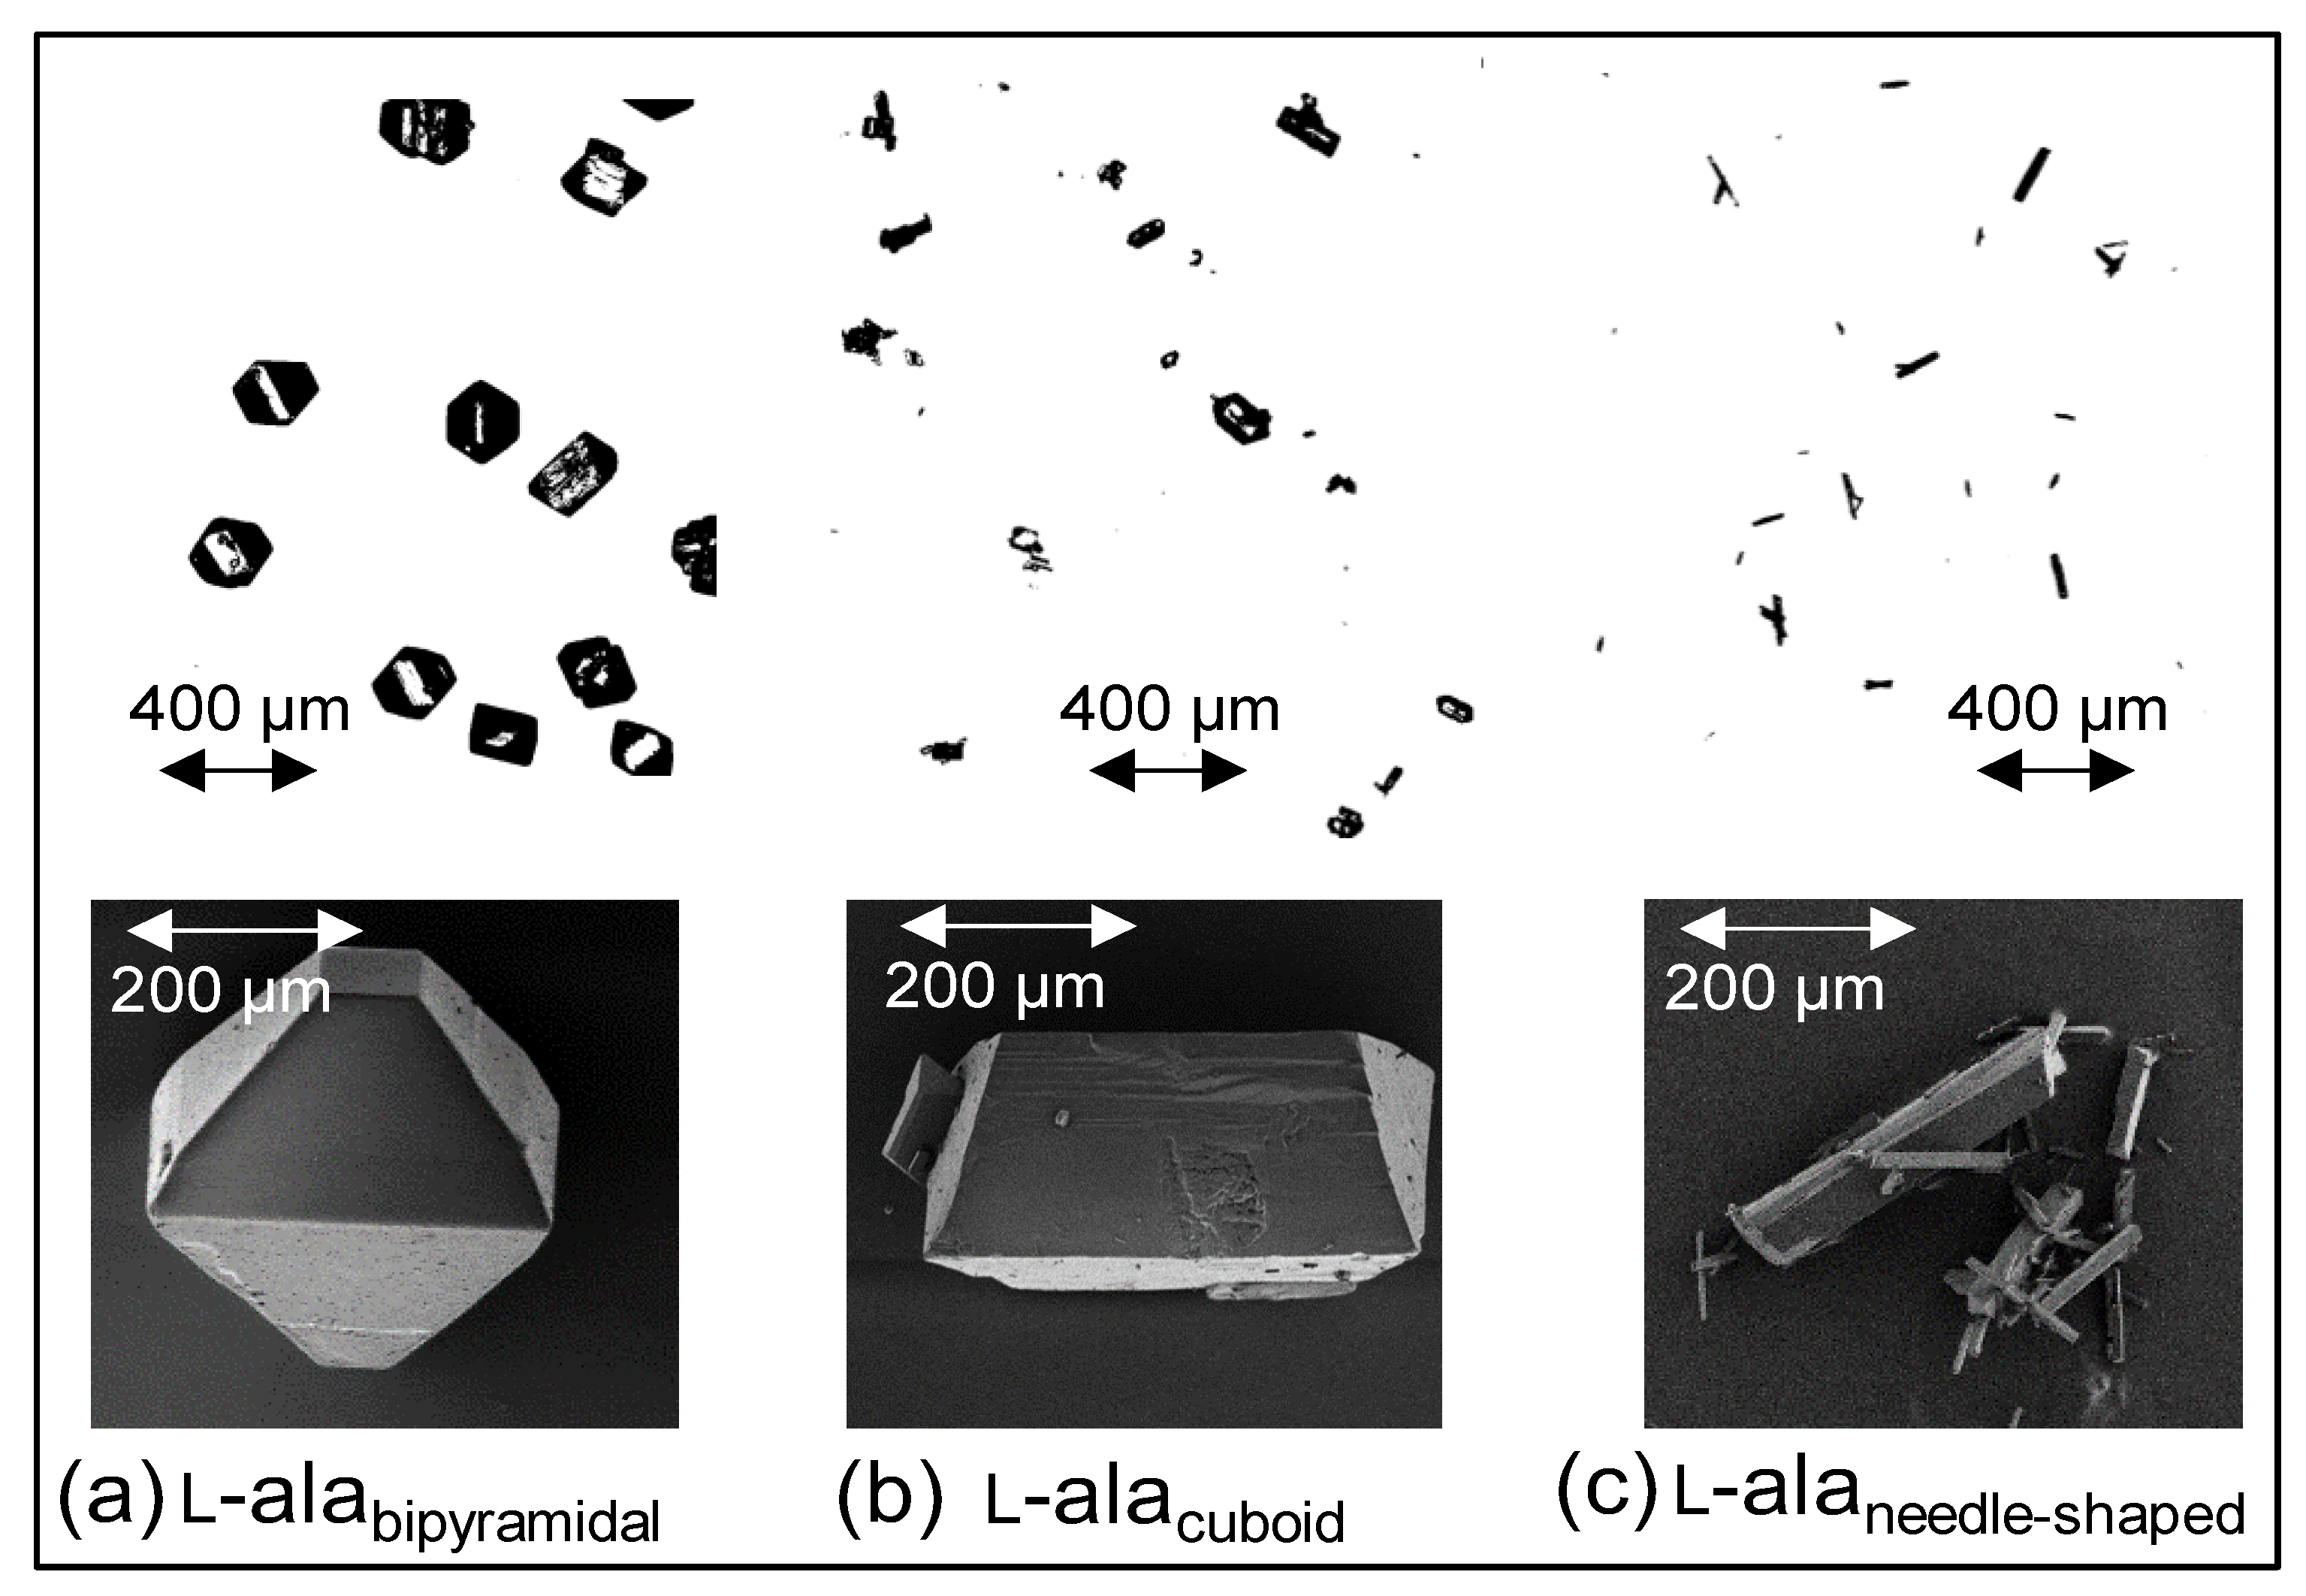
2.3.1. Procedure for Preparation of Inlet Suspension with Particles of Varying Shape

The preparation of l-alanine particles with varying shapes used for preparation of the inlet suspension includes five steps: crystallization, filtration, washing, drying, and sample dividing, all of them are performed in batch mode. Batch cooling crystallization of l-alanine from water is carried out in a 10 L vessel. First, a saturated solution of l-alanine is prepared at 50 °C according to Equation (1) (9000 g water and 1935.5 g l-alanine). To ensure a crystal-free liquid with a defined temperature, the solution is heated up to 60 °C. Having stirred the solution at constant temperature for 60 min, a cooling rate of 0.45 K min−1 is set to the system and cooled down to 20 °C. Due to the primary homogenous nucleation, high cooling rates create a high local supersaturation, resulting in a preferentially high number of small crystals. The product yield of a single batch crystallization is approx. 450–500 g. The same procedure is basically chosen to obtain other crystal shapes (cuboids and needles), but the appropriate amount of l-glutamic acid is added before starting the cooling ramp from 60 °C to 20 °C. According to previous work by Saal, l-glutamic acid selectively influences the crystal growth of l-alanine during batch cooling crystallization [46]. Due to the zwitterionic character of l-alanine, the additive adsorbs preferentially at a defined crystal surface, selectively influencing crystal growth. Thus, crystal growth at this particular surface can be either inhibited or promoted. In the case of l-glutamic acid, selective growth is more and more inhibited with increasing l-glutamic acid concentration resulting in smaller crystals with higher aspect ratios, as seen in Figure 2 [47].
In the case of the l-alanine cuboid habit, the concentration of l-glutamic acid was chosen to 2.9 gL-GA kg−1 water. In contrast, for the l-alanine needle-shaped habit, an additive concentration of 5.8 gL-GA kg−1 water was used. Additive concentrations were selected similarly to the works of Heisel et al. and Saal [46,47]. Besides the addition of l-glutamic acid, all other crystallization parameters were held constant. The resulting crystals are harvested, filtrated, washed, and dried so that statistically uniform samples can subsequently be prepared using a sample divider (described below). Product-isolation realized by filtration is performed with a sintered glass filter frit by ROBU GmbH, Hattert, Germany. The porosity of four samples according to ISO 4793-80 with pore sizes from 10–16 µm is used to guarantee retention of the crystals of targeted size fraction (>25 µm). To remove the mother liquor, a vacuum Nutsche system is used containing the glass filter and a vacuum pump (Vacuubrand PC2004 Vario, Wertheim, Germany). Retained crystals are then washed according to the procedure described by Terdenge and Wohlgemuth [48] in order to minimize the agglomeration of the seed crystals. Therefore, a two-stage washing procedure is applied. First, a volumetric mixture of 4/1 of ethanol (EtOH) absolute (99.9%, VWR, Darmstadt, Germany) and water is used as wash liquid. This ratio is defined as the optimal ratio to avoid anti-solvent crystallization by maintaining displacement washing [48]. Next, the filter cake is washed with pure EtOH to improve the washing efficiency. For an evenly distributed washing film, the solvent is sprayed with the use of an atomizer in both cases. The amount of washing solvent is chosen in relation to the amount of crystals processed. Approximately 40 mL of solvent are used per 100 g of crystals. Washed crystals are then transferred into a drying oven at ambient pressure and 50 °C for 24 h. Then, the pre-dried crystals are further deliquefied in a vacuum oven (Thermo Heraeus, type Vacutherm VT 6060M, Schwete, Germany) at the same temperature for at least 48 h to ensure complete solvent evaporation. In a final step, four samples of around 120 g each are created using a rotary sample divider (Fritsch, Laborette 27, Idar-Oberstein, Germany) to enable statistical comparability. Due to the usage of the rotary divider, each sample is assumed to contain particles of the same statistical population. The corresponding inlet suspension is then prepared by filling saturated solution (see Equation (1)) into the suspension vessel and adding the l-alanine particles of the prepared sample separately.

2.3.2. Procedures of CVSF Experiments
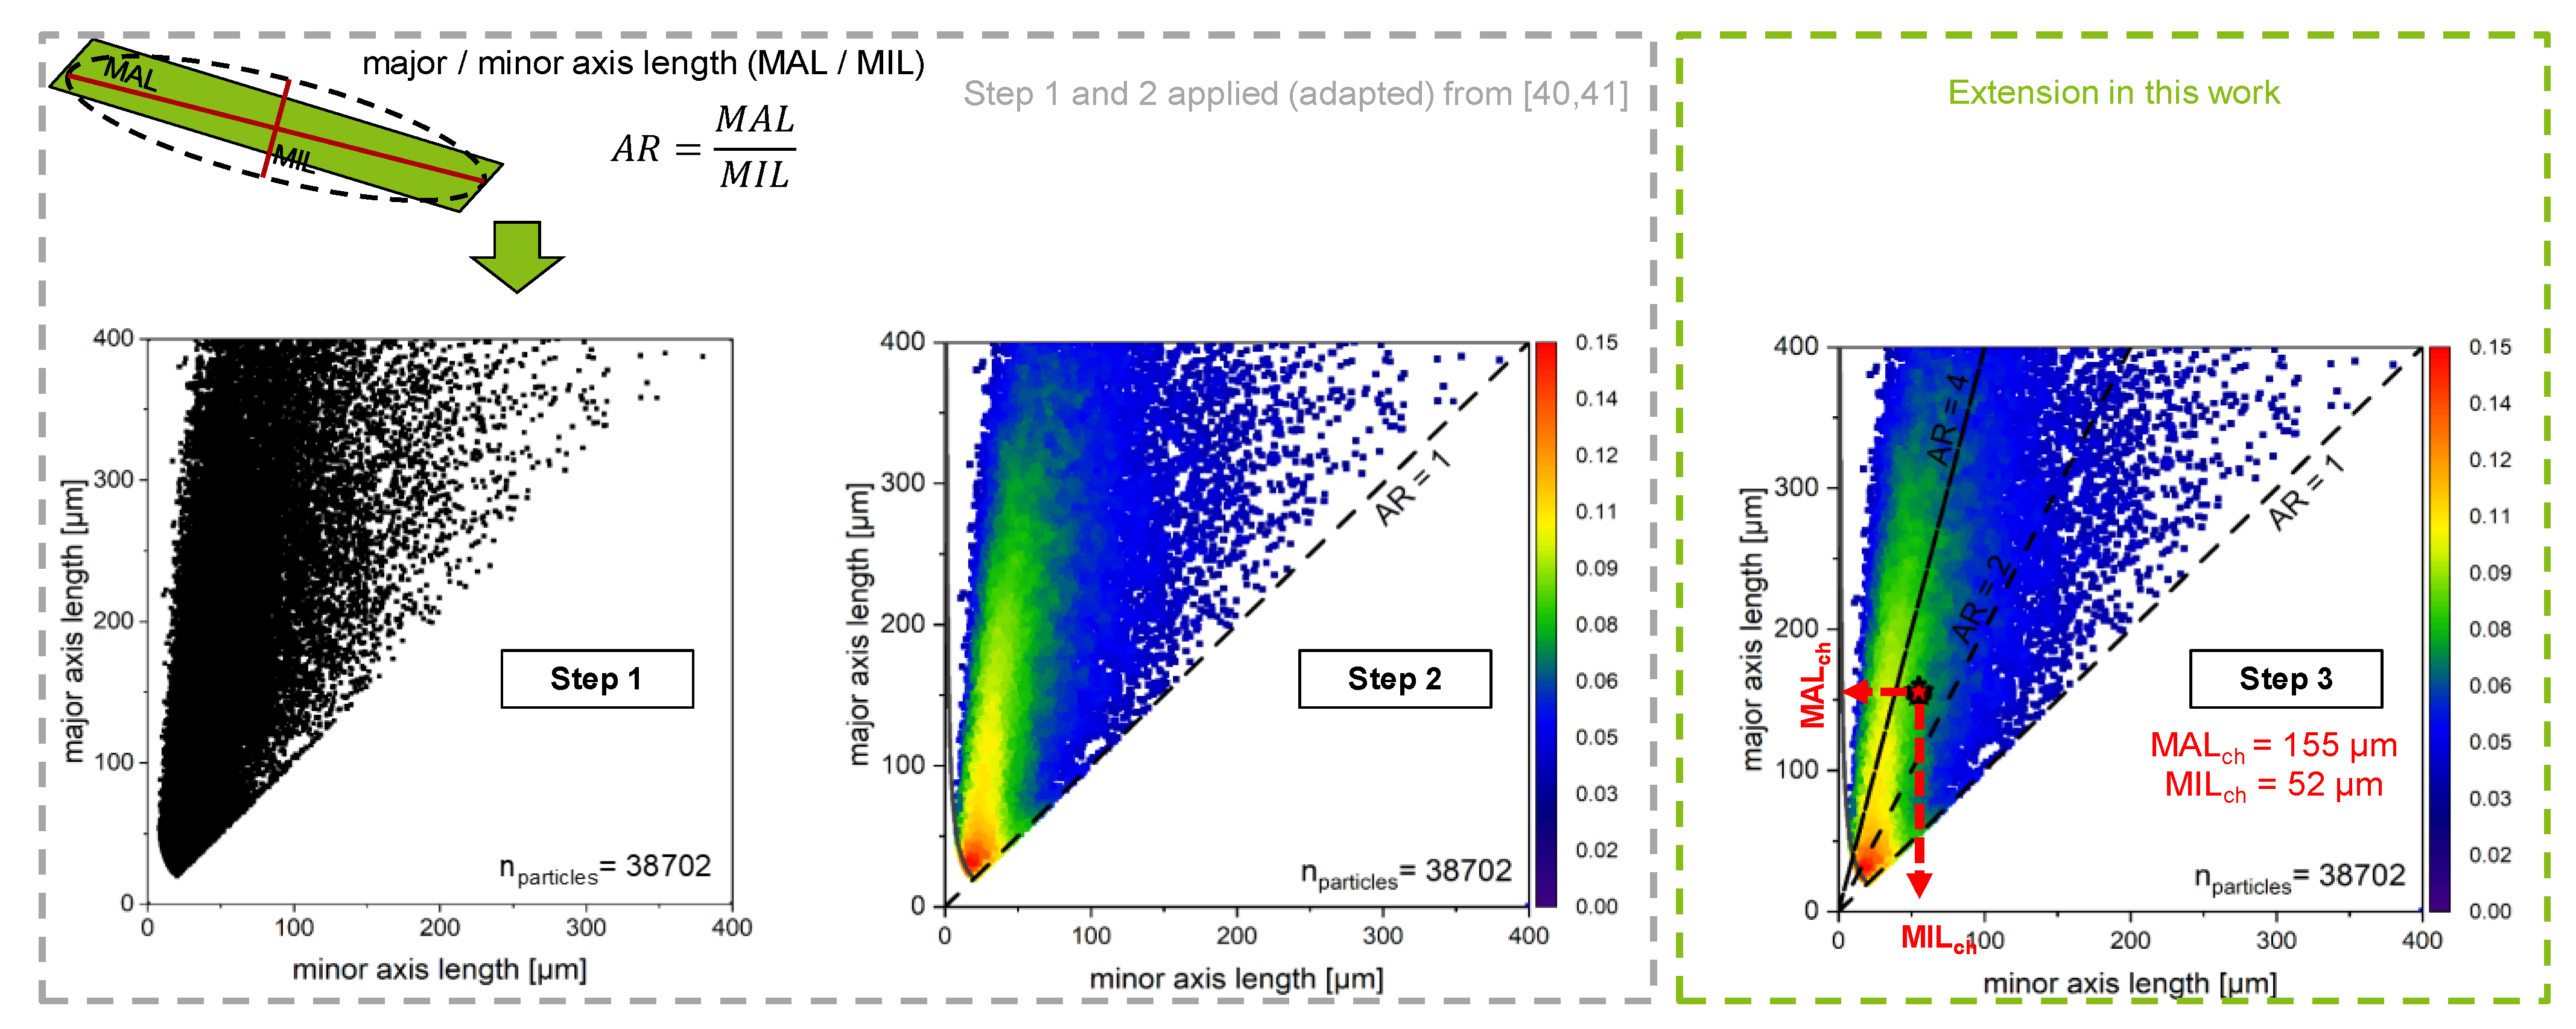
The CVSF is operated with the parameters shown in Table 1, which presents a well-known operational point with a narrow RTDS [28].
The CVSF is set up with three modules to enable two-stage washing as shown in Figure 1 Assuming an ideal residence time distribution of the solid phase (RTDs), the ideal solids residence time τ C V S F , i d , is solely dependent on the operational parameter n screw . Thereby, the ideal residence time is derived from the number of helical mounts in the apparatus N c o i l and the rotational screw speed  n screw . For the modular design, this can be specified in more detail using the number of helical mounts per module N c o i l , m o d and the corresponding number of modules consisting of N m o d , f i l t r a t i o n  and N m o d , w a s h i n g according to Equation (2) [29].
τ C V S F , i d = N c o i l n screw = N c o i l , m o d   ·   ( N m o d , f i l t r a t i o n + N m o d , w a s h i n g ) n screw
For the CVSF used, N c o i l , m o d is 11 [29]. Having reached a steady-state in sole filtration mode after a run time of 10.5 min (referring to the ideal solids residence time τ C V S F , i d after two-stage washing), QICPIC (PSD measurement) and residual moisture samples are taken. Then, the first washing stage (4/1 EtOH/water) is activated in module B1. After a run time of 7 min, one-stage washed filter cake is discharged and samples are withdrawn. Following the same procedure, two-stage washing (EtOH) is applied, and after a run time of 3.5 min the last samples are taken. Through this experimental procedure, the material consumption is minimized that only around 120 g of particles are necessary to perform a single experiment. With the number of particles available, a three-fold determination of the residual moisture is performed per experiment.

2.4. Analytics

The dynamic image analysis system QICPIC (resolution 1024 × 1024 pixel, module M6, Sympatec GmbH, Clausthal-Zellerfeld, Germany), equipped with the liquid dispersion system LIXELL (Sympatec GmbH, Clausthal-Zellerfeld, Germany) is used for measurement of particle size at the inlet and outlet of the CVSF. At the respective sampling locations, suspension (after feed pump) or particles (product particles after CVSF) are collected (>10,000 particles) in excess of tempered saturated aqueous solution to sufficiently dilute potential local supersaturation. Each sample is transferred to a stirred vessel, which is directly connected to the QICPIC measuring cell. The image acquisition and quantification of shape descriptors are executed by artificial neural networks implemented in MATLAB [47,49]. The axis length distribution of the inlet suspension (ALDIN) and axis length distribution of the product particles (ALDOUT) are measured for needle-shaped and cuboid l-alanine particles, and possible changes are quantified, as described in Section 3.
Particles leaving the CVSF are analyzed regarding the residual moisture by a procedure based on loss-on-drying [28,29]. The residual moisture φ R M is determined using a pre-drying step in a drying oven for 24 h (50 °C) and further drying in a vacuum drying oven (Thermo Heraeus, type Vacutherm VT 6060M, Schwerte, Germany) at 50 °C for 72 h to ensure gentle solids handling and prevent stirring up of the particles. For that, at least 2 g of wet sample was collected in a weighed screw cap container. φ R M is calculated by the mass of the evaporated liquid m l divided by the corresponding mass of the wet sample, consisting of the mass of solids m s and mass of liquid m l as shown in Equation (3) [29].
φ R M   [ g   g wet 1 ] = m l m s + m l

3. Extension of ALD Approach of Non-Spherical Particles

The traditional approach of dynamic image analysis (DIA) for bipyramidal l-alanine evaluates particles by calculating an equivalent diameter deq for each particle. This one-dimensional size descriptor is only valid for approximate spherical particles because the DIA is taken out based on a 2D-projection of the particles [50,51]. With increasing aspect ratio, the orientation of particles to the camera in DIA highly influences the 2D-projection and accordingly the size measured by equivalent diameters. This phenomenon is schematically depicted in Figure 3 for nearly spherical particles and needle-shaped particles with a high aspect ratio. The grey surfaces represent the projection area measured by DIA for two different observation angles each. It can be noted that in the case of non-spherical particles, these areas may differ significantly.
According to this, depending on its orientation to the imaging device, even one single, non-spherical particle results in different projection areas measured. Therefore, to accurately measure non-bipyramidal particles by 2D-DIA, two-dimensional size descriptors are needed [40]. During this work, major and minor axis lengths of the best fitting ellipsoid are used as size descriptors for each particle analyzed. Initially, to calculate the major and minor axes, the area and centroid of each 2D-projection are directly calculated by the same DIA-combined MATLAB routine used in our previous studies [28,29] as introduced by Heisel et al. [47,49]. An ellipsoid with an equal moment of inertia is fitted to the 2D-projection based on this data. The corresponding values of major and minor axis length generate the measured data for each particle based on its 2D-projection [41]. The detailed procedure of ellipsoid fitting is given in [40,52]. The aspect ratio (AR) is then defined as the quotient of the major axis length (MAL) and the minor axis length (MIL) according to Equation (4).
AR = MAL MIL
The result of all ellipsoids measured is the ALD. The major advantage over different two-dimensional size descriptors such as maximal/minimal Feret diameter is the compensation of irregularities in the 2D-projection or blurred particles [40,41]. It can be stated that even for a relatively low aspect ratio of two, a variety of measurements can occur during DIA. A measurable ALD represents the 2D-projection of the unknown PSD overlapped by the Gaussian-distributed orientation of each particle in the flow-through cell, if flow-induced preferential orientations are neglected. To reduce the influence of random particle orientation, it is recommendable to analyze a high number of particles for each measurement [53].
Although the exact size of particles is not measurable by 2D-DIA, it shows high potential for application in the analysis of the inlet particle size distribution (PSDIN) and the outlet particle size distribution (PSDOUT) of CVSF since the main challenge in filtration is not reaching a targeted particle size but maintaining the PSDIN during critical process steps, which is a crucial requirement for the performance behavior characterization of the apparatus. Having depicted the challenges of size determination by DIA for non-spherical particles, this work aims to develop a shape-independent, PSD-related, analytic routine to evaluate and quantify changes in the particle size distribution during CVSF operation. Therefore, an ALD-based approach containing three steps is applied, which is schematically depicted in Figure 4. The different steps are described in detail, for an exemplary data set containing needle-shaped l-alanine particles. In the first two steps, the approach of the group of Mazzotti is applied [40,41]. In the third step, a new quantitative measure is introduced so that quantitative comparison of two ALDs can be obtained.
In Step 1, the scatter plot is obtained by illustrating DIA raw data. The resolution limit of the QICPIC used was included in the ALD construction. Based on the equivalent diameter, lines with equal area regarding an ellipsoid were calculated and all particles below the resolution limit are excluded. For the QICPIC used, a minimal equivalent diameter of 25 µm is required for the imaging module to ensure image analysis with ISO-standard and adequate size analysis [54]. Each point represents one measured particle of all 38,702 particles (>25 µm) within the sample located by its major and minor axis length. The right-side half-plane is empty by definition since the MAL is always greater than (ellipsoid) or equal (circle) to its associated MIL. Since the measurement points are highly overlapping, a suitable raw data treatment is needed to illustrate and further analyze DIA-measurements.
In Step 2 of the routine, a Gaussian kernel-density-estimator is used, which is implemented as the “density dots” function provided by the Origin Pro 2021 software [55]. Of course, this algorithm could also be applied with many other software solutions. First, for each data point (Xi, Yi) out of a population of N points, a bivariate Gaussian distribution Φ i according to Equation (5) is created.
Φ i = 1 2 π b x b y · exp ( ( x X i ) 2 2 b x 2 ( y Y i ) 2 2 b y 2 )
The location parameters Xi and Yi can, in the case of ALD measurements, be defined as minor axis length and major axis length, respectively. The so-called bandwidths bx and by are defined as the scales of the Gaussian distribution. The algorithm used in the “density dots” function relies on minimizing the mean integrated squared error between the estimator and the underlying distribution. The exact procedure of bandwidth calculation is based on linear diffusion processes [56]. Having calculated Φ i for each data point i, each Gaussian distribution is scaled by factor N−1 and summed up to create the estimator E of the population investigated according to Equation (6) [56]. Values of E represent the corresponding kernel-density of a point defined by its major/minor axis length (x, y).
E ( x , y , b x , b y ) = 1 N · i = 1 N Φ i ( x , y , b x , b y )
This scaling gives an estimator normed in sample size, and thus a comparability of estimator values for different populations investigated. This characteristic is a crucial requirement for applying kernel-density estimators in the analysis of ALDs since the sample size of DIA-measurements varies inevitably. Having a suitable estimator as a mathematic tool at hand, E is evaluated at an arbitrary number of k orthogonal grid points. These grid points allocate a dimensionless kernel-density value to each measurement point (Xi, Yi) by linear interpolation. High values of E thereby are formed when multiple measurements occur in a sufficiently close neighborhood. Finally, the 4th root of kernel-density values is applied to fit the density scale to a color scale. ALD measurements for cuboid-shaped and needle-shaped l-alanine particles were performed in a maximum window of 400 µm of major axis length in this work. Thereupon, grid points were chosen to a number of 400 for each dimension to create an equally spaced grid. Related to the 2D-projection measurement of particles, the calculated kernel-density can be interpreted as an indicator for the probability to measure a certain point in the ALD. Since particle orientation to the imaging device is assumed to be Gaussian distributed, deviations in the probability distribution (kernel density) are mainly formed by the corresponding PSD if the number of sampled particles is sufficiently high. In other words, the more particles of a certain size fraction and shape exist, the more probable a corresponding area in the ALD is. Thus, combining a kernel-density estimator and an ALD offers the potential to decouple the linkage of Gaussian particle orientation and the underlying PSD. However, despite the progress, the scope of the ALD is limited to a qualitative comparison between different ALDs.
This challenge is intended to be overcome in Step 3 of the approach by introducing a characteristic value to the ALDs. To enable statistical comparability between ALDs, a characteristic value, which represents the qualitative information of the ALD, is needed, similar to a d50-value in one-dimensional particle size analysis. Due to the initially described interpretation as measurement probability in DIA, the k grid points calculated by “density dots” can be seen as a curved surface. Accordingly, a “center of mass” of the curved surface can be calculated based on the grid matrix weighted by the belonging measurement probability Eij. The center of mass is composed of the characteristic major and minor axis length (MALch, MILch) as “center of mass coordinates” at the corresponding axes as shown by the red arrows in Figure 4. MALch and MILch are determined according to Equations (7) and (8).
MAL ch = j = 1 k i = 1 k y i · E i j ( y i , x j ) j = 1 k i = 1 k E i j ( y i , x j )
MIL ch = j = 1 k i = 1 k x i · E i j ( y i , x j ) j = 1 k i = 1 k E i j ( y i , x j )
This approach presents a powerful tool to add “center of mass” to the ALDs, which allows statistical comparison of ALDs. Hereby, MAL ch and MIL ch as coordinates can be compared by a two-sample t-test for different experiments and different process steps [57].

4. Results and Discussion

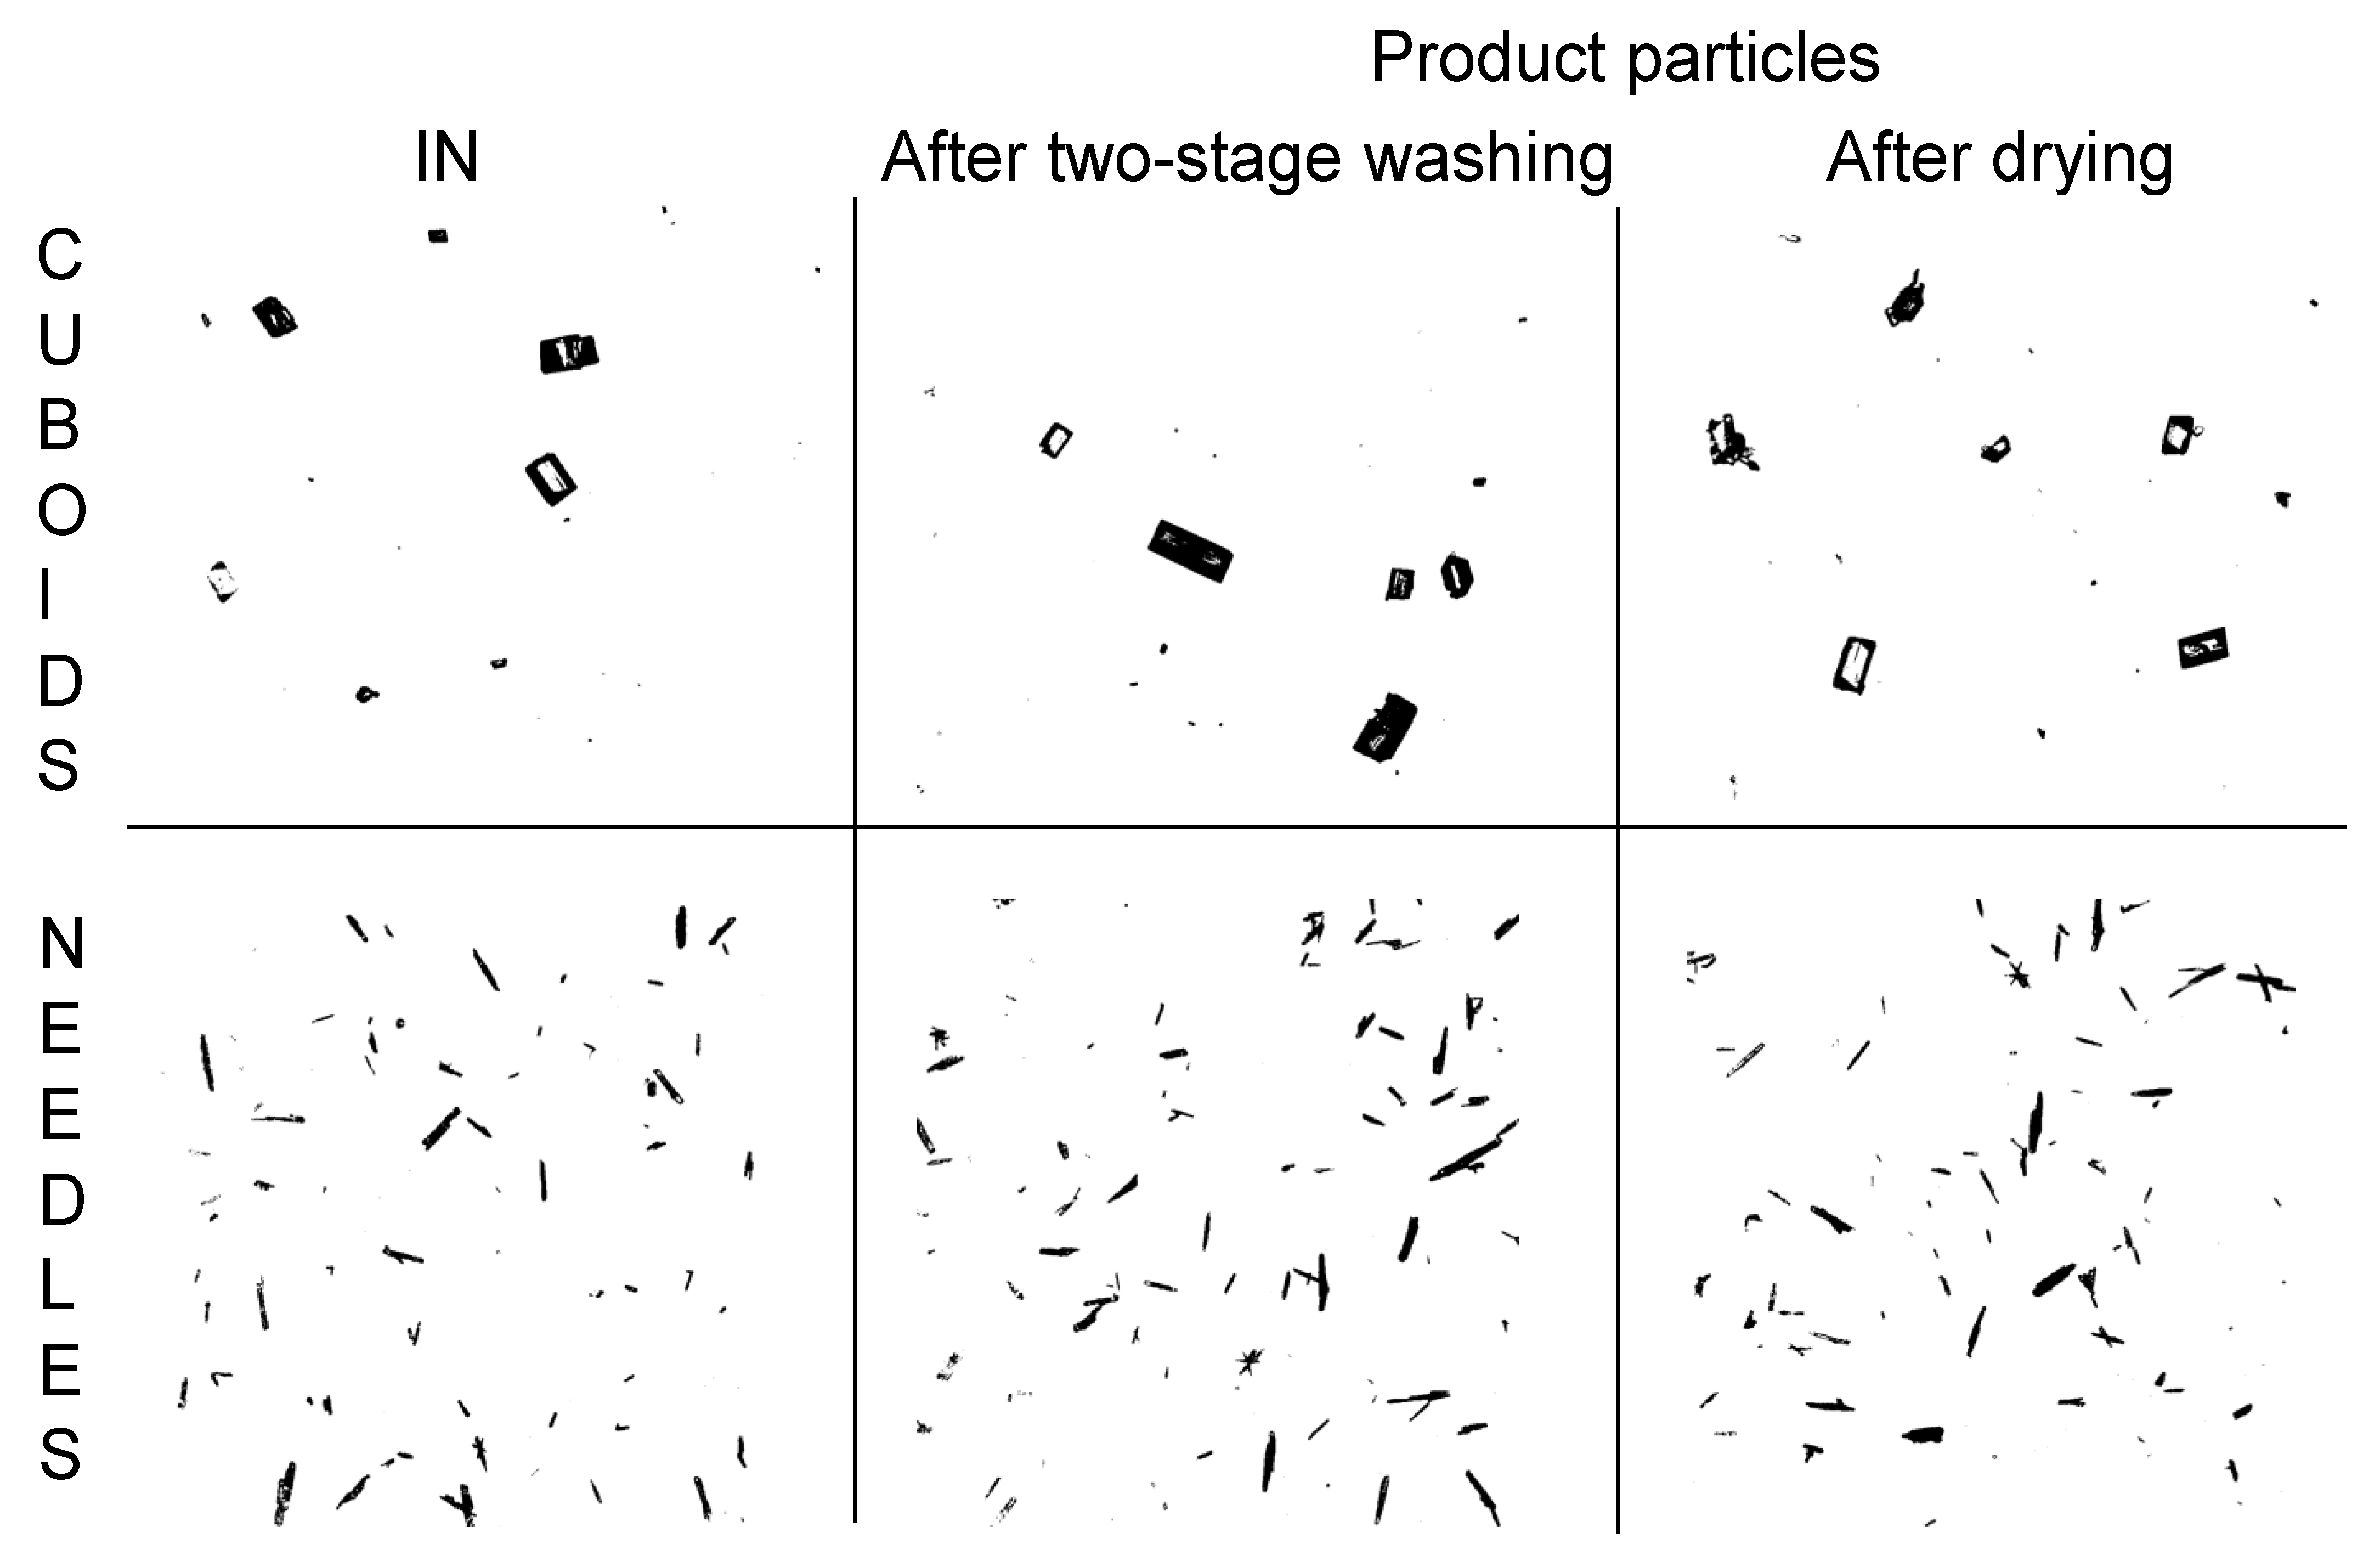
4.1. Maintaining ALD through Integrated Process

Figure 5 shows the results of the ALDs of the inlet suspension (ALDIN) and of the product particles (ALDOUT) for cuboid-shaped and needle-shaped l-alanine particles. A comparably constant ALD (ALDIN = ALDOUT) is achieved for both particle shapes (compare Figure 5 left and right) processed in the CVSF, which hypothesizes no particle attrition, breakage, and agglomeration during CVSF operation. Thus, a full maintenance of ALD is always ensured.
The differentiation between different particle shapes can be made directly by detecting the areas with high measurement probabilities (red–yellow–green). Attrition or breakage would become visible by a shift of these areas in the direction of the bisecting line. The cuboid-shaped particles have an average AR of approximately two (see Figure 5 upper half) and the needle-shaped particles have an average AR of three to four (see Figure 5 lower half), which can be additionally observed for the MALch/MILch-values (red stars) and are in good accordance with the SEM images analyzed (see Figure 2) Low aspect ratio data points, which indicate a spherical shape, could be caused by complex agglomerates. These large agglomerates are marginally seen in QICPIC-videos and SEM-images and may be found predominantly in the upper right corner of the ALD. Due to the low measurement probability indicated by the blue dyeing in the ALD, these values are negligible in terms of MALch/MILch determination. To statistically justify the maintenance of ALDs, a two-sided two-sample t-test is performed to compare the coordinates MALch and MILch with the center of mass [57]. Here, no statistically significant (95% confidence interval) change of MALch and MILch for both cuboid-shaped and needle-shaped particles is observed. This demonstrates both visually (ALD) and quantitatively (MALch/MILch) that the CVSF is also suitable for product isolation of higher aspect ratio particles while maintaining product quality in terms of particle size.

4.2. Residual Moisture

The residual moistures measured are shown in Figure 6 for the different operating stages. As a benchmark, the results from our previous study of bipyramidal L-alanine particles are added [29].
Based on this figure, different conclusions can be made. First, a general decrease in residual moisture for all particle shapes investigated can be stated for single-stage washing and two-stage washing, respectively. Here, the possibility to use the same wash liquid for all three particle habits shows its full potential. Due to the varying shape by maintaining the material system, high comparability of the experiments is given. Additionally, all other influence factors on washing efficiency such as enthalpy of evaporation, solvent density, solvent surface tension, solvent viscosities, or solubility curves can be set constant. Second, regarding the sole filtration in CVSF, a high increase in aspect ratio (needles, AR = 3–4) leads to an increase in the residual moisture compared with bipyramidal particles (AR≈1). Therefore, in filtration without washing, the higher porosity could induce a change in residual moisture. Regarding the washing steps, this assumption cannot be expanded. Here, for the bipyramidal particles, a drastic decrease in residual moisture is measured, which leads to residual moistures around 1% after two-stage washing, which is sufficient for further processing in the secondary continuous manufacturing process. In contrast, the smaller, non-spherical particles (cuboids and needles) remain at a high level of residual moisture (11.6 ± 1.8% for cuboids, 24.9 ± 1.3% for needles). However, the residual moistures obtained for non-bipyramidal particles are too high for further processing and the particles do not leave the apparatus in a free-flowing manner. Instead, attached wet particle collectives are leaving the CVSF as shown in Video S1 for the cuboid-shaped particles exemplarily (Solid-Discharge_withoutDrying) in the Supplementary Materials. Therefore, an additional drying module is required for further deliquoring and will be introduced in the following section.

4.3. Operation with Added Drying Module

Figure 7 shows the experimental setup of the CVSF with the extended drying module C. The designed drying module consists of a double-jacketed DN25 glass tube without a filter medium and has the same length as the other modules A, B1, and B2 (13 cm). The resulting heat exchanger area is 53.2 cm². The module’s outer jacket is connected to a thermostat (Huber CC-K6, water) via two tangentially mounted GL18 ports. The temperature is set to 60 °C by controlling the tempering medium at the outlet of the module C. The same operating conditions as before (see Table 1) are used to characterize the drying behavior. As the rotational screw speed nscrew remains at 3 rpm, the resulting mean drying time is approx. 3.5 min.
For the cuboid particles, the residual moisture is  φ R M   = 0.56 ± 0.30% and for the needle-shaped particles, the residual moisture is φ R M = 0.81 ± 0.11%. This result clearly proves the assumption of a drastic decrease in residual moisture to a sufficient value below 1%, resulting in free-flowing particles after the drying step. The difference in residual moisture is shown for the cuboid-shaped particles exemplarily in the Video S2 (Solid-Discharge_withDrying) in the Supplementary Materials. This shows, again, the major advantage of the modular design of the CVSF. Depending on the particle shape, it may not be necessary to use the additional drying module C, thus saving time and operating costs. For more challenging drying tasks, however, it is possible to simply add one or more drying modules C.
Further investigation of the product particles related to the ALD is necessary, to prove the preservation of the ALDIN with the added drying module. The same experimental conditions and analytical evaluations, solely adding the module C, were used for this purpose. Figure 8 shows the experimental results of the experiments of the ALDs comparing the inlet suspension with the dried product particles at the CVSF outlet. It can be seen that the respective ALD are very similar to each other. The respective color ranges can be identified in the same sections of the ALDs. Nevertheless, slight tendencies of abrasion and agglomeration are recognizable. Abrasion or disaggregation can be seen in the MALch values, which decreases from 98 µm to 87 µm (cuboids) and from 129 µm to 121 µm (needles). Therefore, it seems to be attrition, since particle breakage would probably show a stronger reduction in MALch. The MILch values remain at a constant level of approx. 50 µm for both particle shapes. In addition, the stronger appearance of the blue areas of the ALDOUT (ALDs at the right side) is a possible indication of agglomeration. Even if the wash liquid is selected in such a way that agglomeration can be avoided as much as possible during the whole crystal process chain, this cannot be completely avoided, especially during the drying process. For the first washing step, a mixture of ethanol absolute and water 4:1 (solubility of l-alanine at 25 °C: 2.83 g kg−1 [48]) and for the second washing step pure ethanol absolute (solubility of l-alanine at 25 °C: 0.18 g kg−1 [48]) were utilized as described by Terdenge and Wohlgemuth [48]. Even if the solubility is already very low after the second washing step, the remaining solute can cause increased agglomeration during drying due to bridging of single particles to agglomerates. A more detailed investigation for agglomeration of smaller particles (<100 µm) is challenging based on Figure 8, since many particles are present in this region (see red–yellow areas of Figure 8) and an increased agglomeration would only be recognizable by a color gradient shift in the direction of the bisecting line or an increase in the corresponding MALch /MILch values. However, this is not the case here for either cuboids or needles.
While at first impression there is an increased influence of attrition compared with agglomeration (reduction in MALch values as described above), this needs to be further investigated in future work. For this purpose, corresponding ALDs consisting of subpopulations (single particles and agglomerates separately) would be useful. First preliminary work on this has already been developed by Heisel et al. [47,49] and could be used for this purpose in the future with appropriate adaptations for smaller agglomerates.
This requirement can also be confirmed by comparing the results to published literature data. Attrition and agglomeration phenomena occur quite frequently during the drying processes [58,59] because there is no lubricant, which prevents direct particle–particle collision. Needles in particular tend to a simultaneous occurrence of abrasion and agglomeration, as already shown by Lekhal et al. for similar particles (l-threonine) during agitated drying [39].
In order to investigate this in more detail for CVSF operation, exemplary binary images are shown in Figure 9. Although no detailed quantitative statement can be made, a representative overview is possible. Abrasion, breakage, and agglomeration cannot be fully excluded, but a maintenance of the product quality in terms of particle shape and size distribution is clearly recognizable. However, in order to be able to characterize this statistically in the future for the drying process in the CVSF, systematic experiments should be carried out with material systems that have a stronger tendency to abrasion and agglomeration during drying.
Comparing the CVSF with industrial drying processes, the major advantage of the CVSF is the product-friendly drying. Whereas particle–particle collision may occur in conventional fluidized-bed drying, thus promoting agglomeration and breakage, this can be prevented to a large extent inside the CVSF. Using the drying module, a combined/mixed drying process takes place (contact drying by heated double-jacket walls and convection drying by drawn air of the vacuum pump). At the same time, the particles are conveyed evenly through the apparatus, whereby on the one hand the drying time is uniform and on the other hand particle–particle collision can most likely be avoided.

5. Conclusions and Outlook

In this study, full continuous particle isolation, from suspension to dried product particles, was performed for the first time for particles with varying shapes using the continuous vacuum screw filter (CVSF). The former calculation of the equivalent diameter deq as one-dimensional size descriptor is not suitable for the high aspect ratio particles processed within the CVSF (cuboid-shaped and needle-shaped l-alanine). Thus, an extension of the dynamic-image analysis approach was made using the axis length distribution (ALD) to access potential changes in product quality. To enable a statistical validation of different ALDs, the center of mass of the probability-weighted ALDs as a characteristic value was introduced. The corresponding coordinates MALch and MILch were used for comparison of ALDs. With this tool at hand, reasonable analysis of potential changes in the ALD for non-spherical particles was possible for the first time.
Even for needle-shaped particles with a high breakage risk, no significant change in the ALD was shown during filtration and two-stage washing. Due to the decreased particle sizes caused by the corresponding selective growth-inhibiting batch crystallization process, an analysis of the agglomeration degree was not possible. Since agglomeration processes may influence the particle properties of discharged filter cake, a detailed analysis of the agglomeration degree should be performed in future work.
Regarding the residual moisture, the assumption of higher filter cake resistance resulting in higher residual moistures was confirmed. For cuboid-shaped and needle-shaped particles, residual moistures of >10% (cuboids) and >20% (needles) were obtained after two-stage washing. Thus, the necessity to add a drying module was shown and residual moistures below 1%, to produce free-flowing particles, was proven for these particles. During drying processes, slight indications of attrition, disaggregation, and agglomeration were visible, which still need to be proven in future work. With the systematic experimental investigations in this study, a remarkable contribution towards full continuous primary manufacturing processes was made. The product quality preservation was also shown for smaller needle-shaped particles and thus enables a significant achievement towards the industrial applicability of CVSF for small-scale continuous particle isolation, as many APIs have a needle-shaped morphology. Due to the modular design of the CVSF, it is possible to adapt very flexibly to the varying requirements of different material systems, thus ensuring gentle particle isolation at all times.

6. Patents

The CVSF was patented in 2021 as “Rotating-Screw Drying Reactor” as WO 2021/148108 A1.

Supplementary Materials

The following are available online at https://www.mdpi.com/article/10.3390/cryst12020137/s1, Video S1: Solid-Discharge_withoutDrying.mp4, Video S2: Solid-Discharge_withDrying.mp4.

Author Contributions

Conceptualization, C.S. and K.W.; methodology, C.S., J.H. and K.W.; investigation, J.H. and C.S.; writing—original draft preparation, C.S. and J.H.; writing—review and editing, K.W.; visualization, C.S. and J.H.; supervision, K.W.; project administration, K.W.; funding acquisition, C.S. and K.W. All authors have read and agreed to the published version of the manuscript.

Funding

This research work was funded by the state of North-Rhine Westphalia (NRW) and the European Regional Development Fund (EFRE), Project “NRW Patent Validation Program” (Grant EFRE-0400357).

Institutional Review Board Statement

Not applicable.

Informed Consent Statement

Not applicable.

Data Availability Statement

Not applicable.

Acknowledgments

The authors express their special thanks to Daniela Ermeling for the technical support during the experiments.

Conflicts of Interest

The authors declare no conflict of interest. The funders had no role in the design of the study; in the collection, analyses, or interpretation of data; in the writing of the manuscript; or in the decision to publish the results.

References

  1. Cote, A.; Erdemir, D.; Girard, K.P.; Green, D.A.; Lovette, M.A.; Sirota, E.; Nere, N.K. Perspectives on the current state, challenges, and opportunities in pharmaceutical crystallization process development. Cryst. Growth Des. 2020, 20, 7568–7581. [Google Scholar] [CrossRef]
  2. Hofmann, G. Kristallisation in der Industriellen Praxis; Wiley-VCH: Weinheim, Germany, 2005. [Google Scholar]
  3. Beckmann, W. Crystallization: Basic Concepts and Industrial Applications; Wiley-VCH: Weinheim, Germany, 2013. [Google Scholar]
  4. Wood, B.; Girard, K.; Polster, C.S.; Croker, D. Progress to date in the design and operation of continuous crystallization processes for pharmaceutical applications. Org. Process Res. Dev. 2019, 23, 122–144. [Google Scholar] [CrossRef]
  5. Orehek, J.; Teslić, D.; Likozar, B. Continuous crystallization processes in pharmaceutical manufacturing: A review. Org. Process Res. Dev. 2021, 25, 16–42. [Google Scholar] [CrossRef]
  6. Zhang, D.; Xu, S.; Du, S.; Wang, J.; Gong, J. Progress of pharmaceutical continuous crystallization. Engineering 2017, 3, 354–364. [Google Scholar] [CrossRef]
  7. Wang, T.; Lu, H.; Wang, J.; Xiao, Y.; Zhou, Y.; Bao, Y.; Hao, H. Recent progress of continuous crystallization. J. Ind. Eng. Chem. 2017, 54, 14–29. [Google Scholar] [CrossRef]
  8. Kleinebudde, P.; Khinast, H.; Rantanen, J. Continuous Manufacturing of Pharmaceuticals; John Wiley & Sons, Ltd.: Chichester, UK, 2017. [Google Scholar]
  9. Acevedo, D.; Peña, R.; Yang, Y.; Barton, A.; Firth, P.; Nagy, Z.K. Evaluation of mixed suspension mixed product removal crystallization processes coupled with a continuous filtration system. Chem. Eng. Process. Process. Intensif. 2016, 108, 212–219. [Google Scholar] [CrossRef] [Green Version]
  10. Mascia, S.; Heider, P.L.; Zhang, H.; Lakerveld, R.; Benyahia, B.; Barton, P.I.; Braatz, R.D.; Cooney, C.L.; Evans, J.M.B.; Jamison, T.F.; et al. End-to-end continuous manufacturing of pharmaceuticals: Integrated synthesis, purification, and final dosage formation. Angew. Chem. Int. Ed. 2013, 52, 12359–12363. [Google Scholar] [CrossRef] [PubMed]
  11. Bourcier, D.; Féraud, J.; Colson, D.; Mandrick, K.; Ode, D.; Brackx, E.; Puel, F. Influence of particle size and shape properties on cake resistance and compressibility during pressure filtration. Chem. Eng. Sci. 2016, 144, 176–187. [Google Scholar] [CrossRef]
  12. Ma, Y.; Wu, S.; Macaringue, E.; Zhang, T.; Gong, J.; Wang, J. Recent Progress in Continuous Crystallization of Pharmaceutical Products: Precise Preparation and Control. Org. Process Res. Dev. 2021, 24, 1785–1801. [Google Scholar] [CrossRef]
  13. Domokos, A.; Nagy, B.; Szilágyi, B.; Marosi, G.; Nagy, Z.K. Integrated continuous pharmaceutical technologies—A review. Org. Process Res. Dev. 2021, 25, 721–739. [Google Scholar] [CrossRef]
  14. Johnson, M.D.; Burcham, C.L.; May, S.A.; Calvin, J.R.; Groh, J.M.; Myers, S.S.; Webster, L.P.; Roberts, J.C.; Reddy, V.R.; Luciani, C.V.; et al. API continuous cooling and antisolvent crystallization for kinetic impurity rejection in cGMP manufacturing. Org. Process Res. Dev. 2021, 25, 1284–1351. [Google Scholar] [CrossRef]
  15. Nagy, B.; Szilágyi, B.; Domokos, A.; Tacsi, K.; Pataki, H.; Marosi, G.; Nagy, Z.K.; Nagy, Z.K. Modeling of pharmaceutical filtration and continuous integrated crystallization-filtration processes. Chem. Eng. J. 2021, 413, 127566. [Google Scholar] [CrossRef]
  16. Domokos, A.; Nagy, B.; Gyürkés, M.; Farkas, A.; Tacsi, K.; Pataki, H.; Liu, Y.C.; Balogh, A.; Firth, P.; Szilágyi, B.; et al. End-to-end continuous manufacturing of conventional compressed tablets: From flow synthesis to tableting through integrated crystallization and filtration. Int. J. Pharm. 2020, 581, 119297. [Google Scholar] [CrossRef]
  17. Liu, Y.C.; Domokos, A.; Coleman, S.; Firth, P.; Nagy, Z.K. Development of continuous filtration in a novel continuous filtration carousel integrated with continuous crystallization. Org. Process Res. Dev. 2019, 23, 2655–2665. [Google Scholar] [CrossRef]
  18. Ottoboni, S.; Price, C.J.; Steven, C.; Meehan, E.; Barton, A.; Firth, P.; Mitchell, A.; Tahir, F. Development of a novel continuous filtration unit for pharmaceutical process development and manufacturing. J. Pharm. Sci. 2019, 108, 372–381. [Google Scholar] [CrossRef] [PubMed] [Green Version]
  19. Ottoboni, S.; Shahid, M.; Steven, C.; Coleman, S.; Meehan, E.; Barton, A.; Firth, P.; Sutherland, R.; Price, C.J. Developing a batch isolation procedure and running it in an automated semicontinuous unit: AWL CFD25 case study. Org. Process Res. Dev. 2020, 24, 520–539. [Google Scholar] [CrossRef] [PubMed]
  20. Ottoboni, S.; Coleman, S.J.; Steven, C.; Siddique, M.; Fraissinet, M.; Joannes, M.; Laux, A.; Barton, A.; Firth, P.; Price, C.J.; et al. Understanding API static drying with hot gas flow: Design and test of a drying rig prototype and drying modeling development. Org. Process Res. Dev. 2020, 24, 2505–2520. [Google Scholar] [CrossRef] [PubMed]
  21. Destro, F.; Hur, I.; Wang, V.; Abdi, M.; Feng, X.; Wood, E.; Coleman, S.; Firth, P.; Barton, A.; Barolo, M.; et al. Mathematical modeling and digital design of an intensified filtration-washing-drying unit for pharmaceutical continuous manufacturing. Chem. Eng. Sci. 2021, 244, 116803. [Google Scholar] [CrossRef]
  22. Barton, A. Filtration Apparatus. WO 2015/033117 A1, 12 March 2015. [Google Scholar]
  23. Born, S.; Dittrich, J.; Takizawa, B.T.; Mascia, S. Continuous Rotary Plate Filter and Methods of Use Thereof. WO 2017/136779 A1, 10 August 2017. [Google Scholar]
  24. Testa, C.J.; Hu, C.; Shvedova, K.; Wu, W.; Sayin, R.; Casati, F.; Halkude, B.S.; Hermant, P.; Shen, D.E.; Ramnath, A.; et al. Design and commercialization of an end-to-end continuous pharmaceutical production process: A pilot plant case study. Org. Process Res. Dev. 2020, 24, 2874–2889. [Google Scholar] [CrossRef]
  25. Hu, C.; Testa, C.J.; Born, S.C.; Wu, W.; Shvedova, K.; Sayin, R.; Halkude, B.S.; Casati, F.; Ramnath, A.; Hermant, P.; et al. E-factor analysis of a pilot plant for end-to-end integrated continuous manufacturing (ICM) of pharmaceuticals. Green Chem. 2020, 22, 4350–4356. [Google Scholar] [CrossRef]
  26. Testa, C.J.; Shvedova, K.; Hu, C.; Wu, W.; Born, S.C.; Takizawa, B.; Mascia, S. Heterogeneous crystallization as a process intensification technology in an integrated continuous manufacturing process for pharmaceuticals. Org. Process Res. Dev. 2021, 25, 225–238. [Google Scholar] [CrossRef]
  27. Steenweg, C.; Wohlgemuth, K.; Schembecker, G. Rotating-Screw Drying Reactor—Schneckenfördertrocknungsreaktor. WO2021148108 A1, 29 July 2021. [Google Scholar]
  28. Steenweg, C.; Seifert, A.I.; Schembecker, G.; Wohlgemuth, K. Characterization of a modular continuous vacuum screw filter for small-scale solid–liquid separation of suspensions. Org. Process Res. Dev. 2021, 25, 926–940. [Google Scholar] [CrossRef]
  29. Steenweg, C.; Seifert, A.I.; Böttger, N.; Wohlgemuth, K. Process intensification enabling continuous manufacturing processes using modular continuous vacuum screw filter. Org. Process Res. Dev. 2021, 25, 2525–2536. [Google Scholar] [CrossRef]
  30. Steenweg, C.; Wohlgemuth, K. Von der Suspension zum getrockneten Produkt mittels neuartigem Vakuumschraubenfilter. Filtr. Sep. 2021, 4, 4–11. [Google Scholar]
  31. Steenweg, C.; Kufner, A.C.; Habicht, J.; Wohlgemuth, K. Towards continuous primary manufacturing processes—Particle design through combined crystallization and particle isolation. Processes 2021, 9, 2187. [Google Scholar] [CrossRef]
  32. FDA. Quality Considerations for Continuous Manufacturing: Guidance for Industry; Department of Health and Human Services: Washington, DC, USA, 2019.
  33. Wakeman, R. The influence of particle properties on filtration. Sep. Purif. Technol. 2007, 58, 234–241. [Google Scholar] [CrossRef]
  34. Pudasaini, N.; Upadhyay, P.P.; Parker, C.R.; Hagen, S.U.; Bond, A.D.; Rantanen, J. Downstream processability of crystal habit-modified active pharmaceutical ingredient. Org. Process Res. Dev. 2017, 21, 571–577. [Google Scholar] [CrossRef]
  35. Leane, M.; Pitt, K.; Reynolds, G.; The Manufacturing Classification System (MCS) Working Group. A proposal for a drug product manufacturing classification system (MCS) for oral solid dosage forms. Pharm. Dev. Technol. 2015, 20, 12–21. [Google Scholar] [CrossRef]
  36. MacLeod, C.S.; Muller, F. On the fracture of pharmaceutical needle-shaped crystals during pressure filtration: Case studies and mechanistic understanding. Org. Process Res. Dev. 2012, 16, 425–434. [Google Scholar] [CrossRef]
  37. Eren, A.; Szilagyi, B.; Quon, J.L.; Papageorgiou, C.D.; Nagy, Z.K. Experimental investigation of an integrated crystallization and wet-milling system with temperature cycling to control the size and aspect ratio of needle-shaped pharmaceutical crystals. Cryst. Growth Des. 2021, 21, 3981–3993. [Google Scholar] [CrossRef]
  38. Perini, G.; Salvatori, F.; Ochsenbein, D.; Mazzotti, M.; Vetter, T. Filterability prediction of needle-like crystals based on particle size and shape distribution data. Sep. Purif. Technol. 2019, 211, 768–781. [Google Scholar] [CrossRef]
  39. Lekhal, A.; Girard, K.; Brown, M.; Kiang, S.; Khinast, J.; Glasser, B. The effect of agitated drying on the morphology of l-threonine (needle-like) crystals. Int. J. Pharm. 2004, 270, 263–277. [Google Scholar] [CrossRef] [PubMed]
  40. Eggers, J.; Kempkes, M.; Mazzotti, M. Measurement of size and shape distributions of particles through image analysis. Chem. Eng. Sci. 2008, 63, 5513–5521. [Google Scholar] [CrossRef]
  41. Kempkes, M.; Eggers, J.; Mazzotti, M. Measurement of particle size and shape by FBRM and in situ microscopy. Chem. Eng. Sci. 2008, 63, 4656–4675. [Google Scholar] [CrossRef]
  42. Kempkes, M.; Vetter, T.; Mazzotti, M. Monitoring the particle size and shape in the crystallization of paracetamol from water. Chem. Eng. Res. Des. 2010, 88, 447–454. [Google Scholar] [CrossRef]
  43. Briesen, H. Simulation of crystal size and shape by means of a reduced two-dimensional population balance model. Chem. Eng. Sci. 2006, 61, 104–112. [Google Scholar] [CrossRef]
  44. Wohlgemuth, K.; Schembecker, G. Modeling induced nucleation processes during batch cooling crystallization: A sequential parameter determination procedure. Comput. Chem. Eng. 2013, 52, 216–229. [Google Scholar] [CrossRef]
  45. Lührmann, M.-C.; Timmermann, J.; Schembecker, G.; Wohlgemuth, K. Enhanced Product Quality Control through Separation of Crystallization Phenomena in a Four-Stage MSMPR Cascade. Cryst. Growth Des. 2018, 18, 7323–7334. [Google Scholar] [CrossRef]
  46. Saal, S. Begasungskristallisation in Wässrigen Aminosäuresystemen. Master’s Thesis, Technische Universität Dortmund, Dortmund, Germany, 2017. [Google Scholar]
  47. Heisel, S.; Ernst, J.; Emshoff, A.; Schembecker, G.; Wohlgemuth, K. Shape-independent particle classification for discrimination of single crystals and agglomerates. Powder Technol. 2019, 345, 425–437. [Google Scholar] [CrossRef]
  48. Terdenge, L.-M.; Wohlgemuth, K. Impact of agglomeration on crystalline product quality within the crystallization process chain. Cryst. Res. Technol. 2016, 51, 513–523. [Google Scholar] [CrossRef]
  49. Heisel, S.; Rolfes, M.; Wohlgemuth, K. Discrimination between single crystals and agglomerates during the crystallization process. Chem. Eng. Technol. 2018, 41, 1218–1225. [Google Scholar] [CrossRef]
  50. De Albuquerque, I.; Mazzotti, M.; Ochsenbein, D.R.; Morari, M. Effect of needle-like crystal shape on measured particle size distributions. AIChE J. 2016, 62, 2974–2985. [Google Scholar] [CrossRef]
  51. Schorsch, S.; Vetter, T.; Mazzotti, M. Measuring multidimensional particle size distributions during crystallization. Chem. Eng. Sci. 2012, 77, 130–142. [Google Scholar] [CrossRef]
  52. Steger, C. On the Calculation of Arbitrary Moments of Polygons; Technical Report FGBV-96-05; Technische Universität München: Munich, Germany, 1996. [Google Scholar]
  53. Yu, W.; Hancock, B. Evaluation of dynamic image analysis for characterizing pharmaceutical excipient particles. Int. J. Pharm. 2008, 361, 150–157. [Google Scholar] [CrossRef] [PubMed]
  54. ISO 13322-2; Particle Size Analysis—Image Analysis Methods; Dynamic Image Analysis Methods. International Organization for Standardization: Geneva, Switzerland, 2006.
  55. Origin-Help: Density Dots. Available online: https://www.originlab.com/doc/Origin-Help/Density_Dots (accessed on 13 October 2021).
  56. Botev, Z.I.; Grotowski, J.F.; Kroese, D. Kernel density estimation via diffusion. Ann. Stat. 2010, 38, 2916–2957. [Google Scholar] [CrossRef] [Green Version]
  57. Kleppmann, W. Versuchsplanung: Produkte und Prozesse Optimieren, 8th ed.; Praxisreihe Qualitätswissen, Hanser: Münich, Germany, 2013. [Google Scholar]
  58. Papageorgiou, C.D.; Mitchell, C.; Quon, J.L.; Langston, M.; Borg, S.; Hicks, F.; Ende, D.J.A.; Breault, M. Development of a novel screening methodology for the assessment of the risk of particle size attrition during agitated drying. Org. Process Res. Dev. 2020, 24, 242–254. [Google Scholar] [CrossRef]
  59. Birch, M.; Marziano, I. Understanding and avoidance of agglomeration during drying processes: A case study. Org. Process Res. Dev. 2013, 17, 1359–1366. [Google Scholar] [CrossRef]
Figure 1. Experimental setup of the experiments with varying particle shapes. The CVSF consists of the module A (filtration), module B1 (1st washing), and module B2 (2nd washing).
Crystals 12 00137 g001
Figure 2. Upper half: exemplary QICPIC binary images of (a) bipyramidal—no L-GA impurity, (b) cuboid—2.9 gL-GA kg−1 water, and (c) needle-shaped 5.8 gL-GA kg−1 water. Lower half: corresponding scanning electron microscope images.
Crystals 12 00137 g002
Figure 3. Challenges occurring with 2D-image analysis of non-spherical particles. The grey surfaces show the measured areas by dynamic image analysis for two different angles of αobservation. The differences in the resulting PSDs are schematically shown in the left and right corners of the cubic analytical space.
Crystals 12 00137 g003
Figure 4. Three step process of the extended approach to analyze ALDs of non-spherical particles using needle-shaped l-alanine particles as an example. Step 1: Scatter plot of the measured MIL and MAL values of the sample with 38,702 particles. Step 2: Calculation of probability values with the function “density dots” of OriginPro 2021 for measured MIL and MAL. Step 3: Determination of the “center of mass” (red star), quantified by the coordinates of MALch and MILch at the corresponding axes, enabling comparability between ALDs.
Crystals 12 00137 g004
Figure 5. Axis length distribution of the inlet suspension (ALDIN, left) and washed product particles (ALDOUT, right) after two-stage washing: upper half—for cuboid-shaped particles with an average aspect ratio of 2; lower half—for needle-shaped particles with an average aspect ratio of 3–4.
Crystals 12 00137 g005
Figure 6. Averaged residual moistures of the product particles after CVSF operation of bipyramidal (grey), cuboids (green), and needles (orange).
Crystals 12 00137 g006
Figure 7. Experimental setup of the experiments with varying particle shapes.
Crystals 12 00137 g007
Figure 8. Axis length distribution in the inlet suspension (ALDIN, left) and washed product particles after drying (ALDOUT, right): upper half—for cuboid-shaped particles; lower half—for needle-shaped particles.
Crystals 12 00137 g008
Figure 9. Exemplary QIPCIC binary images of the inlet suspension (left), product particles after two-stage washing (middle, compare ALDOUT of Figure 5), and product particles after washing and drying (right, compare ALDOUT of Figure 8): upper half—for cuboid-shaped particles; lower half—for needle-shaped particles.
Crystals 12 00137 g009
Table 1. Operating parameters for experiments in this study. Qsusp: suspension volume flow rate; ws: feed solid mass fraction; nscrew: rotational speed of the PTFE screw; Δpset: applied vacuum pressure difference; and Qwash: wash liquid flow rate.
Operating ParametersValue
Qsusp [mL min−1]60
ws [wt.%, g gsol−1]6
nscrew [rpm]3
Δ pset [mbar]400
Qwash [mL min−1]35
Publisher’s Note: MDPI stays neutral with regard to jurisdictional claims in published maps and institutional affiliations.

