Abstract
The macroscopic aspects of adding basalt fiber (BF) to concrete has been the subject of studies that document great increases in compression strength. Research into the microscopic aspects of the reinforcement mechanism is still in an exploratory stage, and the quantitative analysis and visual observation of fibers in the concrete matrix are difficult. In this paper, the reinforcement effect of fiber on concrete is studied by means of computed tomography (CT) scanning technology and digital image processing (DIP) technology, combined with the macro-mechanical properties obtained from the unconfined compression strength test, and quantitative analysis from the micro point of view. At the same time, the fiber visualization is realized with the help of Avizo. The results show that with the increase in fiber dosage, the peak stress of concrete first increases and then decreases. When the fiber dosage is 3 kg/m3, the peak stress is 44.4 MPa, which is 41.85% higher than that of ordinary concrete. Additionally, the proportion of macropores is the least, which is the best fiber dosage. It is found that when the fiber dosage is 3 kg/m3, the angular distribution of φ is relatively uniform, and the uniform distribution of fibers forms a dense network structure, which significantly increases the peak stress of concrete. However, when the fiber dosage is too high, it will lead to the accumulation of fibers and produce macropores, and these excess fibers mainly appear in the horizontal direction and do not contribute to the compression strength.
1. Introduction
Concrete is the main building material for large-scale hydraulic structures, but concrete itself has defects such as poor ductility and brittleness, which seriously hinders its further development. In the last 30 years, researchers have suggested many methods for improving the mechanical properties of concrete. Mixing randomly distributed fibers is an effective method [1,2,3,4,5,6]. Fiber has excellent mechanical properties and good durability. In engineering practice, fiber is often used as reinforcement, and is added to polymer composites and concrete materials. BF is a new type of inorganic fiber material. It takes the pure natural basalt ore as a raw material, breaks the ore and puts it into the tank kiln. After melting at 1450–1500 °C, it is stretched into continuous fiber through a spinneret. Compared with steel fiber and carbon fiber, BF has the advantages of excellent mechanical properties, outstanding thermal properties, stable chemical properties, and excellent compatibility. Therefore, the study of BFRC has certain theoretical significance and practical value, and also plays an important guiding role in improving the performance of concrete [7,8,9,10,11].
In recent years, the macroscopic aspects of adding fiber to concrete has been subject to studies that document great increases in compression strength. Chen et al. [12] studied six groups of BFRC with different fiber dosages and found that the addition of fiber improve the mechanical properties of concrete. Li [13] obtained a series of continuous slice images via the non-destructive scanning of loess with industrial CT, studied the preferential seepage channel characteristics of micro-scale loess, and studied the flow characteristics of loess. Song et al. [14] identified the pores and fissures in coal and showed the distribution of pores and fissures in three-dimensional space. By comparing the CT scanning results with the pressure pump test results, it was concluded that the analysis results of CT scanning were more reliable. Li et al. [15] studied the mechanical effect of macro-synthetic fiber concrete, compared the mechanical properties of synthetic fiber and steel fiber, and concluded that fiber can effectively improve the stiffness and crack width of concrete segments after cracking. Wang et al. [16] applied glass fiber and carbon fiber to improve the mechanical properties of polymer concrete. According to the compression test, glass fiber was the appropriate reinforcing fiber for polymer concrete.
However, most of the previous studies have focused more on the mechanical properties and fracture properties of BFRC, and less on the pore structure and fiber distribution of BFRC. Research into the microscopic aspects of the reinforcement mechanism is still in an exploratory stage, and the quantitative analysis and visual observation of fibers in the concrete matrix are difficult. Therefore, this paper uses innovative research methods to study the state of pores and fibers in concrete from the micro perspective. Firstly, the in situ test scanning of fiber in concrete is carried out by CT, and the horizontal and vertical slice images of concrete are obtained, so as to obtain the in situ state of fiber in concrete. Secondly, because the density of fiber is similar to that of concrete matrix, it is difficult to find fiber when X-ray passes through when CT is used to scan concrete. In this paper, the innovative method uses Avizo software to identify fibers and achieve visualization. Thirdly, the distribution and angle of fiber are quantitatively analyzed to study the influence of fiber on the mechanical properties of concrete.
Taking BFRC with four kinds of fiber dosage as the object, the influence of BF on concrete is studied from the macro and micro perspectives through unconfined compression experiment and CT scanning technology. The BFRC microstructure model is reconstructed based on Avizo software to quantitatively analyze pore parameters and fiber orientation. Combined with the unconfined compression strength, it is verified that BF could improve the mechanical properties of concrete, establish the relationship between the influence of BF on the macro-properties of concrete and the micro-action mechanism, and reveal the reinforcement effect of BF on the concrete matrix.
2. Materials and Methods
2.1. Materials
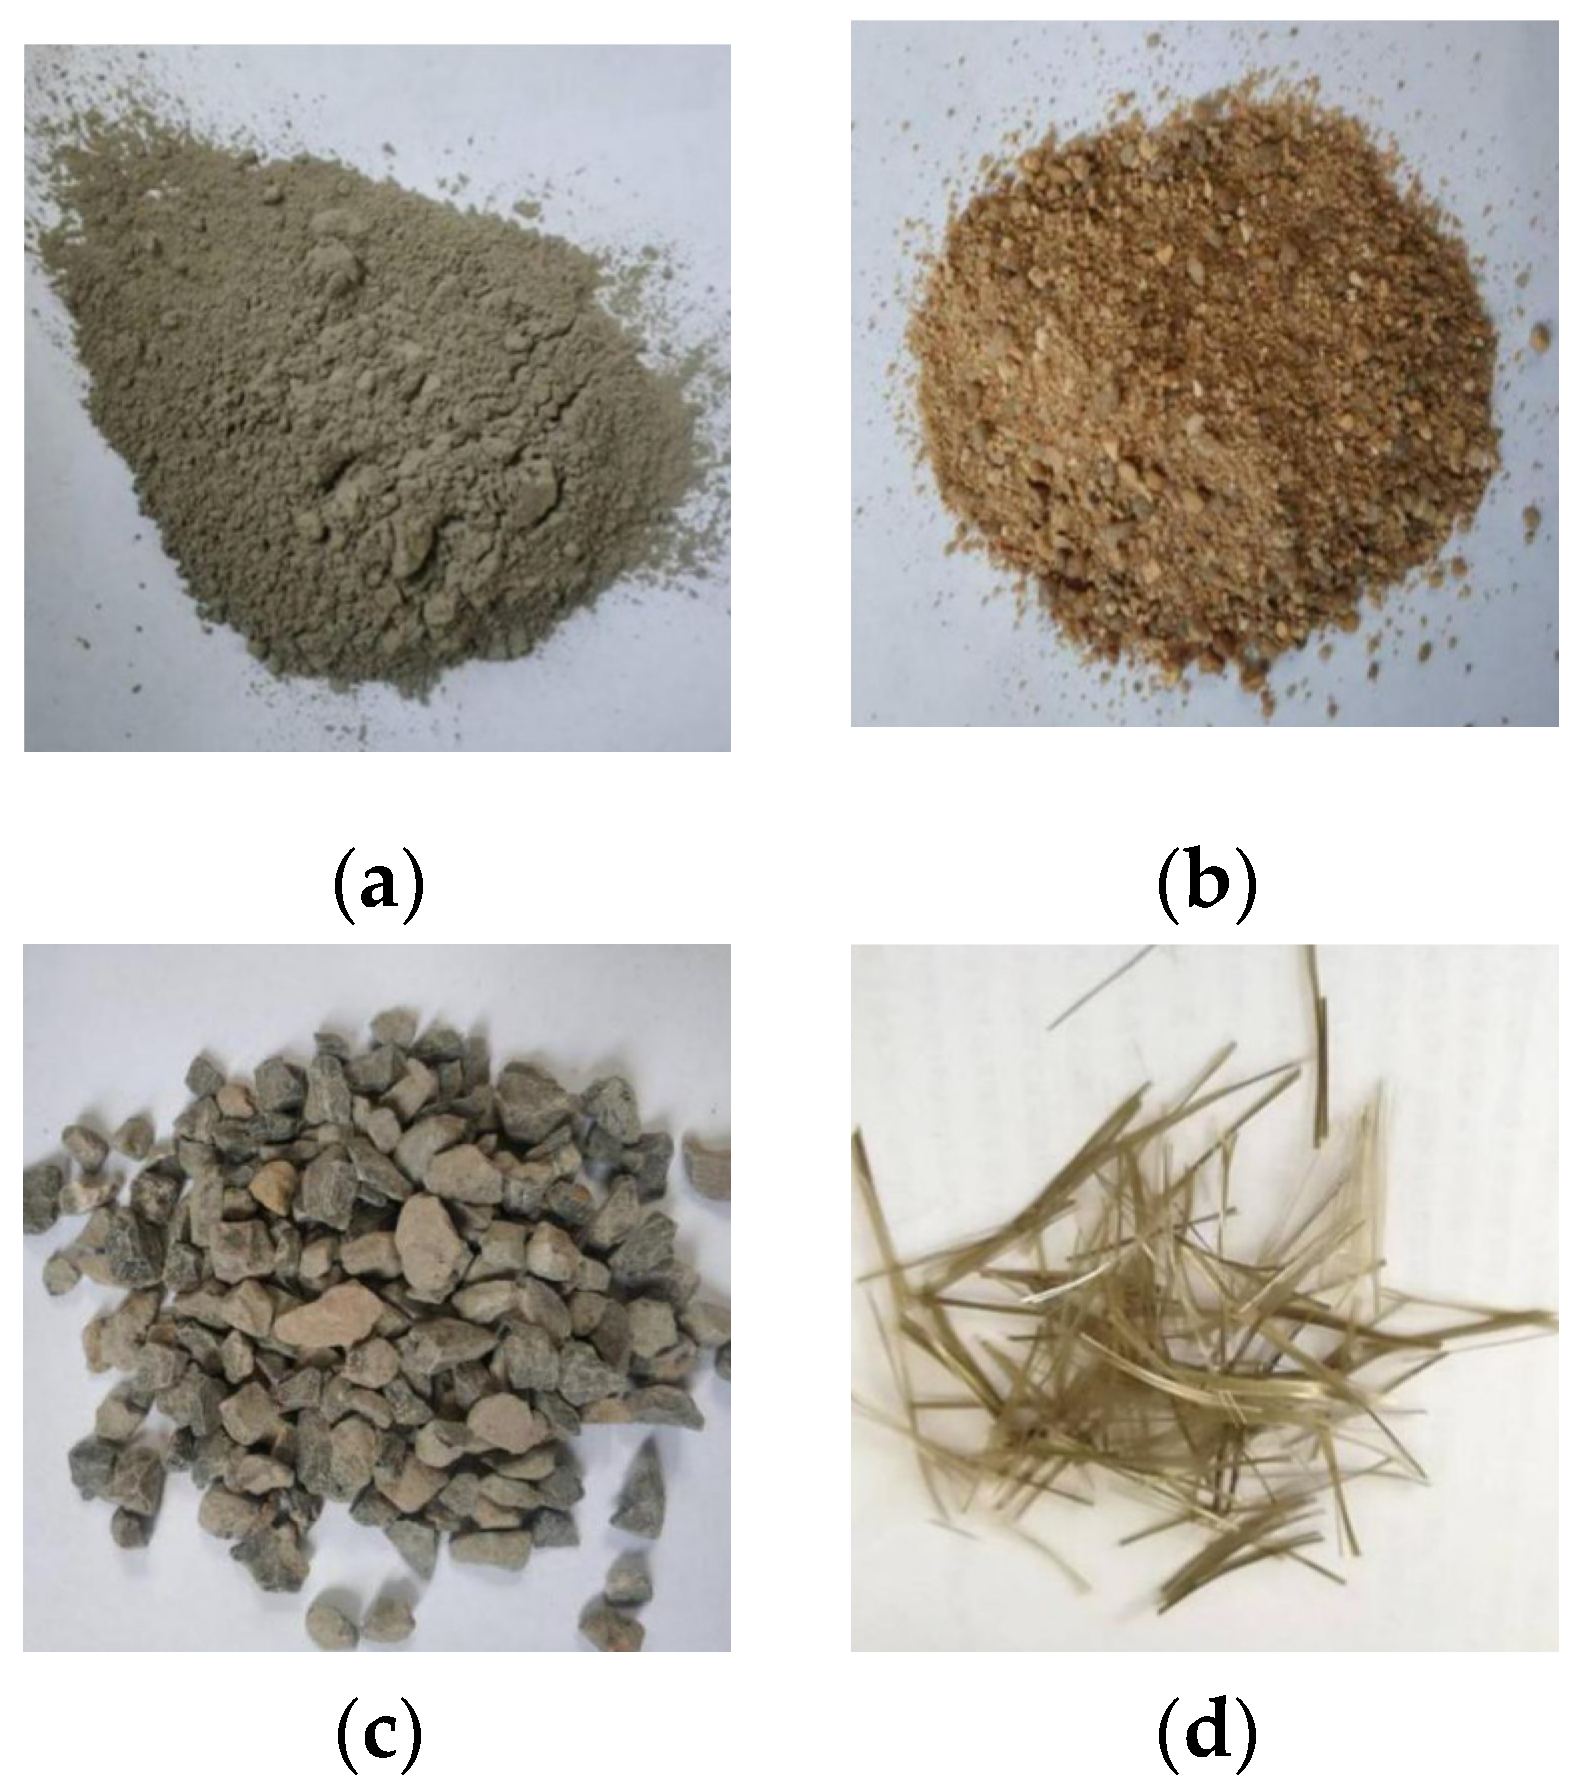
The raw materials of this test include: cement, water, fine aggregate, coarse aggregate, and BF, as shown in Figure 1 See Table 1 and Table 2 for the properties of Portland cement and the physical and mechanical properties of BF:
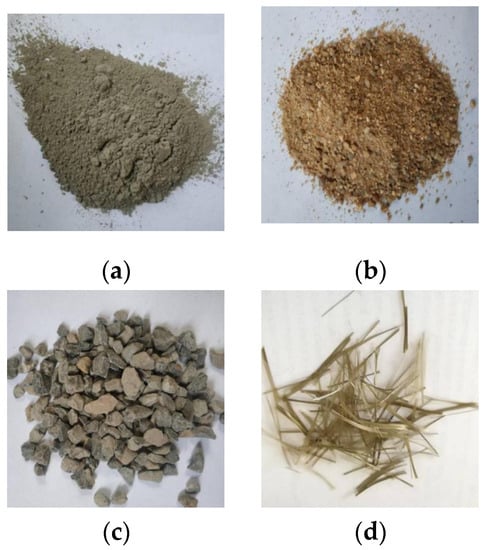
Figure 1.
Materials used in the test. (a) Cement, (b) manufactured sand, (c) crushed stone, and (d) BF.

Table 1.
Performance index of Portland cement.
Table 2.
Physical and mechanical indexes of BF.
The production of a BFRC specimen used in this test was a relatively fixed process, as shown in Figure 2, involving sorting, a mixing method, and mixing time, which are the factors affecting the performance of BFRC. In this test, a forced mixer was used to ensure a standard mixing time and the uniform mixing of the concrete mixture [17,18]. According to the mix proportion design, we weighed different materials of a corresponding quality, added cement and sand to the mixer, added gravel and BF successively, added more while mixing, and finally added water. After mixing, we filled the corresponding mold with BFRC. Before filling, we brushed a layer of oily material in the mold to facilitate mold demolding. After vibrating the concrete for 10 min, we observed whether there was excess concrete at the edge of the mold. If so, we scraped it off first and then covered the surface of the specimen with waterproof plastic film. The curing temperature was controlled within the range of (20 ± 5) °C, the relative humidity was adjusted to 95%, and the mold was removed after 1 day to finally obtained the BFRC specimen. The production process is shown in the figure below.
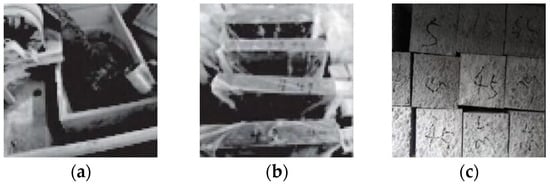
Figure 2.
Manufacturing process of specimen. (a) Aggregate mixing, (b) demolding and curing, and (c) concrete specimen.
2.2. Methods
2.2.1. Instrument Introduction
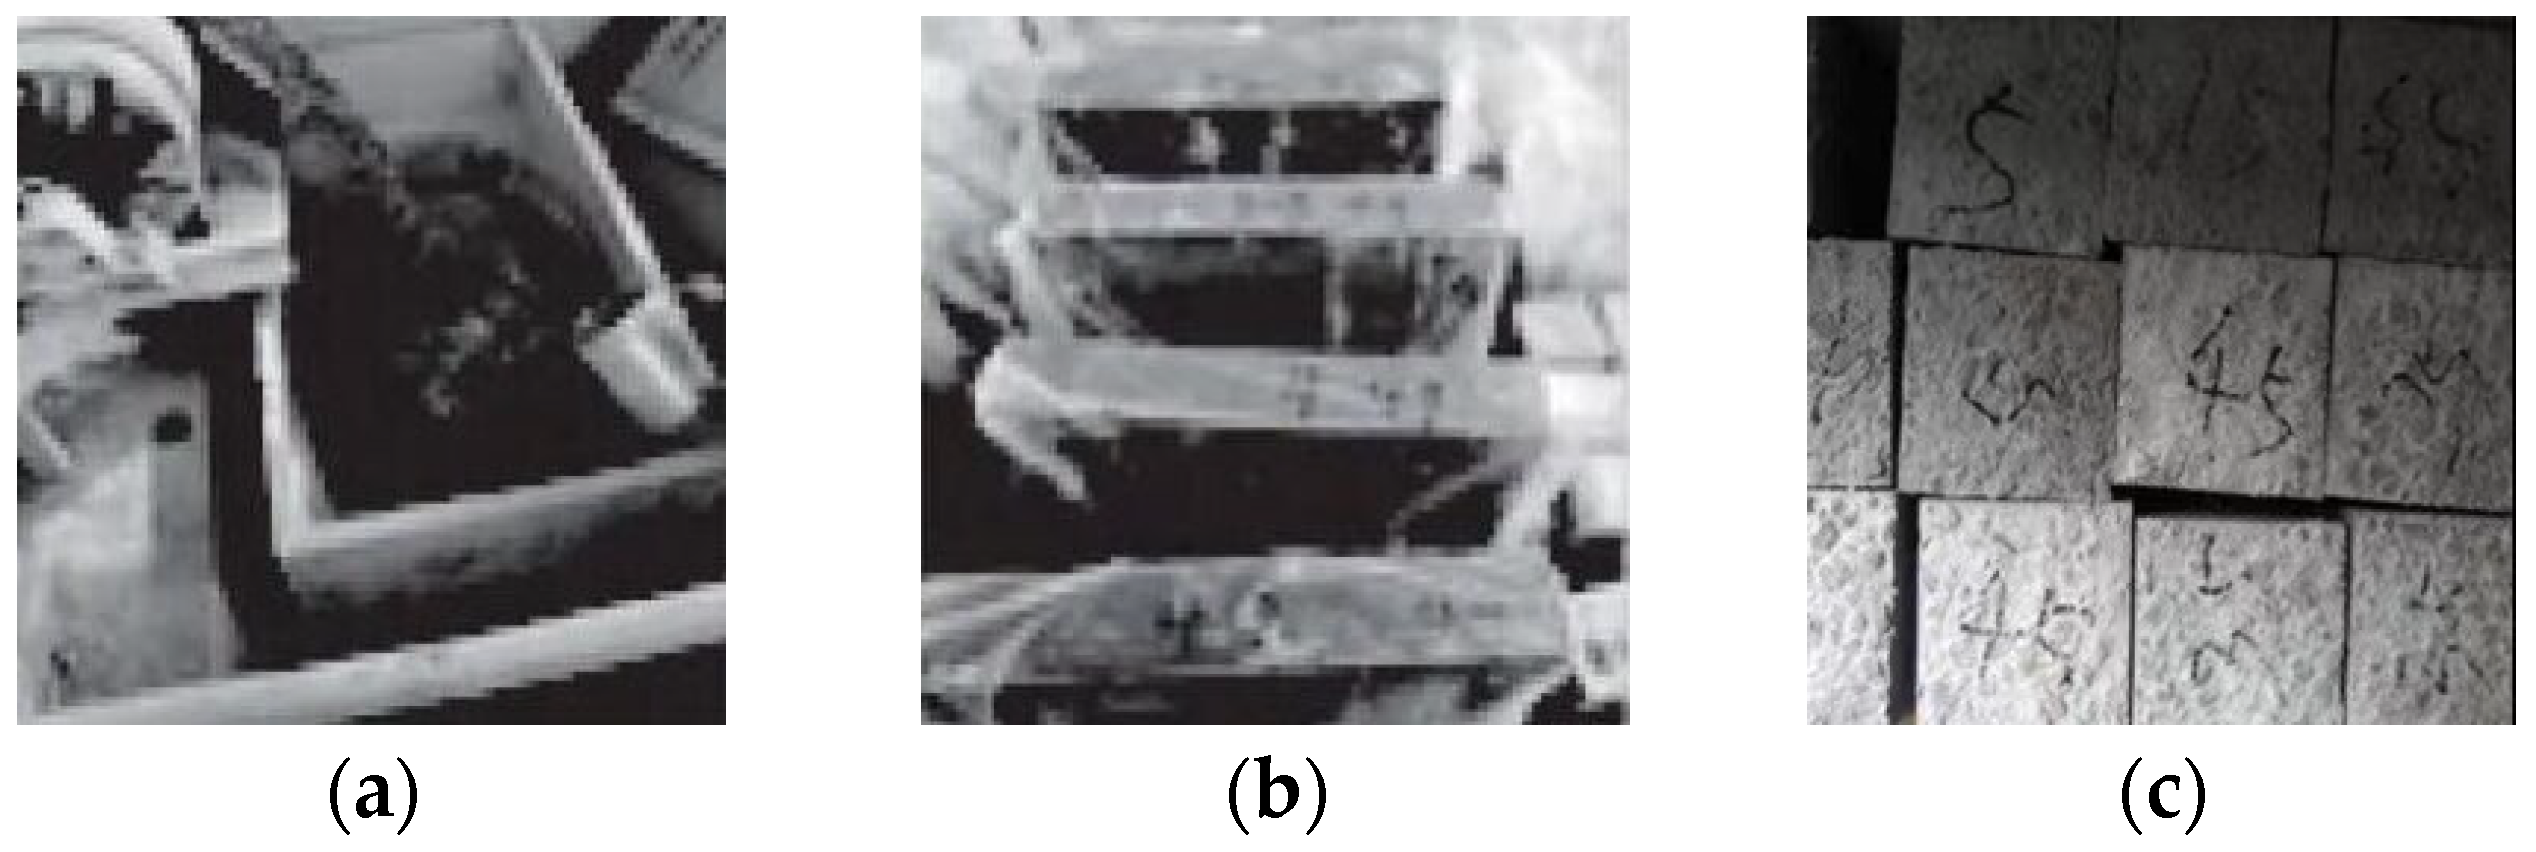
The CT scanning experimental equipment is a Phoenix|tomex|s 3D computed tomography system from German GE Company, as shown in Figure 3, and the maximum voxel resolution is 0.3 μm. The maximum scanning voltage is 180 kV and the maximum power is 15 W [19]. Before scanning the sample, we placed the fiber concrete sample on the scanning turntable, set the scanning parameters, and then started scanning to obtain the basic data. After scanning, the device obtained horizontal and vertical slices, as shown in Figure 4, and the pixel size is 1721 px × 1721 px, while the thickness of slice is 0.0059 mm.
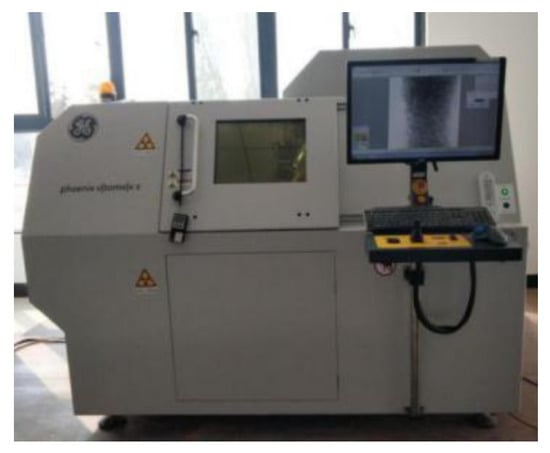
Figure 3.
CT scanning equipment.
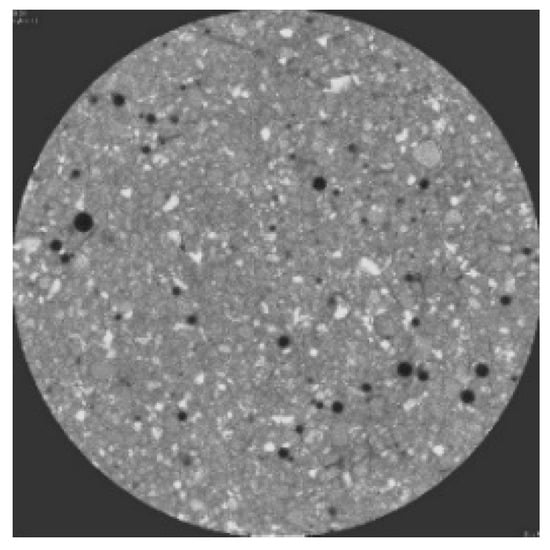
Figure 4.
Specimen slice.
2.2.2. CT Scanning Principle
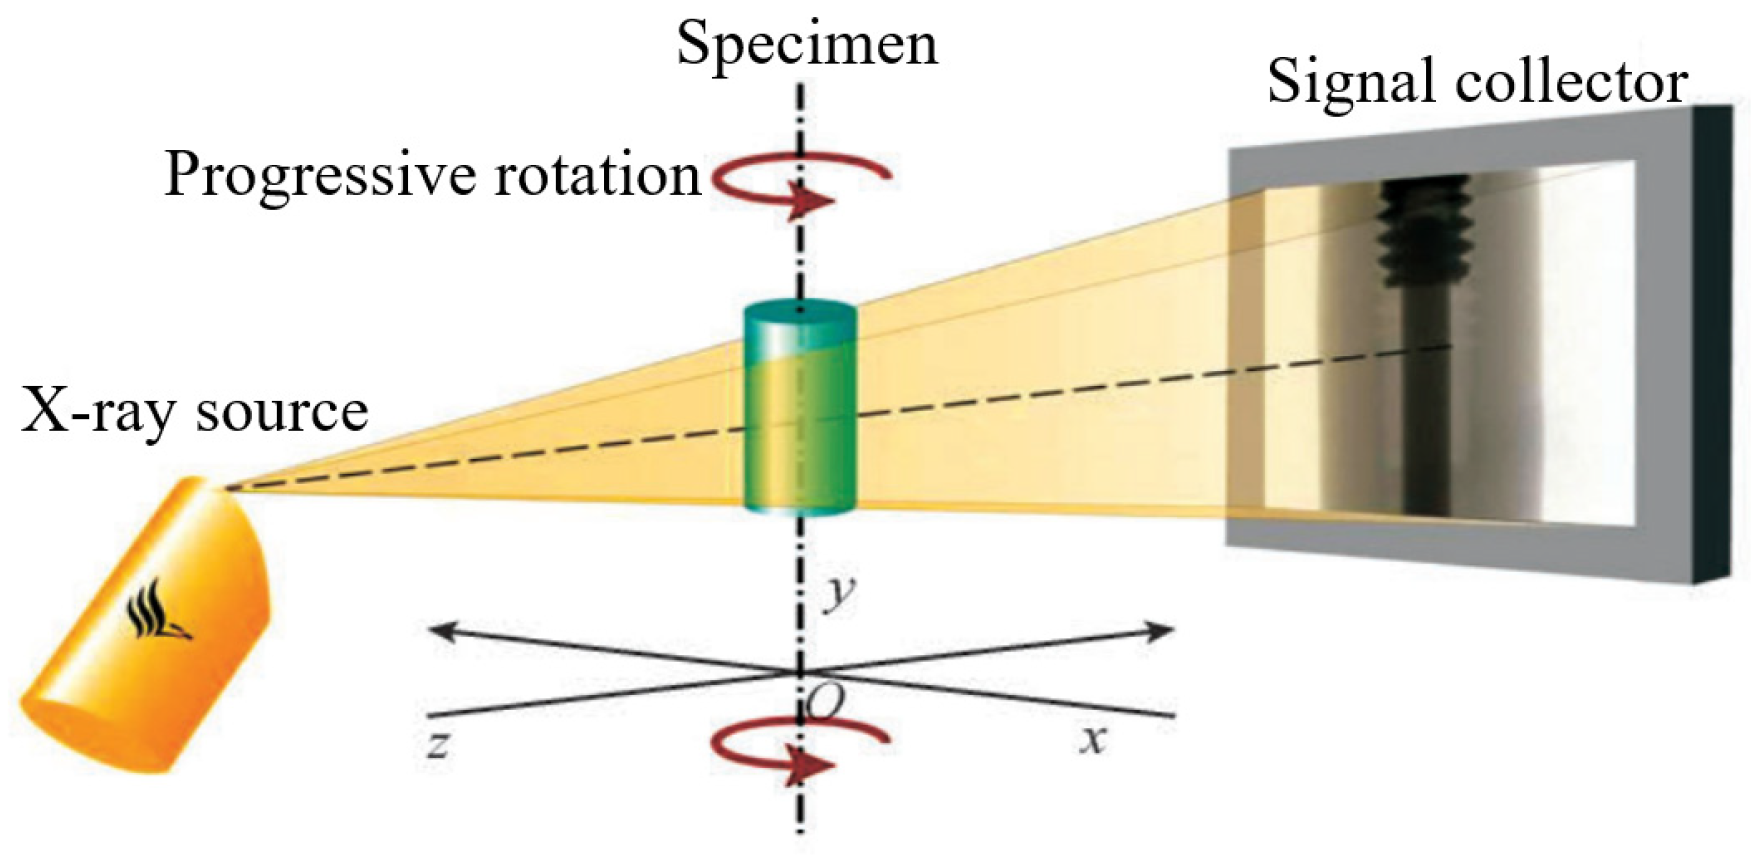
The basic principle of CT detection technology is to scan the sample to be tested with an X-ray, as shown in Figure 5. The X-ray is transmitted through the sample and received by the detector, and then the optical signal is converted into a high-resolution image reflecting the component information of the sample. When X-rays pass through specimens with different densities, X-rays will be attenuated to varying degrees due to the refraction and reflection of light. The attenuation of X-rays follows the Lambert–Beer Law [20,21]:
where is the original X-ray intensity, is the intensity after X-ray attenuation, is the attenuation coefficient of the X-ray passing through the sample, and is the thickness of the X-ray passing through the sample.

Figure 5.
Schematic diagram of CT system scanning.
2.2.3. Gaussian Filter
According to ISO 11562, the basic principle of a Gaussian filter can be expressed as that Gaussian filter is a linear contour filter with continuous weight function, as defined in equation [22].
where is the distance from the weight function to the center point (i.e., the maximum point), is the cutoff wavelength, and , which is a constant.
CT scanning imaging technology will inevitably produce some noise in the imaging process, which will make the pixel value in the slice image deviate and affect the subsequent image processing and analysis. Therefore, in order to obtain high-quality results, the first step of image processing is to filter the continuous CT slices so as to eliminate noise and retain the contour, geometric shape, and topological features of pore edges, which will help to obtain high-quality images and prepare for pore segmentation in the next step.
In this study, a Gaussian-smoothing filter is used to filter and denoise the BFRC slice image, and the image is shown in Figure 6.
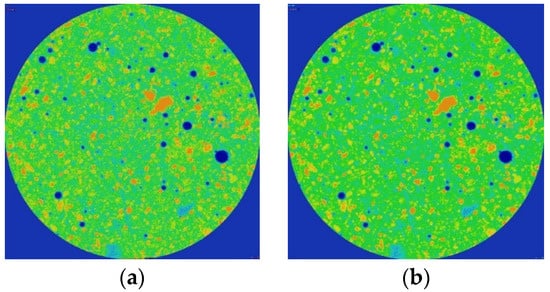
Figure 6.
Comparison of slice images before and after filtering. (a) Slice image before filtering and (b) slice image after filtering.
2.2.4. Interactive Segmentation Algorithm
The dynamic programming method in the interactive segmentation algorithm was first applied to image edge tracking. Image edge detection can be regarded as an optimization problem and is expressed as finding the optimal value M (e.g., taking the minimum value min) of an objective function and obtaining a set of independent variable values when V takes the optimal value. If the variables are discrete and there is no specific law to follow in the objective function, then the problem will include a huge solution space. If the objective function can be described in the following form, the optimization problem of the objective function can be solved by a multi-stage optimization method [23].
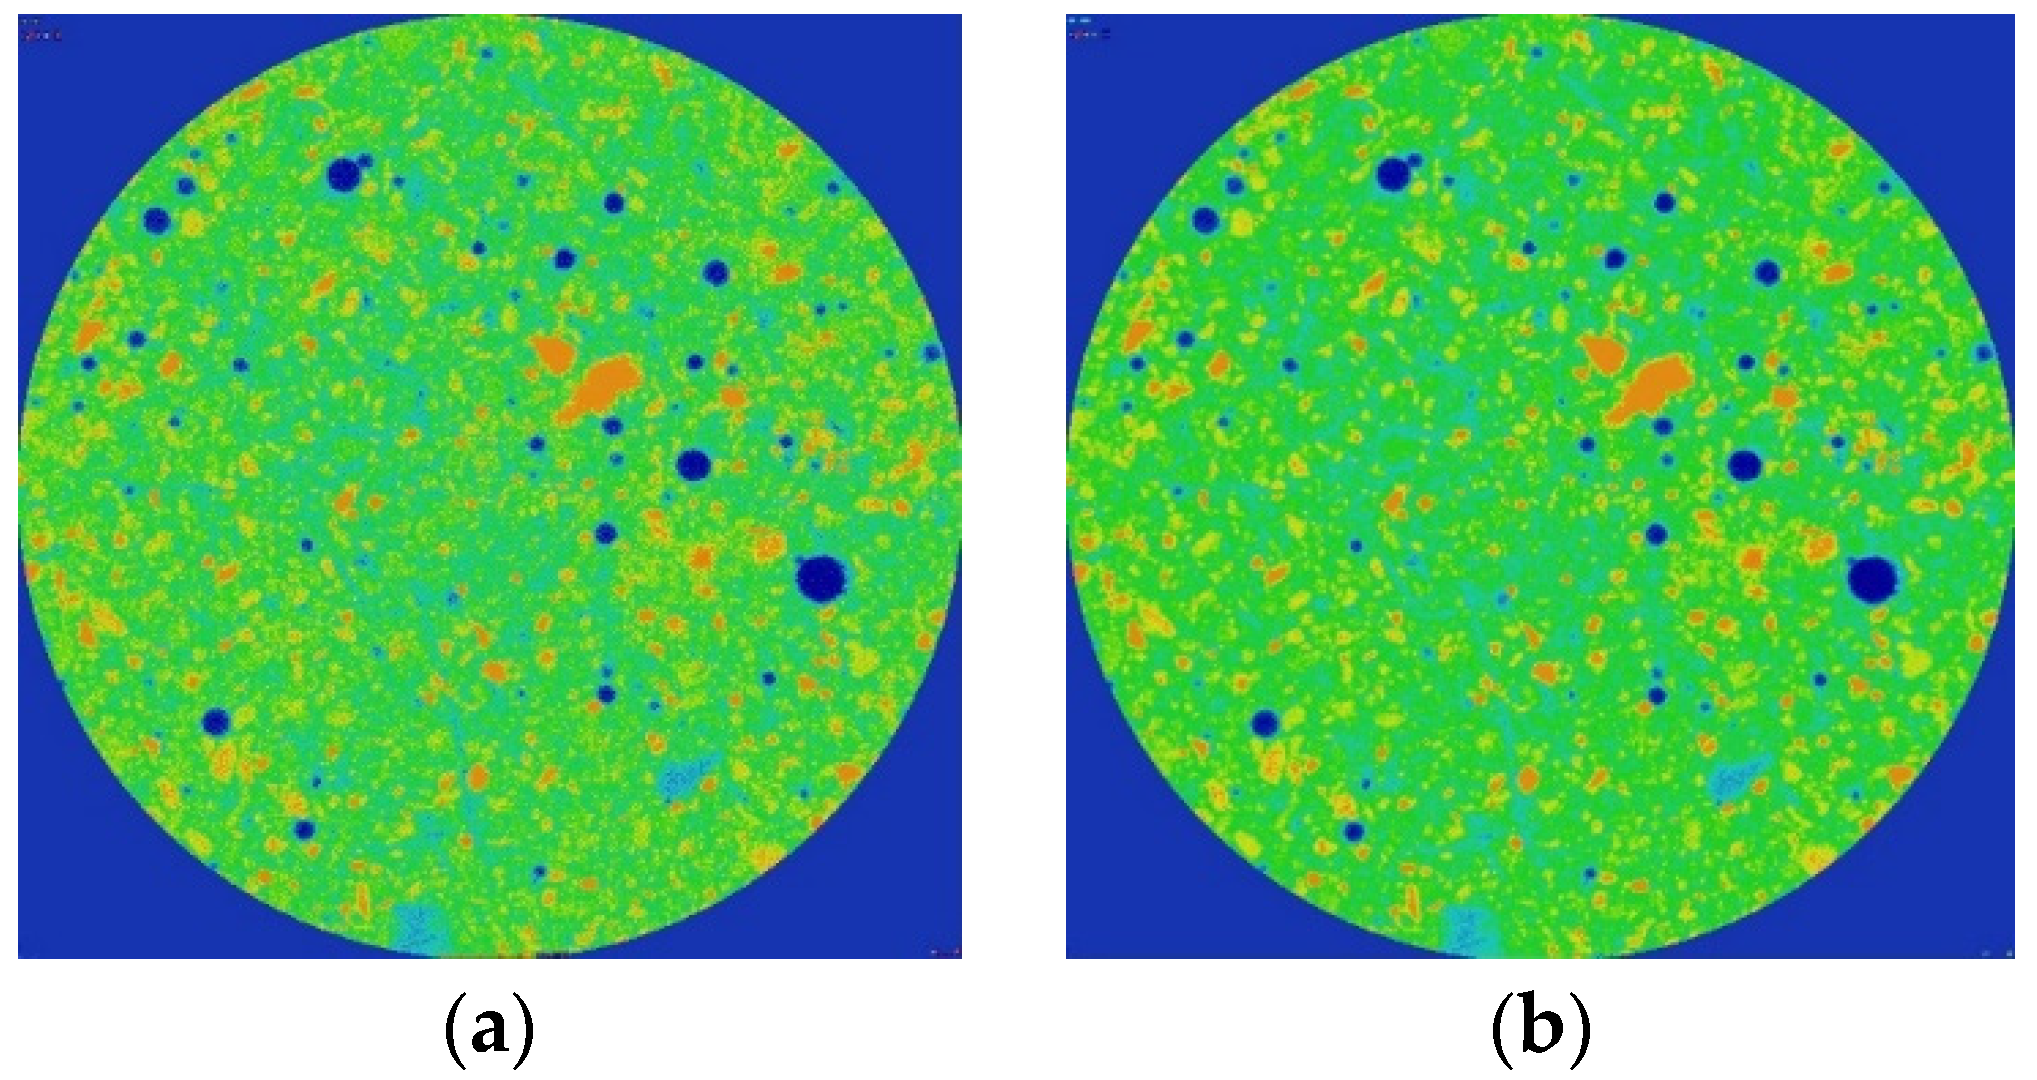
In order to quantitatively analyze the pore characteristics of BFRC, it is necessary to accurately segment the matrix and pores in the image of BFRC. Threshold segmentation is not only an important step in image processing, but also the premise of further image processing. Its main purpose is to extract and segment regions with different characteristics, which are often based on the color and gray values of pixels. Based on the interactive threshold segmentation algorithm described above, the slice Figure 7 after threshold segmentation is obtained.
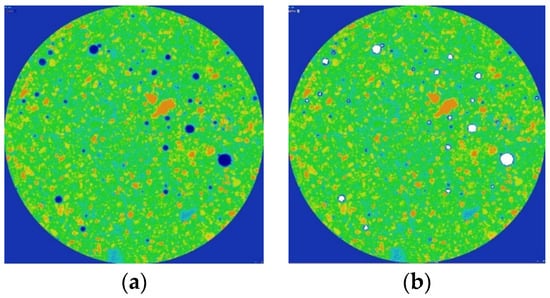
Figure 7.
Comparison of slice images before and after threshold segmentation. (a) Slice image before threshold segmentation processing and (b) slice image after threshold segmentation processing.
3. Results
3.1. Unconfined Compression Test
Each group of test blocks was cured under standard conditions for 28 d, and the size of the compression specimen was 100 mm × 100 mm × 100 mm. After taking them out, the compression strength was measured by using the electro-hydraulic universal testing machine WES-1000b according to the Standard for Test Methods of Mechanical Properties of Ordinary Concrete (GB/T50081-2002) [24].
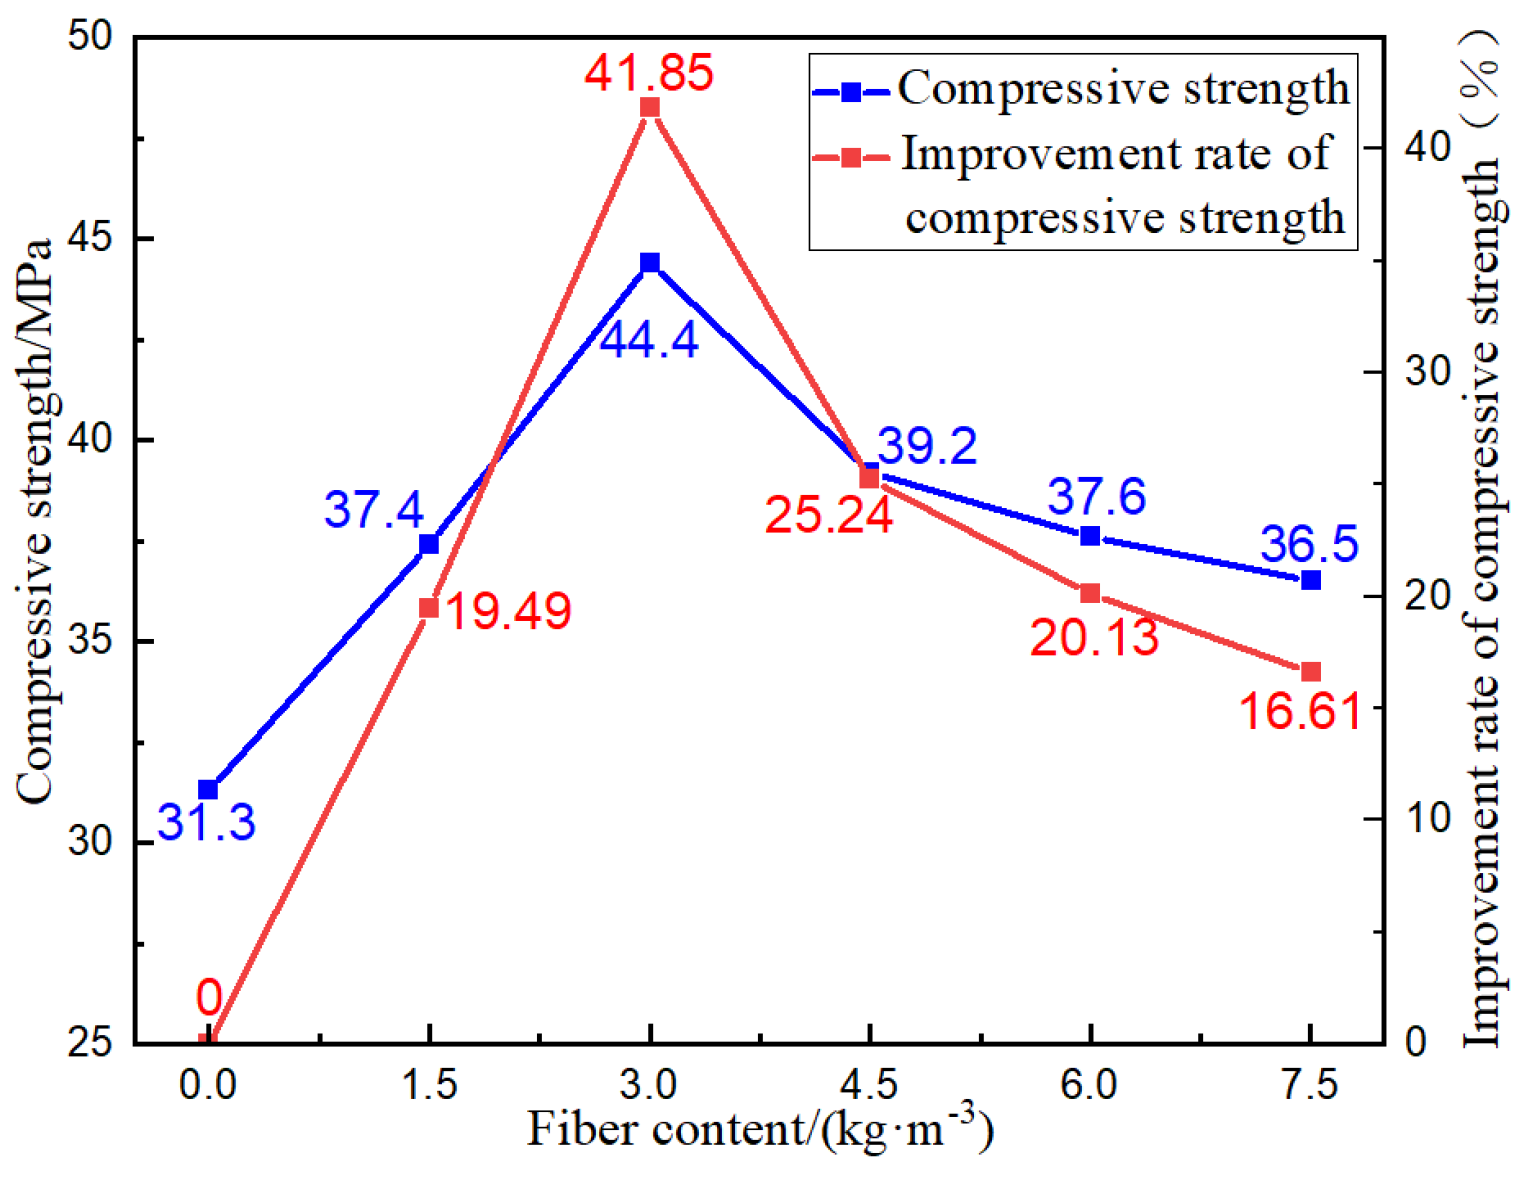
Through the compression test, the compression strength curves of six fiber dosages were obtained, which were in the shape of a parabola [25,26], with the opening facing down, as shown in Figure 8. When the fiber dosage was 3 kg/m3, the peak compression strength was 44.4 MPa, which is much higher than that of plain concrete, and the increased rate of compression strength was 41.85%. This shows that the fiber plays a bridging role with the concrete matrix, enhances the bonding force between the matrix, and greatly improves the mechanical properties. With the increase in fiber dosage, the compression strength decreased to varying degrees. Excessive addition will weaken the gain effect of fiber, but the decline curve is gentle, and when the fiber dosage was 7.5 kg/m3, the compression strength was still greater than that of ordinary concrete with zero fiber dosage.
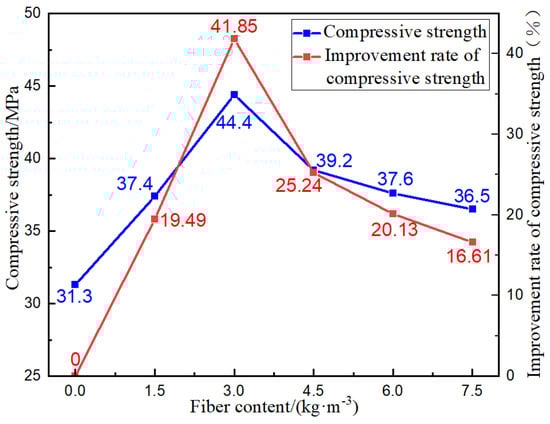
Figure 8.
Unconfined compression strength of BFRC.
3.2. Equivalent Pore Network Model
3.2.1. Determination of Characterization Unit
In order to solve the problems of different scales, the new concept of representative volume unit was brought into being [27,28,29]. Each object has a scale, which can effectively represent the macro-physical characteristics of concrete. This scale is called the representative elementary volume (REV). The physical properties of concrete obtained at less than the REV scale obviously fluctuate, while the physical properties of concrete obtained at higher than the REV scale tend to be stable. If the selected REV scale is large, it can contain more physical properties of concrete, but it has higher requirements for the computer. If the selected REV scale is small, it cannot represent the physical characteristics of concrete. Therefore, the selection of a REV with an appropriate size that cannot only represent the physical characteristics of concrete, but also meet the conditions of computer is important.
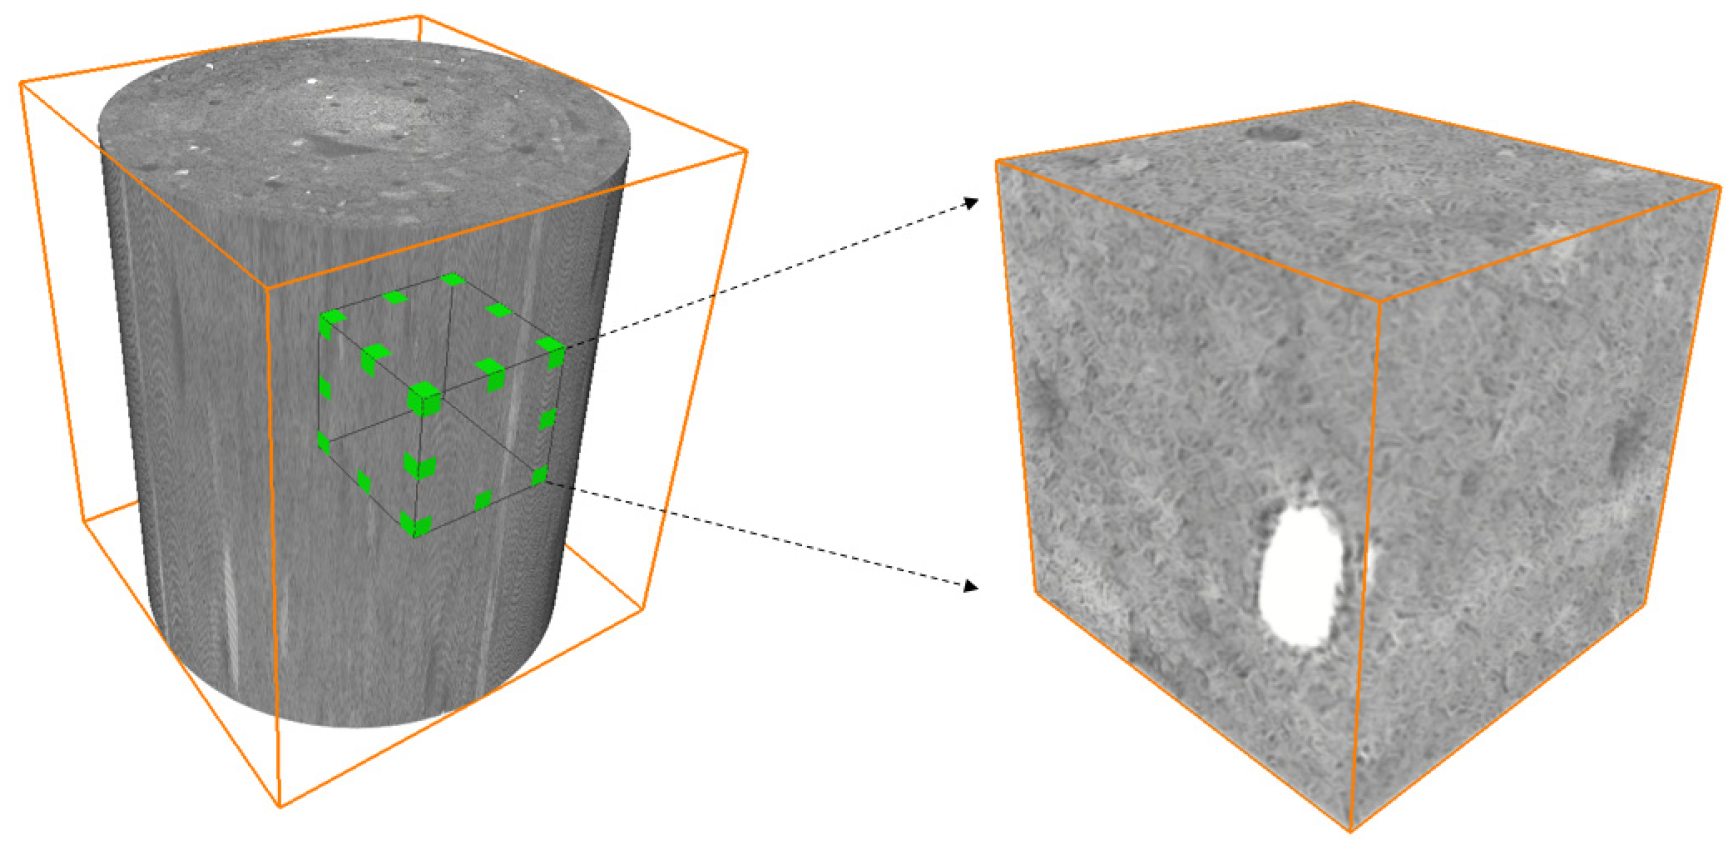
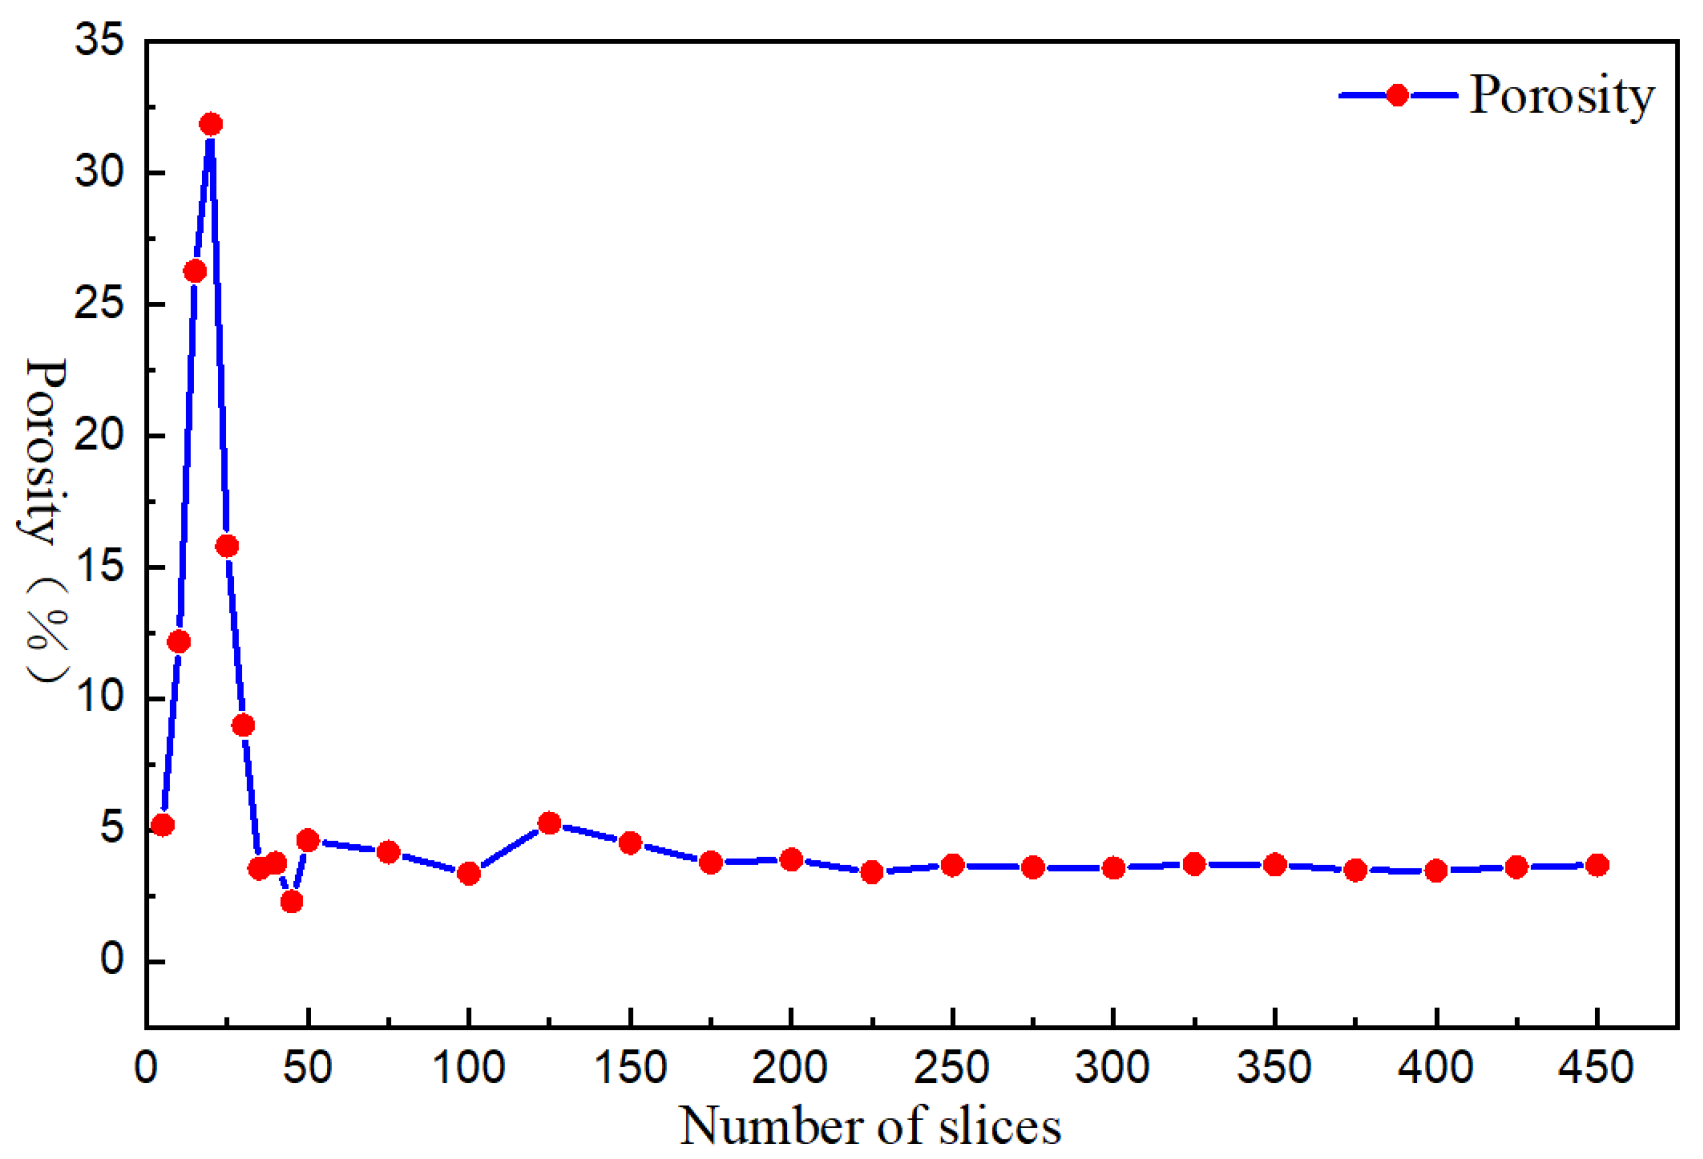
In this paper, the volume of all the samples used is larger than 50 mm × 50 mm × 50 mm, and the number of slices obtained by CT scanning is more than 1000. Due to the limitation of computer operation capacity and taking into account the representativeness of samples, it was necessary to select representative volume units for subsequent calculation. The most commonly used method for selecting representative volume units is to select different positions arbitrarily in the sample, with the selected position as the center, take a series of sub volumes with side length as shown in Figure 9, and calculate their porosity. The volume unit when the pore distribution curve reaches stability is the representative volume unit as shown in Figure 10.
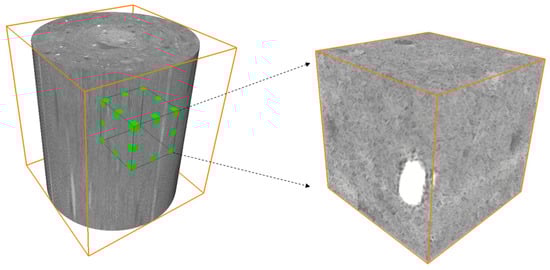
Figure 9.
Extraction of characterization unit.
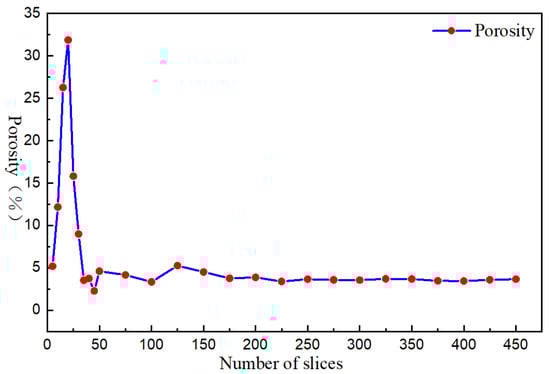
Figure 10.
Relationship curve between porosity and number of slices.
It can be seen from Figure 10 that when the number of slices was in the range of 0~200, the porosity results corresponding to different number of slices fluctuated widely, so it was impossible to select an accurate value as the porosity of the tested piece. When the number of slices exceeded 200, the porosity of the series of sub-volume units began to stabilize, so it could be used as a representative volume unit, and its relevant pore characteristics represented the overall basalt fiber concrete specimen. The subsequent analysis could, thus, be carried out on this scale.
3.2.2. Pore Network Model
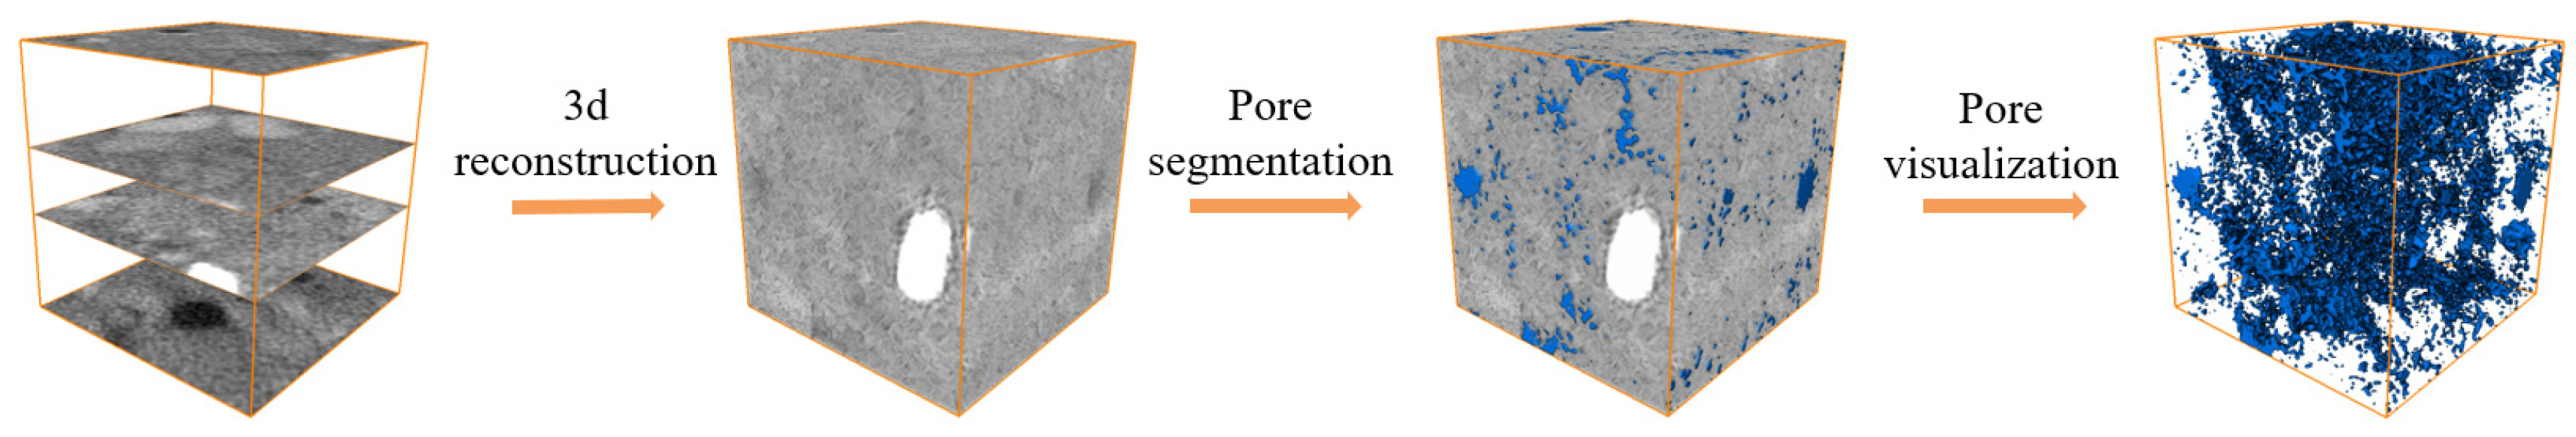
The spatial structure of pores in porous media is complex and difficult to describe with clear parameters. Therefore, it is very important to construct a three-dimensional real meso-model of porous media, which can be used to analyze the spatial distribution characteristics of pores from the meso-scale. Three-dimensional reconstruction technology refers to reproducing the original three-dimensional image of the detected object by performing segmentation processing, such as boundary recognition, on a series of two-dimensional images, and using visual processing to display the three-dimensional spatial structure distribution and morphological characteristics of BFRC [30,31,32]. In this paper, the 3D model was obtained after the 3D reconstruction of the series of binary images which were segmented according to the above threshold, allowing a series of operations, such as pore segmentation, to be carried out. Figure 11 shows the general process of reconstructing a three-dimensional model through two-dimensional CT scanning.

Figure 11.
Visual reconstruction process of 3D model.
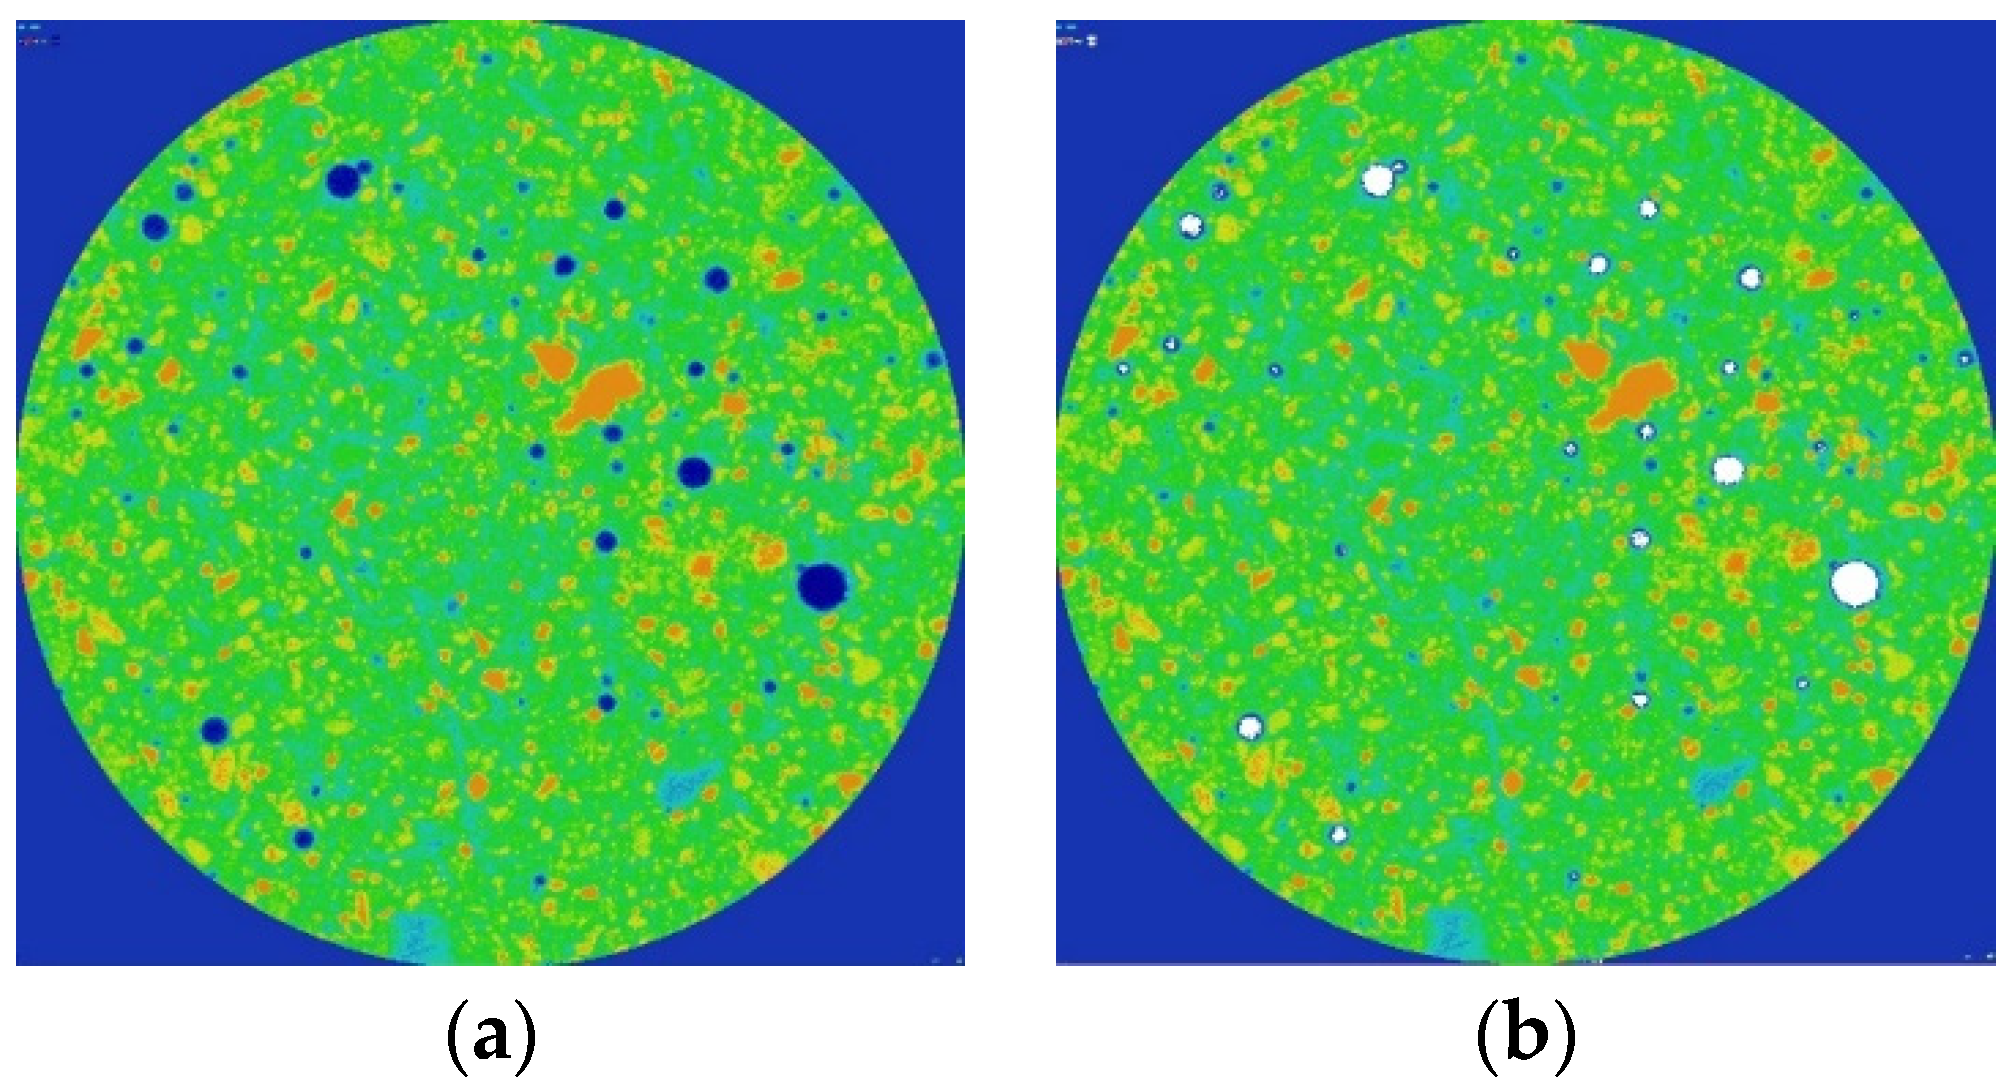
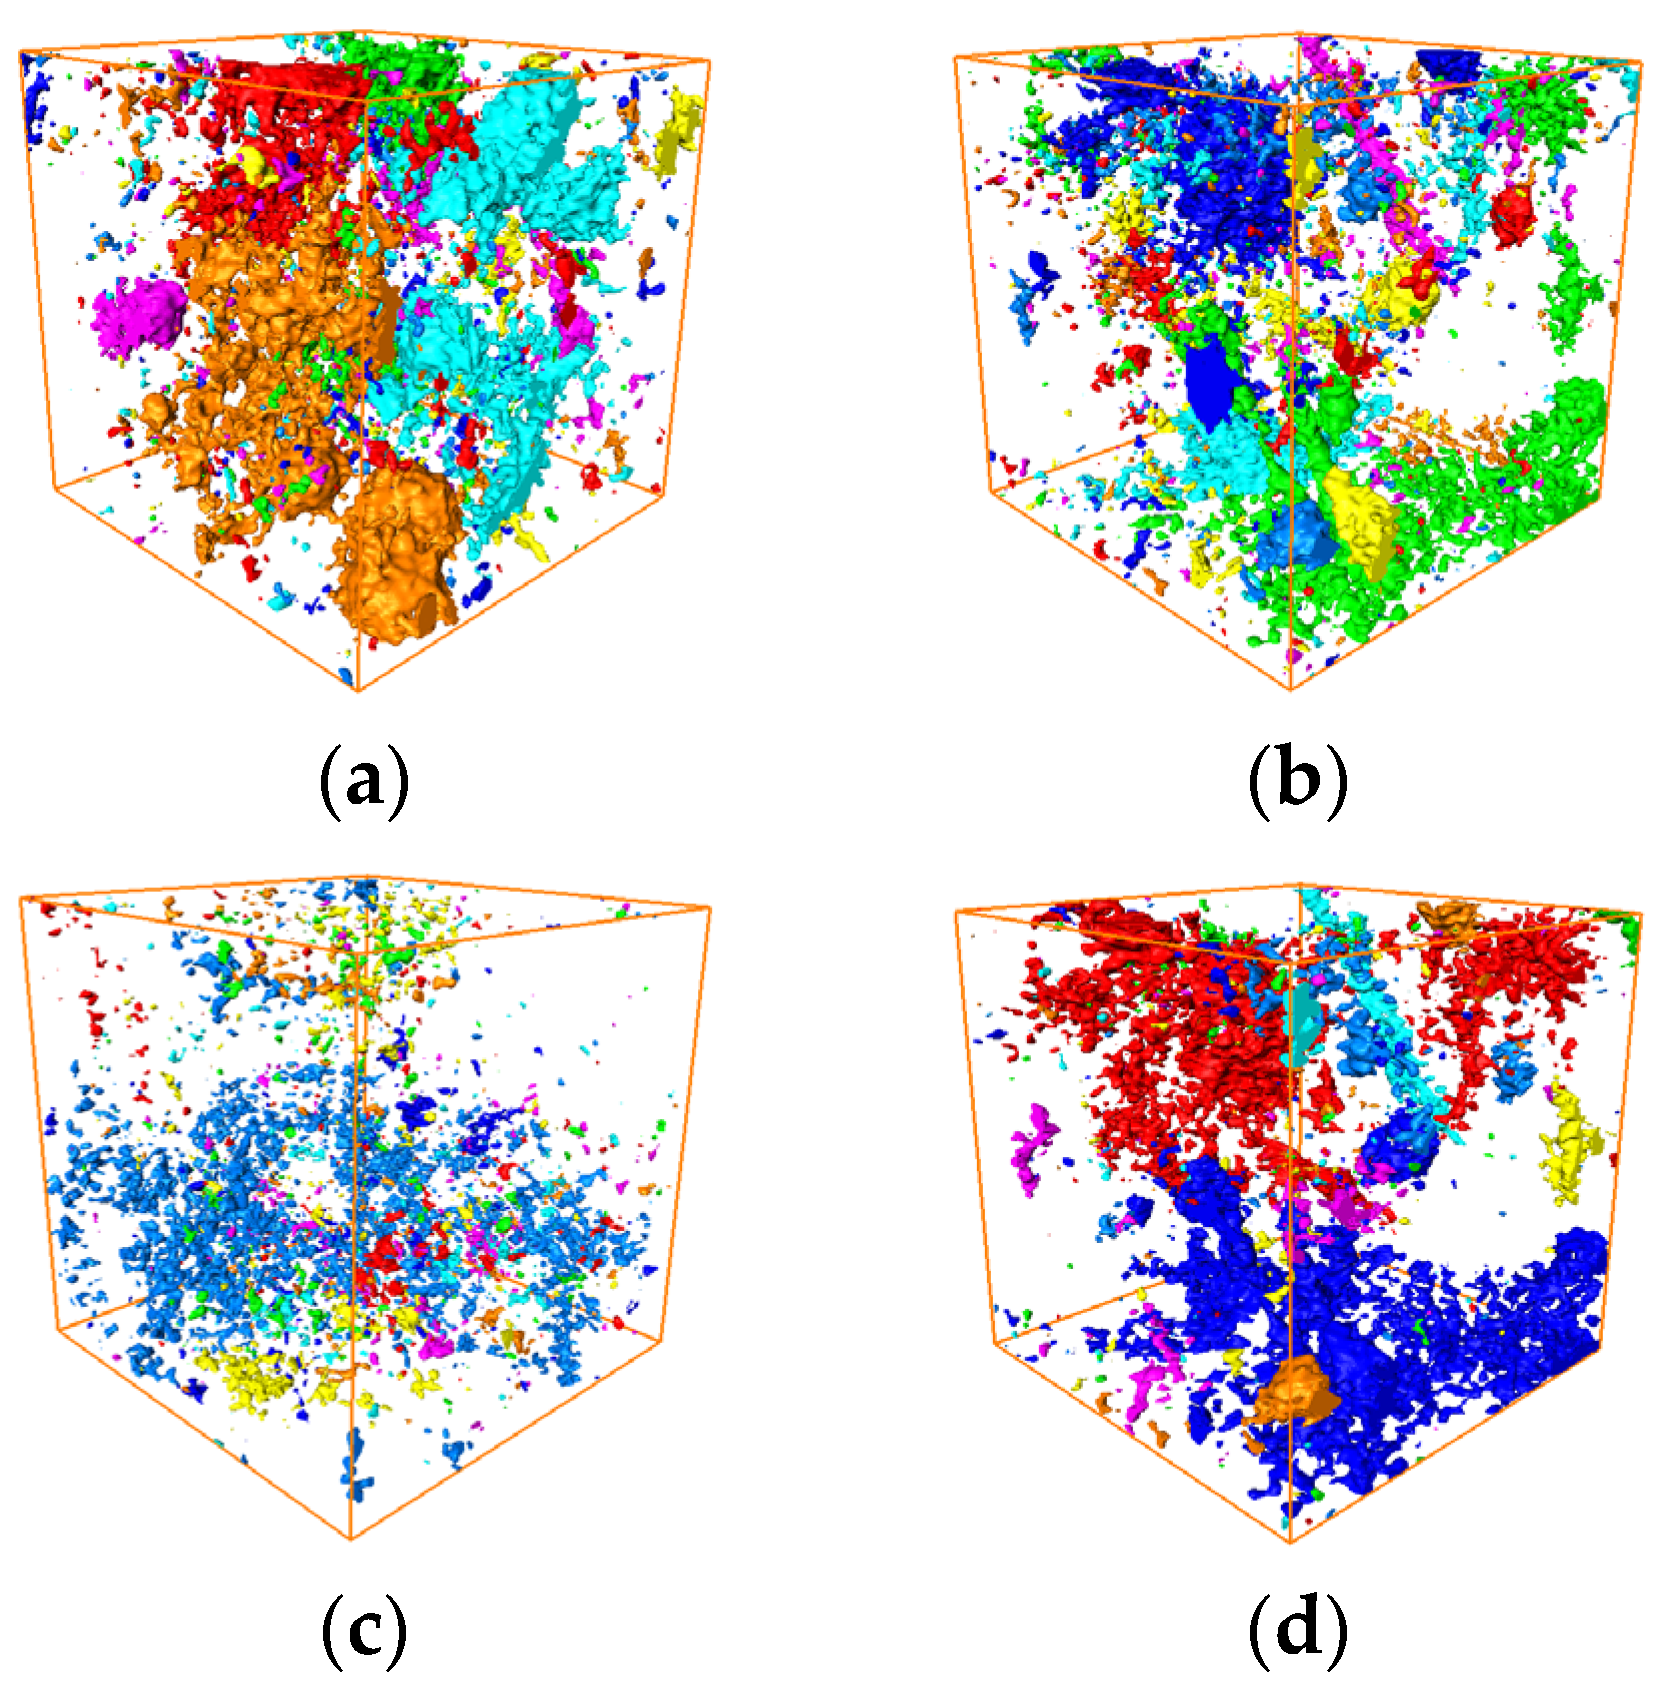
Using the command module in Avizo software [33,34], each pore of BFRC numerical model was labeled with a unique label, that is, each pore was marked. The marked pore model enabled the quantitative analysis of the spatial distribution of pores. The marked pore model is shown in Figure 12 It can be seen that each color represents pores of different scales, which intuitively shows the state of pores in the concrete matrix. At the same time, we can quantitatively analyze the pore space structure parameters, obtain statistical data, and draw the histogram of the pore diameter, pore area, and pore volume frequency distribution, as shown in Figure 13.
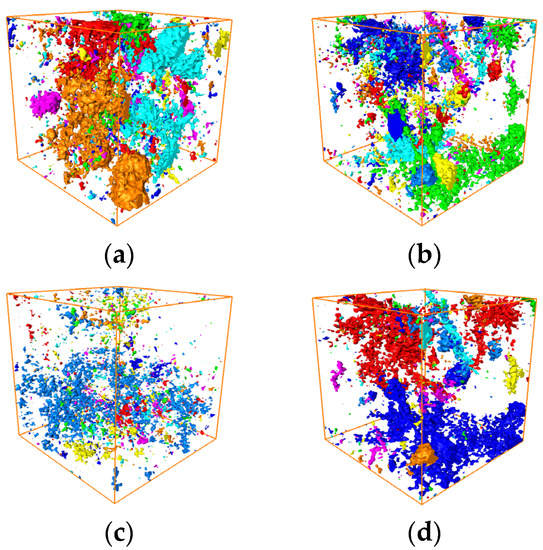
Figure 12.
Pore network model under different fiber dosages. (a) 0 kg/m3, (b) 1.5 kg/m3, (c) 3 kg/m3, and (d) 4.5 kg/m3.
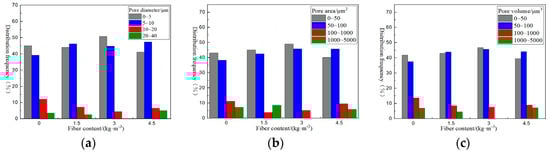
Figure 13.
Distribution statistics of pore parameters. (a) Pore diameter, (b) pore area, and (c) pore volume.
Combined with the pore network model and pore parameter frequency distribution histogram obtained under different fiber dosages, it can be obtained that after BF is added to the concrete concentration, although different fiber dosages reduced the macropore volume differently, compared with plain concrete, the concrete with BF reduced the macropores in the concrete matrix to varying degrees.
Taking the parameter distribution of the pore diameter as an example, the pore sizes of the four fiber dosages were relatively large at between 0~5 μm and 5~10 μm, accounting for about 90% of the total pores. When BF was added, the proportion of large volume pores was significantly reduced. When the fiber dosage was 0 kg/m3, 1.5 kg/m3, 3 kg/m3, and 4.5 kg/m3, the proportion of macropores (with diameter of 10~40 μm) was 15.71%, 9.76%, 4.32%, and 11.56%, respectively. When the fiber dosage was 3 kg/m3, the proportion of macropores was the least and there were no pores with a diameter between 20 and 40 μm, and the maximum pore diameters of the four groups of specimens were 1.85 mm, 1.50 mm, 0.94 mm, and 1.34 mm, respectively, indicating that this is the best dosage of fiber.
After adding the fiber, it was found that compared with the 0 kg/m3 concrete without a fiber dosage, that is, plain concrete, the large volume pores in the concrete after adding fiber account for less, and most of the pores have a small pore size. This shows that the addition of fiber will destroy some large pores and form pores with smaller pores, or directly fill the pores to make them disappear. The fiber plays a role in refining and filling these pores. When the pore volume is too large, the refining effect of the fiber is gradually weakened due to the hydrophobic nature of the fiber. When the number of fibers increases, the number of pores between the fiber and the cement slurry will increase, partly because the addition of fibers will form new pores, and partly because the pore size will become larger after these fibers are connected with some original small pores, and form more massive pores.
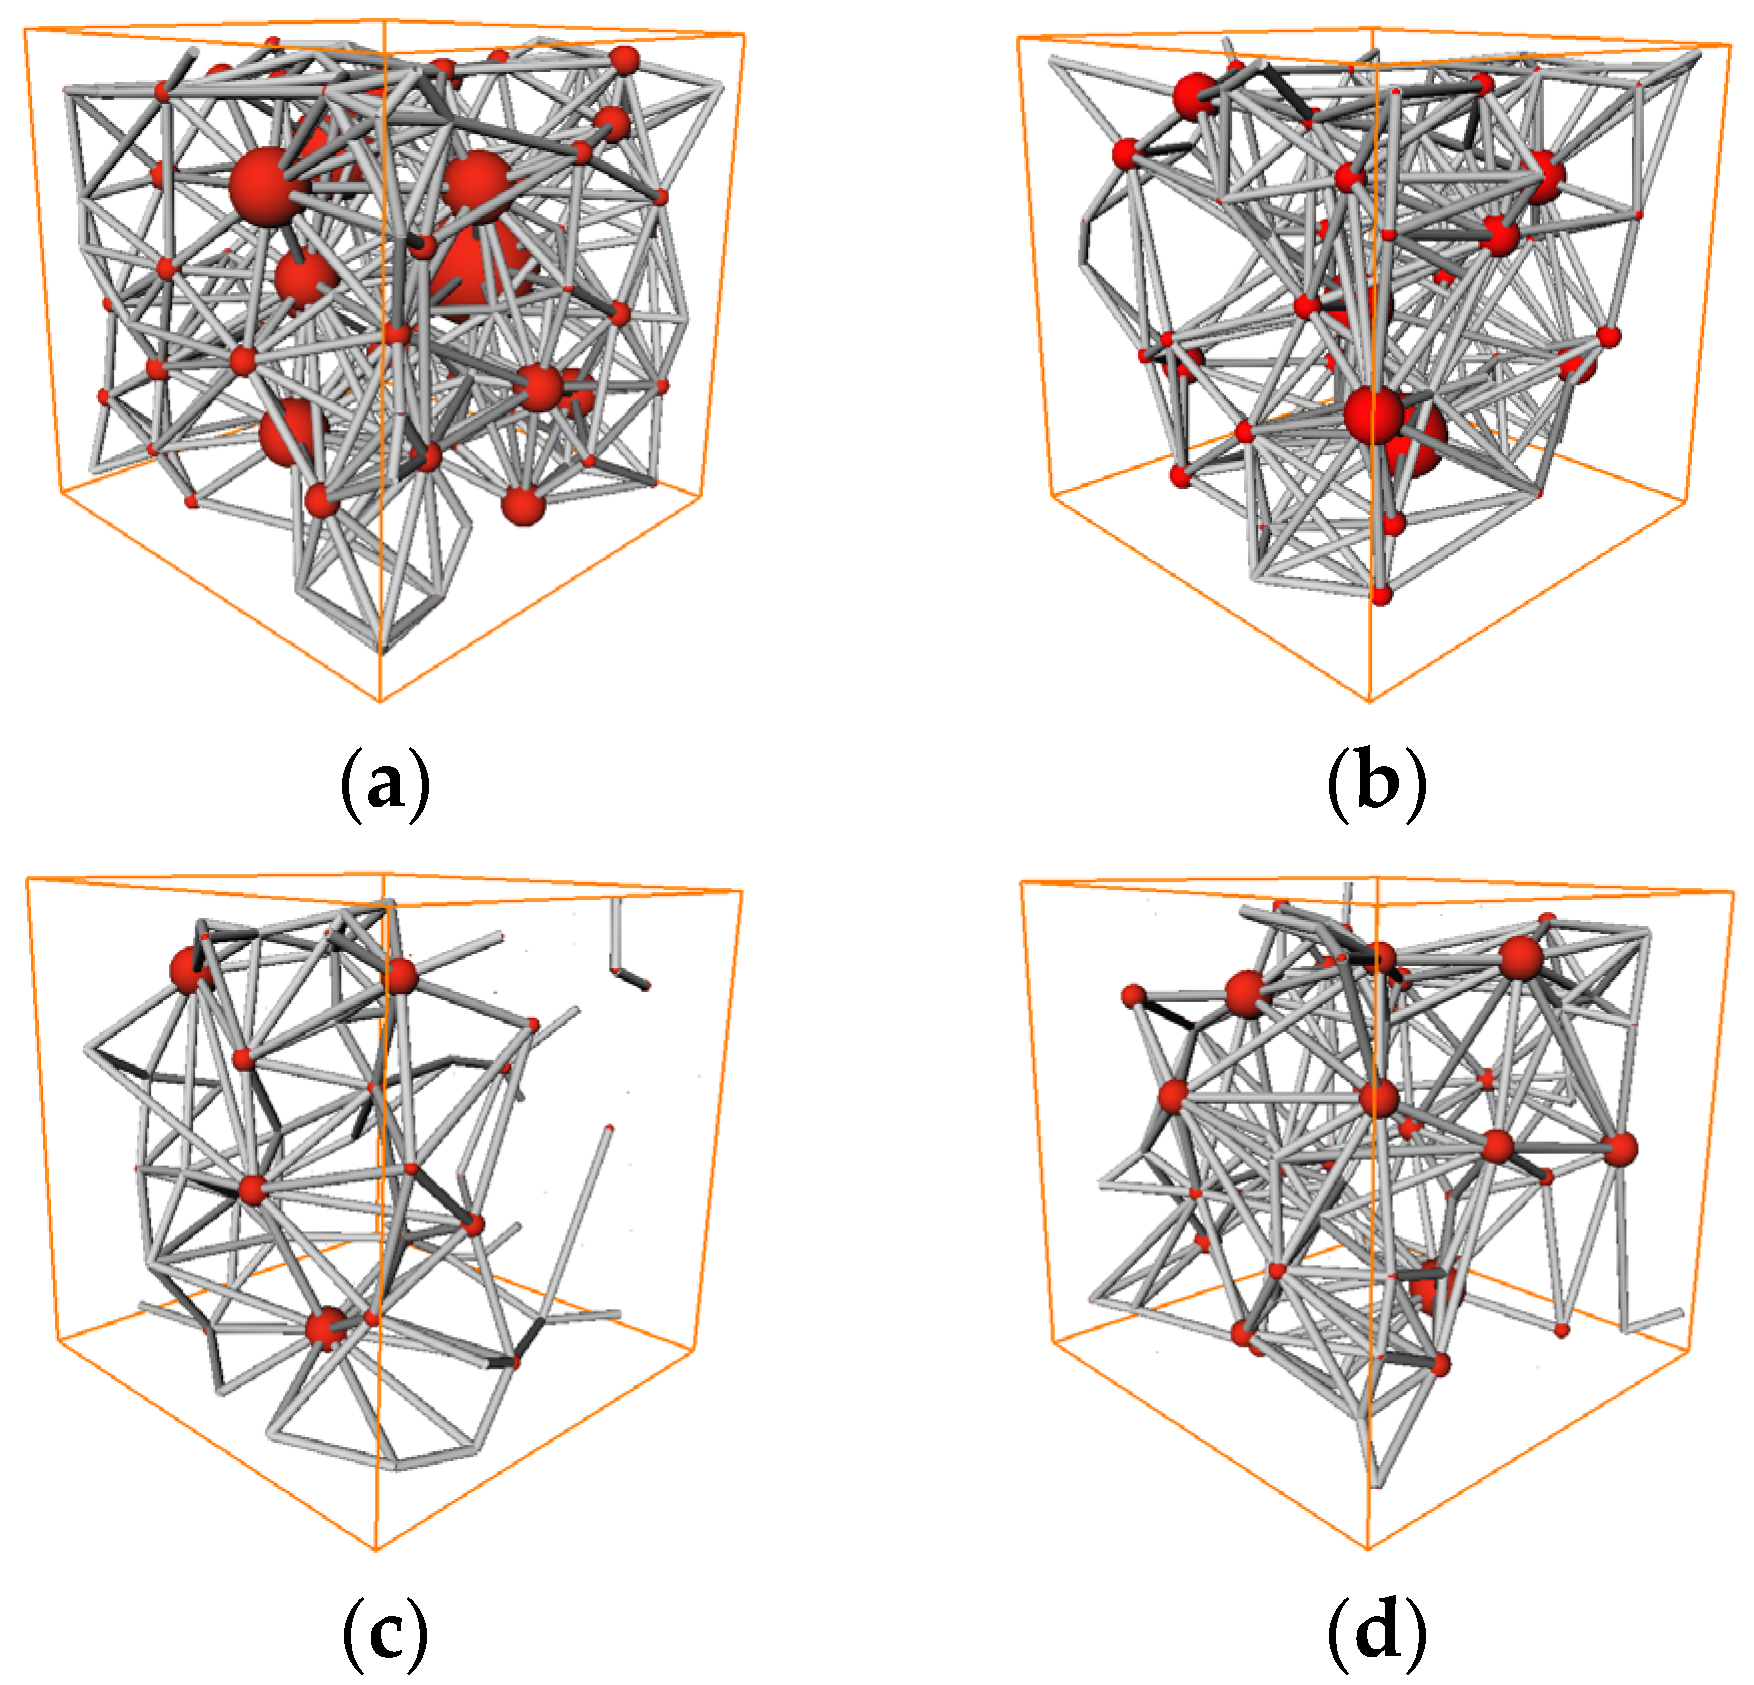
3.2.3. Ball-and-Stick Network Model
In the bat model generated by Avizo software, the ball represents the pores and the stick represents the channel connected between the pores, as shown in Figure 14. This model can more intuitively show the state and quantity of pores [35,36]. According to the software, as shown in Table 3, the porosity of the four specimens is 18.59%, 14.36%, 11.28%, and 15.29%, respectively, indicating that after adding fiber, it will fill some pores of the specimens and drive away bubbles, so as to make the microstructure of concrete more dense and optimize its internal pore structure. With the increase in fiber dosage, the number and volume of pores in the matrix will increase, and then the porosity will increase, which will make the internal structure of concrete loose and broken, reduce the compressive strength, and be unfavorable to the engineering performance.
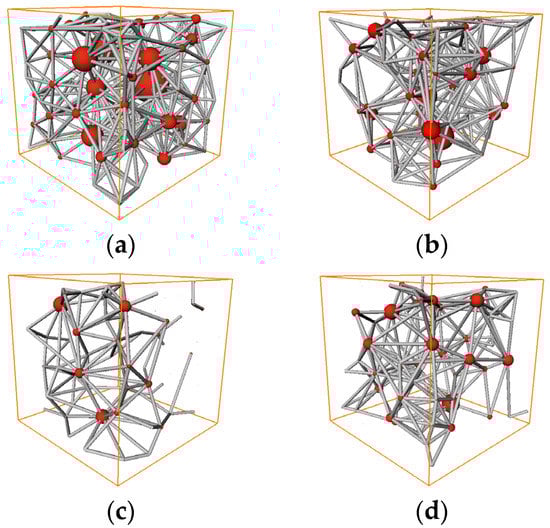
Figure 14.
Ball-and-stick network model of each specimen. (a) 0 kg/m3, (b) 1.5 kg/m3, (c) 3 kg/m3, and (d) 4.5 kg/m3.
Table 3.
Comparison of ball-and-stick network model data.
3.3. Fiber Distribution
3.3.1. Search Cone Algorithm
The tracking process of the search cone model for automatic fiber tracking is as follows [37,38]. Firstly, the local correlation number was arranged in descending order, and the voxel with the highest local correlation coefficient (mark as ) was selected as the starting point of tracking. Secondly, the forward or backward tracking was determined according to the whereabouts at . is any voxel in the search cone, which is called candidate voxel, l is the length of the search cone, and is the opening angle of the search cone. Finally, we calculated the similarity function , which was used to evaluate the possibility that two adjacent voxels belonged to the same fiber, that is, the possibility that was also on the fiber when was already on the fiber. The calculation formula is:
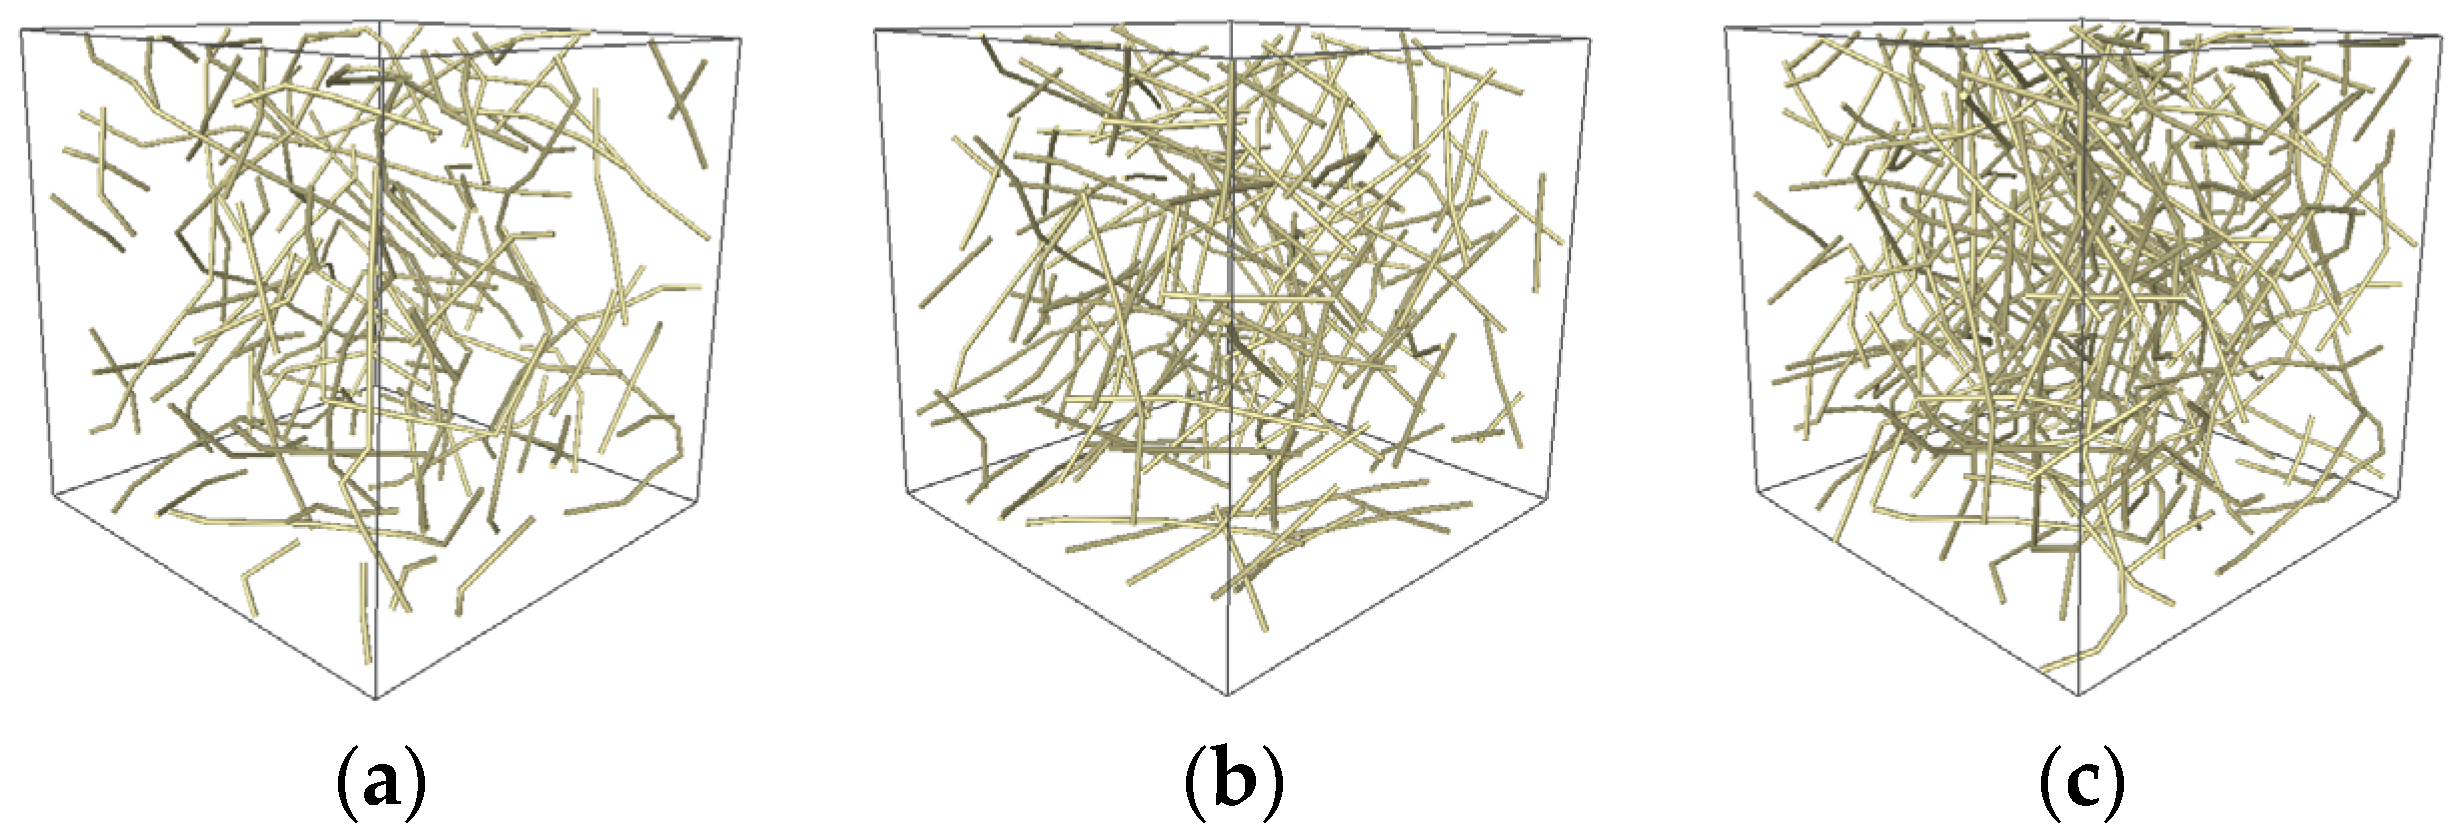
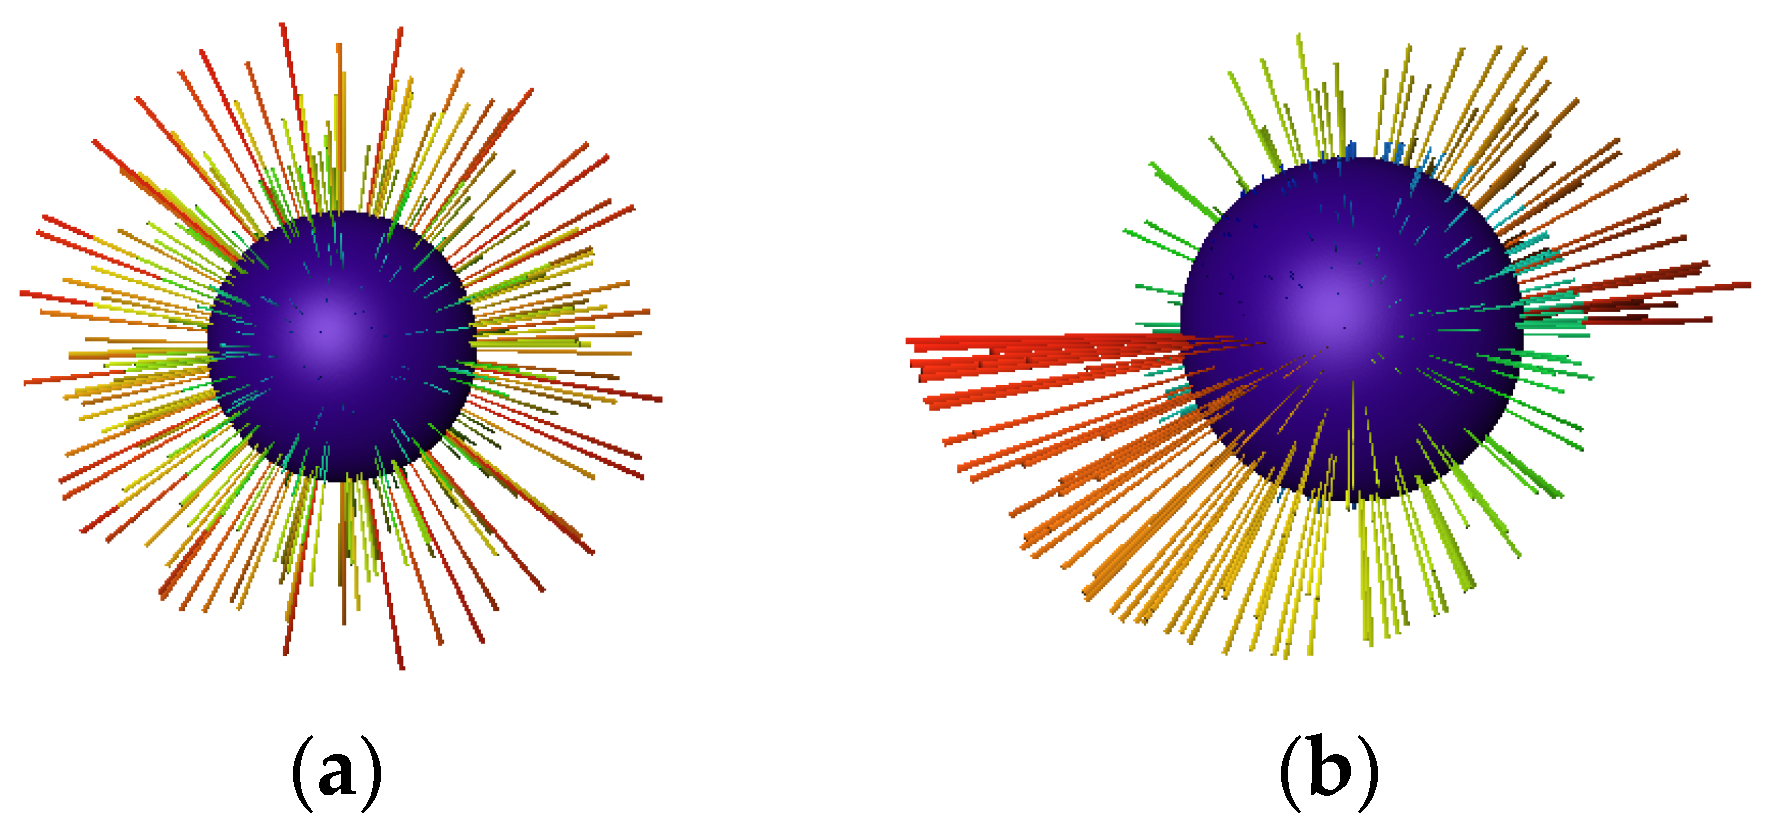
where, represents the local correlation number at , which is a non-negative value. represents the degree of circularity, which represents the smoothness of the fiber. represents linearity, which represents the straightness of the fiber. represents the distance, which is mainly used to restrict the tracking process of fibers. represents the included angle between and the connecting line between and . represents the included angle of model orientation at and . , , and are constants [39]. Based on this algorithm, the position and coordinates of the fiber in three-dimensional space can be obtained, as shown in Figure 15.

Figure 15.
Fiber distribution model. (a) 1.5 kg/m3, (b) 3 kg/m3, and (c) 4.5 kg/m3.
3.3.2. Fiber Orientation
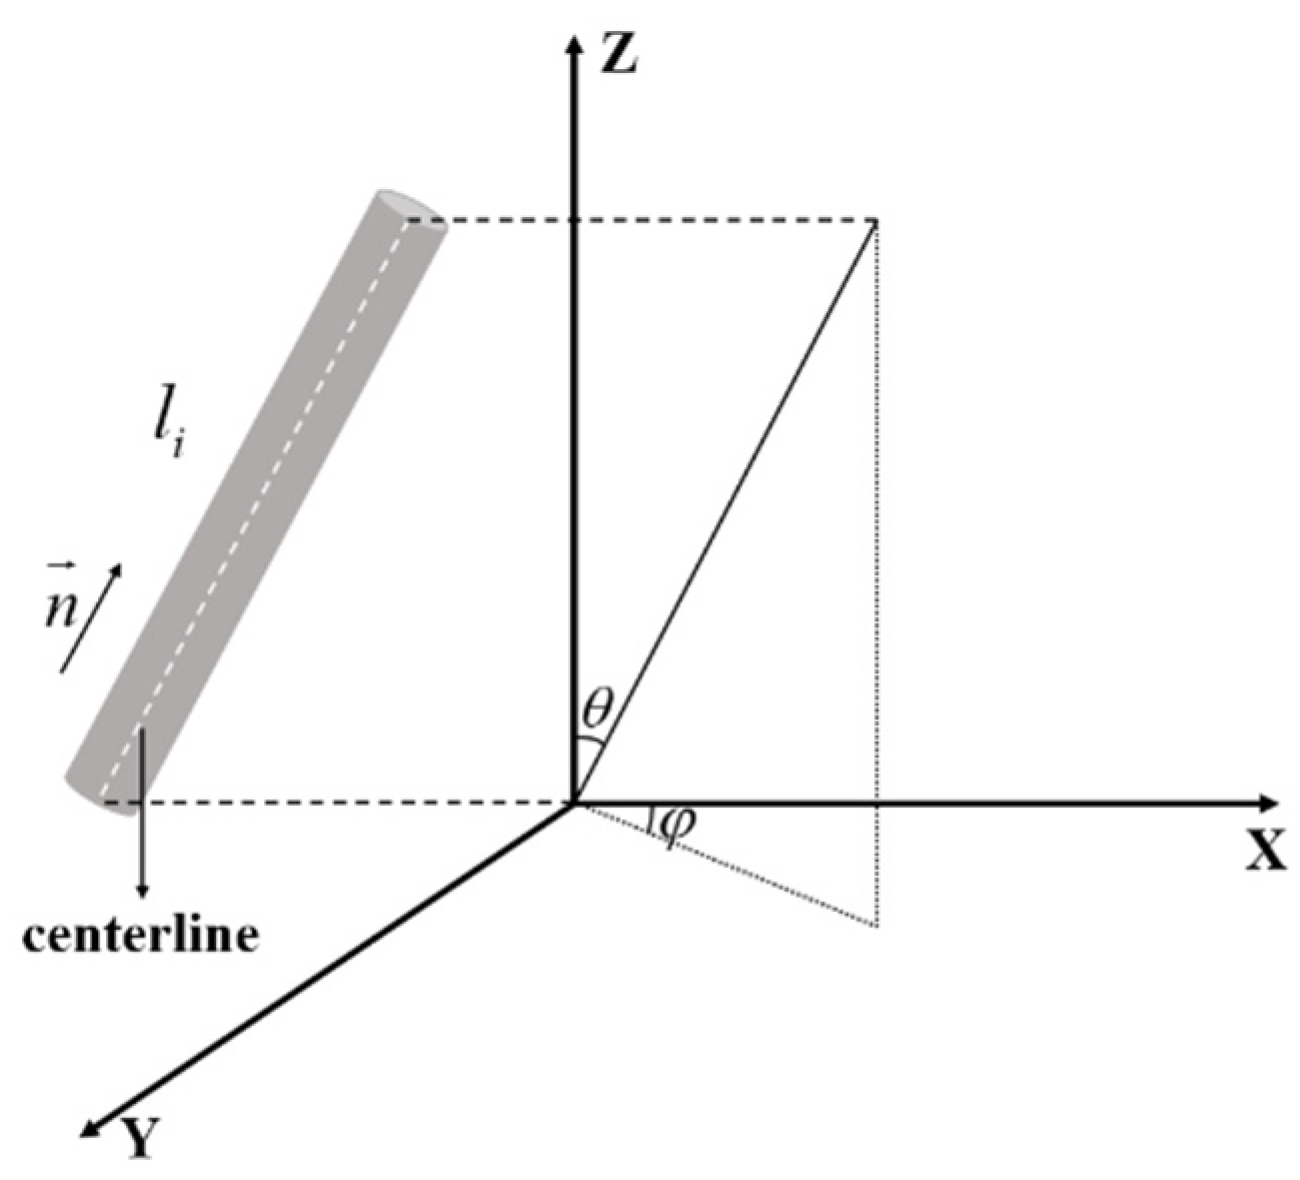
The fiber orientation is represented by the orientation angle. As shown in Figure 16, the Cartesian three-dimensional coordinate system XYZ was established, and the general definition of fiber orientation angle in three-dimensional space was given [40,41]. Ideally, assuming that there is no bending of the fiber, the fiber is regarded as a straight rod, and the fiber section is a regular circle. The included angle between the fiber centerline (central axis) and the Z-axis is defined as the orientation angle , and the included angle between the projection of the fiber centerline (central axis) in the XOY plane and the X-axis is defined as the orientation angle . According to the definition, the orientation of any fiber in the space can be determined by , where and is a pair of orientation angles of the fiber [42,43,44].
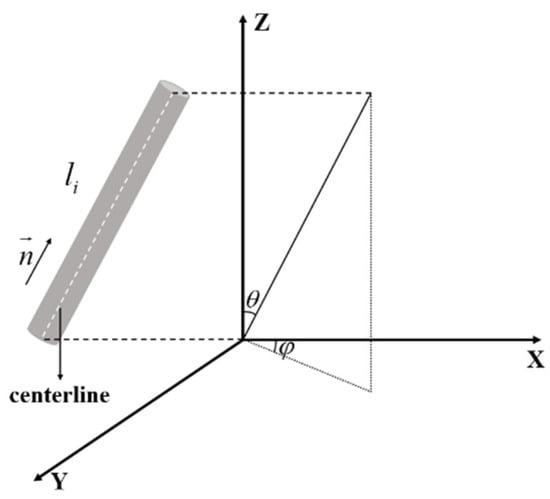
Figure 16.
Schematic diagram of fiber angle.
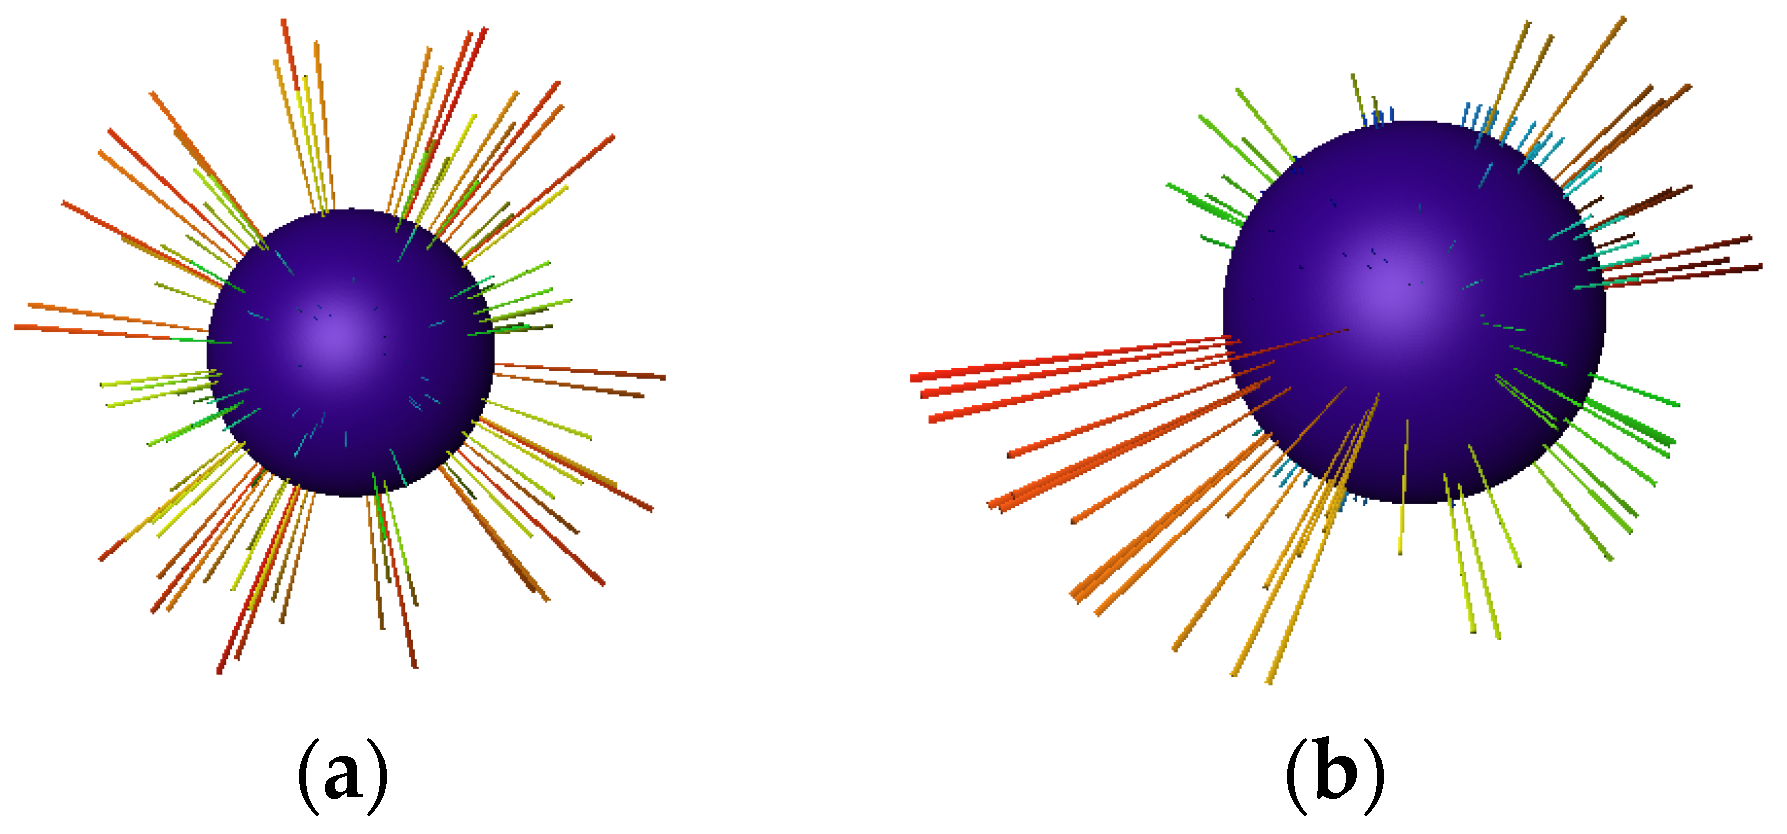
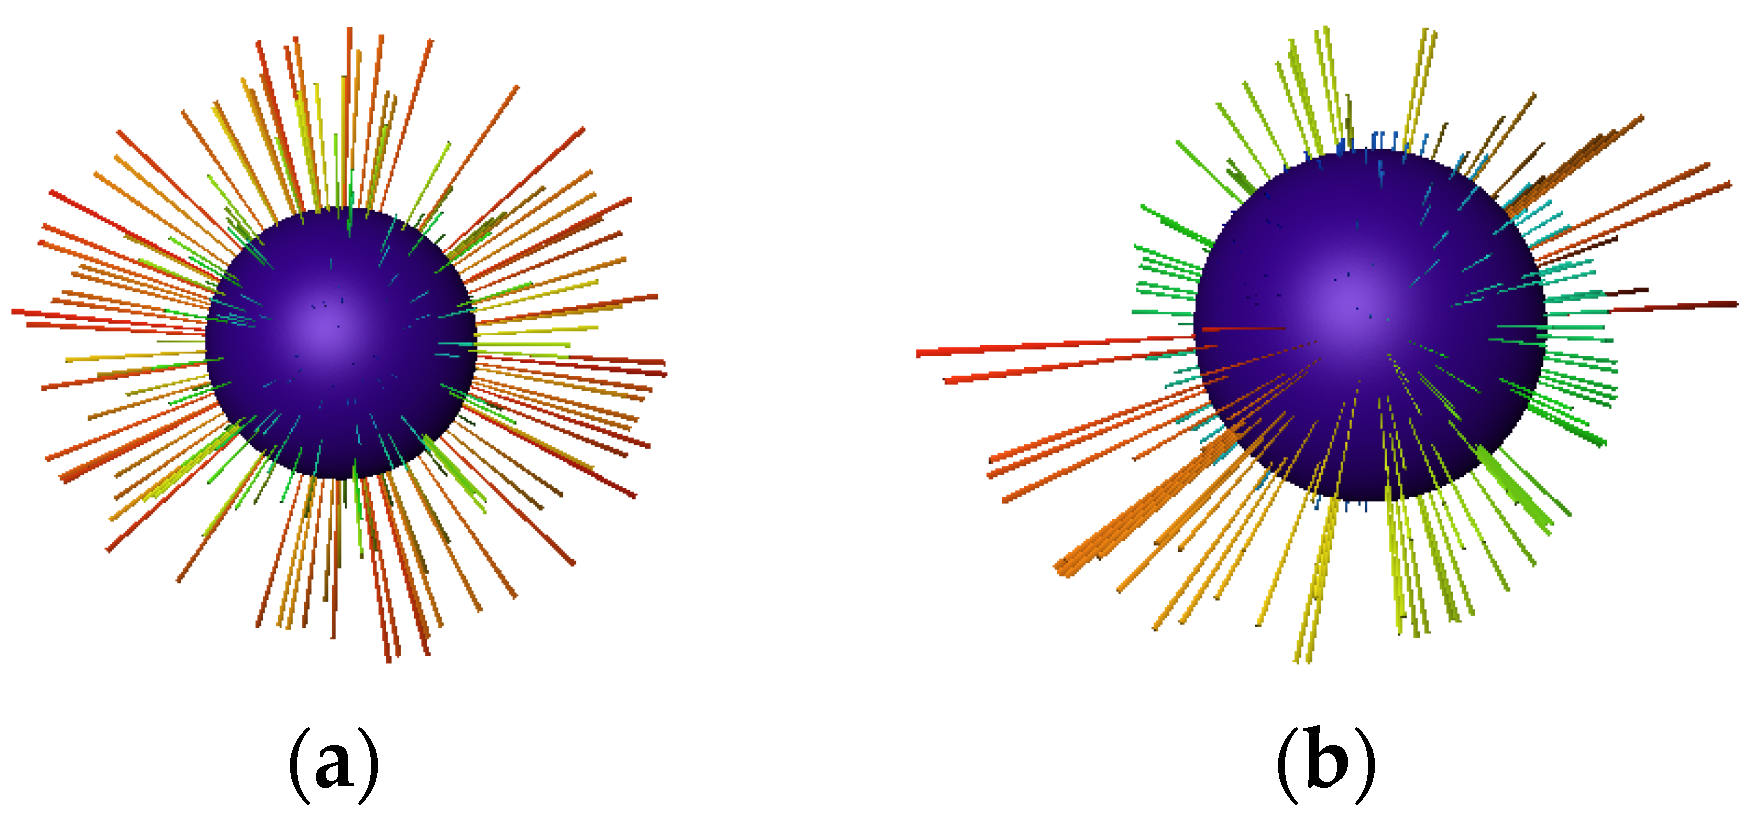
In the fiber distribution model in Figure 15, it can be observed that most of the fibers are mainly distributed inside the specimen in a horizontal inclined state, and the number of fibers distributed vertically is small. Using the software, the θ and φ spherical coordinates’ distribution map of the fiber in the model can be obtained, which is shown in Figure 17, Figure 18 and Figure 19.
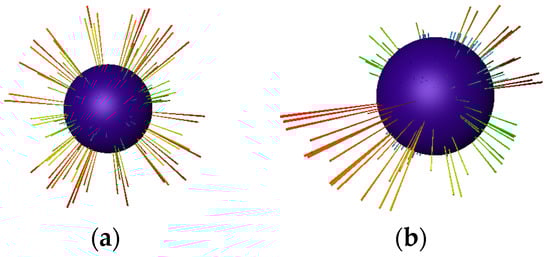
Figure 17.
Fiber orientation when the fiber dosage is 1.5 kg/m3. (a) θ spherical coordinates, and (b) φ spherical coordinates.

Figure 18.
Fiber orientation when the fiber dosage is 3 kg/m3. (a) θ spherical coordinates, and (b) φ spherical coordinates.
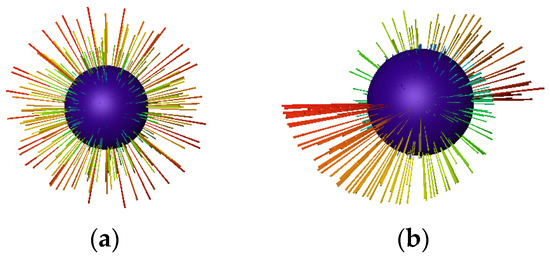
Figure 19.
Fiber orientation when the fiber dosage is 4.5 kg/m3. (a) θ spherical coordinates, (b) φ spherical coordinates.
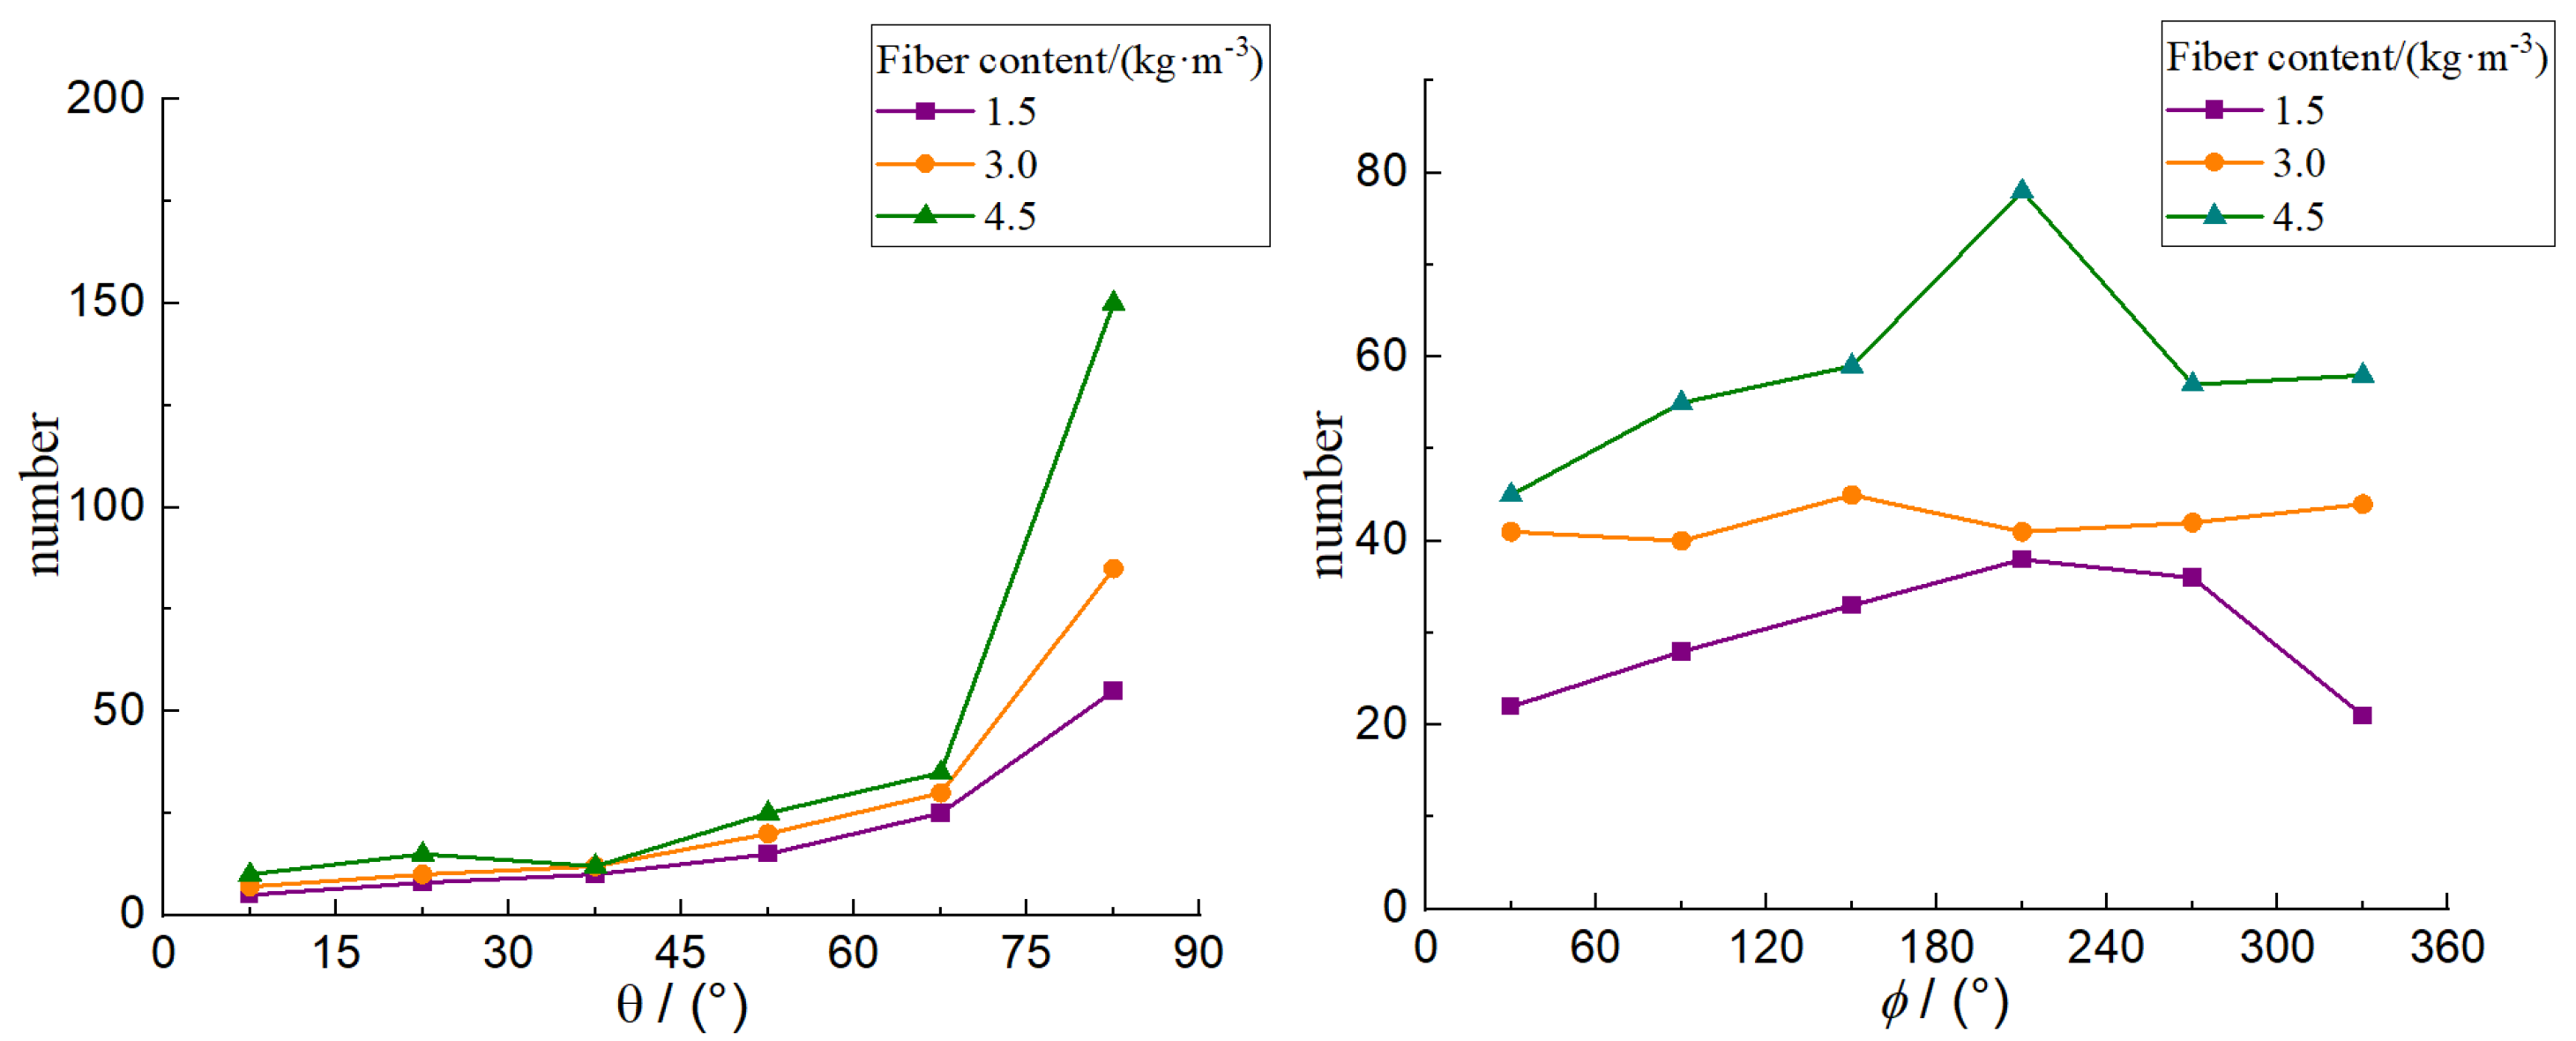
The statistics are as follows in Figure 20. θ angular distribution: when the fiber dosage was 4.5 kg/m3, the angle of most fibers was close to 90°, parallel to the Z-axis, which was invalid fiber and made no contribution to the gain effect of concrete. φ angular distribution: when the fiber dosage was 3.0 kg/m3, the φ angular distribution was relatively uniform. The BF dosage was 4.5 kg/m3, compared with 3.0 kg/m3, and the φ angular distribution changed the most in the range of 180°~240°, indicating that the fibers with excessive BF mainly appeared in the approximate horizontal direction and parallel to the X-axis.
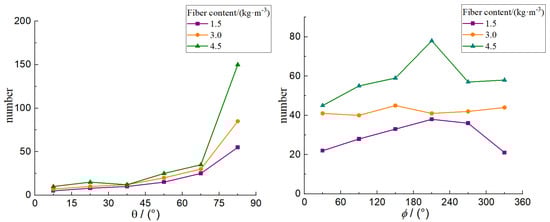
Figure 20.
Angular distribution of different fiber dosages.
The results show that the uniformly distributed fibers will form a dense network structure, which can improve the stress distribution of the internal structure and improve the mechanical properties of the interface between the aggregate and the mortar matrix. However, the excessive fiber shows ineffectiveness, which will be distributed parallel to the crack, and the interface between the fiber and the concrete matrix will bond and slip, reducing the gain effect on the concrete.
4. Conclusions
In order to better understand the reinforcement mechanism of BF on concrete matrix, four kinds of concrete with different fiber dosage were selected in this paper. From the macroscopic perspective, the unconfined compression test was used to obtain the peak stress corresponding to each dosage. From the microscopic perspective, the specimen slices obtained by CT scanning were imported into Avizo software for three-dimensional reconstruction. The pore network model and ball-and-stick network model were established to study the response relationship between pore parameters, fiber distribution angle, and BFRC mechanical behavior, and the gain mechanism of BF on concrete was analyzed.
(1) The results show that through the unconfined compression test, when the dosage of BF was 3 kg/m3, the maximum peak stress of BFRC was 44.4 MPa, which is the best dosage. When the fiber dosage was 4.5 kg/m3, the peak stress was 36.5 MPa, which is still higher than the peak stress of ordinary concrete at 31.3 MPa. Therefore, from the macro perspective, adding fiber into cement-based materials can improve their mechanical properties.
(2) By creating pore network models and quantitatively analyzing the pores in concrete, it can be concluded that after adding BF, the macropores in concrete were significantly reduced, and when the fiber dosage was 3 kg/m3, the proportion of macropore pores was the smallest, and the minimum porosity was 11.28%. After adding excessive fiber, it was found that the proportion of large pores in concrete increased, and the porosity also increased. The visualization of fiber in concrete was realized by Avizo software. After the quantitative analysis of fiber orientation, it was concluded that when the fiber dosage was 3 kg/m3, the angular distribution of φ was relatively uniform, and the uniformly distributed fibers formed a dense network structure, which could improve the stress distribution of the internal structure. The excessive fibers were mostly distributed in the horizontal direction, which makes no contribution to improving the performance of concrete.
(3) Together, the macroscopic mechanical properties and microscopic three-dimensional reconstruction results show that after adding an appropriate amount of fiber, it will fill some pores of the specimen, drive away bubbles, optimize its internal pore structure, and make the microstructure of concrete denser. Additionally, the evenly distributed fibers will form a dense network structure, so as to improve the stress distribution of the internal structure and improve the mechanical properties of concrete. After excessive addition, a large number of fibers will accumulate, increase the pore diameter and porosity of concrete, and then lead to the decline of its mechanical properties.
Author Contributions
Conceptualization, Y.W., X.Y. and H.J.; methodology, Y.Y. and X.Y.; software, X.C. (Xinming Chen) and L.Y.; validation, L.Y., X.C. (Xinming Chen) and J.Y.; formal analysis, X.C. (Xi Chen); investigation, L.Y.; data curation, J.Y.; writing—review and editing, H.J. and X.C. (Xi Chen) All authors have read and agreed to the published version of the manuscript.
Funding
This research was funded by the Key Science and the Technology Program of Henan Province (212102310107, 212102310602, 222102220019), the Henan Polytechnic University Science Fund for Distinguished Young Scholars (J2020-3), the Training Plan of Young Key Teachers in Henan Province (2021GGJS052), and the Shandong Provincial Major Science and Technology Innovation Project, China (2019SDZY05).
Institutional Review Board Statement
Not applicable.
Informed Consent Statement
Not applicable.
Data Availability Statement
Not applicable.
Conflicts of Interest
The authors declare no conflict of interest.
References
- Li, F.Y.; Li, L.Y.; Dang, Y.; Wu, P.F. Study of the Effect of Fibre Orientation on Artificially Directed Steel Fibre-Reinforced Concrete. Adv. Mater. Sci. Eng. 2018, 2018, 8657083. [Google Scholar] [CrossRef] [Green Version]
- Yan, L.B.; Chouw, N. A comparative study of steel reinforced concrete and flax fibre reinforced polymer tube confined coconut fibre reinforced concrete beams. J. Reinf. Plast. Compos. 2013, 32, 1155–1164. [Google Scholar] [CrossRef]
- Yuan, H.Q.; Chen, J.T.; Zhu, J.D. Mechanical Properties of Layered Hybrid Fiber Reinforced Concrete. J. Wuhan Univ. Technol.-Mater. Sci. 2003, 18, 68–70. [Google Scholar] [CrossRef]
- Liu, J.L.; Jia, Y.M.; Wang, J. Experimental Study on Mechanical and Durability Properties of Glass and Polypropylene Fiber Reinforced Concrete. Fibers Polym. 2019, 20, 1900–1908. [Google Scholar] [CrossRef]
- Mastali, M.; Dalvand, A. The impact resistance and mechanical properties of self-compacting concrete reinforced with recycled CFRP pieces. Compos. Part B Eng. 2016, 92, 360–376. [Google Scholar] [CrossRef]
- Sun, Z.Y.; Yang, Y.; Qin, W.H.; Ren, S.T.; Wu, G. Experimental study on flexural behavior of concrete beams reinforced by steel-fiber reinforced polymer composite bars. J. Reinf. Plast. Compos. 2013, 31, 1737–1745. [Google Scholar] [CrossRef]
- Wang, D.Y.; Qi, J.S.; Cui, G.Y.; Yang, Y.L.; Chang, J. Model Test on Bearing Characteristics of Basalt Fiber-Reinforced Concrete Lining. Adv. Mater. Sci. Eng. 2020, 2020, 3891343. [Google Scholar] [CrossRef] [Green Version]
- Monaldo, E.; Nerilli, F.; Vairo, G. Basalt-based fiber-reinforced materials and structural applications in civil engineering. Compos. Struct. 2019, 214, 246–263. [Google Scholar] [CrossRef]
- Zhou, H.; Jia, B.; Huang, H.; Mou, Y.L. Experimental Study on Basic Mechanical Properties of Basalt Fiber Reinforced Concrete. Materials 2020, 13, 1362. [Google Scholar] [CrossRef] [Green Version]
- Jalasutram, S.; Sahoo, D.R.; Matsagar, V. Experimental investigation of the mechanical properties of basalt fiber-reinforced concrete. Struct. Concr. 2017, 18, 292–302. [Google Scholar] [CrossRef]
- Alaskar, A.; Albidah, A.; Alqarni, A.S.; Alyousef, R.; Mohammadhosseini, H. Performance evaluation of high-strength concrete reinforced with basalt fibers exposed to elevated temperatures. J. Build. Eng. 2021, 35, 102108. [Google Scholar] [CrossRef]
- Chen, F.B.; Xu, B.; Jiao, H.Z.; Chen, X.M.; Shi, Y.L.; Wang, J.X.; Li, Z. Triaxial mechanical properties and microstructure visualization of BFRC. Constr. Build. Mater. 2021, 278, 122275. [Google Scholar] [CrossRef]
- Li, X. Research on Micro and Meso Void Structure and Preferential Flow Characteristics of Loess Based on CT. Ph.D. Thesis, Chang’an University, Xi′an, China, 2020. [Google Scholar]
- Song, D.Y.; He, K.K.; Ji, X.F.; Li, Y.B.; Zhao, H.T. Fine characterization of pores and fractures in coal based on a CT scan. Nat. Gas Ind. 2018, 38, 41–49. [Google Scholar] [CrossRef]
- Liu, X.; Sun, Q.H.; Yuan, Y.; Taerwe, L. Comparison of the structural behavior of reinforced concrete tunnel segments with steel fiber and synthetic fiber addition. Tunn. Undergr. Space Technol. 2020, 103, 103506. [Google Scholar] [CrossRef]
- Wang, T.; Zhang, J.H.; Bai, W.F.; Hao, S.M. Forming process and mechanical properties of fibers-reinforced polymer concrete. J. Reinf. Plast. Compos. 2013, 32, 907–911. [Google Scholar] [CrossRef]
- Jiao, H.Z.; Han, Z.Y.; Chen, X.M.; Yang, Y.X.; Wang, Y.F. Flexural toughness evolution of of basalt fiber reinforced shotcrete based on NMR technology. J. China Coal Soc. 2019, 44, 2990–2998. [Google Scholar]
- Jiao, H.Z.; Chen, W.L.; Wu, A.X.; Yu, Y.; Ruan, Z.E.; Honaker, R.; Chen, X.M.; Yu, J.X. Flocculated unclassified tailings settling efficiency improvement by particle collision optimization in the feedwell. Int. J. Miner. Metall. Mater. 2022, 44, 553. [Google Scholar] [CrossRef]
- Jiao, H.Z.; Wu, Y.C.; Wang, H.; Chen, X.M.; Li, Z.; Wang, Y.; Zhang, B.; Liu, J. Micro-scale mechanism of sealed water seepage and thickening from tailings bed in rake shearing thickener. Miner. Eng. 2021, 173, 107043. [Google Scholar] [CrossRef]
- Zhu, H.G.; Xie, H.P.; Yi, C.; Liu, Z.; Liu, H.X.; Wang, H.-T. CT Identification of Microcracks Evolution for Rock Materials. Chin. J. Rock Mech. Eng. 2011, 30, 1230–1238. [Google Scholar]
- Wang, D.K.; Zhang, H.; Wei, J.P.; Wu, Y.; Zhang, H.T.; Yao, B.H.; Fu, J.H.; Zhao, H.; Li, Z. Dynamic evolution characteristics of fractures in gas-bearing coal under the influence of gas pressure using industrial CT scanning technology. J. China Coal Soc. 2021, 46, 3550–3564. [Google Scholar]
- Zhong, Y.R.; Guo, D.W.; Huang, M.F. Application of Gauss filtering and information entropy principle in verification of arithmetic mean deviation. Comput. Eng. Appl. 2009, 45, 230–234. [Google Scholar]
- Yang, J.; Wu, Q.Y.; Tian, J.; Yang, H. The Implementation and Evaluation of Several CT Image Segmentation Algorithms. Trans. Beijing Inst. Technol. 2000, 20, 720–724. [Google Scholar]
- Gao, Z.; Cao, P.; Sun, X.J.; Zhao, Y.W. Compressive strength analysis and microscopic characterization of basalt fiber reinforced concrete. J. Hydroelectr. Eng. 2018, 37, 111–120. [Google Scholar]
- Zheng, D.; Song, W.D.; Fu, J.X.; Xue, G.L.; Li, J.J.; Cao, S. Research on mechanical characteristics, fractal dimension and internal structure of fiber reinforced concrete under uniaxial compression. Constr. Build. Mater. 2020, 258, 120351. [Google Scholar] [CrossRef]
- Rios, J.D.; Minguez, J.; Martinez-De La Concha, A.; Vicente, M.A.; Cifuentes, H. Microstructural analyses of the addition of PP fibres on the fracture properties of high-strength self-compacting concrete by X-ray computed tomography. Constr. Build. Mater. 2020, 261, 120499. [Google Scholar] [CrossRef]
- Tan, X.X. Research on Microstructure and Seepage Characteristics of Compacted Granite Weathered Soil. Master’s Thesis, Guilin University of Technology, Guilin, China, 2021. [Google Scholar]
- Li, N.; Zhao, Y.R. Research Progress of Concrete Internal Damage Based on X-ray CT Technology. Mater. Rep. 2021, 35, 21169–21177. [Google Scholar]
- Li, J.S.; Wang, D.; Kang, T.H. Algorithmic study on rock pore structure based on micro-CT experiment. Chin. J. Geotech. Eng. 2010, 32, 1703–1708. [Google Scholar]
- Lv, B.M. Research on Three-Dimensional Characterization and Permeation of Coal-Based Porous Carbon. Master’s Thesis, China University of Mining and Technology, Xuzhou, China, 2019. [Google Scholar]
- Wei, H.L. Research on Meso-Pore Structure and Clogging Laws of Ceramic Permeable Pavement Brick. Master’s Thesis, Northwest A&F University, Xianyang, China, 2021. [Google Scholar]
- Yang, Q.; Yu, Y.B.; Cui, W.T.; Gao, C.W.; Zhang, X.; Shen, J.L. Fracture evolution of coal under uniaxial compression based on X-ray microscopic imaging. Coal Sci. Technol. 2022. [Google Scholar] [CrossRef]
- Liu, T.T. Pore Characteristics Analysis and Seepage Simulation of Cast-In-Situ Frost-Resistant Vegetation Concrete. Master’s Thesis, Shandong Agricultural University, Shandong, China, 2020. [Google Scholar]
- Chen, F.B.; Xu, B.; Jiao, H.Z.; Ruan, Z.E.; Liu, J.H.; Chen, X.M.; Yang, L.H.; Li, Z. Characterization of Internal Defects and Fiber Distribution of BFRC Based on the Digital Image Processing Technology. Crystals 2021, 11, 847. [Google Scholar] [CrossRef]
- Liu, Z.X.; Dong, S.N.; Nan, S.H.; Zhang, D.-Y.; Liu, D. Micro-CT analysis of void characteristics at the top of middle ordovician limestone in Hanxing mining area. J. Min. Saf. Eng. 2021, 38, 343–352. [Google Scholar]
- Jin, Z.M.; Zhou, H.W.; Xue, D.J. Measurement of porosity and specific surface area of coal rock using CT images. J. Xi’an Univ. Sci. Technol. 2020, 40, 133–140. [Google Scholar]
- Jing, H. Characterization for Micro-structure and Compressional Behaviour of General Fibrous Assemblies. Ph.D. Thesis, Donghua University, Shanghai, China, 2018. [Google Scholar]
- Chen, X.M.; Shi, Y.L.; Jiao, H.Z.; Jin, X.F.; Wu, Y.C.; Tan, Y. Fiber Distribution Characteristics Based on Search Cone Algorithm and Enhancement Mechanism of BFRC. Mater. Rep. 2021, 35, 4061–4066. [Google Scholar]
- Mu, R.; Ma, Y.F.; Li, H.; Wang, X.W.; Zhang, P. Analysis of the distribution of steel fiber in aligned steel fiber reinforced concrete using digital X-ray CT scanning. J. Chin. Electron Microsc. Soc. 2015, 34, 487–491. [Google Scholar]
- Li, H. Numerical Investigation on Mechanism of Effect of Fiber Orientation on Properties of Cement-Based Composites at Meso- and Micro-Scale. Ph.D. Thesis, Southeast University, Nanjing, China, 2019. [Google Scholar]
- Yu, R.; Fan, D.Q.; Sun, M.J.; Zhang, J.J.; Shuai, Z.H.; Hou, D.S.; Wang, D.S.; Wang, X.P.; Feng, Y. Effects of Steel Fibre Content and 3D Network on Performance of Ultra-High Performance Concrete. J. Chin. Ceram. Soc. 2021, 49, 2313–2321. [Google Scholar]
- Zhao, J.Z.; Shi, Y.L.; Li, X.L.; Xu, Y. Study on the Influence of Fiber Distribution on Mechanical Properties of Polymer Cement Concrete. China Concr. Cem. Prod. 2021, 11, 55–58+72. Available online: https://cf.cnki.net/kcms/detail/detail.aspx?filename=HNTW202111015amp;dbcode=XWCJamp;dbname=XWCTLKCJFDLAST2021amp;v= (accessed on 29 January 2022).
- Ponikiewski, T.; Golaszewski, J.; Rudzki, M.; Bugdol, M. Determination of steel fibres distribution in self-compacting concrete beams using X-ray computed tomography. Arch. Civ. Mech. Eng. 2015, 15, 558–568. [Google Scholar] [CrossRef]
- Zarzycki, P.K.; Katzer, J.; Domski, J. Fast classification of fibres for concrete based on multivariate statistics. Comput. Concr. An Int. J. 2017, 20, 23–29. [Google Scholar]


Publisher’s Note: MDPI stays neutral with regard to jurisdictional claims in published maps and institutional affiliations. |
© 2022 by the authors. Licensee MDPI, Basel, Switzerland. This article is an open access article distributed under the terms and conditions of the Creative Commons Attribution (CC BY) license (https://creativecommons.org/licenses/by/4.0/).