
Investigation of the Evolution of the Chemical Structure of Bituminous Coals and Lignite during Pyrolysis


Abstract
:1. Introduction
2. Experimental
2.1. Materials and Preparation
2.2. Pyrolysis Experiments
2.3. Characterization of Carbon Structure
3. Results and Discussion
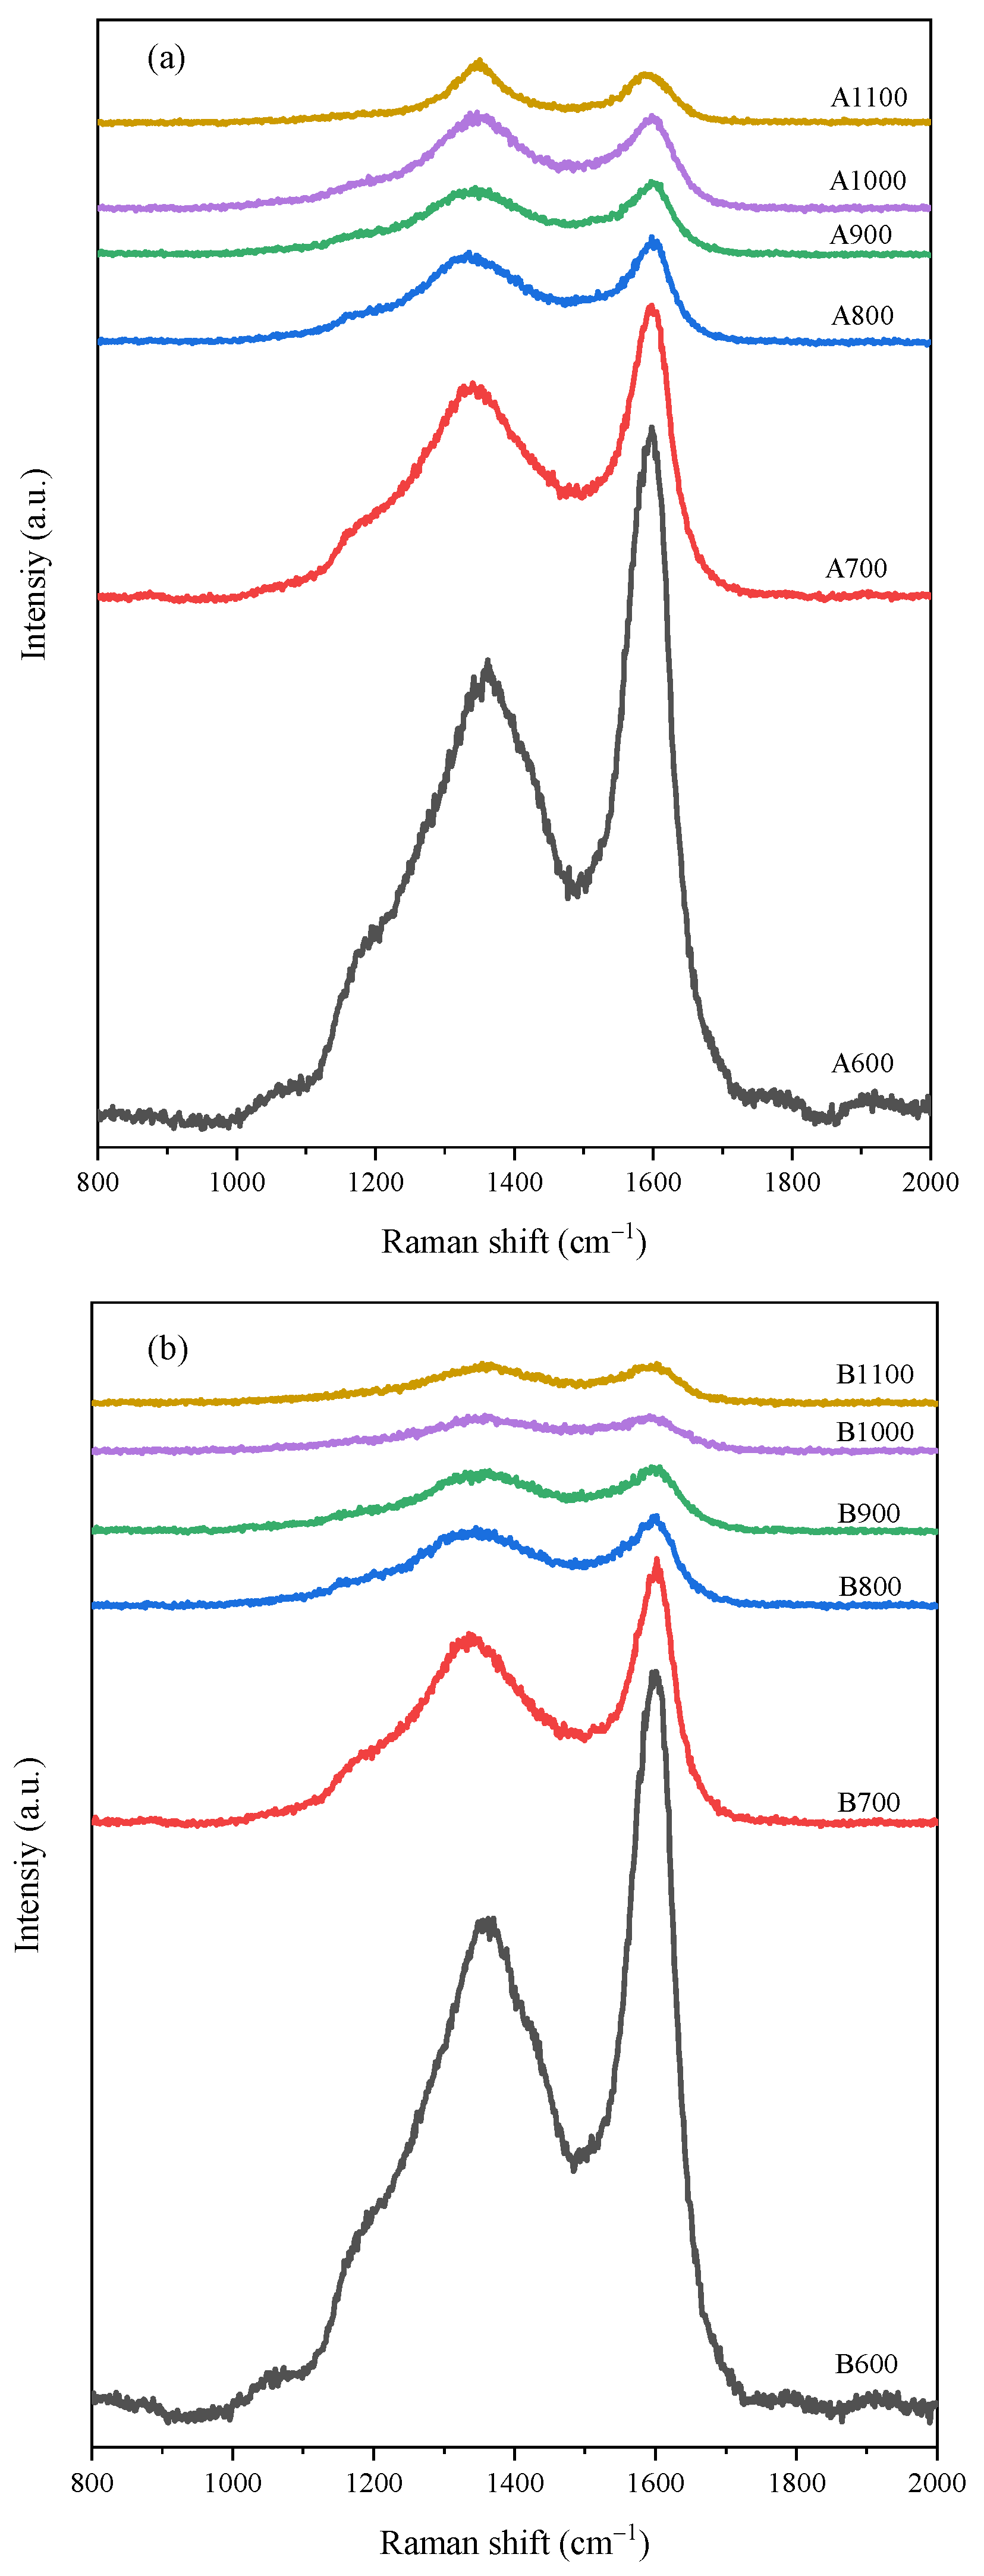
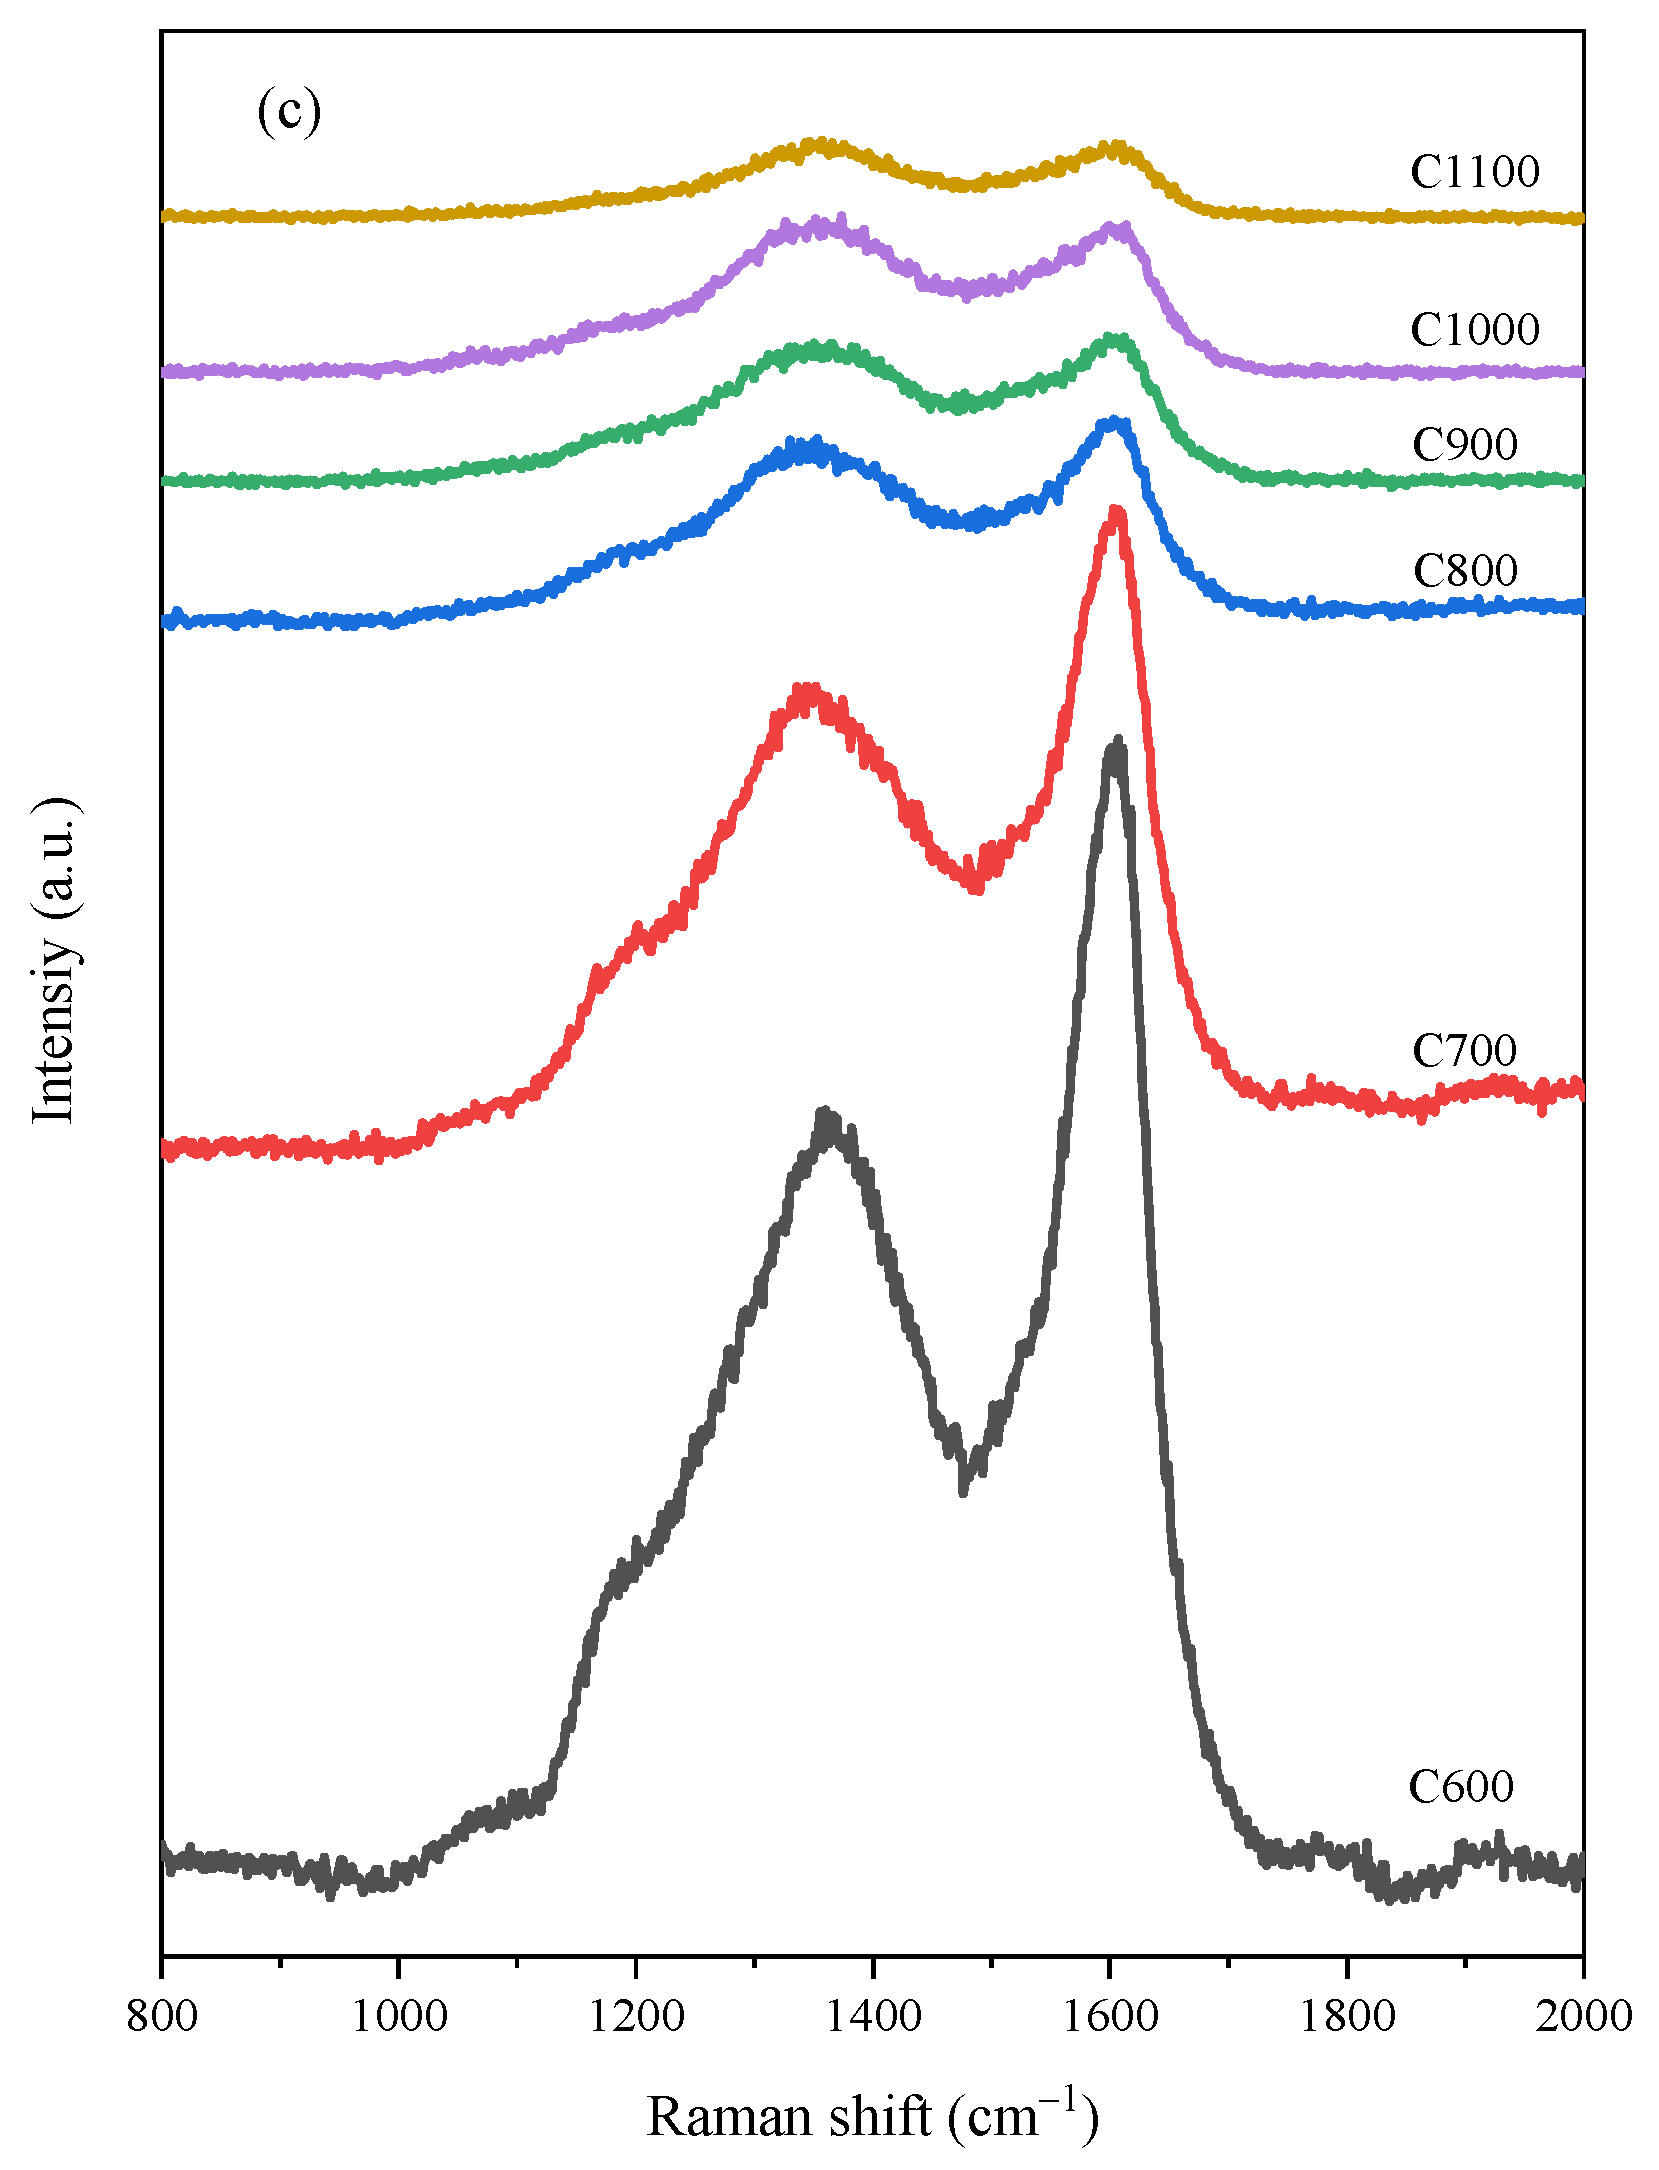
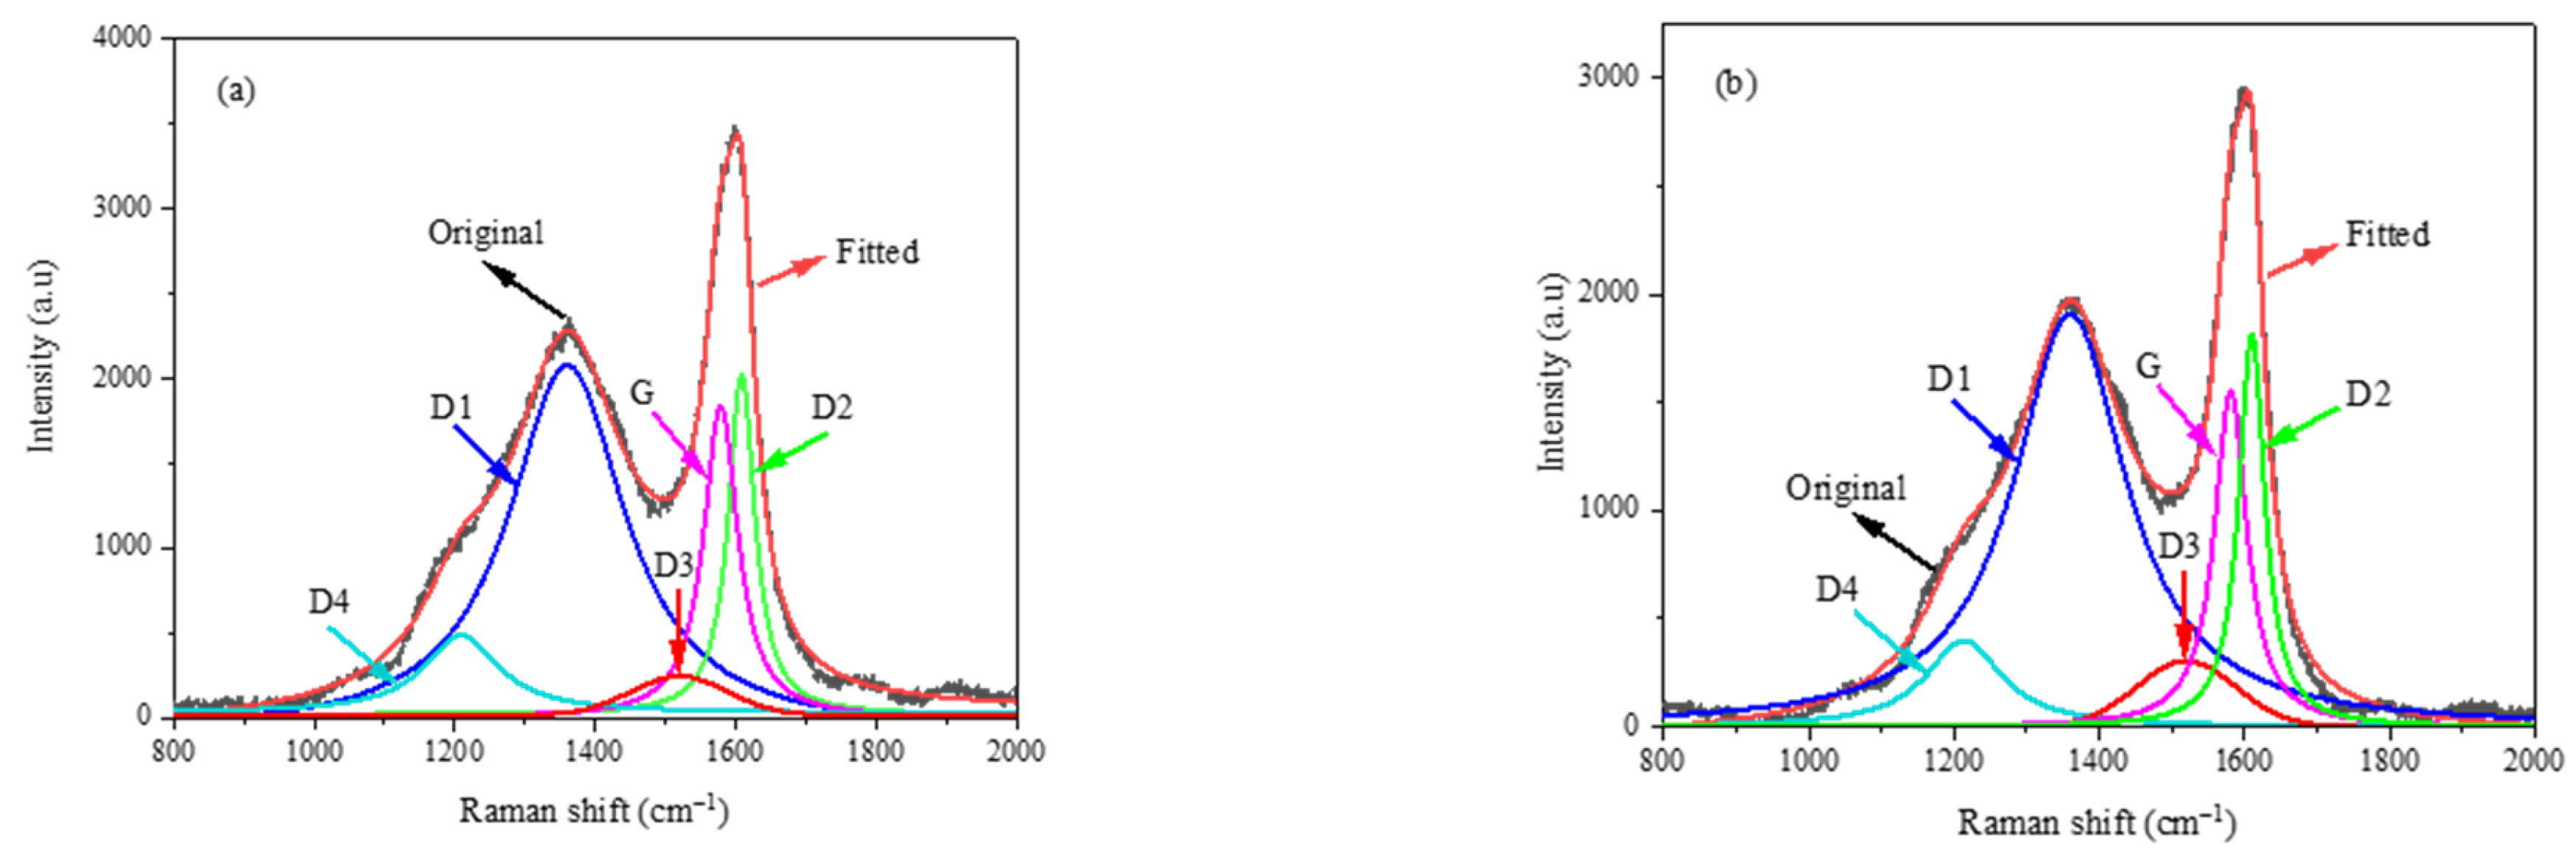
3.1. Raman Spectroscopic Analysis
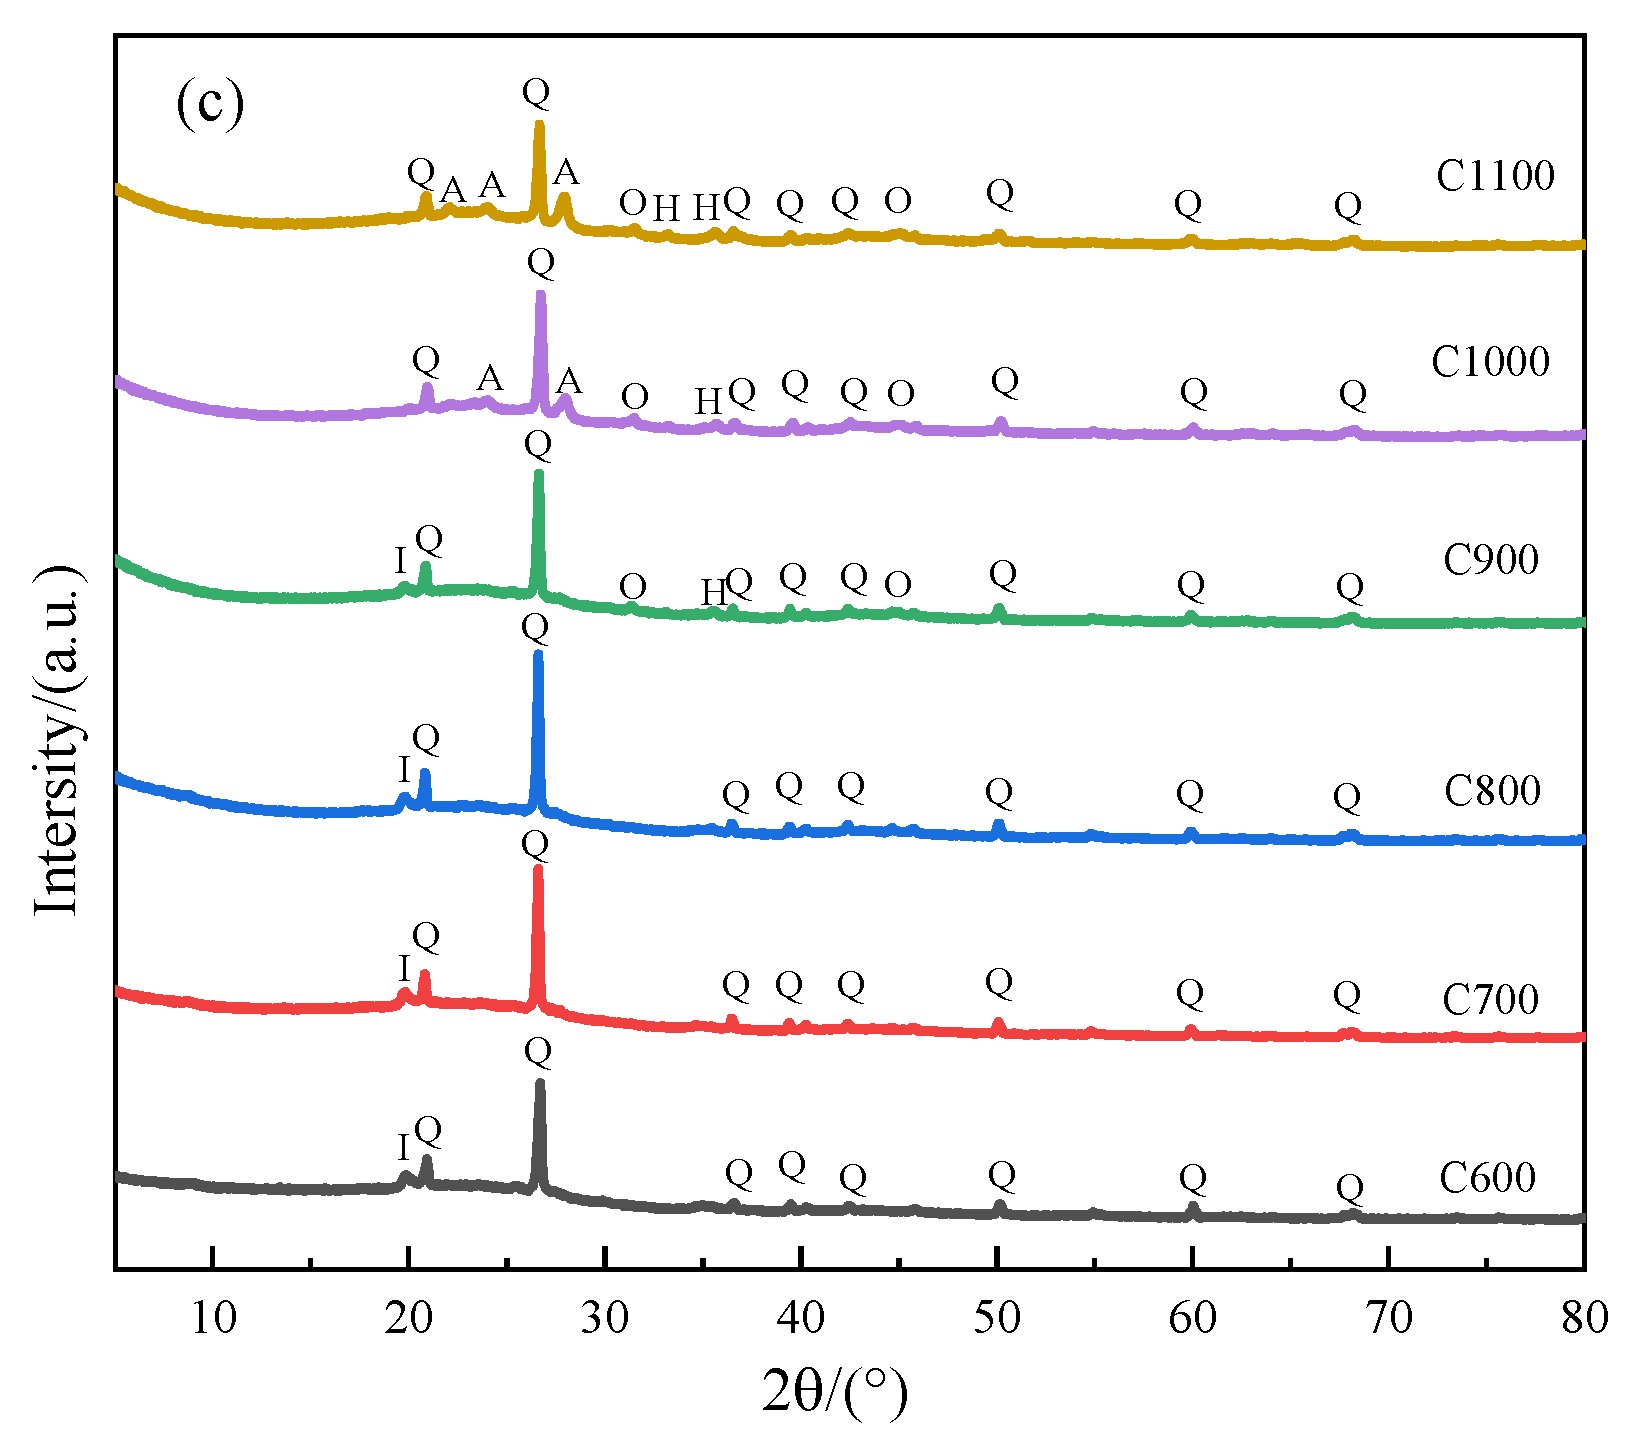
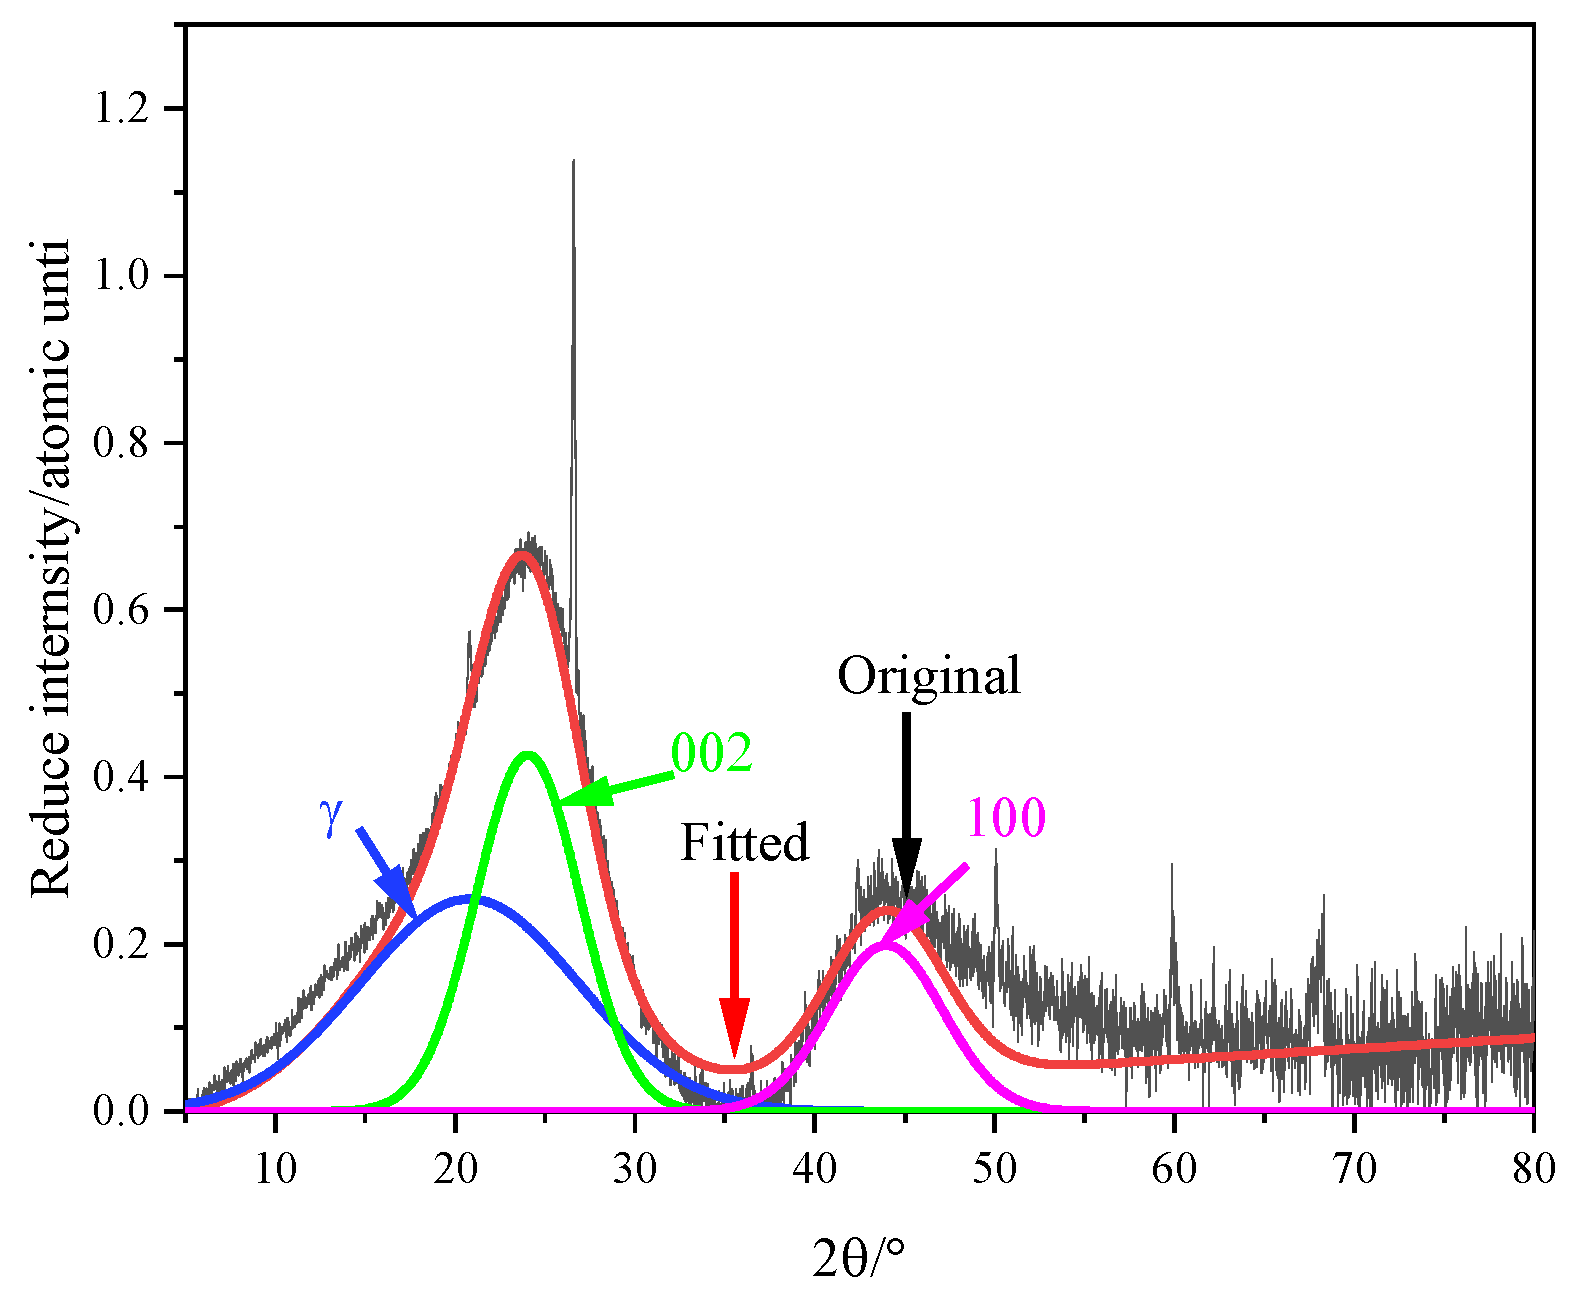
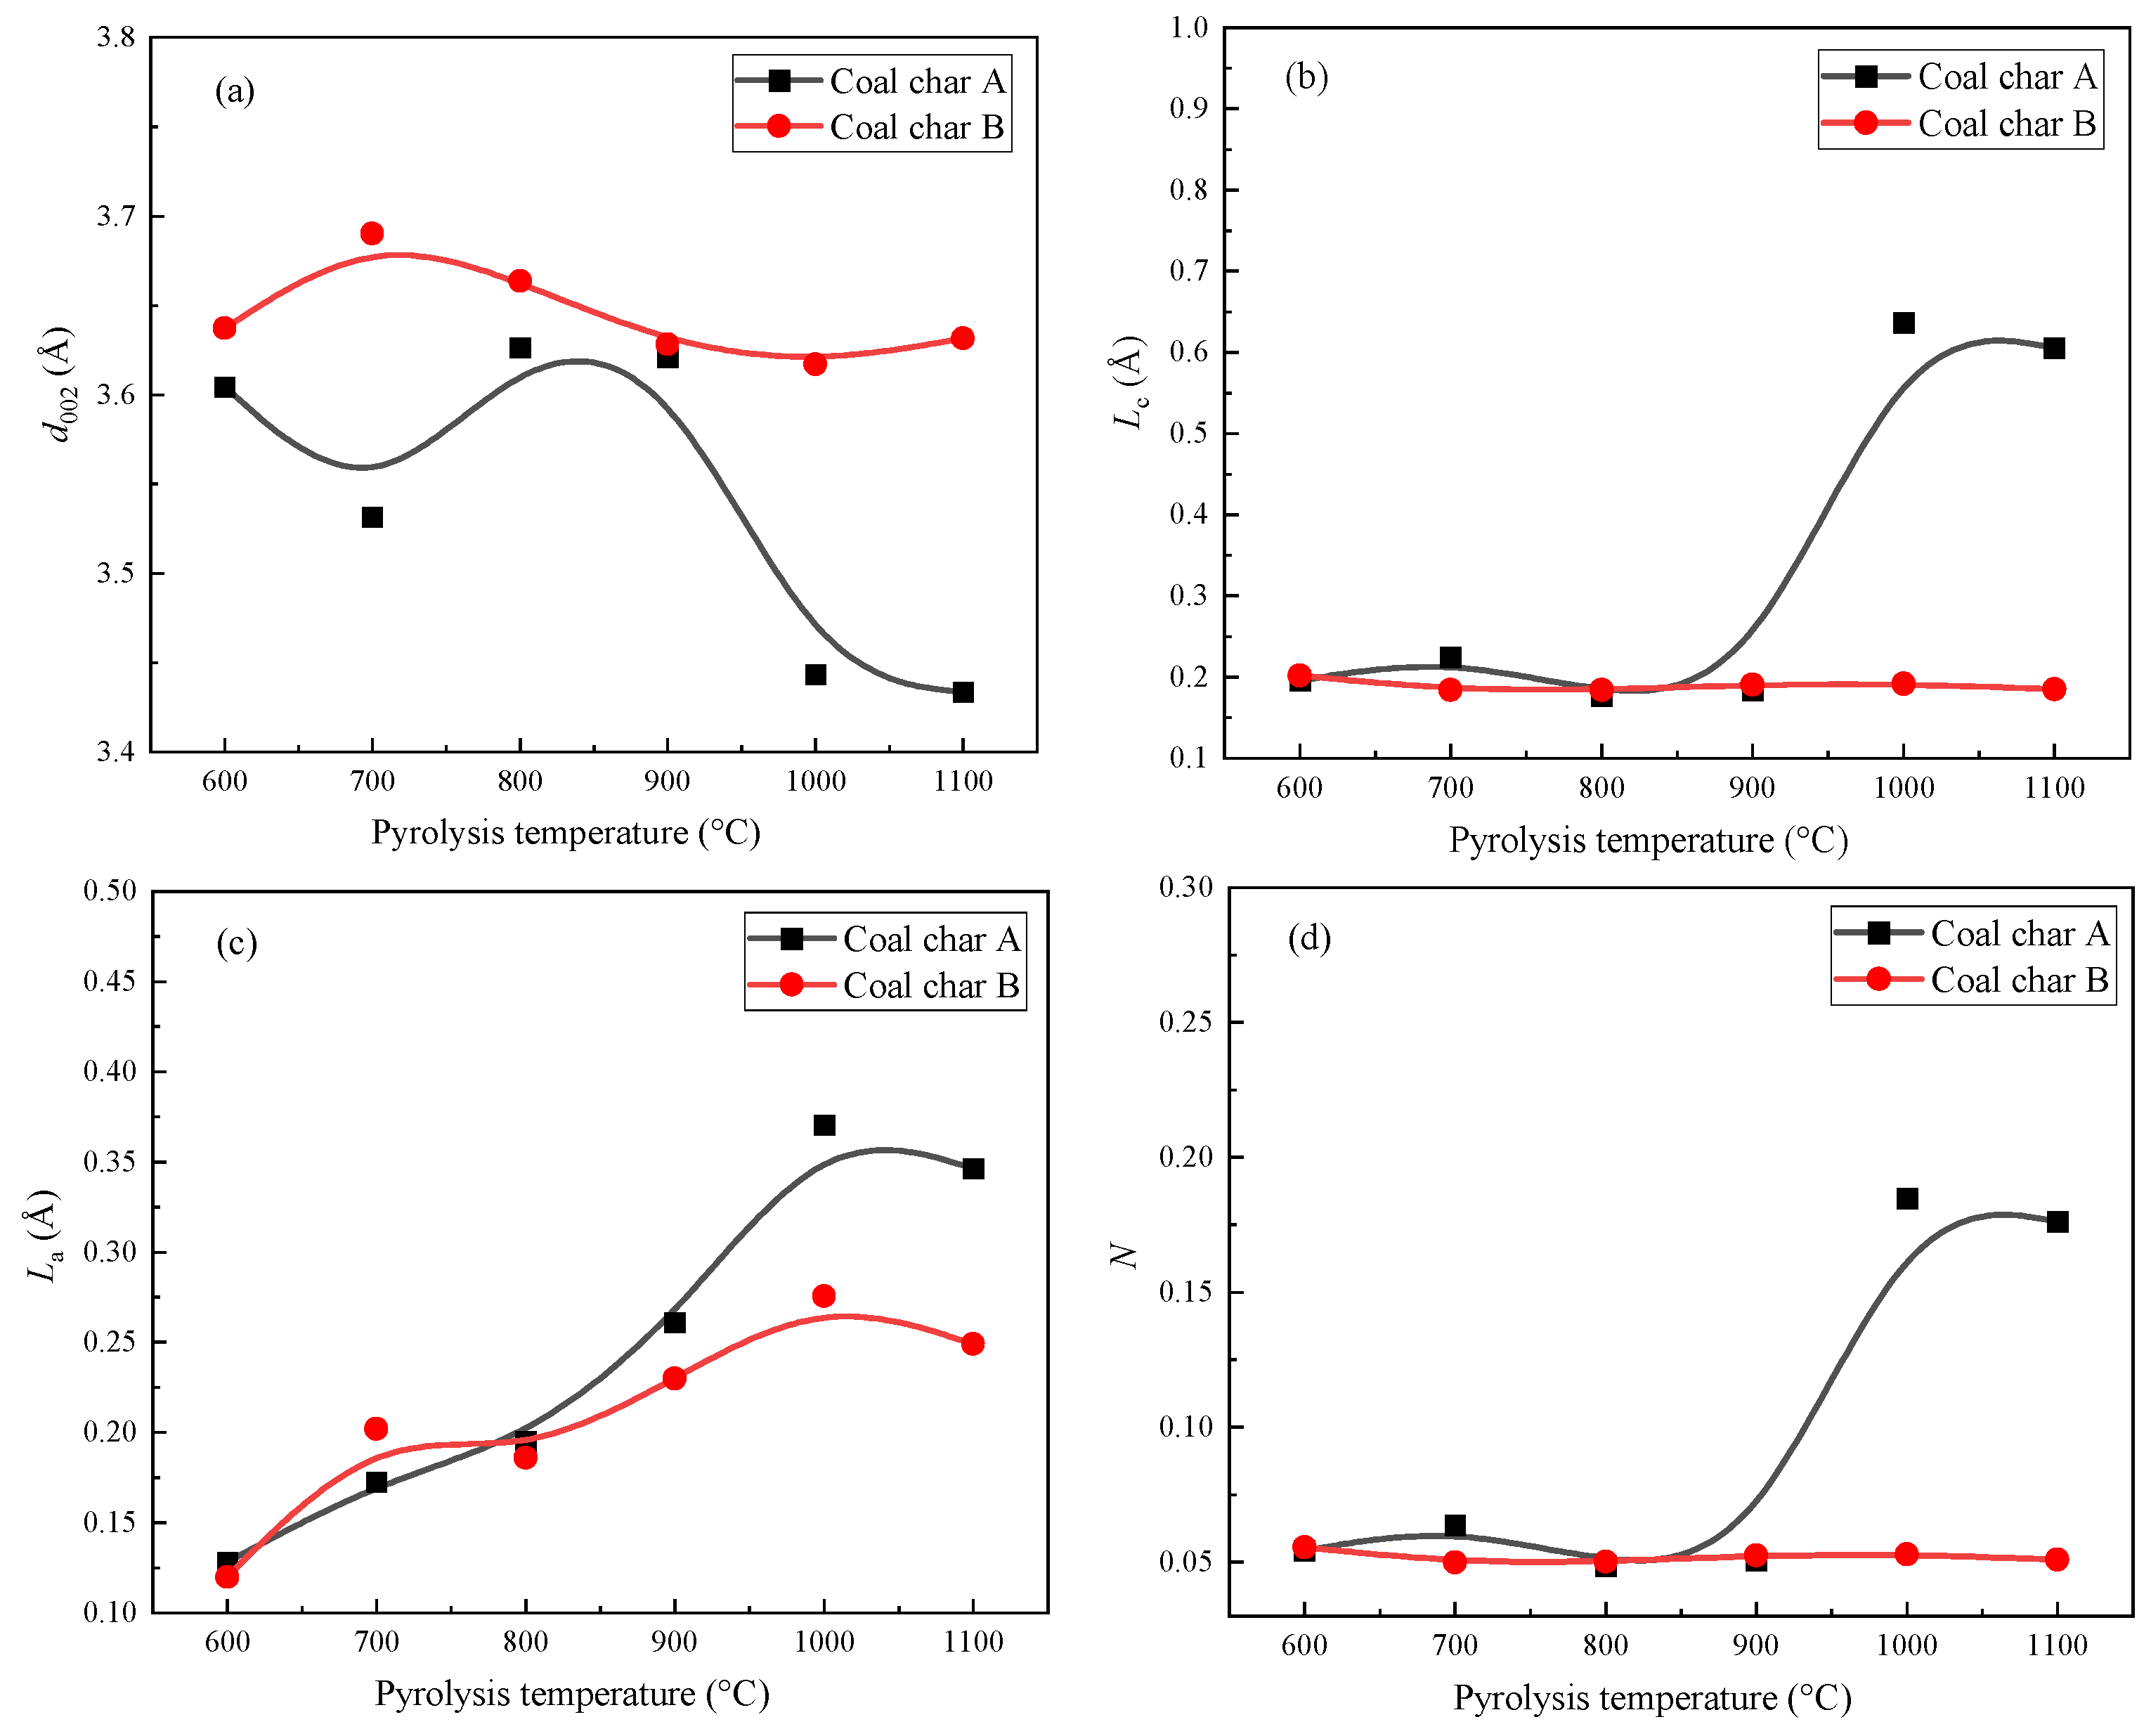
3.2. XRD Analysis
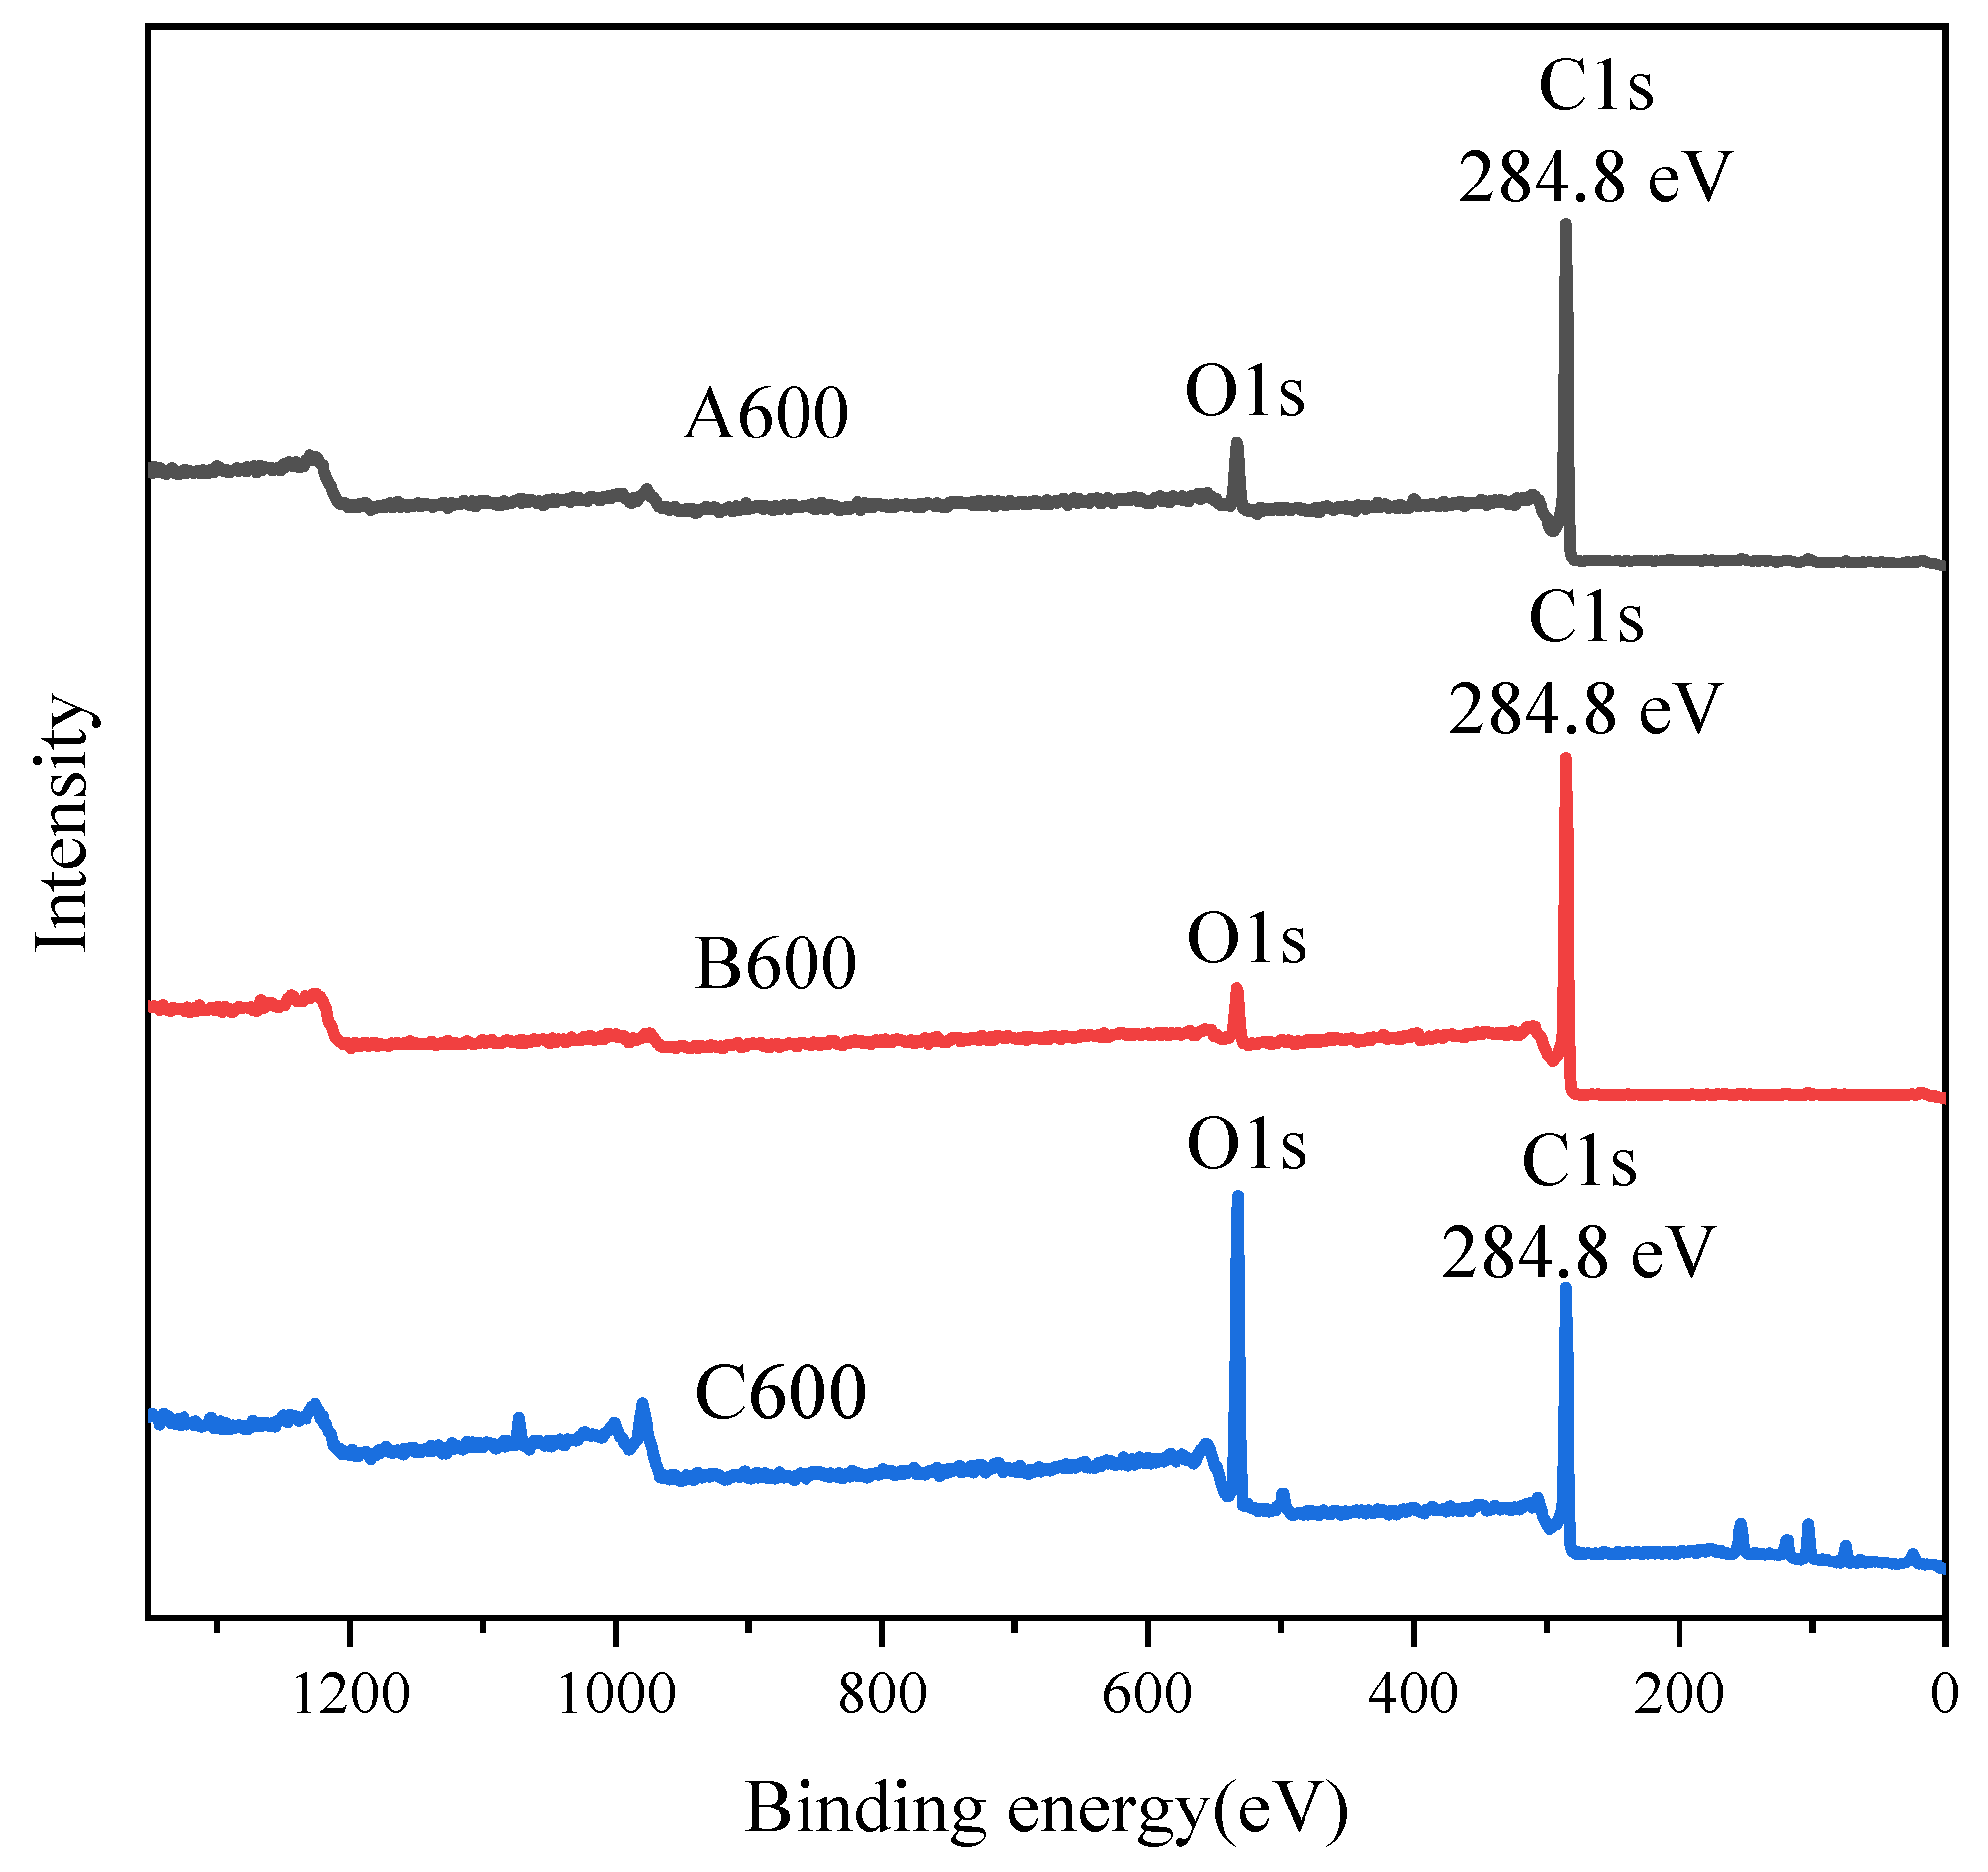
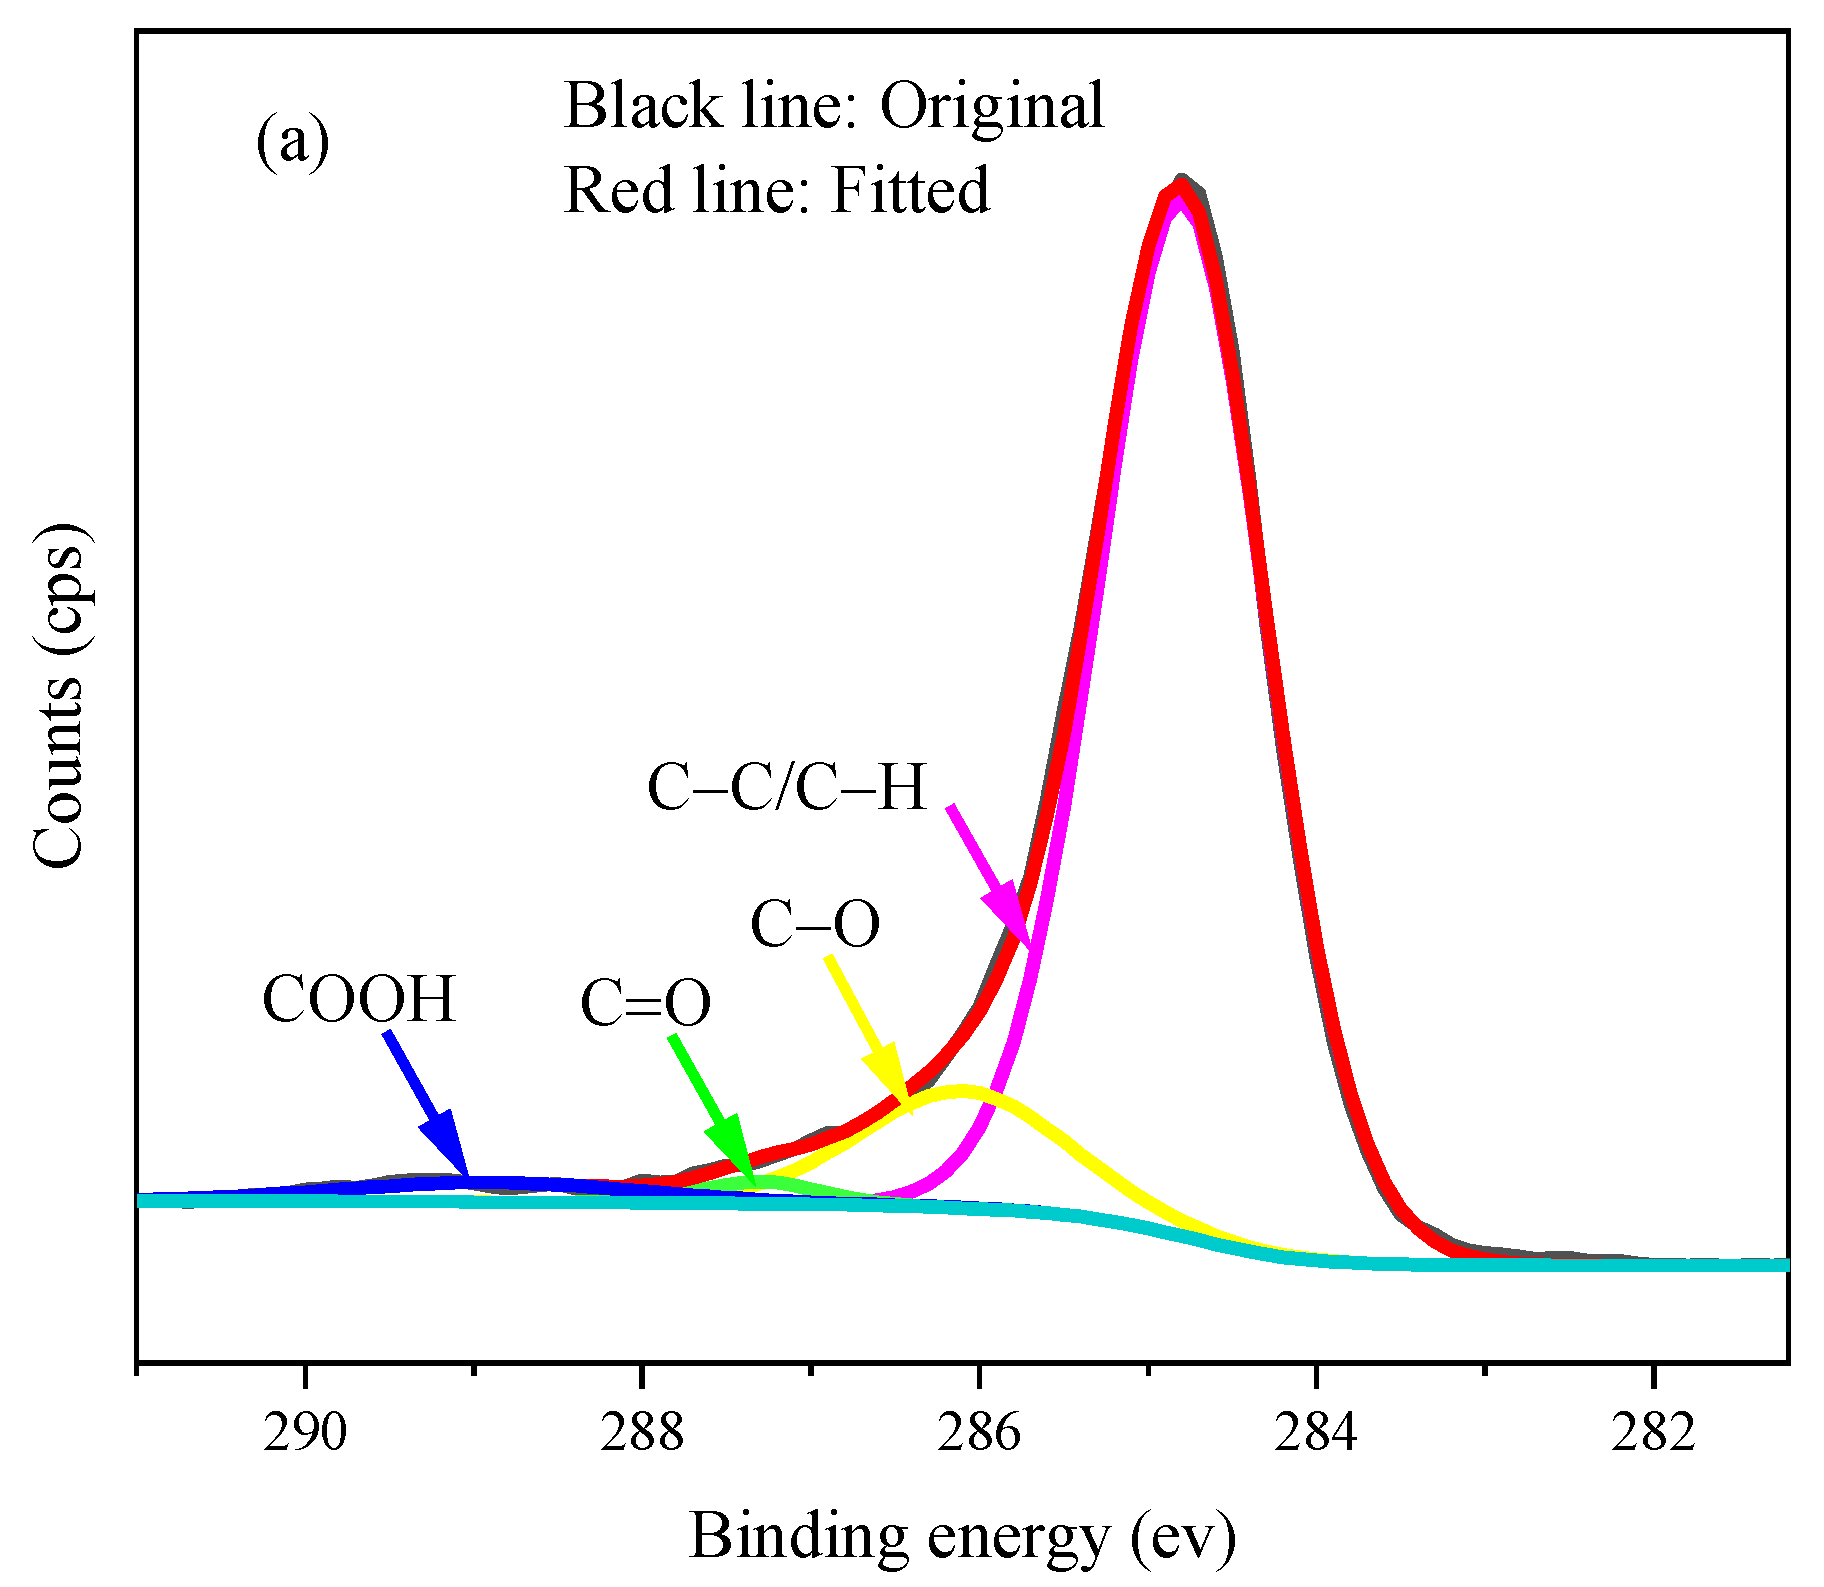
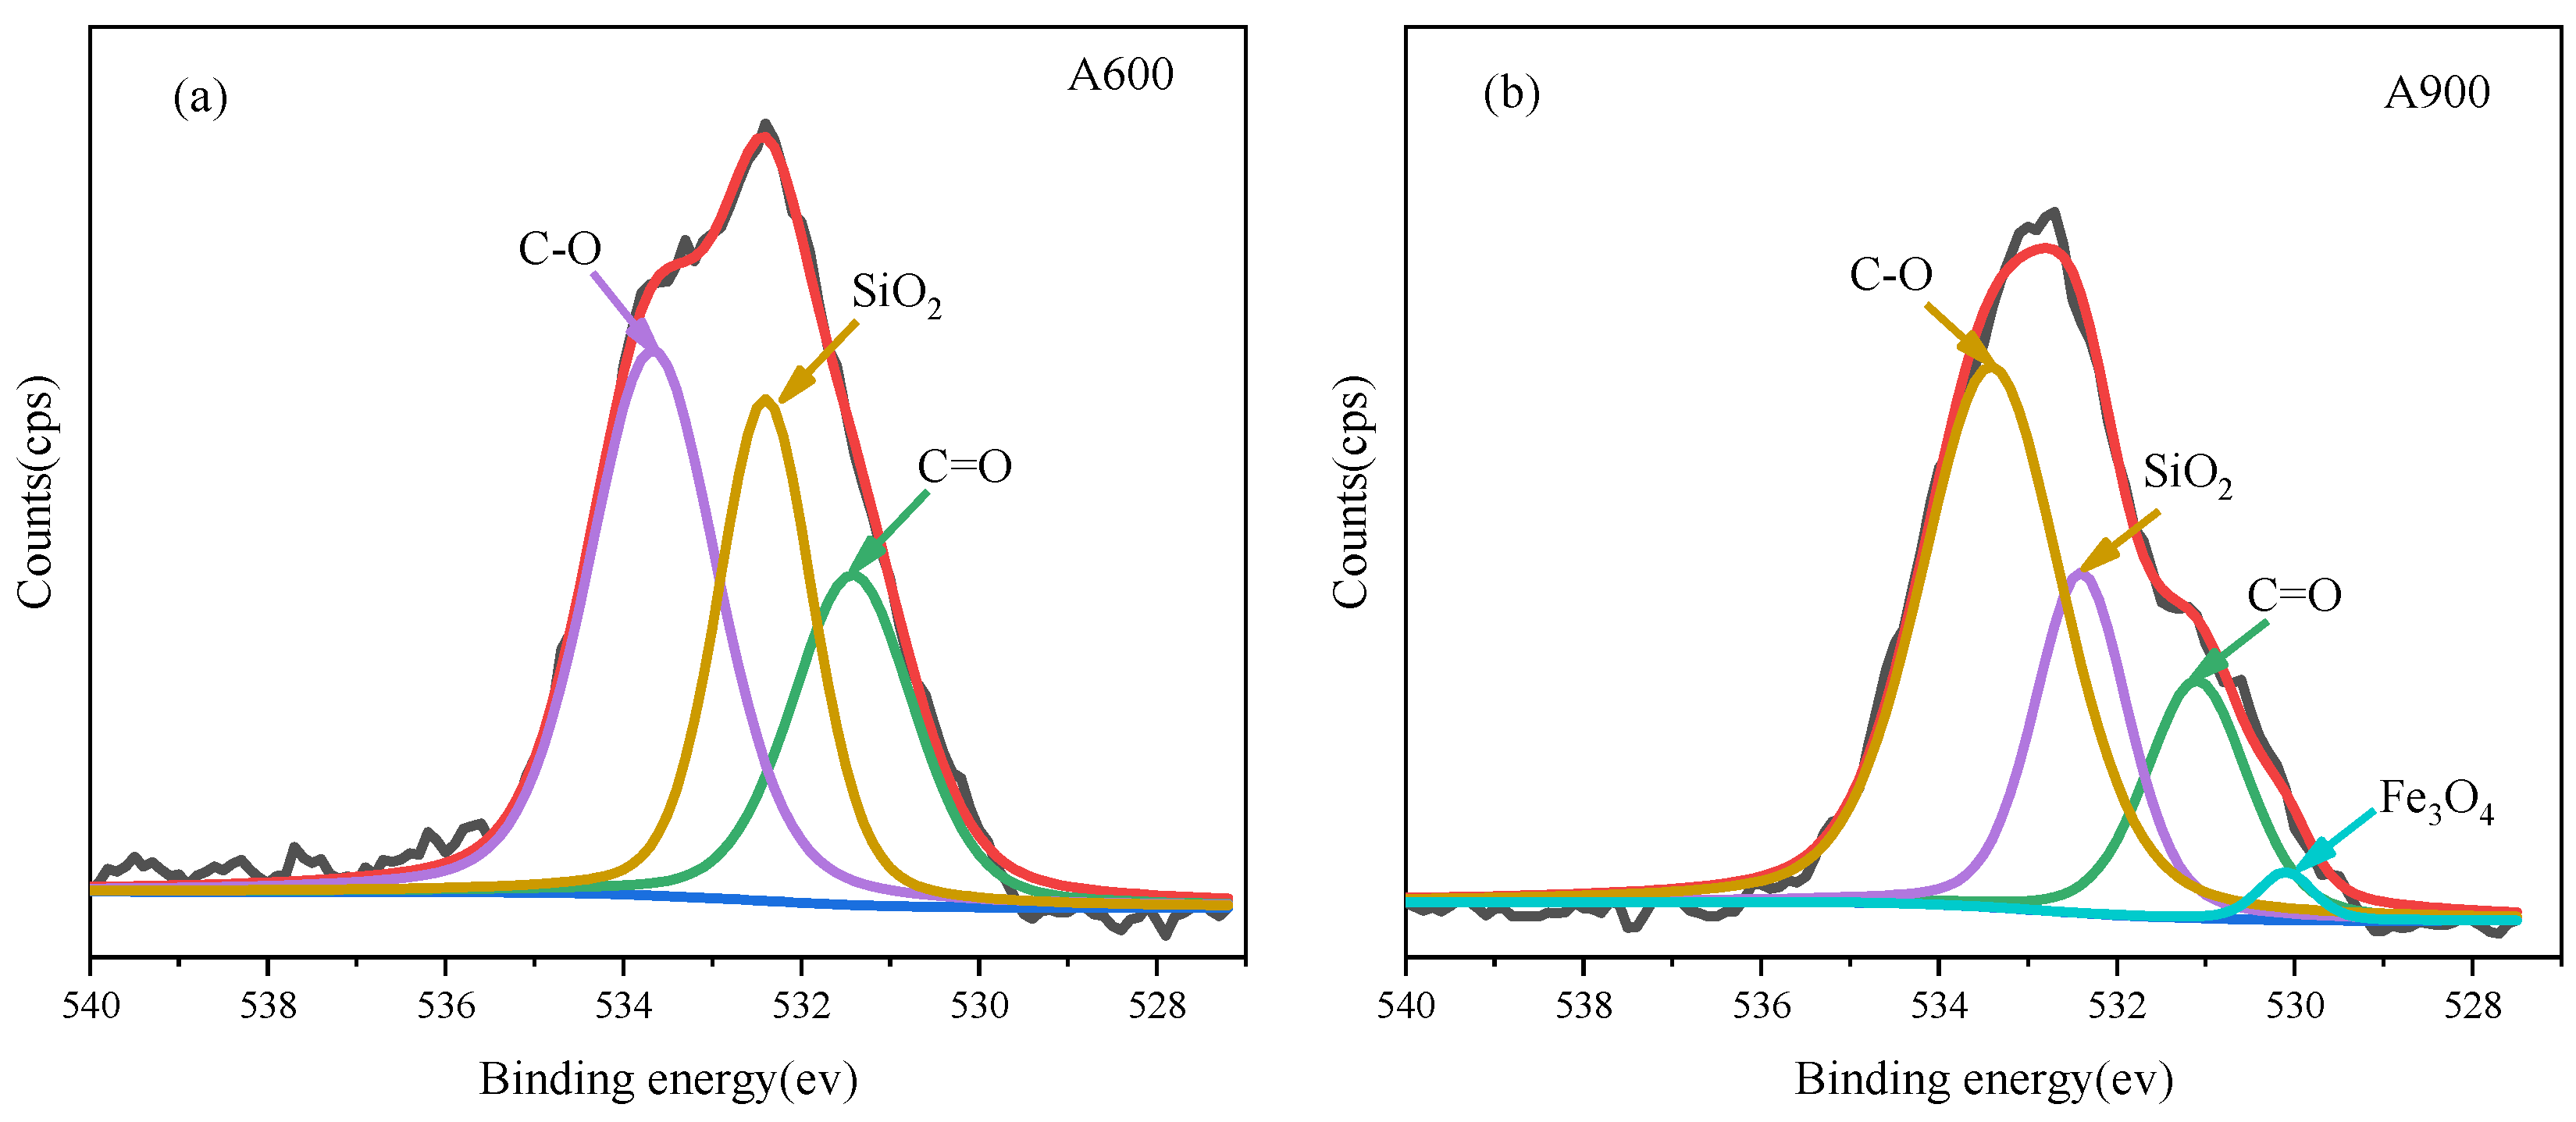
3.3. XPS Analysis
4. Conclusions
Supplementary Materials
Author Contributions
Funding
Data Availability Statement
Acknowledgments
Conflicts of Interest
References
- Wang, G.; Hou, B.; Zhang, J.; Wang, H.; Gao, D.; Chang, G.; Thallada, B. Effect of pressure and H2 on the pyrolysis characteristics of lignite: Thermal behavior and coal char structural properties. J. Anal. Appl. Pyrol. 2018, 135, 1–9. [Google Scholar] [CrossRef]
- Peng, Z.; Ning, X.; Wang, G.; Zhang, J.; Li, Y.; Huang, C. Structural characteristics and flammability of low-order coal pyrolysis semi-coke. J. Energy Inst. 2020, 93, 1341–1353. [Google Scholar] [CrossRef]
- Gao, R.; Dou, B.; Chang, Q.; Xu, J.; Dai, Z.; Yu, G.; Wang, F. Effect of temperature and hydrogen on product distribution and evolution of char structure during pyrolysis of bituminous coal in a drop tube furnace. Fuel 2020, 267, 117078. [Google Scholar] [CrossRef]
- Geng, C.; Li, S.; Yue, C.; Ma, Y. Pyrolysis characteristics of bituminous coal. J. Energy Inst. 2016, 89, 725–730. [Google Scholar] [CrossRef]
- Jayaraman, K.; Gokalp, I.; Bostyn, S. High ash coal pyrolysis at different heating rates to analyze its char structure, kinetics and evolved species. J. Anal. Appl. Pyrol. 2015, 113, 426–433. [Google Scholar] [CrossRef]
- Liang, D.; Xie, Q.; Wan, C.; Li, G.; Cao, J. Evolution of structural and surface chemistry during pyrolysis of Zhundong coal in an entrained-flow bed reactor. J. Anal. Appl. Pyrol. 2019, 140, 331–338. [Google Scholar] [CrossRef]
- Zhong, M.; Gao, S.; Zhou, Q.; Yue, J.; Ma, F.; Xu, G. Characterization of char from high temperature fluidized bed coal pyrolysis in complex atmospheres. Particuology 2016, 25, 59–67. [Google Scholar] [CrossRef]
- Borah, R.C.; Ghosh, P.; Rao, P.G. A review on devolatilization of coal in fluidized bed. Int. J. Energy Res. 2011, 35, 929–963. [Google Scholar] [CrossRef]
- Xu, K.; Hu, S.; Su, S.; Xu, C.; Sun, L.; Shuai, C.; Jiang, L.; Xiang, J. Study on char surface active sites and their relationship to gasification reactivity. Energy Fuels 2013, 27, 118–125. [Google Scholar] [CrossRef]
- Dingcheng, L.; Qiang, X.; Guangsheng, L.; Junya, C.; Jun, Z. Influence of heating rate on reactivity and surface chemistry of chars derived from pyrolysis of two Chinese low rank coals. Int. J. Min. Sci. Technol. 2018, 28, 613–619. [Google Scholar] [CrossRef]
- Liu, X.; Zheng, Y.; Liu, Z.; Ding, H.; Huang, X.; Zheng, C. Study on the evolution of the char structure during hydrogasification process using Raman spectroscopy. Fuel 2015, 157, 97–106. [Google Scholar] [CrossRef]
- Xu, L.; Liu, H.; Jin, Y.; Fan, B.; Qiao, X.; Jing, B. Structural order and dielectric properties of coal chars. Fuel 2014, 137, 164–171. [Google Scholar] [CrossRef]
- Guo, S.; Jiang, Y.; Liu, T.; Zhao, J.; Huang, J.; Fang, Y. Investigations on interactions between sodium species and coal char by thermogravimetric analysis. Fuel 2018, 214, 561–568. [Google Scholar] [CrossRef]
- Liu, M.; Bai, J.; Yu, J.; Kong, L.; Bai, Z.; Li, H.; He, C.; Ge, Z.; Cao, X.; Li, W. Correlation between char gasification characteristics at different stages and microstructure of char by combining X-ray diffraction and Raman spectroscopy. Energy Fuels 2020, 34, 4162–4172. [Google Scholar] [CrossRef]
- Dong, Q.; Zhang, H.; Zhu, Z. Evolution of structure properties during Zhundong coal pyrolysis. Procedia Eng. 2015, 102, 4–13. [Google Scholar] [CrossRef] [Green Version]
- Gong, X.; Zhang, S. Changes in char structure due to inorganic matters during anthracite pyrolysis. J. Anal. Appl. Pyrol. 2017, 127, 170–175. [Google Scholar] [CrossRef]
- Zhang, X.; Wang, J.; Liu, Q.; Te, G.; Ban, Y.; Wang, Y.; Li, N.; He, R.; Zhang, Y.; Zhi, K. The Effects of sodium and alkalinity on the microcrystalline structure and the steam gasification performance of Shengli lignite. J. Anal. Appl. Pyrol. 2017, 125, 227–233. [Google Scholar] [CrossRef]
- Yao, Q.; Ma, M.; Liu, Y.; He, L.; Sun, M.; Ma, X. Pyrolysis characteristics of metal ion-exchanged Shendong coal and its char gasification performance. J. Anal. Appl. Pyrol. 2021, 155, 105087. [Google Scholar] [CrossRef]
- Liu, H.; Xu, L.; Jin, Y.; Fan, B.; Qiao, X.; Yang, Y. Effect of coal rank on structure and dielectric properties of chars. Fuel 2015, 153, 249–256. [Google Scholar] [CrossRef]
- Li, Q.; Wang, Z.; He, Y.; Sun, Q.; Zhang, Y.; Kumar, S.; Zhang, K.; Cen, K. Pyrolysis characteristics and evolution of char structure during pulverized coal pyrolysis in drop tube furnace: Influence of temperature. Energy Fuels 2017, 31, 4799–4807. [Google Scholar] [CrossRef]
- Wang, N.; Mao, M.; Mao, G.; Yin, J.; He, R.; Zhou, H.; Li, N.; Liu, Q.; Zhi, K. Investigation on carbide slag catalytic effect of Mongolian bituminous coal steam gasification process. Chemosphere 2021, 264, 128500. [Google Scholar] [CrossRef] [PubMed]
- Zhao, Y.; Zhang, Y.; Zhang, H.; Wang, Q.; Guo, Y. Structural characterization of carbonized briquette obtained from anthracite powder. J. Anal. Appl. Pyrol. 2015, 112, 290–297. [Google Scholar] [CrossRef]
- Mollah, M.M.; Jackson, W.R.; Marshall, M.; Chaffee, A.L. An attempt to produce blast furnace coke from Victorian brown coal. Fuel 2015, 148, 104–111. [Google Scholar] [CrossRef]
- Guedes, A.; Valentim, B.; Prieto, A.C.; Noronha, F. Raman spectroscopy of coal macerals and fluidized bed char morphotypes. Fuel 2012, 97, 443–449. [Google Scholar] [CrossRef]
- Estrade-Szwarckopf, H. XPS photoemission in carbonaceous materials: A “defect” peak beside the graphitic asymmetric peak. Carbon 2004, 42, 1713–1721. [Google Scholar] [CrossRef]
- Ullah, H.; Chen, B.; Shahab, A.; Naseem, F.; Rashid, A.; Lun, L.; Yousaf, B.; Khan, S. Influence of hydrothermal treatment on selenium emission-reduction and transformation from low-ranked coal. J. Clean Prod. 2020, 267, 122070. [Google Scholar] [CrossRef]
- Niu, C.; Xia, W.; Xie, G. Effect of low-temperature pyrolysis on surface properties of sub-bituminous coal sample and its relationship to flotation response. Fuel 2017, 208, 469–475. [Google Scholar] [CrossRef]
- Yu, J.; Sun, L.; Berrueco, C.; Fidalgo, B.; Paterson, N.; Millan, M. Influence of temperature and particle size on structural characteristics of chars from Beechwood pyrolysis. J. Anal. Appl. Pyrol. 2018, 130, 127–134. [Google Scholar] [CrossRef] [Green Version]
- Zhang, X.-P.; Zhang, C.; Tan, P.; Li, X.; Fang, Q.-Y.; Chen, G. Effects of hydrothermal upgrading on the physicochemical structure and gasification characteristics of Zhundong coal. Fuel Process. Technol. 2018, 172, 200–208. [Google Scholar] [CrossRef]
- Li, N.; Wang, Y.; Cui, S.; Sun, D. Investigations on NO reduction with biomass char: Char structural changes during the heat treatment in N2 and subsequent NO/O2 gasification. Fuel 2021, 287, 119564. [Google Scholar] [CrossRef]
- Li, X.; Hayashi, J.-i.; Li, C.-Z. FT-Raman spectroscopic study of the evolution of char structure during the pyrolysis of a Victorian brown coal. Fuel 2006, 85, 1700–1707. [Google Scholar] [CrossRef]
- Sadezky, A.; Muckenhuber, H.; Grothe, H.; Niessner, R.; Pöschl, U. Raman microspectroscopy of soot and related carbonaceous materials: Spectral analysis and structural information. Carbon 2005, 43, 1731–1742. [Google Scholar] [CrossRef]
- Sood, A.; Gupta, R.; Asher, S. Origin of the unusual dependence of Raman D band on excitation wavelength in graphite-like materials. J. Appl. Phys. 2001, 90, 4494–4497. [Google Scholar] [CrossRef] [Green Version]
- Ferrari, A.C.; Robertson, J. Interpretation of Raman spectra of disordered and amorphous carbon. Phys. Rev. B 2000, 61, 14095. [Google Scholar] [CrossRef] [Green Version]
- Sheng, C. Char structure characterised by Raman spectroscopy and its correlations with combustion reactivity. Fuel 2007, 86, 2316–2324. [Google Scholar] [CrossRef]
- Zhu, H.; Yu, G.; Guo, Q.; Wang, X. In situ Raman spectroscopy study on catalytic pyrolysis of a bituminous coal. Energy Fuels 2017, 31, 5817–5827. [Google Scholar] [CrossRef]
- Zhao, Y.; Feng, D.; Zhang, Y.; Huang, Y.; Sun, S. Effect of pyrolysis temperature on char structure and chemical speciation of alkali and alkaline earth metallic species in biochar. Fuel Process. Technol. 2016, 141, 54–60. [Google Scholar] [CrossRef]
- Chabalala, V.; Wagner, N.; Potgieter-Vermaak, S. Investigation into the evolution of char structure using Raman spectroscopy in conjunction with coal petrography; Part 1. Fuel Process. Technol. 2011, 92, 750–756. [Google Scholar] [CrossRef]
- Yu, J.; Guo, Q.; Ding, L.; Gong, Y.; Yu, G. Studying effects of solid structure evolution on gasification reactivity of coal chars by in-situ Raman spectroscopy. Fuel 2020, 270, 117603. [Google Scholar] [CrossRef]
- Leng, H.; Feng, D.; Gao, J.; Zhang, Y.; Zhao, Y.; Du, Q.; Chang, G.; Guo, Q.; Wang, X.; Sun, S. Effect of high-temperature and microwave expanding modification on reactivity of coal char for char-NO interaction. Sci. Total Environ. 2021, 760, 144028. [Google Scholar] [CrossRef]
- Zickler, G.A.; Smarsly, B.; Gierlinger, N.; Peterlik, H.; Paris, O. A reconsideration of the relationship between the crystallite size La of carbons determined by X-ray diffraction and Raman spectroscopy. Carbon 2006, 44, 3239–3246. [Google Scholar] [CrossRef]
- Morga, R. Micro-Raman spectroscopy of carbonized semifusinite and fusinite. Int. J. Coal. Geol. 2011, 87, 253–267. [Google Scholar] [CrossRef]
- Bai, B.; Guo, Q.; Li, Y.; Hu, X.; Ma, J. Catalytic gasification of crushed coke and changes of structural characteristics. Energy Fuels 2018, 32, 3356–3367. [Google Scholar] [CrossRef]
- Liu, M.; Bai, J.; Kong, L.; Bai, Z.; He, C.; Li, W. The correlation between coal char structure and reactivity at rapid heating condition in TGA and heating stage microscope. Fuel 2020, 260, 116318. [Google Scholar] [CrossRef]
- Guo, H.; Fu, Q.; Zhang, L.; Liu, F.; Hu, Y.; Zhang, H.; Hu, R. Sulfur K-edge XAS study of sulfur transformation behavior during pyrolysis and co-pyrolysis of biomass and coals under different atmospheres. Fuel 2018, 234, 1322–1327. [Google Scholar] [CrossRef]
- Zhou, Y.; Xu, P.; Cheng, H.; Liu, Q. Thermal phase transition of pyrite from coal. J. Therm. Anal. Calorim. 2018, 134, 2391–2396. [Google Scholar] [CrossRef]
- Ilyushechkin, A.Y.; Kochanek, M.; Lim, S. Interactions between oxygen carriers used for chemical looping combustion and ash from brown coals. Fuel Process. Technol. 2016, 147, 71–82. [Google Scholar] [CrossRef]
- Ma, C.; Zou, C.; Zhao, J.; He, J.; Zhang, X. Combustion behavior of chars derived from coal pyrolysis under a CO-containing atmosphere. Thermochim. Acta 2020, 688, 178576. [Google Scholar] [CrossRef]
- Diamond, R. X-ray studies of some carbonized coals. Philos. Trans. A Math. Phys. Eng. Sci. 1960, 252, 193–223. [Google Scholar]
- Yoshizawa, N.; Maruyama, K.; Yamashita, T.; Akimoto, A. Dependence of microscopic structure and swelling property of DTF chars upon heat-treatment temperature. Fuel 2006, 85, 2064–2070. [Google Scholar] [CrossRef]
- Keown, D.M.; Li, X.; Hayashi, J.-i.; Li, C.-Z. Characterization of the structural features of char from the pyrolysis of cane trash using Fourier Transform—Raman spectroscopy. Energy Fuels 2007, 21, 1816–1821. [Google Scholar] [CrossRef]
- Auguie, D.; Oberlin, M.; Oberlin, A.; Hyvernat, P. Microtexture of mesophase spheres as studied by high resolution conventional transmission electron microscopy (CTEM). Carbon 1980, 18, 337–346. [Google Scholar] [CrossRef]
- Kim, J.D.; Roh, J.-S.; Kim, M.-S. Effect of carbonization temperature on crystalline structure and properties of isotropic pitch-based carbon fiber. Carbon Lett. 2017, 21, 51–60. [Google Scholar] [CrossRef] [Green Version]
- Zhang, S.-Y.; Lu, J.-F.; Zhang, J.-S.; Yue, G.-X. Effect of pyrolysis intensity on the reactivity of coal char. Energy Fuels 2008, 22, 3213–3221. [Google Scholar] [CrossRef]
- Shenqi, X.; Zhijie, Z.; Jie, X.; Guangsuo, Y.; Fuchen, W. Effects of alkaline metal on coal gasification at pyrolysis and gasification phases. Fuel 2011, 90, 1723–1730. [Google Scholar] [CrossRef]
- Morga, R.; Jelonek, I.; Kruszewska, K.; Szulik, W. Relationships between quality of coals, resulting cokes, and micro-Raman spectral characteristics of these cokes. Int. J. Coal Geol. 2015, 144–145, 130–137. [Google Scholar] [CrossRef]
- Zubkova, V.V. Some aspects of structural transformations taking place in organic mass of Ukrainian coals during heating. Part 1. Study of structural transformations when heating coals of different caking capacity. Fuel 2005, 84, 741–754. [Google Scholar] [CrossRef]
- Kelemen, S.; Afeworki, M.; Gorbaty, M.; Cohen, A. Characterization of organically bound oxygen forms in lignites, peats, and pyrolyzed peats by X-ray photoelectron spectroscopy (XPS) and solid-state 13C NMR methods. Energy Fuels 2002, 16, 1450–1462. [Google Scholar] [CrossRef]
- Yan, W.; Li, S.; Fan, C.; Deng, S. Effect of surface carbon-oxygen complexes during NO reduction by coal char. Fuel 2017, 204, 40–46. [Google Scholar] [CrossRef]
- Shinn, J.H. From coal to single-stage and two-stage products: A reactive model of coal structure. Fuel 1984, 63, 1187–1196. [Google Scholar] [CrossRef]
- Xia, W.; Niu, C.; Ren, C. Enhancement in floatability of sub-bituminous coal by low-temperature pyrolysis and its potential application in coal cleaning. J. Clean Prod. 2017, 168, 1032–1038. [Google Scholar] [CrossRef]
- Li, T.; Zhang, L.; Dong, L.; Qiu, P.; Wang, S.; Jiang, S.; Li, C.-Z. Changes in char structure during the low-temperature pyrolysis in N2 and subsequent gasification in air of Loy Yang brown coal char. Fuel 2018, 212, 187–192. [Google Scholar] [CrossRef]
- Li, N.; Te, G.; Liu, Q.; Ban, Y.; Wang, Y.; Zhang, X.; Wang, J.; He, R.; Zhi, K. Effect of metal ions on the steam gasification performance of demineralized Shengli lignite char. Int. J. Hydrog. Energ. 2016, 41, 22837–22845. [Google Scholar] [CrossRef]
- Kloprogge, J.T.; Wood, B.J. Handbook of Mineral Spectroscopy: Volume 1: X-ray Photoelectron Spectra; Elsevier: Amsterdam, The Netherlands, 2020. [Google Scholar]
- Zhang, N.; Ejtemaei, M.; Nguyen, A.V.; Zhou, C. XPS analysis of the surface chemistry of sulfuric acid-treated kaolinite and diaspore minerals with flotation reagents. Miner. Eng. 2019, 136, 1–7. [Google Scholar] [CrossRef]


| Sample | Proximate Analysis (ad, wt %) | Ro/% | Ultimate Analysis (ad, wt %) | |||||||
|---|---|---|---|---|---|---|---|---|---|---|
| M | A | V | FC | C | H | O a | N | S | ||
| Coal A | 8.04 | 2.89 | 36.42 | 52.65 | 0.52 | 69.54 | 7.72 | 8.00 | 1.69 | 2.12 |
| Coal B | 6.76 | 1.59 | 31.72 | 59.93 | 0.56 | 77.14 | 4.23 | 7.68 | 1.49 | 1.11 |
| Coal C | 3.71 | 19.21 | 34.59 | 42.49 | 0.35 | 58.10 | 3.40 | 14.03 | 0.83 | 0.72 |
| Sample | SiO2 | Al2O3 | CaO | Fe2O3 | K2O | Na2O | MgO | TiO2 | SO3 | P2O5 |
|---|---|---|---|---|---|---|---|---|---|---|
| Coal ash A | 18.69 | 9.01 | 38.08 | 13.19 | 0.07 | 0.58 | 3.44 | 1.19 | 15.09 | 0.22 |
| Coal ash B | 18.96 | 11.35 | 37.05 | 6.27 | 0.16 | 1.13 | 3.92 | 0.62 | 18.56 | 0.30 |
| Coal ash C | 58.43 | 14.02 | 8.47 | 8.63 | 1.18 | 0.72 | 0.80 | 0.97 | 5.25 | 0.92 |
| Sample | Normalized Relative Content (%) of Carbon Functionalities | |||
|---|---|---|---|---|
| C–C/C–H (284.6 eV) | C–O (286.1 eV) | C=O (287.3 eV) | COOH (288.9 eV) | |
| A600 | 73.93 | 17.45 | 2.82 | 5.80 |
| A700 | 67.63 | 27.11 | – | 5.25 |
| A800 | 65.62 | 29.23 | 1.03 | 4.11 |
| A900 | 59.47 | 31.79 | 3.46 | 5.27 |
| A1000 | 65.88 | 33.08 | 0.60 | 0.44 |
| A1100 | 63.00 | 36.07 | 0.16 | 0.77 |
| B600 | 76.36 | 18.31 | 2.33 | 3.00 |
| B700 | 68.05 | 18.18 | 6.49 | 7.28 |
| B800 | 70.85 | 21.04 | 3.89 | 4.22 |
| B900 | 66.59 | 24.85 | 3.31 | 5.25 |
| B1000 | 70.62 | 19.50 | 4.87 | 5.01 |
| B1100 | 63.23 | 30.46 | 2.63 | 3.69 |
| C600 | 69.44 | 17.30 | 7.86 | 5.40 |
| C700 | 71.47 | 15.42 | 7.07 | 6.04 |
| C800 | 69.94 | 16.25 | 7.91 | 5.90 |
| C900 | 67.61 | 18.16 | 8.34 | 5.89 |
| C1000 | 71.19 | 15.84 | 7.38 | 5.59 |
| C1100 | 70.18 | 17.31 | 7.02 | 5.49 |
Publisher’s Note: MDPI stays neutral with regard to jurisdictional claims in published maps and institutional affiliations. |
© 2022 by the authors. Licensee MDPI, Basel, Switzerland. This article is an open access article distributed under the terms and conditions of the Creative Commons Attribution (CC BY) license (https://creativecommons.org/licenses/by/4.0/).
Share and Cite
Yin, Y.; Wu, Z.; Tao, J.; Qi, C.; Zhang, W.; Cheng, S. Investigation of the Evolution of the Chemical Structure of Bituminous Coals and Lignite during Pyrolysis. Crystals 2022, 12, 444. https://doi.org/10.3390/cryst12040444
Yin Y, Wu Z, Tao J, Qi C, Zhang W, Cheng S. Investigation of the Evolution of the Chemical Structure of Bituminous Coals and Lignite during Pyrolysis. Crystals. 2022; 12(4):444. https://doi.org/10.3390/cryst12040444
Chicago/Turabian StyleYin, Yanshan, Zihua Wu, Jianhang Tao, Caiwen Qi, Wei Zhang, and Shan Cheng. 2022. "Investigation of the Evolution of the Chemical Structure of Bituminous Coals and Lignite during Pyrolysis" Crystals 12, no. 4: 444. https://doi.org/10.3390/cryst12040444