Abstract
The Mengyin diamondiferous kimberlite cluster in Shandong province is one of the three major sources of natural diamond in China, where many brown diamonds are mined, but the genesis of their color is still controversial. In this paper, studies including microscopic examination, optical properties of orthogonal polarization, low temperature photoluminescence spectra, infrared spectra, Raman spectra, ultraviolet-visible absorption spectra, luminescence of cathodoluminescence, and transmission electron microscopy have been carried out on the uncut brown diamonds and their slice samples to constrain on the color genesis of brown diamond from the Mengyin deposit. The results show that the brown color is dominantly caused by plastic deformation, and some samples are also caused by non-deformation-related defects and inclusions.
1. Introduction
Coloration in diamond can principally be induced by defects, plastic deformation, atomic impurities, and radiation damage [1,2,3]. Among these colors, brown is the most commonly observed, with up to 98% of all mined color diamonds [3], owing their color to both non-deformation-related (NDR) and deformation-related (DR) defects [4,5]. Natural NDR brown diamonds mainly consist of CO2-beared and pseudo CO2-beared diamonds as well as certain hydrogen-rich diamonds [4]. Plastic deformation and lattice defects are likely in principle contributed to coloration of the DR brown diamonds [5,6,7], which can be well identified by various spectral features [8]. Natural DR diamonds are generally annealed brown color at a heat treatment above 1800 °C, and the intensity of the brown color is substantially reduced [5,9].
Brown is a composite spectral color that mixing red and green, orange and blue, purple and yellow, or just darkening red or orange of a diamond. As a result, brown diamonds often show hues of yellow, orange, green, and pink [5]. Brown in diamond is caused by a gradually increasing absorption coefficient towards shorter wavelengths such as blue [3]. The brown color of diamond is generally considered to be the result of plastic deformation of diamond under high temperature and high pressure in the mantle [10]. Nitrogen-free type II diamonds are commonly originated from much deeper mantle, and have a higher proportion of brown color than those of nitrogen bearing type I diamonds [10]. Brown coloration has been observed in both type I and II diamonds, suggesting that a brown color is an unobvious direct correlation with nitrogen content in diamond [3]. Plastic deformation results in dislocation of atoms and formation of vacancy groups in diamond lattice. These vacancy clusters absorb some light resulting in the appearance of brown in color, which range in intensity from light to very dark hues. The surface of a brown diamond usually shows parallel lines, which are called deformation lines and can extend to adjacent crystal planes. This is the surface representation of the dislocations, which are caused by the displacement and displacement of carbon atoms along the crystal plane (glide–plane) [5]. These brown diamonds are damaged by dislocation on the glide-plane, and structural defect centers are formed after the valence bond broken. The absorption of light by these defects can result in rose-purple and brown on the glide planes [11]. Line defects mainly exist in the form of {111} plane slip caused by plastic deformation [12,13]. Brown becomes more intense along individual faces, creating mottled colors or bands within the diamond. In the process of diamond reabsorption, the deformation lines become more prominent. A diamond commonly exhibits up to four sets of deformation lines in different orientations that coincide with four possible directions of the octahedral plane. At the intersection of the glide-planes with the diamond surface, the diamond is more resistant to be resorbed, so these intersections become more distinct during resorption [10,14].
Globally, the Argyle diamondiferous lamproite cluster located in the margin of the Kimberley Craton in northwest Australia is one of the world’s largest sources of color diamonds, the output ratio of brown diamond reaches up to 80% of all outputted diamonds [15]. Comparatively, the Mengyin diamond deposit occurred in the North China Craton is the most important mine of brown diamond in China [12,16,17,18]. However, the wall rock of the Mengyin diamond is kimberlite, which is different from those of the Argyle lamproite, and it is not clear whether the coloration in the Mengyin brown diamonds is caused by plastic deformation and defects that are the same as those of the Argyle brown diamonds. Many studies have been conducted on the genesis of brown diamonds from Hunan and Liaoning in China, and several color genetic models have been proposed mainly including plastic deformation and structure defects [3,5,12,19,20,21,22,23,24,25,26,27,28,29,30], irradiation [31], color centers [2,32], metallogenic energy [33], and inclusions [2]. However, the origin of coloration of the Mengyin brown diamond in Shandong province has hardly been reported.
In this study, we present the microscopic features, polarizing microscopy analysis, cathodoluminescence (CL) images, ultraviolet-fluorescence spectra, infrared spectra, low temperature photoluminescence spectra, Raman spectra, ultraviolet-visible spectroscopy (UV-Vis) absorption spectra, and transmission electron microscopy (TEM) studies of brown diamonds from the Mengyin deposit. These new data and interpretation provide new constraints on the coloration of the Mengyin brown diamond.
2. Materials and Methods
2.1. Materials
Currently, diamondiferous kimberlites with industrial value in China are merely produced in Mengyin of Shandong province and Wafangdian (also named Fuxian) of Liaoning Province; both deposits occur in the eastern part of the North China Craton. From south to north, the Mengyin deposit consists of three diamondiferous kimberlite belts of Changmazhuang, Xiyu, and Poli [34]. Brown diamonds mainly produce from the Shengli No. 1 kimberlite mine which includes large and small pipes in the Changmazhuang kimberlitic belt. The distance between the two pipes is about 20 m on the surface, and the large and small pipes merge into one pipe below the vertical depth of 250 m. The large pipe is mainly composed of coarse-grained porphyritic kimberlite and kimberlitic breccia with a small amount of serpentinized cataclasite. The northwestern section of the small pipe is mainly composed of coarse-grained porphyritic kimberlite with a relatively high diamond-bearing grade of 200–2000 mg/m3. The southeast section is mainly ore-bearing kimberlitic breccia, and its grade exceeds the industrial requirements [12].
2.2. Methods
The studied samples of brown diamond in this paper were investigated from the Shengli No. 1 kimberlite mine in the Mengyin deposit. Twenty-five grains were carefully screened from 60 grains of raw diamond samples, and each was cut into a slice with two large parallel faces and polished to the center of crystals with about 1 mm in thickness in the Qingdao Jinghua Jewelry Co., Ltd. During this cutting process, sample MY-12 cut into two pieces would be named MY-12-1 and MY-12-2, respectively. Sample MY-27 was split into two pieces from its core, and both were named MY-27-1 and MY-27-2, respectively. Although two grains of sample MY-36 were grinded, one grain was not grinded on one side, so only one grain was selected and named MY-36-1; two grains of sample MY-43 were grinded and named MY-43-1 and MY-43-2, respectively; Sample MY-46 also yielded two grains which were designated as MY-46-1 and MY-46-2, respectively. Moreover, samples DB3 and DB5 with special purple in CL images [12] were included. Thus, the total 29 slice samples were analyzed.
Microscopic examination and crossed-polarizing observation were acquired in the Gem Laboratory of China University of Geosciences (Beijing), China. The CL is performed on CL-2 gemstone cathodoluminescence instrument in the Gemmological Institute, China University of Geosciences (Wuhan), China. The test was recorded at room temperature with voltage range of 2–5 kV and the current range of 0.8–2.5 mA.
The infrared spectra were obtained by the Nicolet Magana-IR 750 infrared spectrometer (Nicolet Magana Co., Madison, WI, USA) of the National Jewelry and Jade Quality Supervision and Inspection Center, Beijing, China with a resolution of 3.857 cm−1, 64 scans of each spectrum, and a scanning range of 6000–400 cm−1.
Low-temperature photoluminescence measurements were performed by the Infrared-Raman laboratory, Institute of Physics, Chinese Academy of Sciences, Beijing, China. The instrument is a HR800 semiconductor laser produced by JY Company in Paris, France. The excitation wavelength is 532 nm, which is equivalent to 514 nm excited by argon ions, the power is 3 MW, the excitation wavelength range is 532–850 nm, and the spot diameter is 2 μm.
The Raman spectra of 29 samples of brown diamonds were analyzed by the Renishaw Raman 1000 laser Raman spectrometer (Renishaw Trading Company Ltd., London, UK) of National Jewelry and Jade Quality Supervision and Inspection Center, Beijing, China, with resolution of 4 cm−1, power supply voltage of 220 V, and current of 10 A. The excitation source is 514.5 nm laser of argon ion laser with scanning time of 20 s, cumulative number of 1, and scan range from 4000 to 100 cm−1.
The UV-Vis absorption spectra were obtained in the Gem Research Laboratory of China University of Geosciences (Beijing), China. The test instrument is a UV-2000 ultraviolet-visible spectrophotometer manufactured by Lab Tech, Beijing, China. Wavelength range is 400–700 nm for visible, 200–900 nm for UV-visible. Scanning speed is fast. Record width is 2.0. Slit width is 2 nm. Room temperature is 24 °C. The measurement method is Abs/T%.
The TEM test was conducted in the Geoscience Test Center of China University of Geosciences (Beijing), China, and the test instrument is an lky-AB ion etching sample low-temperature thinning instrument (Shenyang, China). A representative sample MY-38 (yellowish brown in color) was polished twice to 0.2 mm, and a disc with a diameter of about 3 mm was cut and perforated by argon ion bombardment for 95 h. The edge of the hole is thinned to a thickness that the electron beam can penetrate for electron microscope observation and photography. The H-8100 electron microscope is made by Hitachi Limited (Tokyo, Japan), and the working accelerating voltage is 200 kV. The instrument is equipped with a Philp EDAX-4 X-ray spectrometer (EDS), Amsterdam, Netherlands, whose detector has an ultra-thin window and can identify all elements from boron (atomic number 5) to uranium (atomic number 92). At the same time of direct observation of TEM samples, the micro-area composition analysis test of inclusion binding EDS was carried out. Additionally, the weak beam dark field technology of transmission electron microscope is used to take pictures, which greatly improves the resolution.
3. Results
3.1. Microscopic Magnification Examination
Diamonds exhibit a wide range of textures that are linked to growth and resorption processes when the diamonds were residing in the Earth’s mantle, and ascend to the Earth’s surface in deeply derived mantle magmas, such as kimberlites and lamproites. Thus, the relationship between surface textures of diamonds can be used to reconstruct the sequence of events that have affected the diamonds since their formation [10].
The 60 grains of brown diamond in this study show complex patterns of growth and rough corroded surface features. Multiple imbricated plates with a stepped appearance, raised disks, circular pits, parallel and tightly-spaced grooves and plastic deformation line are robust pieces of evidence that the brown diamonds from the Mengyin deposit have suffered from strong dissolution and resorption. Two crossed pinnate and “V” shaped fissures with an angle of 45°, black punctated and cloudy-shaped inclusions are observed in the studied diamonds. The overall color of the rough brown diamonds is relatively uniform, and no obvious color bands are found (Figure S1). However, after being cut into parallel slices, obviously uneven brown is observed. For example, a group of brown bands are exhibited in the slice samples MY-35, MY-38, and MY-40, the plane of which is parallel to the {111} lattice plane. In the slice of sample MY-25, the color is distributed in a ring shape, the color in the core was brown, and gradually became lighter along its periphery. Samples MY-30 and MY-47 have uniform color, but dark inclusions rimmed brown patches were observed in their slices.
Generally, a few of slices of brown diamonds are uniform in color, and most of them are unevenly distributed in color shown the following features (Figure 1, Table S1):
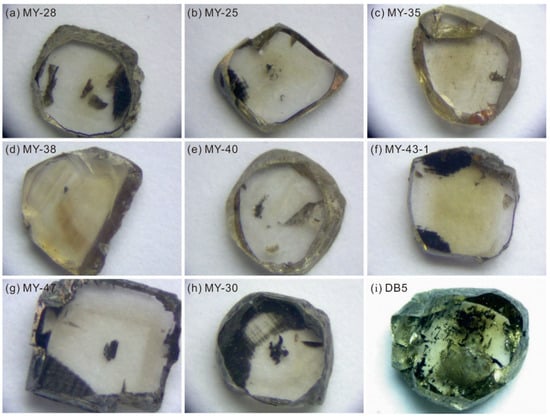
Figure 1.
The color features of brown diamond from the Mengyin deposit. (a) Unevenly colored, two black micro-inclusions surrounded by light brown color patches in the right sector compared to the colorless sector to the left (maximum diameter abbreviated as MD 3.64 mm); (b) Uneven in color, abundant black inclusions surrounded by brown color patches in the core and lighter color sector along the periphery (MD 3.29 mm); (c) Brown bands are straight and thin in the core, and run through the whole sample from the upper right to the lower left (MD 3.63 mm); (d) Brown bands are wide and run through the whole sample from the upper right to the lower left (MD 3.66 mm); (e) Faint brown bands occur in the core, the brown color patch and small inclusions such as microfractures and the tiny particles so abundant in three brown zones (MD 2.77 mm); (f) Evenly brown patch rimmed by colorless sides to the left and right (MD 3.09 mm); (g) Black inclusions surrounded by colorless sector in the core, square-shaped brown patches in the mantle rimmed by colorless sector (MD 2.60 mm); (h) MY-30 color is not uniform, with Black inclusions in the core rimmed changing colors from colorless to light brown (MD 2.80 mm); (i) Abundant black inclusions and fractures associated with the brown zones (MD 2.74 mm).
- (1)
- (2)
- The color is divergently distributed from core to rim. The brown color of MY-25 gradually becomes lighter from core to rim (Figure 1b).
- (3)
- (4)
- Brown is scattered in a circular zone. Sample MY-47 has an obvious brown color band, which is distributed in a ring shape. The brown band of the sample MY-47 is the darkest and becomes lighter from the center to both wings (Figure 1g). Black inclusions in the core rimmed changing colors from colorless to light brown in sample MY-30. Remarkably, the color near the rim displays as slightly darker, and shows transitional color from light brown to brown, and it is interspersed in a vague ring (Figure 1h). Abundant black inclusions and fractures associated with the brown zones are scattered in the whole slice sample DB5 (Figure 1i) (Table S1).
3.2. Properties of Orthogonal Polarization
Birefringence that is generally linked to defects and impurities has been recognized in diamond as an anomalous optical property for a homogenous cubic mineral. It provides us with one of the most effective ways to identify specific diamond types and interpret its formation stages [35]. The abnormal birefringence patterns of brown diamond from the Mengyin deposit under crossed-orthogonal polarizer are mainly divided into six types (Figure S2):
- (1)
- Flat extinction strip
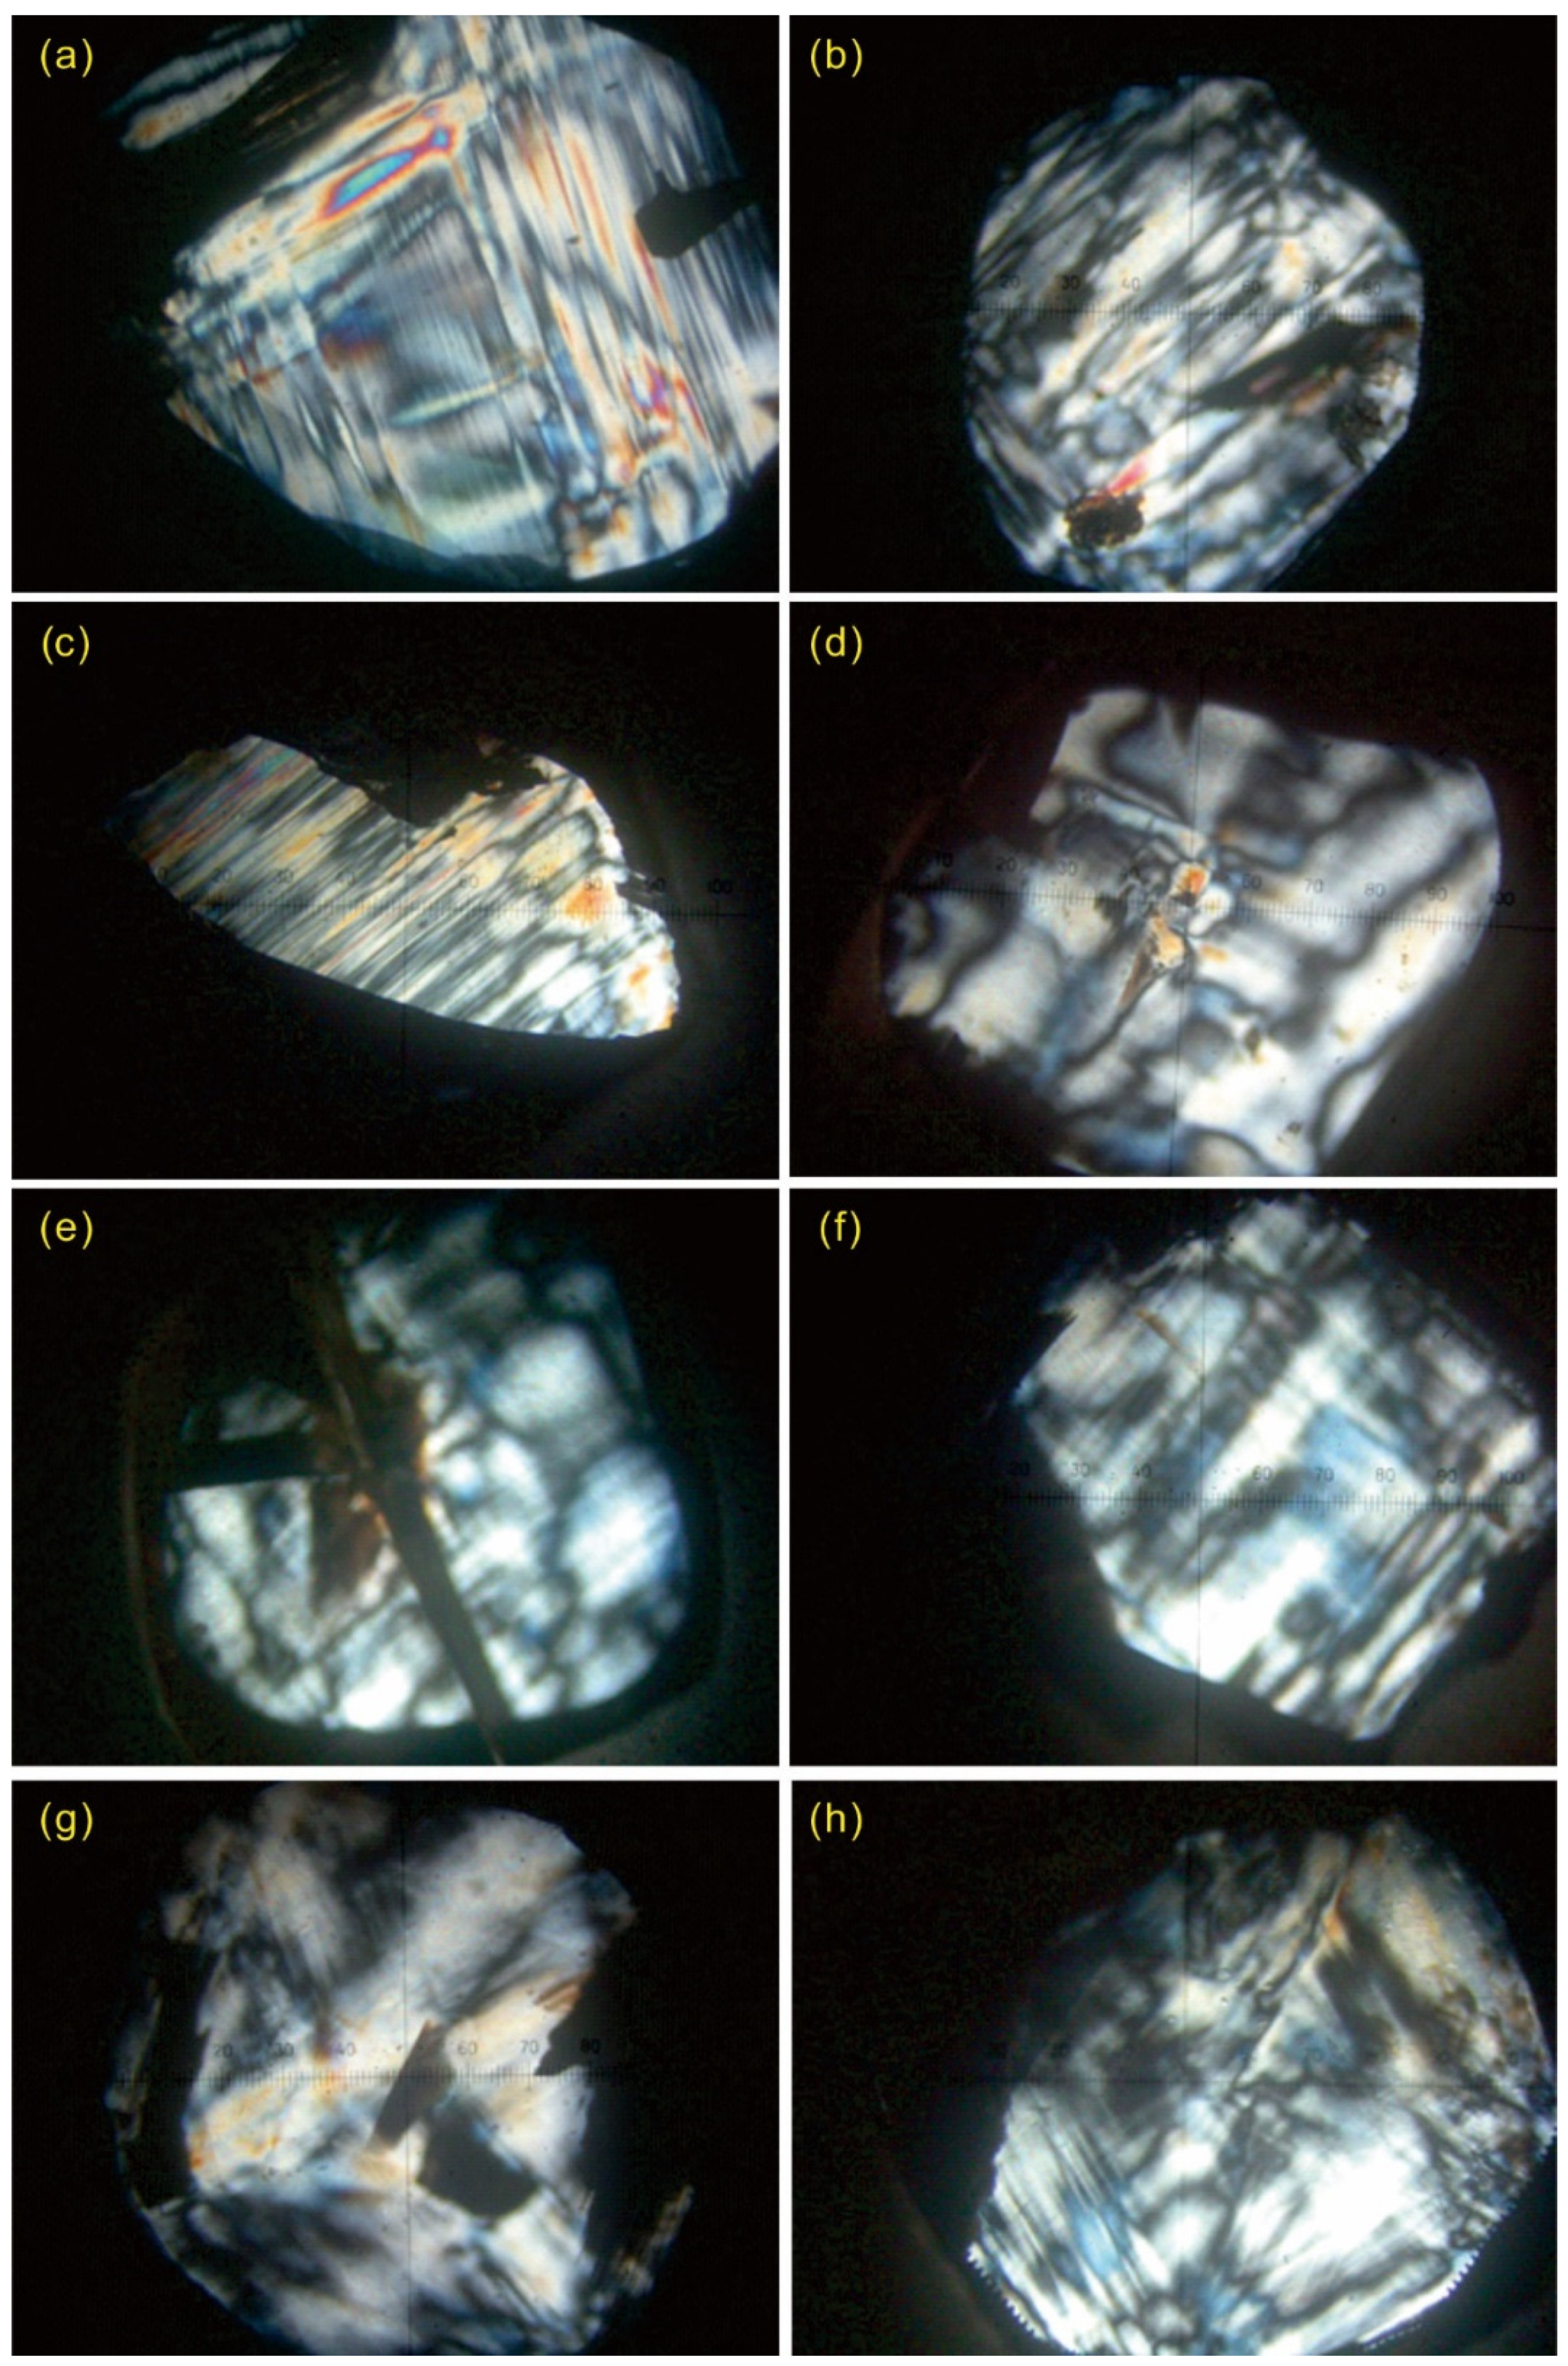
Many samples are observed as a set of parallel or two sets of intersecting extinction stripes under cross-polarized light. For example, sample MY-35 shows a straight and dense extinction band from the upper left to the lower right, which is consistent with the direction of the brown band developed on it (Figure 2a); Sample MY-40 has an extinction band from the upper right to the lower left in the upper left corner, which is consistent with the direction of the brown band (zone) developed on it (Figure 2b); Sample MY-43-2 has a dense, flat extinction band from the upper right to the lower left (Figure 2c).

Figure 2.
Extinction and interference patterns of representative samples of brown diamond slices from the Mengyin deposit under crossed polarizing filters. (a) A high level of interference color, straight extinction band and bow-tie extinction in MY-35; (b) An extinction band with poor straightness from the upper right to the lower left in the upper left corner in MY-40, where bow-tie extinction can be observed, and the interference color around the inclusion in the lower left corner is distinct; (c) A dense and straight extinction band, from the upper right to the lower left in MY-43-2, the interference color level is different, the right half shows obvious bow-tie extinction, and the overall interference color level is distinct; (d) A high interference color around the inclusion showing a stepped radial extinction pattern, and a bowtie-like extinction pattern in MY-25; (e) Burn marks around the fracture of sample MY-27, with obvious lattice-like extinction (tatami) and bowtie-like extinction; (f) Visible grid matting (tatami) and bow-tie matting patterns in MY-47; (g) A cross-shaped extinction pattern with high interference color in the cross-shaped distribution area in MY-28; (h) A set of extinction strips are visible in the lower left corner of MY-36-1. The bow-tie extinction pattern is more pronounced, and the oblique cross pattern is faintly observed.
- (2)
- Radial extinction pattern
The abnormal extinction pattern is mainly caused by the uneven impurity content and the existence of cracks. Occasionally, many micro-cracks are produced around a relatively large inclusion, showing a radial extinction phenomenon. For example, sample MY-25 has the inclusions in the center, and shows a stepped radial extinction pattern (Figure 2d).
- (3)
- Fine lattice-like matte pattern (“tatami” in shape)
Samples MY-27 (Figure 2e) and MY-47 (Figure 2f) display two groups of straight extinction bands under cross-polarized light, and both samples show special fine lattice-like extinction, or “tatami” extinction.
- (4)
- Cross extinction pattern
It is mainly caused by the uneven distribution of impurities, and sometimes the volume stress also produces a similar cross-shaped extinction pattern. For example, a cross-shaped extinction pattern is visible in sample MY-28 (Figure 2g). Sample MY-36-1 shows a faint oblique cross-shaped extinction pattern (Figure 2h).
- (5)
- Bow-tie extinction pattern
Due to the presence of inclusions and fractures, bow-tie extinction patterns are observed locally under cross-polarized light, such as samples MY-47 (Figure 2f) and MY-43-2 (Figure 2c).
- (6)
- Combined and superposing extinction pattern
The different forms and combinations of anomalous birefringence in diamonds are commonly considered as the result of growth stress and post-growth plastic deformation [2,3]. Therefore, there is not only a single extinction pattern for one sample, but also a superposition combination of different patterns. For example, MY-25 (Figure 2d), MY-27 (Figure 2e), MY-35 (Figure 2a), MY36-1 (Figure 2h), MY-40 (Figure 2b), MY-43-2 (Figure 2c), and MY-47 (Figure 2f) show the superposed combination of different patterns.
3.3. Cathodoluminescence Features
Cathodeluminescence (CL) is widely used to study the luminescence of diamonds and their homogeneity. The luminescence primarily occurs upon irradiation by medium- and high-energy electrons light, which depends on the presence of impurities, and intrinsic defects is a kind of surface physical phenomenon, which is produced by the electron with certain energy bombarding the surface of fluorescent material, so that the electric energy is converted into light radiation. Those energy-carrying electrons are generally emitted from the cathode and accelerated by the anode voltage; this luminescence is called cathodeluminescence [36] and references therein.
The internal textures of diamond are shown mainly through changes in the color and intensity of CL. According to the observed CL pattern characteristics, the internal growth textures of brown diamonds can be divided into the following types: (1) speckled structure; (2) simple growth band structure; (3) complex growth band structure; and (4) “agate like” growth structure. The CL patterns of natural diamonds are complexed and contrasted in shape and color, such as regular zoning, multi-stage zoning, erosion and etching features, and irregular brecciated patchy. The color of the CL image is mainly blue, and includes non-luminous and yellow-green luminous areas [12]. CL images of diamonds can be used to (1) reveal the growth structure, growth mechanism, growth stage, and process of the diamond, (2) provide information on the plastic deformation of diamond and the distribution of CO2, (3) verify and interpret the related results of diamond micro-area infrared spectrum analysis, stable isotope analysis, and geological age. (4) These inhomogeneities provide crucial and valuable evidence for distinguishing natural diamonds from those of artifacts [37].
The CL colors of 27 brown diamonds are mainly blue and yellow-green in color with complex and heterogeneous patterns. The CL images of raw diamond are mainly blue-white, blue-green, and yellow-green (Figure 3e,i,k). Comparatively, pure purple is occasionally observed in a few samples [12] (Figure 3a,b,g). The CL discrepancies of raw diamond have limited contrast, but some growth rings can be observed. For example, CL images of MY-38 and MY-47 show triangular rings (Figure 3c,i).
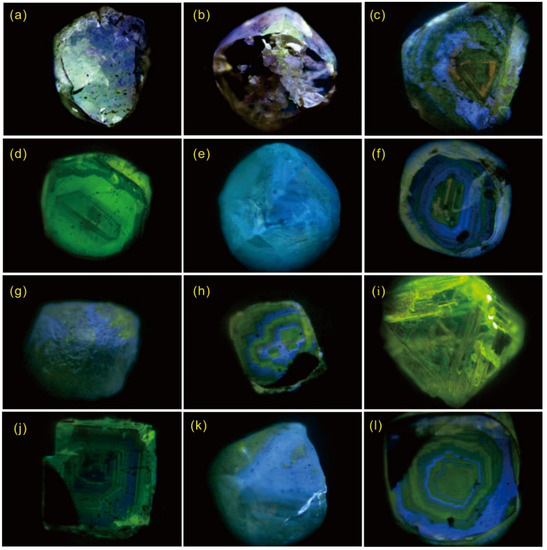
Figure 3.
Cathodoluminescence features of brown diamonds from the Mengyin deposit. (a) Uncut sample DB5 showing purple and yellow-green luminescence; (b) Uncut sample DB3 dominantly showing purple; (c) Slice sample MY-38 has blue-violet, green, and tiny brown triangular growth-bands and mottled structure; (d) Slice sample MY-43-1 showing yellow-green with brown straight growth bands; (e) Uncut sample MY-40 is blue-green; (f) Slice sample MY-40 showing blue-violet, yellow-green agate-like growth bands; (g) Uncut sample MY-41 with a lilac luminous image; (h) Slice sample MY-41 exhibits yellow-green luminescence, and has blue ladder-like irregular growth zonation; (i) Uncut sample MY-47 showing yellow-green luminous and triangular girdle; (j) Slice sample MY-47 mainly displaying green-blue agate-like growth zone; (k) Uncut sample MY-36 has blue-green luminescence; (l) Slice sample MY-36-1 mainly showing yellow-green and blue, with an agate-like growth zone.
According to the CL contrasting patterns of the slice samples, internal growth structures of the brown diamond can be divided into four types: (1) mottled structure, such as the mottled pattern shown in sample MY-38 (Figure 3c); (2) simple growth zonal structure from sample MY-43-1 showing a brown straight growth zone (Figure 3d); (3) Complex growth zone structure, such as multiple complex octahedral blue growth zones in sample MY-40 (Figure 3f). Sample MY-41 shows multiple blue step-like rhombohedral dodecahedral growth zonings composed of blue luminescent regions of different shades (Figure 3h); (4) The “agate-like” growth structure shown as in samples MY-36-1 and MY-47 (Figure 3j,l).
3.4. Infrared Spectrum Features
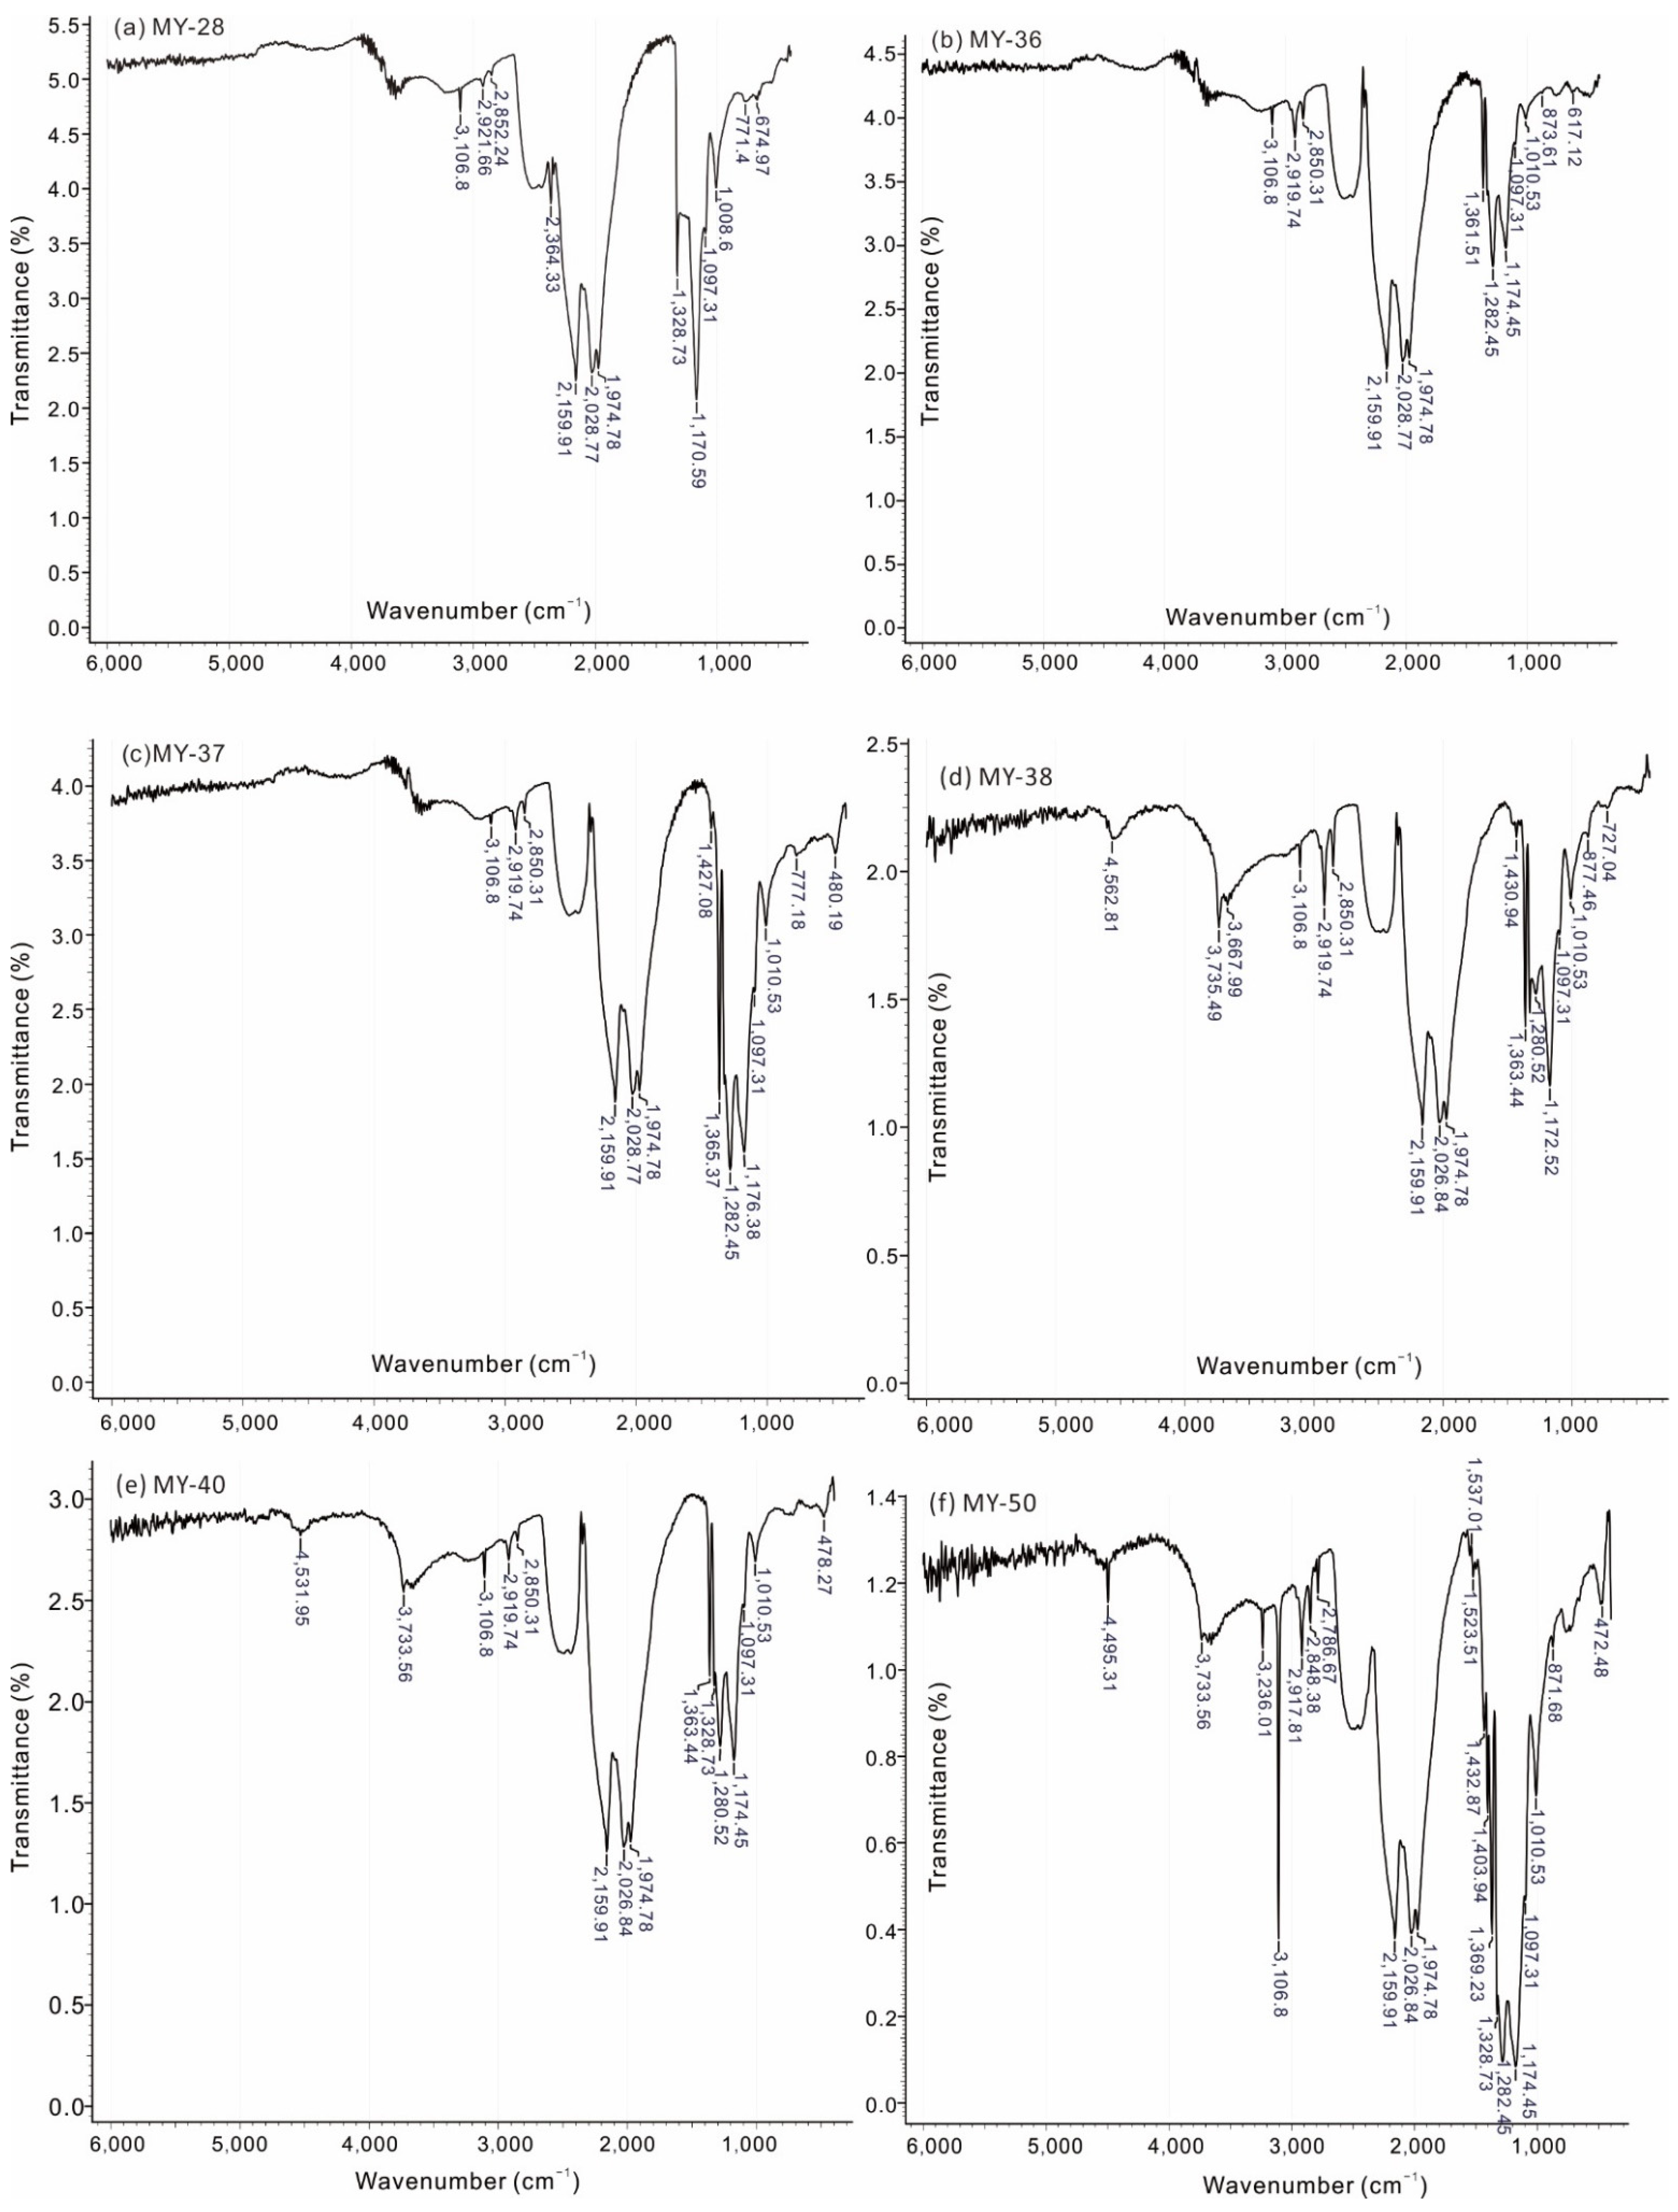
The ability of infrared spectroscopy to identify the types of diamond and number of different chemical functional groups present at a surface in a nondestructive manner has contributed to its widespread application [38]. The position and classification of the infrared absorption peaks of brown diamond from the Mengyin deposit are shown in Table S2. Except for samples MY-08, MY-25, and MY-46, the other 20 samples are shown more or less absorption peaks attributed to {111} plane slip, including 1427.08 cm−1, 1328.73 cm−1, 1010.53 cm−1, and 1097.31 cm−1 [39,40,41].
The infrared spectra of samples MY-8, MY-12, MY-17, MY-20, MY-30, MY-35, MY-36, MY-37, MY-38, MY-40, MY-41, MY-44, MY-45, MY-47, and MY-50 are characterized by a strong absorption peaks of 1175 cm−1, 1282 cm−1 and between 1363 and 1375 cm−1, which is a typical absorption peak of the mixed type of IaA and IaB diamond, namely IaAB type. Samples MY-43 and MY-48 have a weak absorption peak near 1282.52 cm−1, which is a typical feature of the IaA type diamond. Samples MY-21, MY-27, and MY-28 have a different intensity absorption peak at 1170.59 cm−1, which is evidence to be classified as an IaB type. Samples MY-21 and MY-27 have absorption peaks caused by platelet nitrogen at 1369.23 cm−1 and 1363.44 cm−1, respectively [39,40,41]. The infrared spectra of samples MY-03, MY-25, and MY-46 showing that there is almost no absorption in the range from 1400 to 1100 cm−1, which can be classified as type IIa. The peak values of 1326.82 to 1328.19 cm−1 deviate significantly compared with typical value of 1332 cm−1, as well as with those of brown diamonds from the Mengyin deposit showing the range from 1331 to 1330 cm−1 (Figure 4) [12]. Therefore, the shift may be rather due to heating during the spectroscopy.
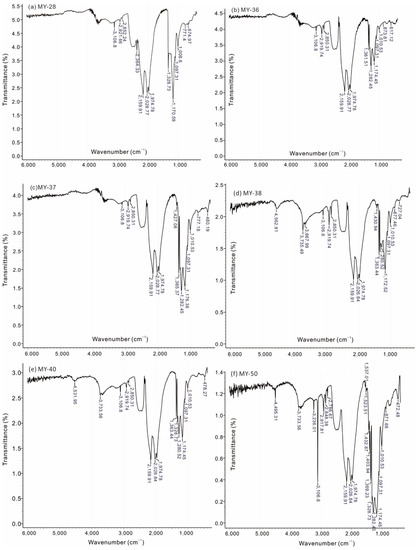
Figure 4.
IR Spectra of representative brown diamonds from the Mengyin deposit.
In general, most of the studied 23 brown diamond samples are IaAB type (15 grains), followed by IaB (3 grains), IIa type (3 grains), and IaA type (2 grains) (Table S2). Therefore, it can be inferred that the brown diamonds in the Mengyin deposit are dominated by type IaAB. The result is consistent with a global overview that the majority of natural crystals belong to the transitional type IaAB [42,43]. Baseline correction, quantitative calculation and analysis of nitrogen concentration, nitrogen aggregation state, and model temperature for the 15 IaAB type diamond samples were carried out by the software of QUIDDIT3 [44]. The nitrogen contents of A- and B-centers were calculated from absorption peaks at the frequencies of 1282 cm−1 and 1175 cm−1, respectively. The absorption coefficients for A- and B-centres are taken from references [43,45]. Model temperatures are determined from both nitrogen aggregation [46,47] and platelet degradation [44]. The total nitrogen contents NT of 15 brown diamond samples show a large range from 26 to 992 ppm with the average of 378 ppm. The proportion of aggregated nitrogen NB% of the studied samples obviously varies from 27% to 98% with an average of 60%. The model temperature ranges from 1118 to 1237 °C (average 1160 °C) with the diamond formation age of 3 Ga, which is similar to most peridotitic diamonds worldwide, or from 1130 to 1251 °C (average 1172 °C) with the diamond formation age of 1.8 Ga (Table S3).
3.5. Low-Temperature Photoluminescence Spectrum Features
Photoluminescence (PL) is the radiation emitted by the relaxation and recombination process of electrons excited by photons. A simple luminescence process results from the electronic transition between the conduction and valence bands and subsequent relaxation. The transition between electronic states or between electronic states caused by impurities or lattice defects allows sensitive detection and characterization of such perturbations [48]. PL is a mature tool for studying diamond, and mainly includes constant temperature PL that is excited by light waves at 388 nm at 300 K, and low temperature PL that is excited by a 514.5 nm wavelength (argon ion) or semiconductor laser at liquid nitrogen temperature. This study is carried out by the later method.
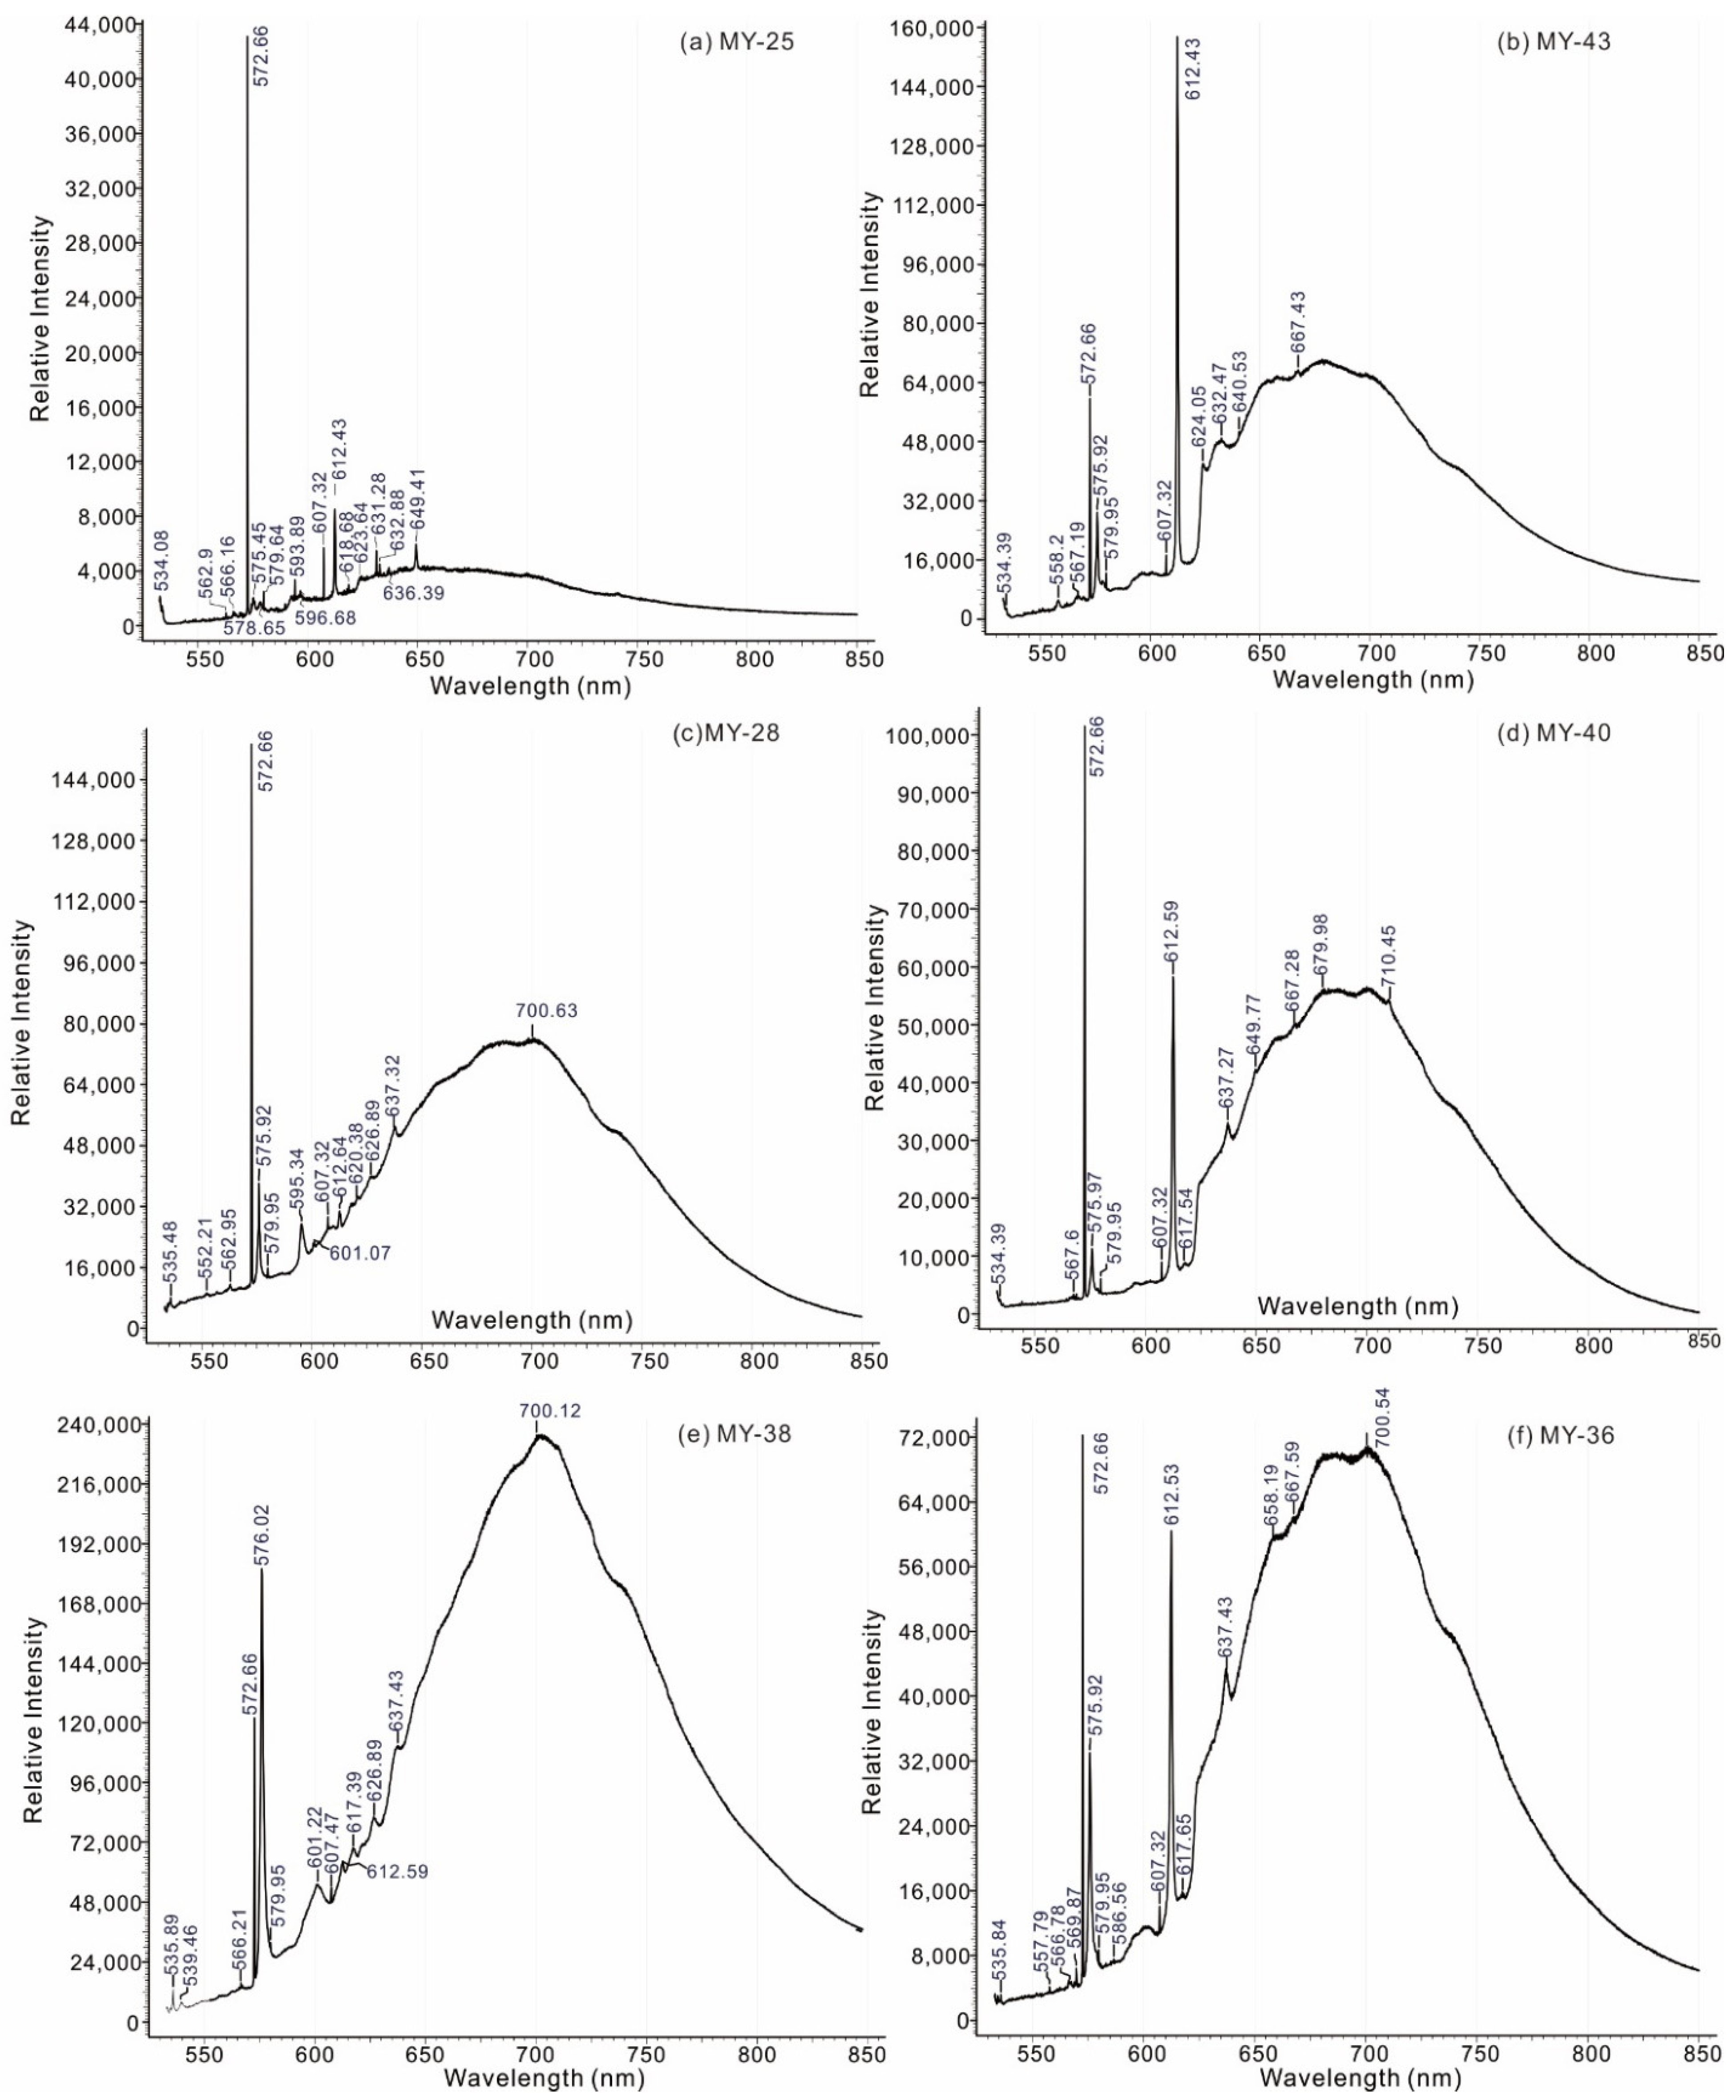
Six samples of brown diamond slices are analyzed for low-temperature photoluminescence. The results show that nearly all the samples basically have characteristic peaks of 535 (534) nm, 572.66 nm, 575.92 nm, 566 (567) nm, 579.95 nm, 607.32 nm, 612.59 nm, and 637 nm. Some samples also show peaks at 595 nm, 632 nm, and 649 nm. The intensity of their characteristic peaks of 572.66 nm, 575.92 nm, 612.59 nm, and 637 nm are strong; by contrast, the 535 (534) nm, 566 (567) nm, 579.95 nm, and 607.32 nm are weak (Table S4 and Figure 5).
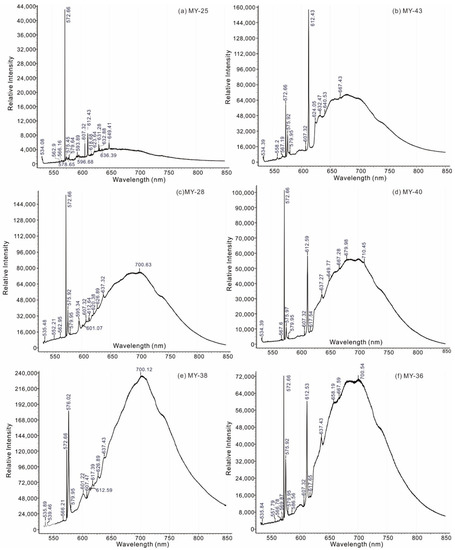
Figure 5.
Low Temperature Photoluminescence diagrams of representative brown diamonds from the Mengyin deposit under liquid nitrogen conditions.
Moreover, samples MY-25 and MY-36-1 have obviously characteristic peaks at 617 (618) nm. Samples MY-28 and MY-38 exhibit a characteristic peak of 626.89 nm. The strong emission peaks of 572.66 nm and 612.5 nm are observed in all studied samples.
3.6. Raman Spectral Features
Raman spectroscopy is a non-destructive tool for the structural characterization of carbons that uses the scattering spectrum obtained by inelastic collision between photons and molecules to study the microstructure of molecules or substances [49]. It is widely employed to characterize the lattice dynamics of diamond.
The Raman spectrum peaks of brown diamond from the Mengyin deposit are shown in Table S5 and Figure 6. Diamond with a perfect lattice commonly has a characteristic Raman peak of 1332 cm−1 [50]. The intrinsic peaks of the brown diamond from the Mengyin deposit generally drift to the low wavenumber, and present a small Raman spectrum range from 1326.82 to 1328.19 cm−1. In this study, we found that samples MY-28, MY-35, MY-36-1, MY-38, and MY-40 had some regular secondary peaks, such as 794 cm−1, 2084 cm−1, and 3120 cm−1.
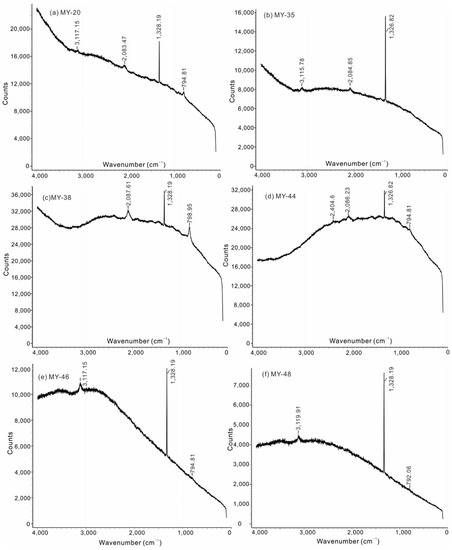
Figure 6.
Raman Spectra of representative brown diamonds from the Mengyin deposit.
3.7. Ultraviolet-Visible Absorption Spectrum Features
The UV-Vis is a method of analyzing and determining the radiation in the spectral region of 10–800 nm absorbed by the molecules of substances. The molecular absorption spectra are produced by the transition of electrons in valence electrons and molecular orbitals between electron energy levels.
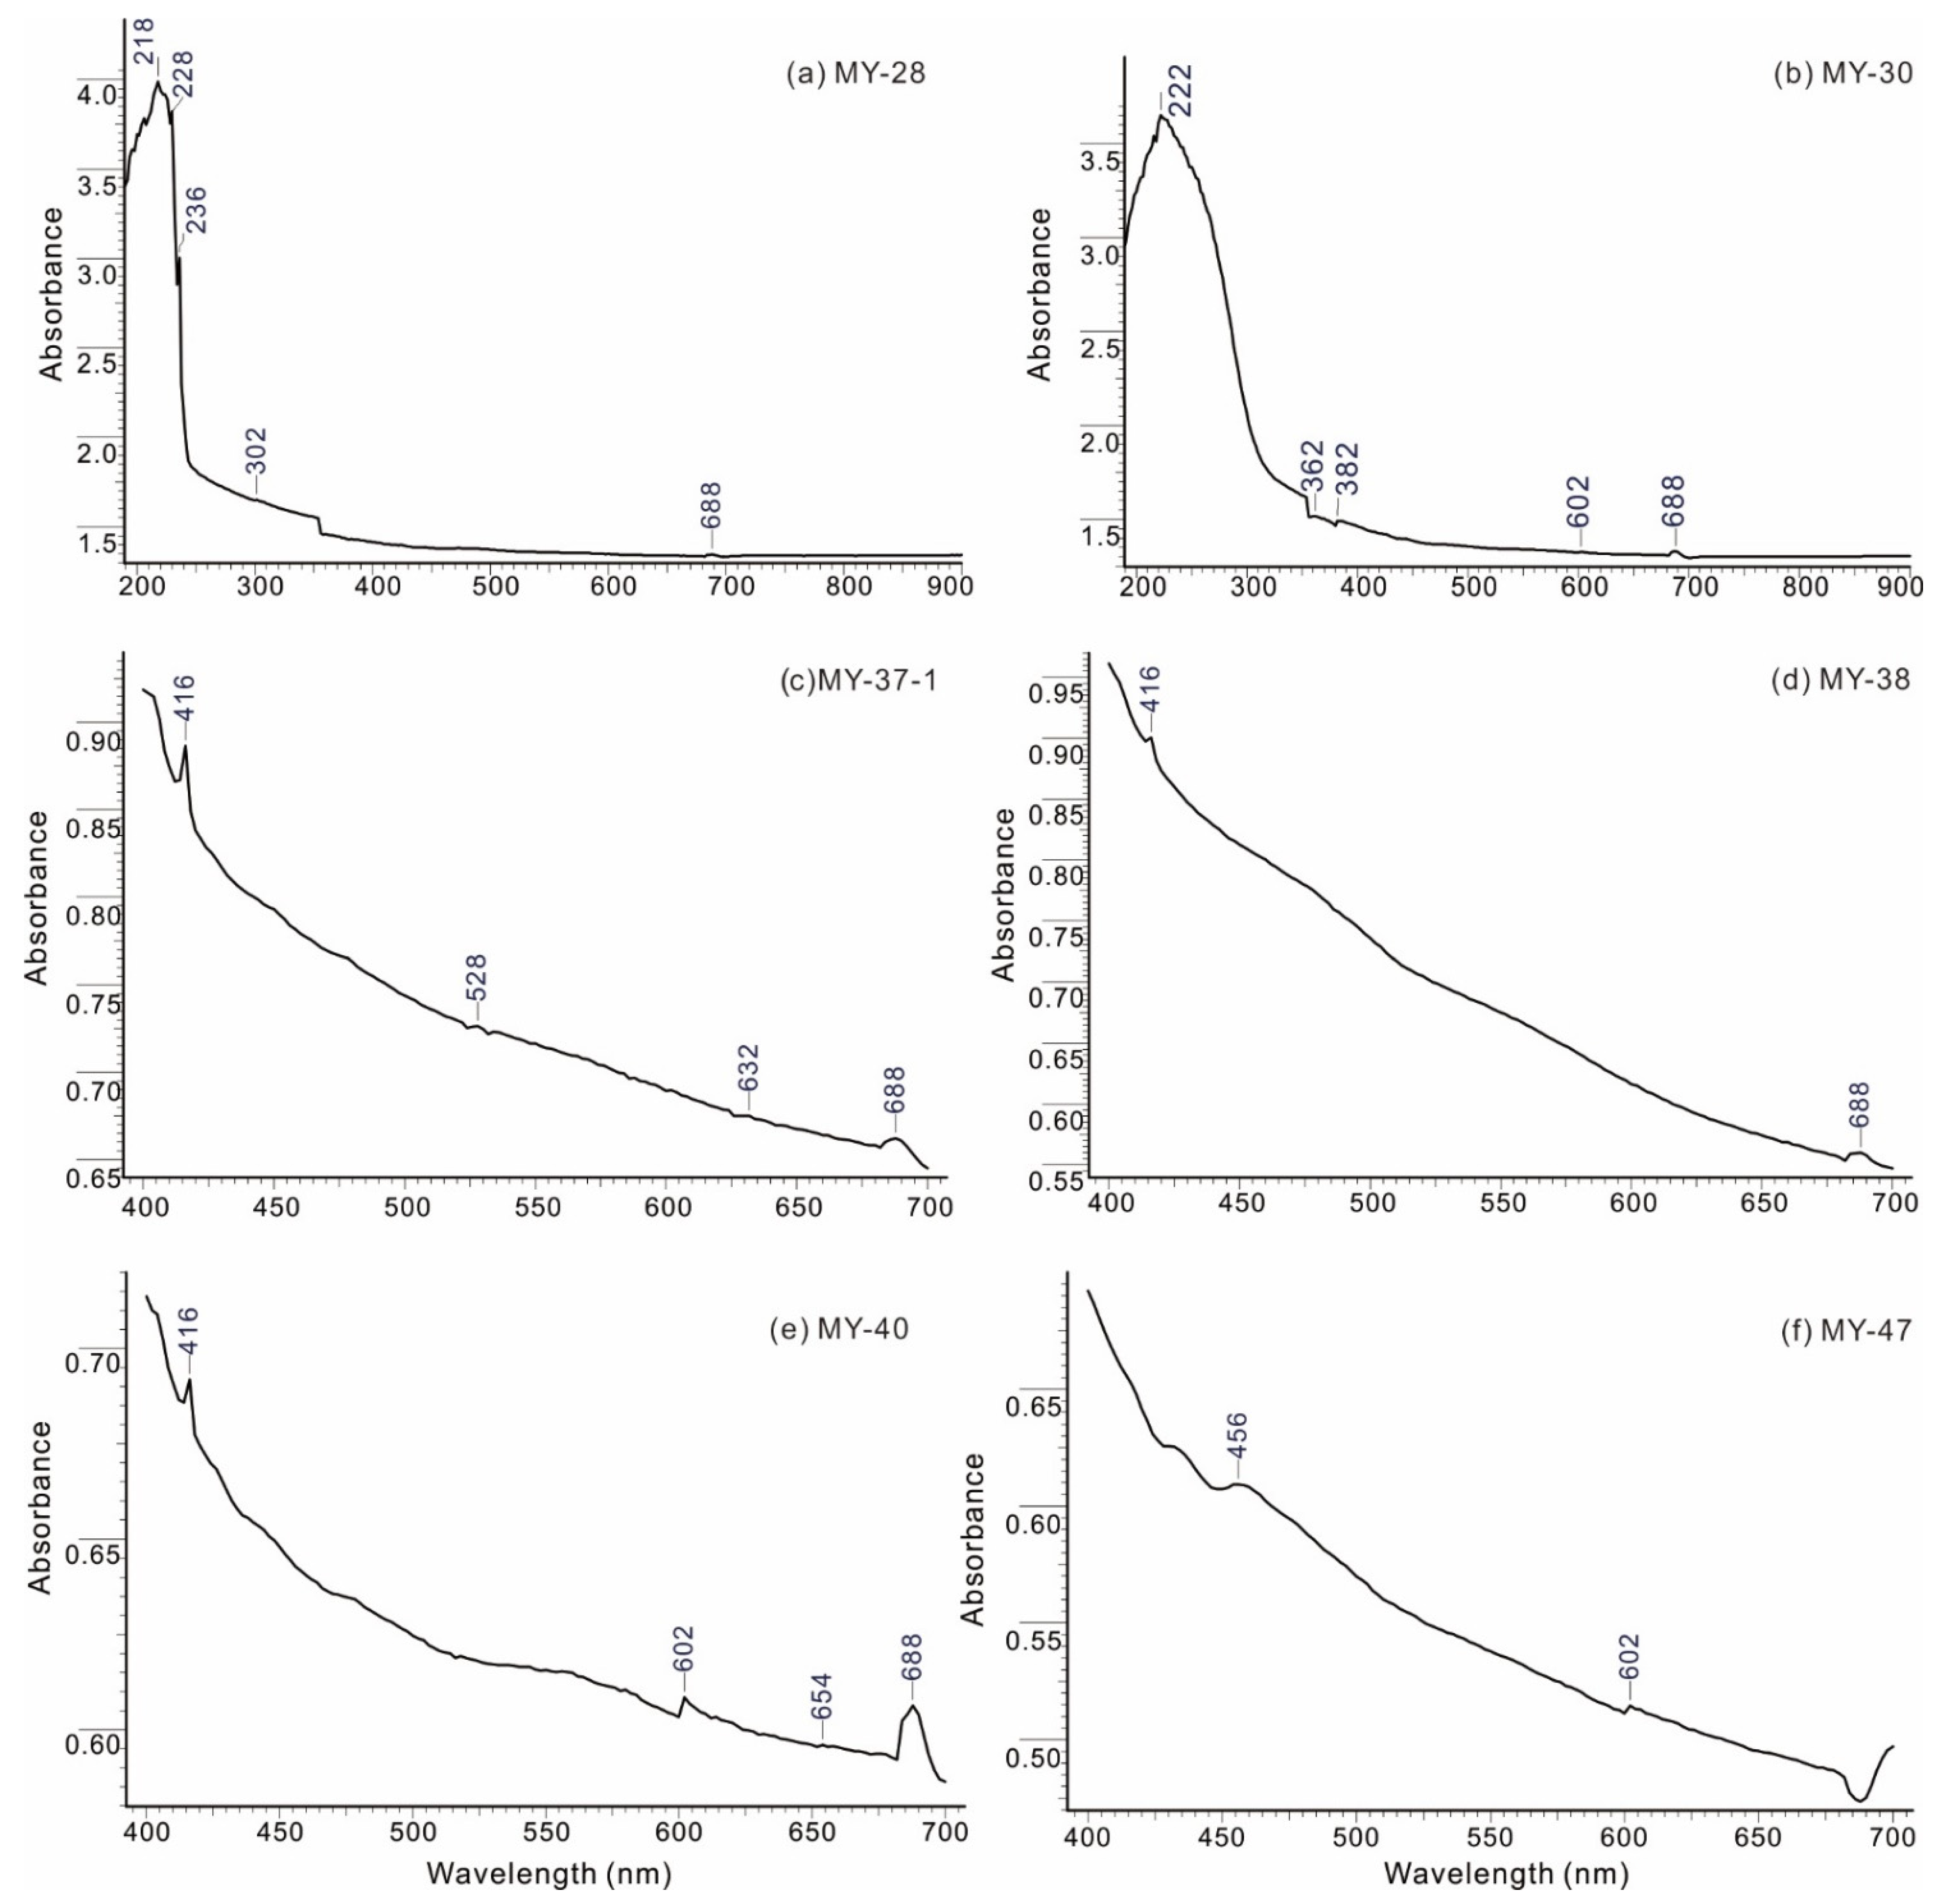
The UV-Vis absorption spectrum features of brown diamond from the Mengyin deposit are shown in Table S6 and Figure 7. There are obvious three absorption peaks at 416 nm, 602 (or 600) nm, and 688 (or 690) nm in the visible absorption spectra. Moreover, the studied samples with the characteristic peak of 416 nm in the visible absorption spectra are all IaAB type, and most of them are yellowish brown in color.
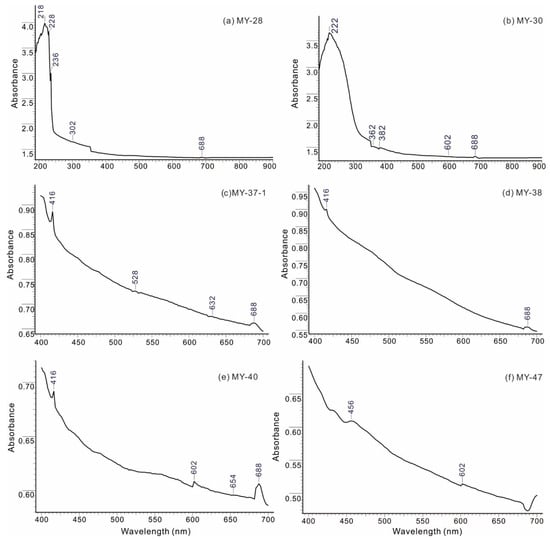
Figure 7.
Ultraviolet-visible absorption spectrum diagrams of representative brown diamonds from the Mengyin deposit.
3.8. Transmission Electron Microscope Features
Transmission electron microscope (TEM) is a kind of imaging method with high resolution (point resolution up to 0.2–0.3 nm), which uses a short-wavelength electron beam as an illumination source and uses an electromagnetic lens to focus imaging. Crystal lattice resolution has reached about 0.1 nm and high magnification (50–800,000 times, continuously adjustable) of electronic optical instruments. Thus, the TEM is routinely used to observe the atomic structure of defects.
Dislocation is a kind of line defect in crystal, which is mostly distributed along the [110] direction in diamond. If there are multiple dislocations in the same plane, under the action of a small external force, the atoms in the dislocation part are easy to move and will slip out of the crystal one after another, resulting in macroscopic visible deformation, that is, slip lines [11].
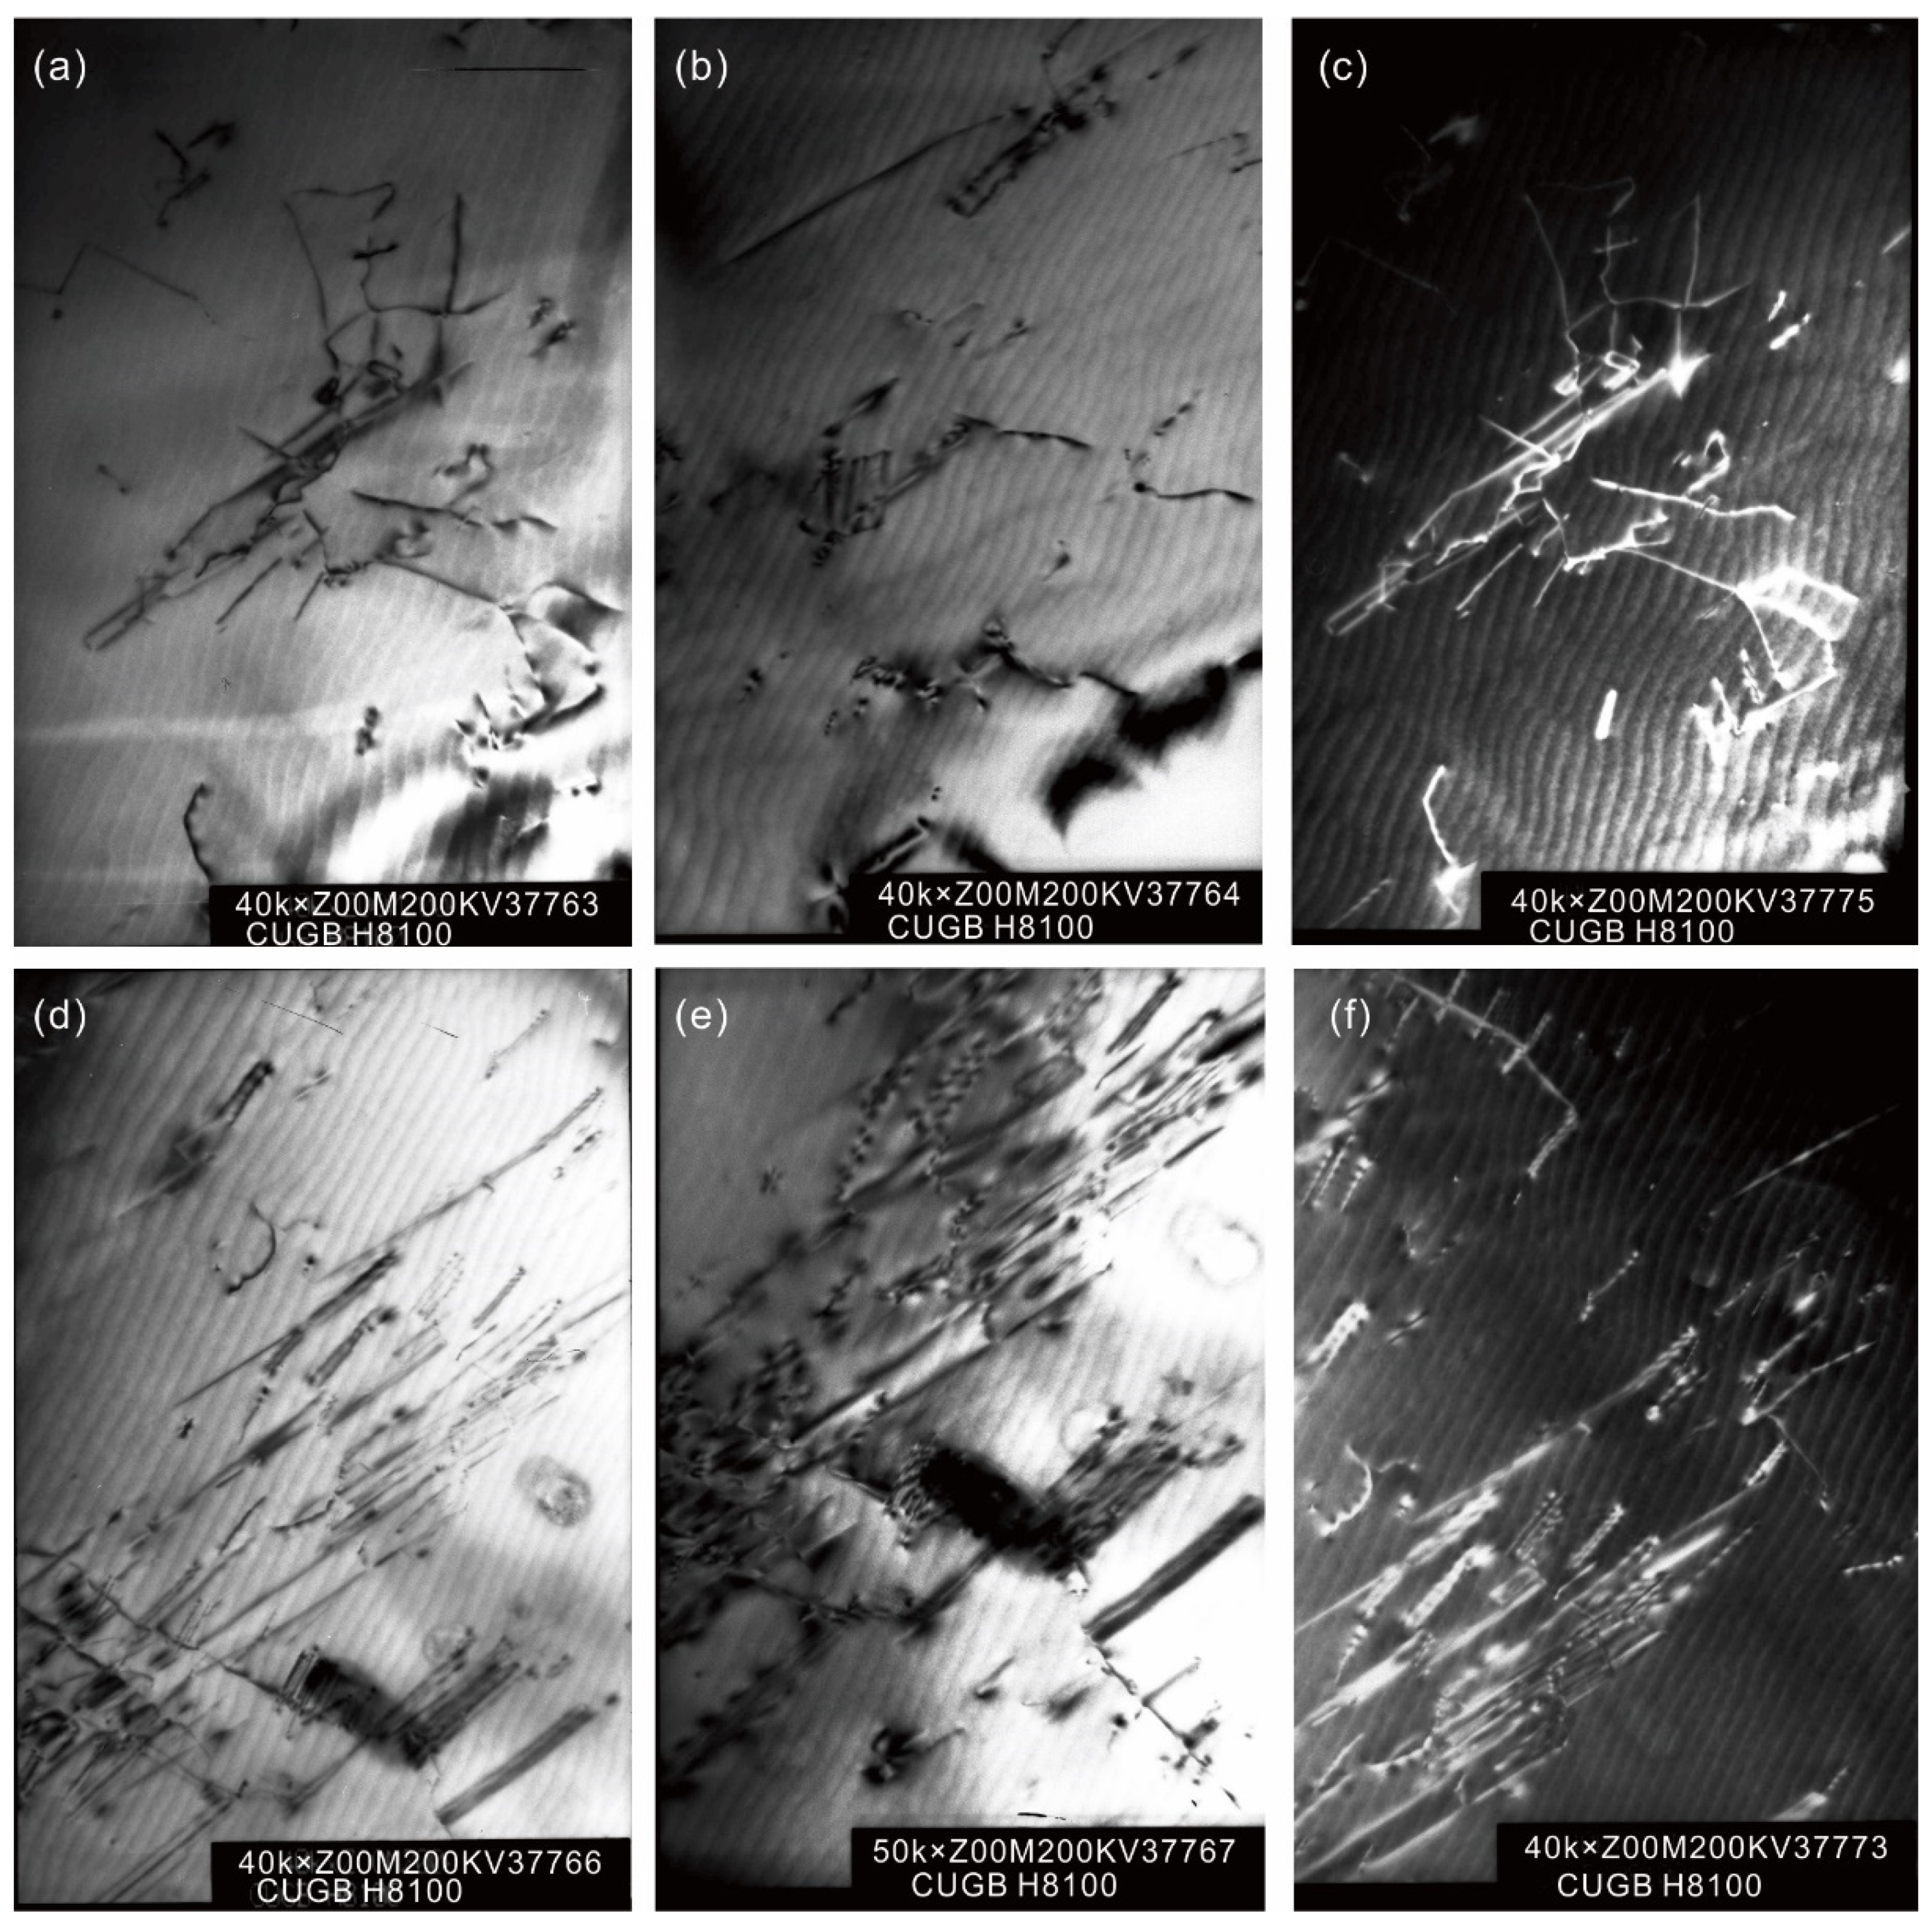
The direction and degree of erosion of diamond crystal surface are mainly related to the slip line. When the crystal is subjected to weak dissolution, the slip line is usually not obvious; when the dissolution is strong, the triangular etching image will be etched along the direction of the slip line, and the etching image will form a long chain along this direction. For example, the surface of sample MY-38 was corroded seriously, and a group of slip lines appeared. Dislocations cross the surface of the sample MY-38 and appear as dots and lines, and dislocations are tangled in some areas in the TEM image (Figure 8). The density of local dislocations is high, mainly stacking faults, with few total dislocations.
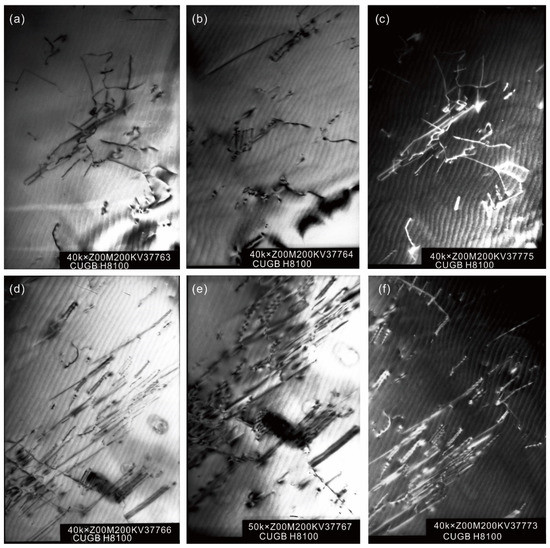
Figure 8.
The pictures of dislocation and stacking faults in transmission electron microscopy (5 cm in width) for sample MY-38. Dislocation pictures in light field (a,b) and in center of dark field (c); Stacking faults in light field (d,e) and in center of dark field (f).
4. Discussion
4.1. Brown Color Related to Plastic Deformation
Among the uncut studied samples of brown diamonds in this paper, ten samples show obvious slip structures (Table S7), of which nine samples are brown or yellowish brown in color, as well as one slice sample MY-20 being light yellowish brown, suggesting that plastic deformation is mainly responsible for the formation of brown color [51]. The slip lines observed in brown diamonds from the the Mengyin mine indicate that the crystals have undergone plastic deformation due to stress in deep mantle during their growth stage. These slip lines in response to plastic deformation mainly appear on the diamond {111} plates, commonly shown as parallel spaced lineations, sometimes as two distinct sets of intersecting, occasionally as three groups of intergrown. Some samples (such as MY-47) underwent strong plastic deformation under strain (Figure S1). A set of slip lines on their crystal planes developed a rough and uneven stepped appearance.
As a homogenous cubic mineral, diamond with a perfect lattice is generally transparent, colorlesss and optically isotropic, and exhibits extinction under orthogonal polarization completely. However, diamond always shows optical anomalies of birefringence under cross-polarized light. Abnormal birefringence is generally observed in Mengyin brown diamonds. Brown bands of diamonds and extinction orientations are commonly overlapping very well. These brown diamond samples related to plastic deformation show parallel abnormal extinction bands in the cross-polarized light and run through the complex growth zones exhibited by the entire crystal (Figure 2), which were considered to be plastic deformation contributing to the direction consistent with the slip line orientation [12]. A characteristic birefringent tatami-like pattern resembling a crosshatch twinning structure of micro-plagioclase was observed in some thin slices from type II diamonds [14] (Figure 2f). The tatami-like pattern occurs in lamellae dominantly parallel to one octahedral plane, and they cut right through the growth stratifications. These features coincide with those slice samples MY-47 and MY-36-1 having an “agate-like” growth structure under CL (Figure 3j,l), speculating that the sample may produce plastic deformation under the high temperature [12].
The variation of Raman spectra also indicates the distribution of the brown color in terms of the particular strain-producing plastic deformation of Mengyin diamonds responsible for them. The Raman intrinsic peaks of brown diamond from the specimens MY-20, MY-35, MY-38, MY-44, MY-46, and MY-48 generally drift to the low wavenumber direction, and present a diagnostic Raman spectrum range from 1326.82 to 1328.19 cm−1 compared with those of 1332 cm−1 for “perfect” and defect-free diamond (Figure 6). The studied samples MY-28, MY-35, MY-36-1, MY-38, and MY-40 also exhibit Raman spectra of 794 cm−1 and 2084 cm−1 compared with those subordinate typical peaks of 798 cm−1 and 2088 cm−1. Even if their shifts may be instead due to heating during the spectroscopy, this drift phenomenon is indeed prevalent in Mengyin diamonds according to previous studies [12] and unpublished data. The intensities of two Raman spectra are proportional to the strength of plastic deformation in brown diamond [21]. All these Raman spectra correspond well with their plastic deformation characteristics under microscopic magnification, orthogonal polarization, and CL observation, suggesting that the variation of spectral peaks is closely related to the plastic deformation in the studied brown diamonds.
The infrared absorption peaks 1010 cm−1, 1100 cm−1, 1330 cm−1, and 1428 cm−1 are produced by the slip plane {111} of diamond [39,40,41], of which 1010 cm−1 and 1100 cm−1 were related to dislocation rings (Ns (111), called B1 center) parallel to the {111} plane in diamond lattice, and 1430 cm−1 was related to a strain effect on defect edge, which was generally weak and called the B2 absorption line. The studied samples generally have infrared spectra of 1010.53 cm−1, 1097.31 cm−1, 1328.73 cm−1, and 1427.08 cm−1 (Figure 4) that are generated by the {111} slide plane [39,40,41,52,53]. These features can be used as characteristic spectra for identifying those of brown diamonds that experienced plastic deformation [3,39,40].
Photoluminescence spectra of 575.9 nm (MY-28, MY-36-1, MY-40, MY-43-1), 612.4 nm (MY-25, MY-43-1), and 617 nm (MY-25, MY-36-1, MY-38, and MY-40), 626 nm (MY-28, MY-38), as well as other luminescence centers related to dislocation of lattice (Figure 5), indicating that the plastic deformation is the key factor controlling studied diamonds to be brown [54]. The 617.65 nm characteristic peak (main peak) of the MY-36-1 sample is unique to type Ia brown diamonds associated with plastic deformation [5]. In addition, 576.0 nm (MY-38) and 612.5 nm (MY-36-1, MY-38, MY-40) commonly found in our samples are related to typical defects caused by plastic deformation of brown diamonds [5]. In particular, strong luminescence of 572.66 nm in all the tested samples was speculated to be caused by dislocation. Combined with the orthogonal polarization observation, we propose that the internal strain of studied brown diamonds is responsible for the characteristic peaks [55].
The dislocation of natural diamond is very low in density when it crystallizes. However, the brown diamonds from Mengyin mine observed under TEM have a high dislocation in density and uneven distribution, with local density up to 1010 cm−1 [56]. The strong interaction between the dislocations indicates that the samples have undergone large plastic deformation. This deformation should be carried out under high temperature (over 1700 °C) and high pressure, indicating that the brown diamonds have undergone intense deformation at high temperature after the formation, and there is dislocation concentration in some areas [56].
4.2. Brown Color Related to Non-Deformation
The brown color in overwhelming majority of diamonds is attributed to post-growth plastic deformation and corresponding slip plane defects responsible for this color of such plastically deformed diamonds as confirmed by the brown diamonds in the Mengyin deposit studied in this paper as well as previous points [51]. However, brown diamonds that owe their color to NDR defects are discovered in succession, even quite rare ones, and it is proposed that the NDR brown diamonds mainly include CO2-beared and pseudo CO2-beared diamonds as well as certain hydrogen-rich diamonds [4,5]. These NDR diamonds had extraordinary properties in terms of inclusions and color distribution. They appear black to brown or highly reflective white under the microscope, and show anomalous CL color such as pink, pale violet, orange, and brown, instead of the blue color typically exhibited by CO2-free diamonds [57]. The characteristic inclusions in CO2-bearing and pseudo CO2-bearing diamonds are likely very small graphite particles [4]. The probable link between structurally bound oxygen and some of the spectroscopic features, such as a 480 nm absorption band, nickel-nitrogen-related 990 nm series with hydrogen involved, and a 1330 nm defect without hydrogen involved, is apparent in these diamonds [4]. These NDR brown diamonds barely changed color upon high pressure high temperature treatment compared to those of DR brown diamonds [4,5].
The Mengyin brown diamonds shown by CL images are characterized by anomalous CL colors such as blueviolet and brown luminescence from samples DB3, DB5, MY-36, and MY-40, and complexed patterns compared to those of various blue colors typically exhibited by CO2-free diamonds from the most of the studied samples (Figure 3), indicating the possible presence of CO2 in the micro-lattice defects of some studied diamonds. Various extinction patterns under crossed polarizing light were visible, such as striped birefringent, bow-tie, radial, cross, tatami, extinction stripe, and complex superimposed patterns, appear in some samples (Figure 2). These abnormal extinction patterns not only indicate that the brown diamonds are caused by plastic deformation, but also indicate the effect of impurity composition, inclusions, features, and strain in the brown diamonds [11,14,55]. It is especially noteworthy that the distribution of brown annular bands with dark center rimmed light color indicates that the diamond samples studied probably produced different brown hues during crystal formation in the deep mantle, where the carbon concentration of some brown diamonds was oversaturated during crystallization [12]. The IR and UV-Vis-NIR exhibit that nitrogen, oxygen, and hydrogen absorptions shown as C–H, N–H, O–H bonds were detected in the brown zones of diamond. In particular, IR spectrometry provides a means of evaluating the concentrations not only of nitrogen (A and B) impurity centers, but also of platelets (P centers) and hydrogen (H) centers [42]. The nitrogen contents and aggregation in natural diamond depend on nitrogen concentration, mantle residence time, and mantle temperature. The state of nitrogen aggregation is very high sensitivity to temperature and relatively weak dependence on residence time; particularly, a short period of elevated temperature will make a disproportionately large effect on nitrogen aggregation [58,59]. The aggregation sequence of the nitrogen clusters changes gradually with geological period. The initial nitrogen form is C center that refers to a single substitutional nitrogen in type Ib diamond [35,42]. Such rare natural Ib diamonds have not experienced temperatures above ∼850 °C, indicating that they were rapidly transported to shallower and cooler depth after formation. Aggregation of nitrogen from single substitutional atoms to a pair of neighboring atoms of nitrogen substituting for carbon (A center) typically happens very quickly, but aggregation from the A center to the B-center, which is created by four nitrogen atoms tetrahedrally arranged around a vacancy at high temperature occurs at a much slower rate [46,59]. The total nitrogen contents NT of brown diamonds from the Mengyin deposit show a much higher range from 26 to 992 ppm with the average of 378 ppm. The values are much higher than those of policrystalline diamonds from the Mengyin kimberlite pipes (17–73 ppm) [18], but are consistent with those of colorless diamonds from the No. 1 Shengli pipe in Mengyin deposit (302–395 ppm, n = 13) [60]. Coupled with most natural types, Ia diamonds have a pale yellow or brown color attributable to aggregations of nitrogen atoms [58]. These brown diamonds have no C center (Figure 4, Table S3), and the characteristic peak at 416 nm in the visible absorption spectra is triggered by N3 [61,62] that contributed to the IaAB type and is yellow-brown in color (Figure 7), indicating that nitrogen content of less 1000 ppm is not the main factor for the color genesis of the Mengyin brown diamond.
The proportion of aggregated nitrogen NB% of the studied samples exhibits a large range from 27% to 98%. Their corresponding large span of formation temperature varies from 1118 to 1237 °C at the age of 3 Ga, and from 1130 to 1251 °C at the age of 1.8 Ga (for the convenience of discussion, the following part is not based on these data of 1.8 Ga). The brown diamonds can be divided into terms of NB% and temperature into three groups. Group 1 is characterized by high NB% and high temperature values of 90% and 98%, 1196 °C and 1237 °C from samples MY-38 and MY-12, respectively. These group diamonds have more aggregated nitrogen and higher temperature; the features are similar to those of super-deep diamonds from the Juina deposit in Brazil [63], combined with the peaks at 575.9 nm centers from samples MY-28, MY-36-1, MY-40, MY-43-1, and 626.89 nm from samples MY-28 and MY-38 (Figure 5) and can be assigned to nitrogen-interstitial atom composite defects in the PL spectra, which were interpreted to be generated under high pressure and high temperature in the mantle [35,64]. These features indicate that they may form in a more than 250 km deep mantle. Group 2 has relatively low values of NB% and model temperatures from the other samples range from 27% and 74%, 1118 °C and 1179 °C, respectively. The data are similar to those of kimberlite-hosted diamonds from subcontinental lithospheric mantle.
The brown diamonds showed that the characteristic peak at 3106.8 cm−1 is assigned to the hydrogen absorption (Figure 4), and the peak at 3107 cm−1 is due to the VN3H defect [44]. Sharp bands at 3236.01 cm−1 in both samples MY-08 and MY-50, and peaks at 3667.99 cm−1 are due to N-H bond absorption. In addition, 3733.56 cm−1 and its vicinity of weak shoulder bands are confined to O-H stretching vibration in samples MY-38, MY-40, MY-45, and MY-50 (Figure 4). The optical observation is consistent with the result that variable contents in hydrogen occur in all the studied samples of the IaAB-type diamond (Table S3). VN3H is an excellent candidate for the 3107 cm−1 center related to the high temperature of formation and thermal stability [65]. The defect is trigonal with the C–H bond lying along [111] crystal axes. This information coupled with its very high formation temperature suggests the existence of the color centers in which hydrogen participates, and the diamond likely tendentiously undergoes plastic deformation and produces a brown color after its formation.
The sample MY-25 is of type IIa, whereas the type-II diamond is considered to be “nitrogen-free”, probably containing less than 20 ppm nitrogen, which is below the detection limits of infrared spectroscopy. If there are no other factors coloring the crystal, the sample should present as colorless, which is analogous to the sample MY-03. However, more than four dark inclusions in different sizes and radial extinction patterns surrounding them are observed in the slice diamond under microscopic magnification examination (Figure 2d). It verifies that inclusions have made abundant microcracks, which is consistent with the divergence and distribution of brown color from core to rim in the Mengyin diamonds. Therefore, it is speculated that plastic deformation leads to lattice defects around some dark inclusions which are wrapped during the crystals formation, or another scenario that plastic deformation leads to lattice defects, and then some dark inclusions of e.g., graphite are wrapped under the effect of lattice defects, resulting in the brown color of sample MY-25. In those two cases, we propose that the plastic deformation contributes to lattice defects of diamond, surrounding part of the dark inclusions or some dark inclusions were wrapped in defects and cracks, resulting in the brown appearance of some diamond samples.
Therefore, the complex patterns of CL images, extinction diagrams, and spectroscopic data record a multi-stage process involved in genesis of the Mengyin brown diamonds and their mantle residence history in the Earth’s mantle before they were brought to the surface of the earth by kimberlitic magmatism. Furthermore, different kinds of inclusions of graphite, potassium salt, pyrope, olivine, and diopside are commonly enveloped in the Mengyin brown diamonds during their formation in the deep mantle [56]. While the diamond is carried to the surface of the earth by kimberlite or lamproite magmatism, a continuous decrease in temperature and pressure will result in an increase in volume, then further form the dislocation of diamond, due to the difference in the thermal expansion coefficient between the inclusions and host diamond. This process may make the diamond brown in color, which resembles those of inclusions of small reflective particles in both CO2 beared and pseudo CO2 beared diamonds [4].
5. Conclusions
A series of treatment experiments on the uncut and sliced diamonds from the Mengyin deposit mainly included microscopic examination, cathodoluminescence, orthogonal polarization, infrared spectroscopy, Raman spectroscopy, low-temperature photoluminescence spectroscopy, ultraviolet-visible absorption spectroscopy, and transmission electron microscopy. We propose that plastic deformation-related detects play an important role on the color formation of brown diamond. Some samples are also caused by non-deformation-related defects, atomic impurities, and inclusions.
Supplementary Materials
The following are available online at https://www.mdpi.com/article/10.3390/cryst12040449/s1, Figure S1: Morphological pictures of rough diamonds from the Mengyin deposit, China; Table S1: Slice sample features of brown diamonds from the Mengyin deposit; Table S2: Infrared spectrum peaks (cm−1) and its type of brown diamonds from the Mengyin deposit; Table S3: Nitrogen concentration (μg·g−1) and NB% values of 15 brown diamonds from the Mengyin deposit; Table S4: The low temperature photoluminescence spectrum peaks of brown diamonds from the Mengyin deposit; Table S5: Raman spectrum peaks (cm−1) of brown diamonds from the Mengyin deposit; Table S6: UV-Vis absorption spectrum (nm) peaks of brown diamonds from the Mengyin deposit; Table S7: Slip line of plastic deformation of raw brown diamonds from the Mengyin deposit.
Author Contributions
Conceptualization, G.-C.W., X.-Y.Y., F.L. and H.-B.L.; methodology, G.-C.W. and X.-Y.Y.; software, G.-C.W., F.L. and Z.-Y.L.; validation, G.-C.W., X.-Y.Y. and F.L.; resources, X.-Y.Y. and H.-B.L.; data curation, G.-C.W., X.-Y.Y., F.L., Z.-Y.L. and H.W.; writing—original draft preparation, G.-C.W., X.-Y.Y. and F.L.; writing—review and editing, G.-C.W., X.-Y.Y. and F.L.; supervision, X.-Y.Y. and F.L.; project administration, X.-Y.Y. and F.L.; funding acquisition, X.-Y.Y. and F.L. All authors have read and agreed to the published version of the manuscript.
Funding
This research was funded by grants from the the Key Special Project for Introduced Talents Team of Southern Marine Science and Engineering Guangdong Laboratory (Guangzhou) (GML2019ZD0201), State Key Laboratory of Geological Processes and Mineral Resources, China University of Geosciences (GPMR202115), the National Science Foundation of China (92062215; 41720104009), the China Geological Survey (DD20190379-88; DD20190060), the 7th Institute of Geology and Mineral Exploration of Shandong Province (QDKY202007), and the Key Laboratory of Deep-Earth Dynamics of the Ministry of Natural Resources (J1901-32).
Acknowledgments
We are very grateful to Jingsui Yang, Bingjian Xiao, Yitao Cai, Zhiyun Lu, Qing Lv, Zhiyuan Chu, Dongyang Lian, Chuqi Cao, Jiaxin Wan, and Chaofan Zhang for their help and useful suggestions. Two anonymous reviewers are greatly appreciated for their constructive comments and suggestions, which greatly improved the manuscript.
Conflicts of Interest
The authors declare no conflict of any interest in this paper.
References
- Harris, J.W. Diamond. In Encyclopedia of Geology, 2nd ed.; Alderton, D., Elias, S.A., Eds.; Academic Press: Oxford, UK, 2021; pp. 455–472. [Google Scholar]
- Yin, X.-L. Genesis of diamond coloration. Superhard Mater Eng. 2007, 2, 53–56, (In Chinese with English Abstract). [Google Scholar]
- Laidlaw, F.H.J.; Diggle, P.L.; Breeze, B.G.; Dale, M.W.; Fisher, D.; Beanland, R. Spatial distribution of defects in a plastically deformed natural brown diamond. Diam. Relat. Mater. 2021, 117, 108465. [Google Scholar] [CrossRef]
- Hainschwang, T.; Notari, F.; Pamies, G. A Defect Study and Classification of Brown Diamonds with Non-Deformation-Related Color. Minerals 2020, 10, 914. [Google Scholar] [CrossRef]
- Hainschwang, T.; Notari, F.; Pamies, G. A Defect Study and Classification of Brown Diamonds with Deformation-Related Color. Minerals 2020, 10, 903. [Google Scholar] [CrossRef]
- Harris, J. Diamond Geology. In The Properties of Natural and Synthetic Diamonds; Academic Press: London, UK, 1992; pp. 345–393. [Google Scholar]
- Byrne, K.S.; Chapman, J.G.; Luiten, A.N. Photochromic charge transfer processes in natural pink and brown diamond. J. Phys. Condens. Matter 2014, 26, 35501. [Google Scholar] [CrossRef]
- Shigley, J.E.; Chapman, J.; Ellison, R.K. Discovery and mining of the argyle diamond deposit, Australia. Gems Gemol. 2001, 37, 26–41. [Google Scholar] [CrossRef]
- Collins, A.T.; Kanda, H.; Kitawaki, H. Color changes produced in natural brown diamonds by high-pressure, high-temperature treatment. Diam. Relat. Mater. 2000, 9, 113–122. [Google Scholar] [CrossRef]
- Tappert, R.; Tappert, M.C. Diamonds in Nature: A Guide to Rough Diamonds; Springer: Berlin, Germany, 2011. [Google Scholar]
- Orlov, Y.L. Diamond Mineralogy, 1st ed.; China Construction Industry Press: Beijing, China, 1977. [Google Scholar]
- Li, H.B. Study on Characters of Plastic Deformation in Brown Diamonds from Kimberlite Pipe Shengli No.1, Mengyin County, Shandong Province. Master’s Thesis, China University of Geosciences, Beijing, China, 2006. (In Chinese with English Abstract). [Google Scholar]
- Yang, M.X.; Pan, Z.L. Characters of Plastic Deformation on Diamond from Hunan Province, China. J. Gems Gemmol. 2004, 29, 45–49, (In Chinese with English Abstract). [Google Scholar]
- Lang, A.R. Causes of Birefringence in Diamond. Nature 1967, 213, 248–251. [Google Scholar] [CrossRef]
- Collins, A.T. The Defection of Color-Enhanced and Synthetic Gem Diamonds by Optical Spectroscopy. Diam. Relat. Mater. 2003, 12, 1976–1983. [Google Scholar] [CrossRef]
- Yu, X.Y.; Long, Z.Y.; Zhang, Y.; Qin, L.J.; Zhang, C.; Xie, Z.R.; Wu, Y.R.; Yan, Y.; Wu, M.K.; Wan, J.X. Overview of Gemstone Resources in China. Crystals 2021, 11, 1189. [Google Scholar] [CrossRef]
- Yin, G.H. Noble Gas and Internal Characters of Diamond from Mengyin Area, Shandong Province and the Geologic Genesis. Master’s Thesis, China University of Geosciences, Beijing, China, 2016. (In Chinese with English Abstract). [Google Scholar]
- Yang, Z.J.; Liang, R.; Zeng, X.Q.; Ge, T.Y.; Ai, Q.; Zheng, Y.L.; Peng, M.S. Study on the Micro-Infrared Spectra and Origin of Polycrystalline Diamonds from Mengyin Kimberlite Pipes. Spectrosc. Spectr. Anal. 2012, 32, 1512–1518, (In Chinese with English Abstract). [Google Scholar]
- Chen, M.H.; Chen, Z.; Di, J.R. Structure Defects in Type Ia Brown Diamonds by Polychromatic Synchrotron Radiation Topography. Earth Sci.—J. China Univ. Geosci. 2005, 30, 187–190, 194, (In Chinese with English Abstract). [Google Scholar]
- Yang, M.X.; Pan, Z.L. Heterogeneous Interior Characters of Diamond in Hunan. Geol. Sci. Technol. Inf. 2001, 20, 61–63, (In Chinese with English Abstract). [Google Scholar]
- Qi, L.J.; Yuan, X.Q.; Tian, L.G.; Yuan, Z.Z. Evolution and Colouration of Lattice Defects in Diamonds at High Pressure and High Temperature. J. Gems Gemmol. 2001, 3, 1–7, (In Chinese with English Abstract). [Google Scholar]
- Stepanov, A.S.; Korsakov, A.V.; Yuryeva, O.P.; Nadolinniy, V.A.; Perraki, M.; Gussem, K.D.; Vandenabeele, P. Brown diamonds from an eclogite xenolith from Udachnaya kimberlite, Yakutia, Russia. Spectrochim. Acta Part A 2011, 80, 41–48. [Google Scholar] [CrossRef]
- Shigley, J.E.; Fritsch, E. A notable red-brown diamond. J. Gemmol. 1993, 23, 259–266. [Google Scholar] [CrossRef]
- Gaillou, E.; Post, J.E.; Bassim, N.D.; Zaitsev, A.M.; Rose, T.; Fries, M.D.; Stroud, R.M.; Steele, A.; Butler, J.E. Spectroscopic and microscopic characterizations of color lamellae in natural pink diamonds. Diam. Relat. Mater. 2010, 19, 1207–1220. [Google Scholar] [CrossRef]
- Fisher, D. Brown diamonds and high pressure high temperature treatment. Lithos 2009, 112, 619–624. [Google Scholar] [CrossRef]
- Eaton-Magaña, S.; Ardon, T.; Smit, K.V.; Breeding, C.M.; Shigley, J.E. Natural-color pink, purple, red, and brown diamonds: Band of Many Colors. Gems Gemol. 2017, 54, 352–377. [Google Scholar]
- Howell, D.; Fisher, D.; Piazolo, S.; Grifin, W.L.; Sibley, S.J. Pink color in Type I diamonds: Is Deformation Twinning the Cause? Am. Mineral. 2015, 100, 1518–1527. [Google Scholar] [CrossRef]
- Schoor, M.; Boulliard, J.C.; Gaillou, E.; Hardouin Duparc, O.; Estève, I.; Baptiste, B.; Rondeau, B.; Fritsch, E. Plastic deformation in natural diamonds: Rose Channels Associated to Mechanical Twinning. Diam. Relat. Mater. 2016, 66, 102–106. [Google Scholar] [CrossRef]
- Deljanin, B.; Simic, D.; Zaitsev, A.M.; Chapman, J.; Dobrinets, I.; Widemann, A.; Del Re, N.; Middleton, T.; Deljanin, E.; De Stefano, A. Characterization of pink diamonds of different origin: Natural (Argyle, Non-Argyle), Irradiated and Annealed, Treated with Multi-Process, Coated and Synthetic. Diam. Relat. Mater. 2008, 17, 1169–1178. [Google Scholar] [CrossRef]
- Dobrinets, I.A.; Vins, V.G.; Zaitsev, A.M. HPHT-Treated Diamonds, 1st ed.; Springer: Berlin/Heidelberg, Germany, 2013. [Google Scholar] [CrossRef]
- Yang, M.X.; Gao, Y. Characters of Brown Spot on Diamond from Hunan Province and Its Implication. J. Gems Gemmol. 2002, 4, 15–19, (In Chinese with English Abstract). [Google Scholar]
- Peng, M.S.; Lin, B.; Peng, Z.L. A Preliminary Study on the Mechanism of Coloration of Fancy Diamond. Bull. Mineral. Petrol. Geochem. 1999, 18, 395–397, (In Chinese with English Abstract). [Google Scholar]
- Zhao, H.D. The Relationship between the Diamond’s Physical and Energy of Mineralization. Geol. Shandong 1996, 12, 50–56, (In Chinese with English Abstract). [Google Scholar]
- Lv, Q.; Liu, F.; Chu, Z.Y.; Ge, Y.J.; Liu, X.; Jiao, Y.X. The mineralogical characteristics and comparison of diamonds in the three kimberlite belts in Mengyin, Shandong Province. Acta Geol. Sin. 2021, 95. Available online: http://www.geojournals.cn/dzxb/ch/reader/download_new_edit_content.aspx?file_no=202102040000001&flag=2&journal_id=dzxb&year_id=0 (accessed on 29 December 2021). (In Chinese with English Abstract).
- Gu, T.; Wang, W. Optical defects in milky type IaB diamonds. Diam. Relat. Mater. 2018, 89, 322–329. [Google Scholar] [CrossRef]
- Bocharov, S.N.; Isakov, A.I.; Petrov, Y.Y.; Orekhova, K.N.; Dementeva, E.V.; Burakov, B.E.; Zamoryanskaya, M.V. Study of radioluminescence and cathodoluminescence of artificial diamond single crystals as prospective durable core material for nuclear electric batteries. Diam. Relat. Mater. 2021, 120, 108658. [Google Scholar] [CrossRef]
- Chen, M.H.; Di, J.R. Application of Cathodoluminescence and Ftir Analysis in Diamond Studies. Geol. Sci. Technol. Inf. 1999, 18, 97–100, (In Chinese with English Abstract). [Google Scholar]
- Hamers, R.J.; Stavis, C.; Pokhrel, A.; Franking, R.; Ruther, R.E.; Wang, X.; Cooperrider, M.C.; Zheng, H.; Carlisle, J.A.; Butler, J.E. Characterization of molecular and biomolecular layers on diamond thin films by infrared reflection–absorption spectroscopy. Diam. Relat. Mater. 2011, 20, 733–742. [Google Scholar] [CrossRef]
- Yuan, Z.Z.; Peng, M.S.; Meng, Y.F. Spectroscopic Studies on Irradiated Enhanced Fancy color Diamonds. J. Mineral. Petrol. 2005, 25, 47–51, (In Chinese with English Abstract). [Google Scholar]
- Yuan, Z.Z.; Peng, M.S.; Meng, Y.F. Spectroscopic Studies on Fancy color Diamonds. Acta Mineral. Sin. 2006, 26, 73–76, (In Chinese with English Abstract). [Google Scholar]
- He, X.M. Infrared Spectrum Characteristics and Classification of Nature Diamond. Geol. Explor. 2000, 36, 45–47, (In Chinese with English Abstract). [Google Scholar]
- Khachatryan, G.K.; Kaminsky, F.V. “Equilibrium” and “non-equilibrium” diamond crystals from deposits in the East European Platform, as revealed by infrared absorption data. Can. Mineral. 2003, 41, 171–184. [Google Scholar] [CrossRef] [Green Version]
- Boyd, S.R.; Kiflawi, I.; Woods, G.S. Infrared absorption by the B nitrogen aggregate in diamond. Philos. Mag. B 1995, 72, 351–361. [Google Scholar] [CrossRef]
- Speich, L.; Kohn, S.C. QUIDDIT—QUantification of infrared active Defects in Diamond and Inferred Temperatures. Comput Geosci. 2020, 144, 104558. [Google Scholar] [CrossRef]
- Boyd, S.R.; Kiflawi, I.; Woods, G.S. The relationship between infrared absorption and the A defect concentration in diamond, Physics of condensed matter. Structural, electronic, optical, and magnetic properties. Philos. Mag. B 1994, 69, 1149–1153. [Google Scholar] [CrossRef]
- Taylor, W.R.; Jaques, A.L.; Ridd, M. Nitrogen-defect aggregation characteristics of some Australasian diamonds; time-temperature constraints on the source regions of pipe and alluvial diamonds. Am. Mineral. 1990, 75, 1290–1310. [Google Scholar]
- Taylor, W.R.; Canil, D.; Judith Milledge, H. Kinetics of Ib to IaA nitrogen aggregation in diamond. Geochim. Cosmochim. Acta 1996, 60, 4725–4733. [Google Scholar] [CrossRef]
- Dong, B.; Shi, C.K.; Xu, Z.W.; Wang, K.Y.; Luo, H.H.; Sun, F.W.; Wang, P.F.; Wu, E.; Zhang, K.; Liu, J.Y.; et al. Temperature dependence of optical centers in Ib diamond characterized by photoluminescence spectra. Diam. Relat. Mater. 2021, 116, 108389. [Google Scholar] [CrossRef]
- Ferrari, A.C. Determination of bonding in diamond-like carbon by Raman spectroscopy. Diam. Relat. Mater. 2002, 11, 1053–1061. [Google Scholar] [CrossRef]
- Xue, L.H.; Yue, W.H.; Chen, F.; Deng, E.S. Study on Isomorphous Substitution and Vibrational Spectra in Diamonds. J. Wuhan Univ. Technol. 1999, 21, 1–4, (In Chinese with English Abstract). [Google Scholar]
- Meng, Y.F.; Peng, M.S. Study on defects and color mechanism of Brown Diamond. Proceedings of the 11th Annual Academic Conference of Chinese Society for Mineralogy. Petrol. Geochem. 2007, 123–124. Available online: https://cpfd.cnki.com.cn/Article/CPFDTOTAL-ZGKD200704001066.htm (accessed on 1 December 2021). (In Chinese).
- Collins, A.T. Spectroscopy of defects and transition metals in diamond. Gems Gemol. 2000, 9, 417–423. [Google Scholar] [CrossRef]
- Koivula, J.L.; Kammerling, R.C.; Fritsch, E. More on irradiated black diamonds. Gems Gemol. 1992, 28, 276. [Google Scholar]
- Meng, Y.F. Study on Defects and Coloration Mechanism of Brown Diamond. Ph.D. Thesis, Sun Yat-sen University, Guangzhou, China, 2006. (In Chinese with English Abstract). [Google Scholar]
- Yang, M.X. Study on Internal Characteristics and Brown Origin of Diamond in Hunan Province. Ph.D. Thesis, China University of Geosciences, Wuhan, China, 2000. (In Chinese with English Abstract). [Google Scholar]
- Wu, G.C.; Yu, X.Y. An analysis of the characteristics of brown diamonds from Mengyin in Shandong Province under transmission electron microscopy (TEM). Acta Petrol. Mineral. 2014, 33, 111–119, (In Chinese with English Abstract). [Google Scholar]
- Chinn, I.L.; Gurney, J.J.; Milledge, J.H.; Taylor, W.R.; Woods, P.A. Cathodoluminescence Properties of CO2-Bearing and CO2-Free Diamonds from the George Creek K1 Kimberlite Dike. Int. Geol. Rev. 1995, 37, 254–258. [Google Scholar] [CrossRef]
- Zheng, Y.; Li, C.; Liu, J.; Wei, J.; Ye, H. Diamond with nitrogen: States, Control, and Applications. Funct. Diam. 2022, 1, 63–82. [Google Scholar] [CrossRef]
- Ashfold, M.N.R.; Goss, J.P.; Green, B.L.; May, P.W.; Newton, M.E.; Peaker, C.V. Nitrogen in Diamond. Chem. Rev. 2020, 120, 5745–5794. [Google Scholar] [CrossRef]
- Yin, Z.W.; Lu, F.X.; Chen, M.H.; Xu, H.Y. Ages and environments of formation of diamonds in Mengyin County, Shandong Province. Earth Sci. Front. 2005, 4, 614–621, (In Chinese with English Abstract). [Google Scholar]
- Chen, Z. Study on Color Characteristics and Structural Defects of type Ia Brown Diamond. Master’s Thesis, China University of Geosciences, Wuhan, China, 2004. (In Chinese with English Abstract). [Google Scholar]
- Collins, A.T. Colour centers in diamond. J. Gemmol. 1982, 18, 37–75. [Google Scholar] [CrossRef]
- Kaminsky, F. Mineralogy of the lower mantle: A Review of ‘Super-Deep’ Mineral Inclusions in Diamond. Earth-Sci. Rev. 2012, 110, 127–147. [Google Scholar] [CrossRef]
- Wang, K.Y. Photoluminescence Studies of Optical Centres in Electron-Irradiated Diamond. Master’s Thesis, Tianjin University, Tianjing, China, 2012. (In Chinese with English Abstract). [Google Scholar]
- Goss, J.P.; Briddon, P.R.; Hill, V.; Jones, R.; Rayson, M.J. Identification of the structure of the 3107 cm−1 H-related defect in diamond. J. Phys. Condens. Matter 2014, 26, 145801. [Google Scholar] [CrossRef] [PubMed]


Publisher’s Note: MDPI stays neutral with regard to jurisdictional claims in published maps and institutional affiliations. |
© 2022 by the authors. Licensee MDPI, Basel, Switzerland. This article is an open access article distributed under the terms and conditions of the Creative Commons Attribution (CC BY) license (https://creativecommons.org/licenses/by/4.0/).