1. Introduction
Apatite is a common phosphate mineral with an extremely wide distribution in the Earth’s crust, occurring in sedimentary, igneous, and metamorphic rocks [
1,
2,
3]. Apatite is one of the major indicator minerals for petrogenesis, magmatic differentiation progression, and diagenetic conditions because it is rich in trace and rare earth elements, which saves and records information about the source magma [
4,
5]. At the same time, due to the lattice flaws caused by the internal homogeneous substitution of its analogues, apatite is a significant gemstone mineral with a variety of colours.
In the world resources, the output of phosphate is dominated by sedimentary phosphate masses, and the output of pyrogenic phosphate rock only accounts for 10% of the total production. Morocco is the main holder and producer of sedimentary phosphate block rock, whereas there is igneous phosphate block rock output in the High Atlas Mountains. Pyrogenic apatite not only provides high-quality phosphate concentrates, but also contains low levels of deleterious substances and is rich in rare earth elements [
6].
The optimal chemical formulation of apatite is X
5(ZO
4)
3Y, where site X is primarily occupied by Ca
2+; site Z is taken up by P
5+; and site Y is occupied by F
−, Cl
−, and OH
− [
7].
The most common phase in the rocks is fluorapatite (Ca
5[PO
4]
3F) [
8]. Fluorapatite (Ca
5[PO
4]
3F) is composed of hexagonal crystals tightly packed with tetrahedral PO
43− groups, forming two channels that are parallel to the hexagonal axis. In this structure, Ca has two sub-positions, namely, Ca1 and Ca2. Forty percent of Ca occupies the small channel of the ninefold collocation (Ca1), whereas F dominates the central part of the large channel. Sixty percent of Ca forms sevenfold coordination (Ca2) around F in a larger channel. This structure can tolerate relatively large structural distortions and allow different substitutions [
9]. Of all the trace elements in fluorapatite, Na
+, Eu
2+, Fe
2+, Mg
2+, Pb
2+, Mn
2+, Sr
2+, REE
3+, U
4+, and Th
4+ preferentially access the X site, whereas the Z site tends to be occupied by Si
4+, S
6+, and C
4+. The monovalent ion Na
+ is the common minor component and is usually located at the Ca1 site. The monovalent ion Na
+ can access the fluorapatite through the following three substitutions (V stands for vacancy) [
10,
11]: REE
3+ + Na
+ = 2Ca
2+; Na
+ + S
6+ = Ca
2+ + P
5+; 2Na
+ = Ca
2++ [V]. On the basis of the charge conservation principle, the addition of monovalent ions involves the existence of alternative ionic groups, such as REE
3+ or SO
42−. REE
3+ and Y
3+ can occur in higher concentrations and occupy the Ca2 site, whereas SO
42− occupies the PO
43− site. Possible alternative reactions for REE
3+ and Y
3+ include [
12,
13,
14]: REE
3+ + SiO
44− = Ca
2+ + PO
43−; REE
3+ + O
2− = Ca
2+ + F
−. Divalent ions can be doped into apatite at different concentrations because they have a common charge and a similar cation size as Ca
2+. The most abundant tetravalent ions (Th
4+ and U
4+) in natural apatite can enter the apatite by the following complex substitution (V represents vacancy) [
9,
15,
16,
17]: Th
4+(U
4+) + [V] = 2Ca
2+. The PO
43− ion cluster can be substituted by the AsO
43−, SO
42−, CO
32−, and SiO
44− ion clusters [
18,
19,
20,
21]. For valence equilibrium (SO
42− as an example), the following substitutions can occur [
19]: SO
42− + SiO
44− = 2PO
43−; SO
42− + Na
+ = PO
43− + Ca
2+.
In this study, gem-quality apatite crystals from the Anemzi deposit in Morocco were selected, and gemmological, spectroscopy, and major and trace element analyses were performed to determine the gemmological characteristics and mineralisation environment of these crystals. This study helps to further supplement the development of apatite resources in Morocco. Since there are few relevant studies on apatite in Morocco, the advantages of this study are as follows: (1) the gemmological and mineralogical studies on apatite can be theoretically enriched, and (2) Morocco is established as an important producer of apatite, having abundant phosphorite resources. The results of this study will support the theory of apatite mineralisation in the region.
2. Geological Setting
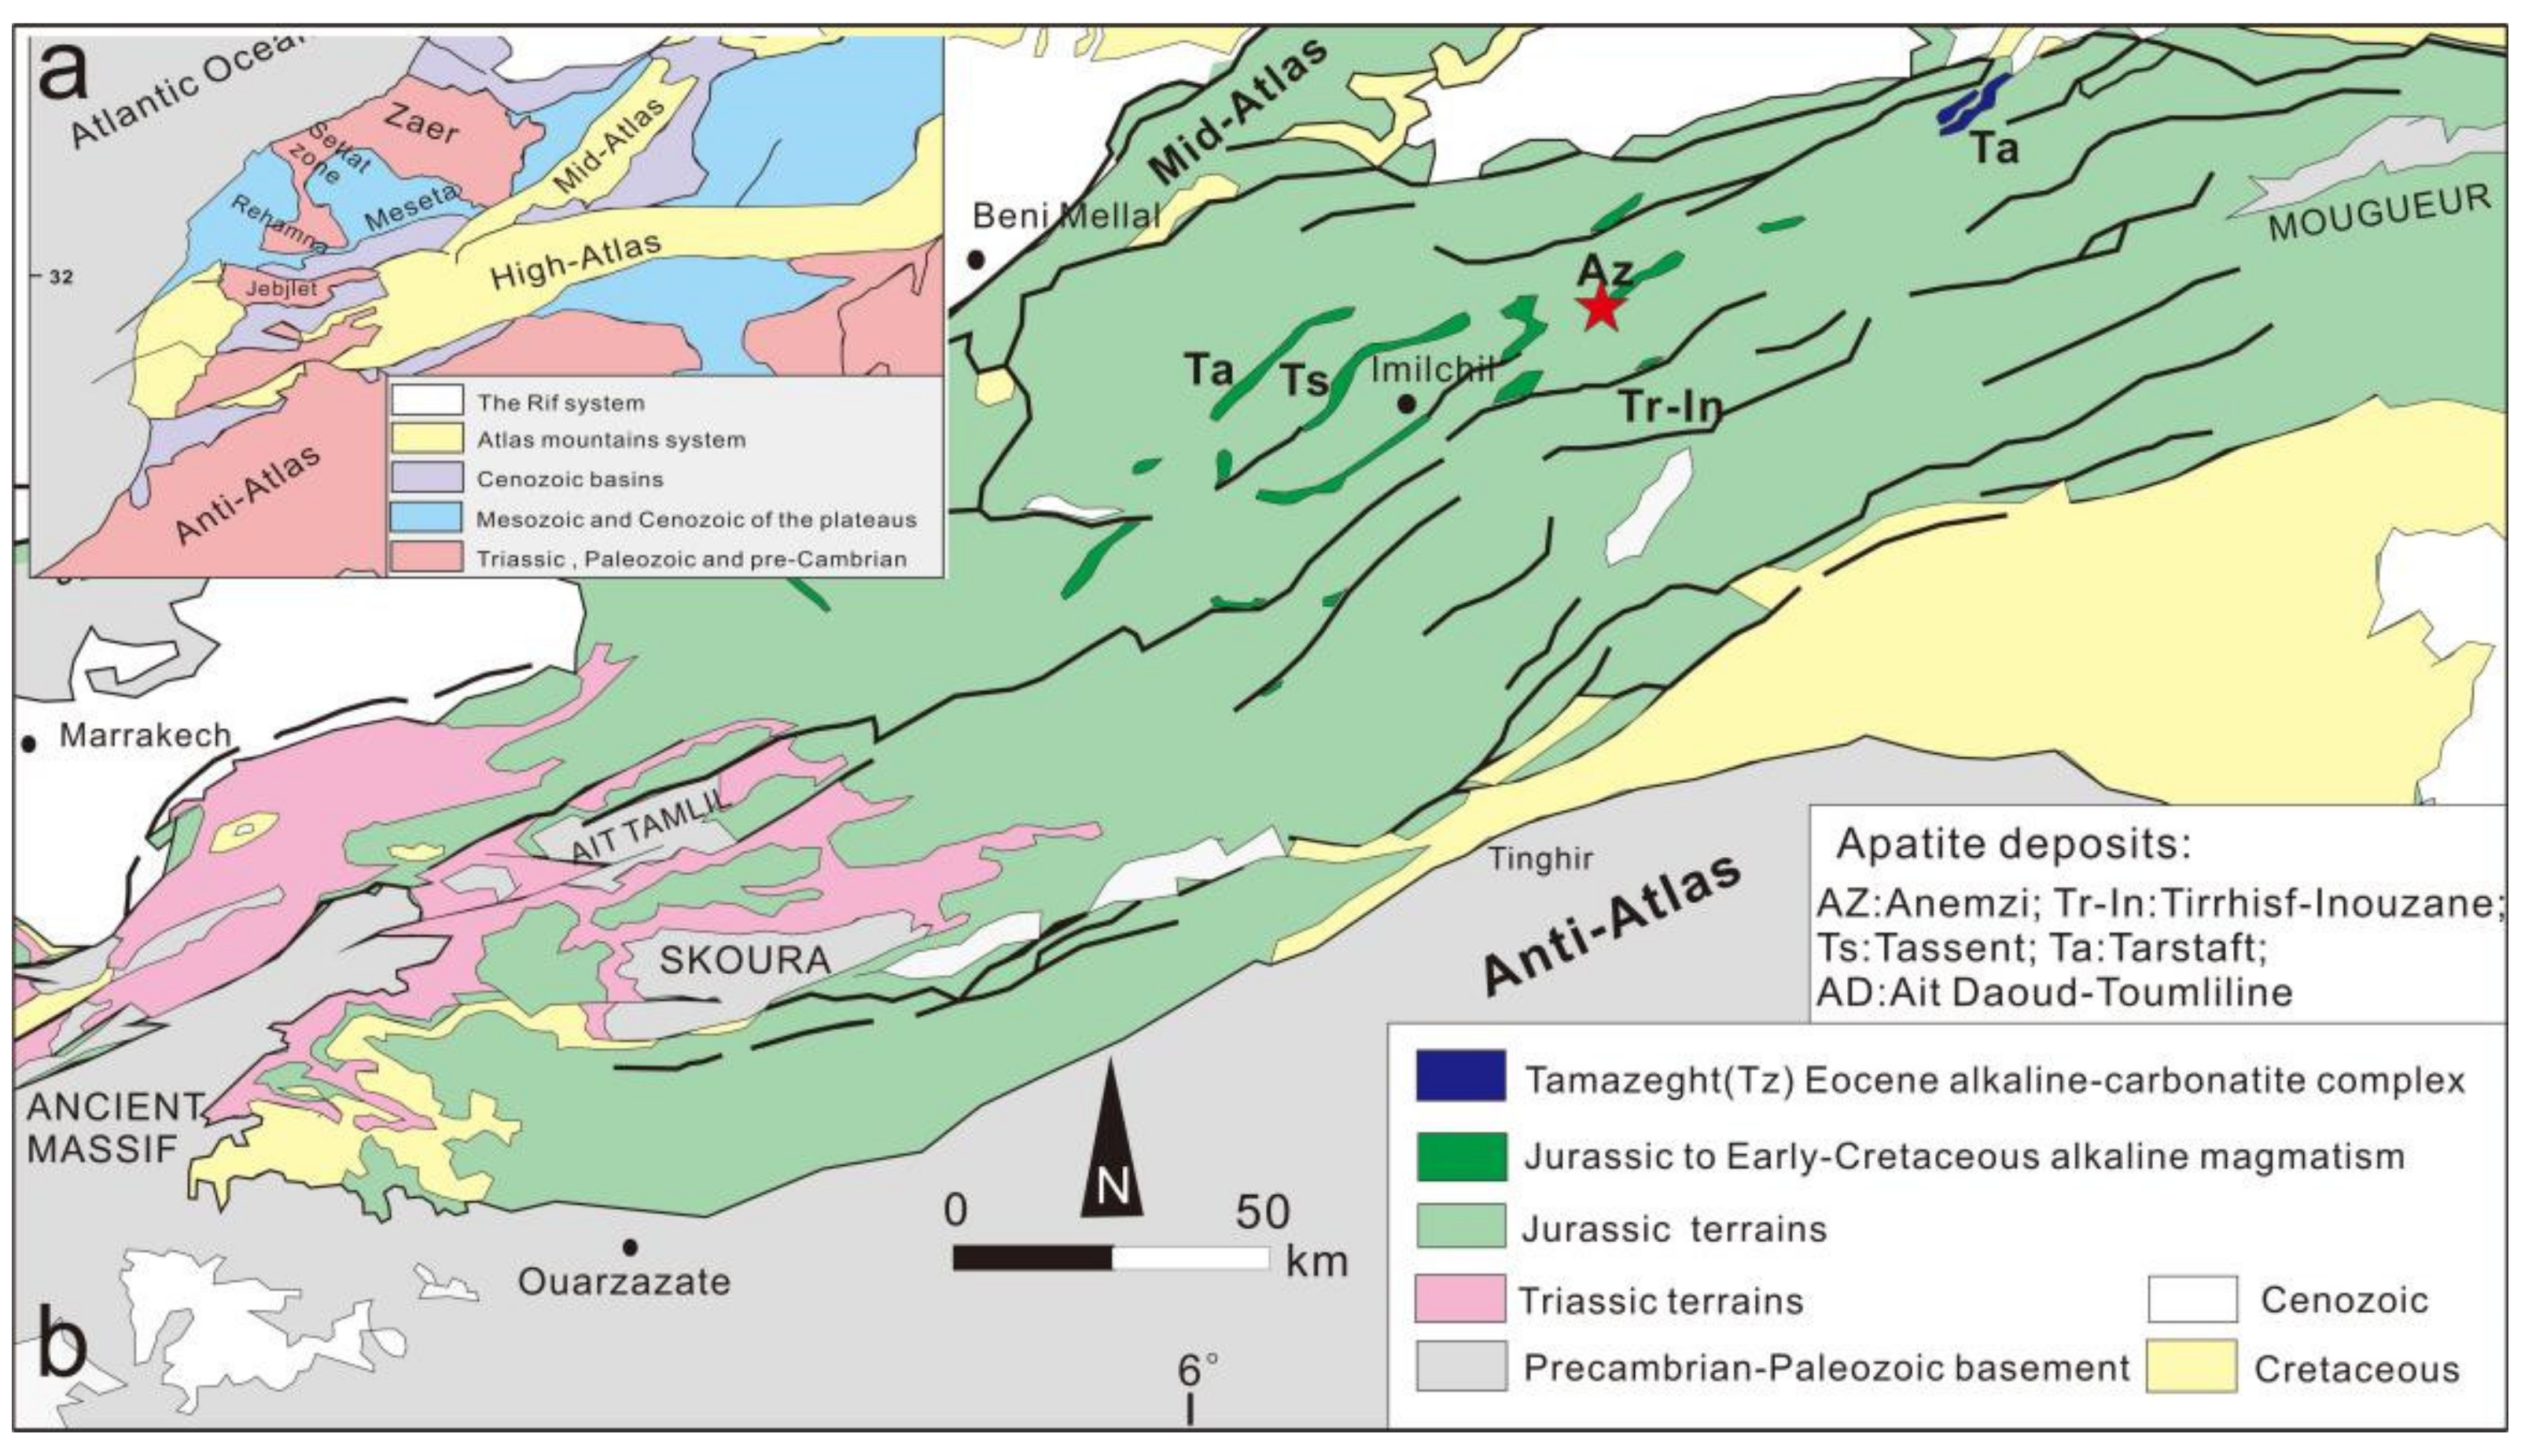
The Atlas Mountains, a series of mountain ranges in north-western Africa, are the most extensive folded and fractured mountain region in Africa, being part of the Alpine system. The Grand Atlas Mountains (Middle Atlas, High Atlas, and Anti-Atlas) are located in Morocco and are an important phosphate extraction area yielding gem-grade apatite (
Figure 1a).
The geology of the Middle Atlas is distinguished by two west–east trending Palaeozoic rock outcrops, namely, the Rehamna area and the Zaer Massif, which are separated by Settat, a marine sediment area from Upper Cretaceous to Eocene. Palaeozoic rocks are usually Hercynian schist, and granite, monzonitic granite, and monzonite to monzodiorite intrude and make contact with the metamorphic parts of Hercynian schist [
22,
23,
24]. The Anti-Atlas is the thick-skinned Palaeozoic folded belt, and its Precambrian basement appears in several inverted chimeras or ‘boutonnieres’ [
23,
25]. These chimeras include Paleoproterozoic and Early–Middle Neoproterozoic rocks influenced by the Pan-African Fault about 660 Ma ago [
23].
The High Atlas (up to 4000 m above sea level) is a representative intracontinental Alpine orogeny which forms a retrograde chain of converging the Afro-Eurasian continents. Its growth began in the early Mesozoic, and the Pangu fault reactivated, forming a subsidence basin, leading to the Atlantic Ocean opening on the edge of northwest Africa [
6,
26,
27,
28,
29,
30]. This mountain chain includes the Eastern, Western, and Central High Atlas. Compared to the eastern and western sections, the Central High Atlas is located in the deepest part of the orogenic belt. Furthermore, the heart of the Central High Atlas dorsal–slope ridge was formed by a significant Jurassic–Cretaceous alkaline-to-transitional magmatism that occurred between about 165 and 125 Ma ago (
Figure 2b) [
6,
27,
31]. The main apatite deposits in the high latitudes of central Morocco, including the Anemzi, Tasraft, Ait Daoud–Toumliline, Tirrhist–Inouzane, and Tassent deposits, are always correlated in space with these Jurassic–Cretaceous alkaline intrusions (
Figure 2b) [
29,
32]. Further gemmological and mineralogical studies on apatite from Anemzi, Morocco, are presented in this paper.
3. Materials and Methods
Standard gemmological tests were performed on six apatites (Moro-1 to Moro-6) from the Anemzi deposit in Morocco.
The gemmological tests of the sample base were performed at the Gemmological Research Laboratory of the China University of Geosciences (Beijing), including optical features, ultraviolet (UV) fluorescence, and gemmological microscopic features. The refractive index and birefringence were measured with a refractometer on a selected polished and flat surface of apatite, and diiodomethane was used as the refractive oil. The specific gravity of the samples was measured using a hydrostatic weighing method. Fluorescence was observed with UV fluorescent lamps at wavelengths of 365 and 254 nm.
The infrared spectra were tested using a Tensor 27 Fourier-transform infrared spectrometer (Bruker, Billerica, Germany) and a reflection method. The reflection method conditions were as follows: scanning temperature of 18–25 °C, humidity of less than 70%, scanning voltage of 85–265 V, resolution of 4 cm−1, grating of 6 mm, test range of 400–2000 cm−1, and scanning signal accumulation of 32 times.
An HR-Evolution-type micro-Raman spectrometer (HORIBA, Shimadzu, Japan) was used to perform Raman spectroscopy tests at 532 nm. The Raman spectroscopy test conditions were as follows: scanning range of 400–4000 cm−1, laser power of 50 mW, resolution of 4 cm−1, slit width of 100 µm, grating of 600 gr/mm, scanning time of 4 s, and integration time of 3 s.
The UV–visible (UV–VIS) spectroscopy test used a UV-3600 UV–VIS spectrophotometer (Shimadzu Corporation, Kyoto, Japan) to measure the absorption value using a transmission method. The transmission method conditions were as follows: wavelength of 300–800 nm, slit width of 20 nm, time constant of 1.0 s, medium scanning speed, and sampling interval of 0.5 s.
In this experiment, Moro-1 and Moro-2 were selected as samples. To obtain a more representative elemental content, a homogeneous portion of the apatite samples without inclusions was selected for testing.
The apatite crystals were first mechanically crushed, after which the internally pure part of the sample was selected under a binocular microscope and placed in an epoxy block to polish it to the largest surface. The polished portions were surface carbon blasted before testing. The primary elements were tested at Macquarie University in Australia using a JXA-8230 electron probe microanalyser. The test conditions were as follows: accelerating voltage of 15.0 kV, electron beam current of 2 × 10⁻⁸ A, and beam spot of 5 µm. The test accuracy of each element was greater than 0.001% and corrected using the ZAF correction method.
At the Institute of Geomechanics, Chinese Academy of Geological Sciences, a laser ablation inductively coupled plasma mass spectrometer was used to measure the trace element composition of the samples. A 193 nm excimer laser ablation system (GeoLas HD; Coherent, Santa Clara, CA, USA) and a four-stage rod mass spectrometer (Agilent 7900) were used for inline testing, with Ar and He as the carrier gases. For measuring the trace element content, this study mainly used NIST SRM 610 and 612 as external standards and 43Ca as an internal standard for trace amounts.
4. Results
4.1. Visual Appearance and Gemmological Properties of Apatite
The tested apatites (Moro-1 to Moro-6) were yellowish green with a glassy to weak glassy lustre. Because of the large number of internal fissures in the samples, the transparency was poor, translucent to opaque, and it was difficult to observe the internal inclusions. When observed under a bright field-of-view illumination of a gemstone microscope, longitudinal lines on the crystal surface parallel to the c-axis were visible, and brown impurity was present on the surface. The crystals were hexagonal, with shell and uneven fractures, and the fractures had a greasy lustre. The apatite sizes ranged from 7 mm to 1.4 cm, with thickness from 3 mm to 8 mm (
Figure 2).
The RI of the samples was measured with a gem refractometer and ranged from 1.635 to 1.640. The specific gravity values varied between 3.18 and 3.20. All samples were inert at long wavelengths of the UV fluorescent lamps. Except for Moro-1 and Moro-2, which showed very weak pink-purple fluorescence at short wavelengths, all the other samples were inert at short wavelengths.
4.2. Spectral Characteristics
4.2.1. Infrared Spectrum
A Fourier transform infrared spectrometer was used to test the six apatites. According to the literature on apatites, the infrared spectrum vibration of apatites is mainly manifested in the vibration of [PO
4]
3− ions. There are four fundamental frequencies of [PO
4]
3−, which are symmetric stretching vibration (
v1), bending vibration (
v2), anti-symmetric stretching vibration (
v3), and bending vibration (
v4) [
33,
34]. The
v1 band is a single, symmetric A, the
v2 band comes from a doubly generated vibration E, and the
v3 and
v4 bands are triple degenerate vibration F
2.
In the infrared spectra of 400–2000 cm
−1 of the Moroccan apatites, the following characteristic peaks were found: a weak absorption peak at 966 cm
−1, which was caused by the symmetric stretching vibration (
v1) of [PO
4]
3−, and an absorption shoulder near 1051 cm
−1 and a strong absorption peak at 1098 cm
−1, which were caused by the anti-symmetric stretching vibration (
v3) of [PO
4]
3−. The moderately strong absorption peaks at 571 cm
−1 and 602 cm
−1 were caused by the bending vibration (
v4) of [PO
4]
3−, and the absorption peak at 470 cm
−1 was attributed to the
v3–
v4 difference band of [PO
4]
3−. The anti-symmetric stretching and bending vibrations, that is, respectively,
v3 and
v4 bands were divided into components, and
v1 band was active [
35]. Both of these facts prove that the symmetry of the phosphate ion was lowered
C3v or
C3.
The fluorapatite from Cerro de Mercado mine, Mexico, whose ID was R040098 in RRUFF database, had two moderately strong
v4 bands measured at 571 cm
−1 and 603 cm
−1; a sharp
v1 band was found at 966 cm
−1; and strong
v3 bands were measured near 1032 cm
−1 and 1087 cm
−1. Comparing Moroccan samples with R040098, we found that the absorption peak at 966 cm
−1 of samples was weaker. The
v3 vibration of [PO
4]
3− with a significant right shift and the
v3 bands widened. The splitting of the P–O bond and the interaction of the vibration pattern of the [PO
4]
3− tetrahedron with the crystal lattice of the fluorapatite may have been responsible for the widening of the
v3 bands [
35]. In addition, by comparison, the infrared spectra of the samples were found to be consistent with fluorapatite. Therefore, it can be preliminarily judged that apatite of Moroccan origin is fluorapatite (
Figure 3a).
Furthermore, the infrared spectra of the samples were tested at different orientations of the crystal, and it was found that the apatite was axial. The infrared spectra obtained from the parallel and vertical c-axis measurements differed between 560 and 610 cm
−1. This difference was demonstrated by the different intensities of the [PO
4]
3− bending vibration peak (
Figure 3b). The parallel c-axis measurement results showed that the absorption peak at 603 cm
−1 was stronger than that at 571 cm
−1, whereas the vertical c-axis measurement results showed the opposite.
4.2.2. Raman Spectrum
The Raman spectra of the Moroccan apatites appeared at 400–1500 cm−1. The Raman characteristic peaks of the apatites were mainly reflected in the vibrations of the [PO4]3− ion cluster. Symmetric stretching vibration peaks of the ion cluster can be seen at 962–965 cm−1, bending vibration peaks were detected at 419–431 cm−1, asymmetric stretching vibration peaks were observed at 1040–1049 cm−1, and asymmetric bending vibration peaks were detected at 575–593 cm−1.
By analysing and comparing the Raman spectra of the samples, the following characteristic peaks were found: a weak absorption peak at 428 cm
−1 caused by the bending vibration of [PO
4]
3−, a medium–strong absorption peak at 587 cm
−1 and the weak absorption peak at 606 cm
−1 caused by the asymmetric bending vibration of [PO
4]
3−, a strong absorption peak at 962 cm
−1 caused by the symmetric stretching vibration of [PO
4]
3−, and peaks at 1051 cm
−1 and 1078 cm
−1 resulting from the asymmetric stretching vibration of [PO
4]
3− (
Figure 4). When compared with the standard Raman spectrum of fluorapatite, it can be determined that the apatites from Morocco were fluorapatites.
4.2.3. UV–VIS Spectrum
Apatite contains a variety of rare earth elements, which have important influence on its colour and fluorescence. Apatite with a high total REE absorbs more strongly in the UV region; the blue and orange–yellow regions also absorb more strongly than apatite with a low total REE [
36]. The absorbance of the samples was measured with a UV–VIS spectrophotometer. The UV spectra of the six apatites are shown in
Figure 5.
The samples had obvious absorption in the red–yellow region with a distinct peak between 450 and 750 nm. In addition, the moderately narrow band peaks at 450–750 nm can be attributed to Pr
3+ near 450 nm and the energy level transition (4f–5d) of Nd
3+ at 530 nm, 580 nm, and 748 nm [
37,
38,
39]. In addition, the samples showed a greenish tone, which was related to the combined absorption of the orange–red and violet regions [
36]. Moro-3, Moro-4, and Moro-6 showed strong absorption peaks near 370 nm, which were caused by the charge transfer transition of Ce
3+/Ce
4+ [
37]. However, the difference in UV spectra between the samples may reflect differences in content of rare earth elements or the different orientation of the tested samples.
4.3. Major and Trace Elements
The major and trace elements of Moro-1 and Moro-2 are shown in
Table A1 and
Table A2. On the basis of the results of the tests and calculations, the main chemical components of Moroccan apatites were CaO and P
2O
5, which were found in the following proportions: CaO = 53.98–54.55 wt % and P
2O
5 = 39.47–40.59 wt %. The results were consistent with the compositional range of pyrogenic apatite (CaO = 54–57 wt % and P
2O
5 = 39–44 wt %) described by Belousova [
3]. Due to the small difference in the EPMA measurements, this study selected a point to calculate separately the crystal chemical formulae of Moro-1 and Moro-2. It was found that the chemical formula of Moro-1 was (Ca
4.77, Ce
0.01, Sr
0.003, Fe
0.001, Na
0.01)
4.81[(P
2.77, S
0.03, Si
0.04)
2.93O
12](F
0.13, Cl
0.07, OH
0.05)
1.0. On the other hand, the chemical formula of Moro-2 was (Ca
4.71, Ce
0.01, Sr
0.003, Fe
0.001, Na
0.01)
4.81[(P
2.77, S
0.03, Si
0.05)
2.939O
12](F
0.16, Cl
0.09, OH
0.06)
1.0, which is that of fluorapatite.
The abundance of the apatite trace elements given in
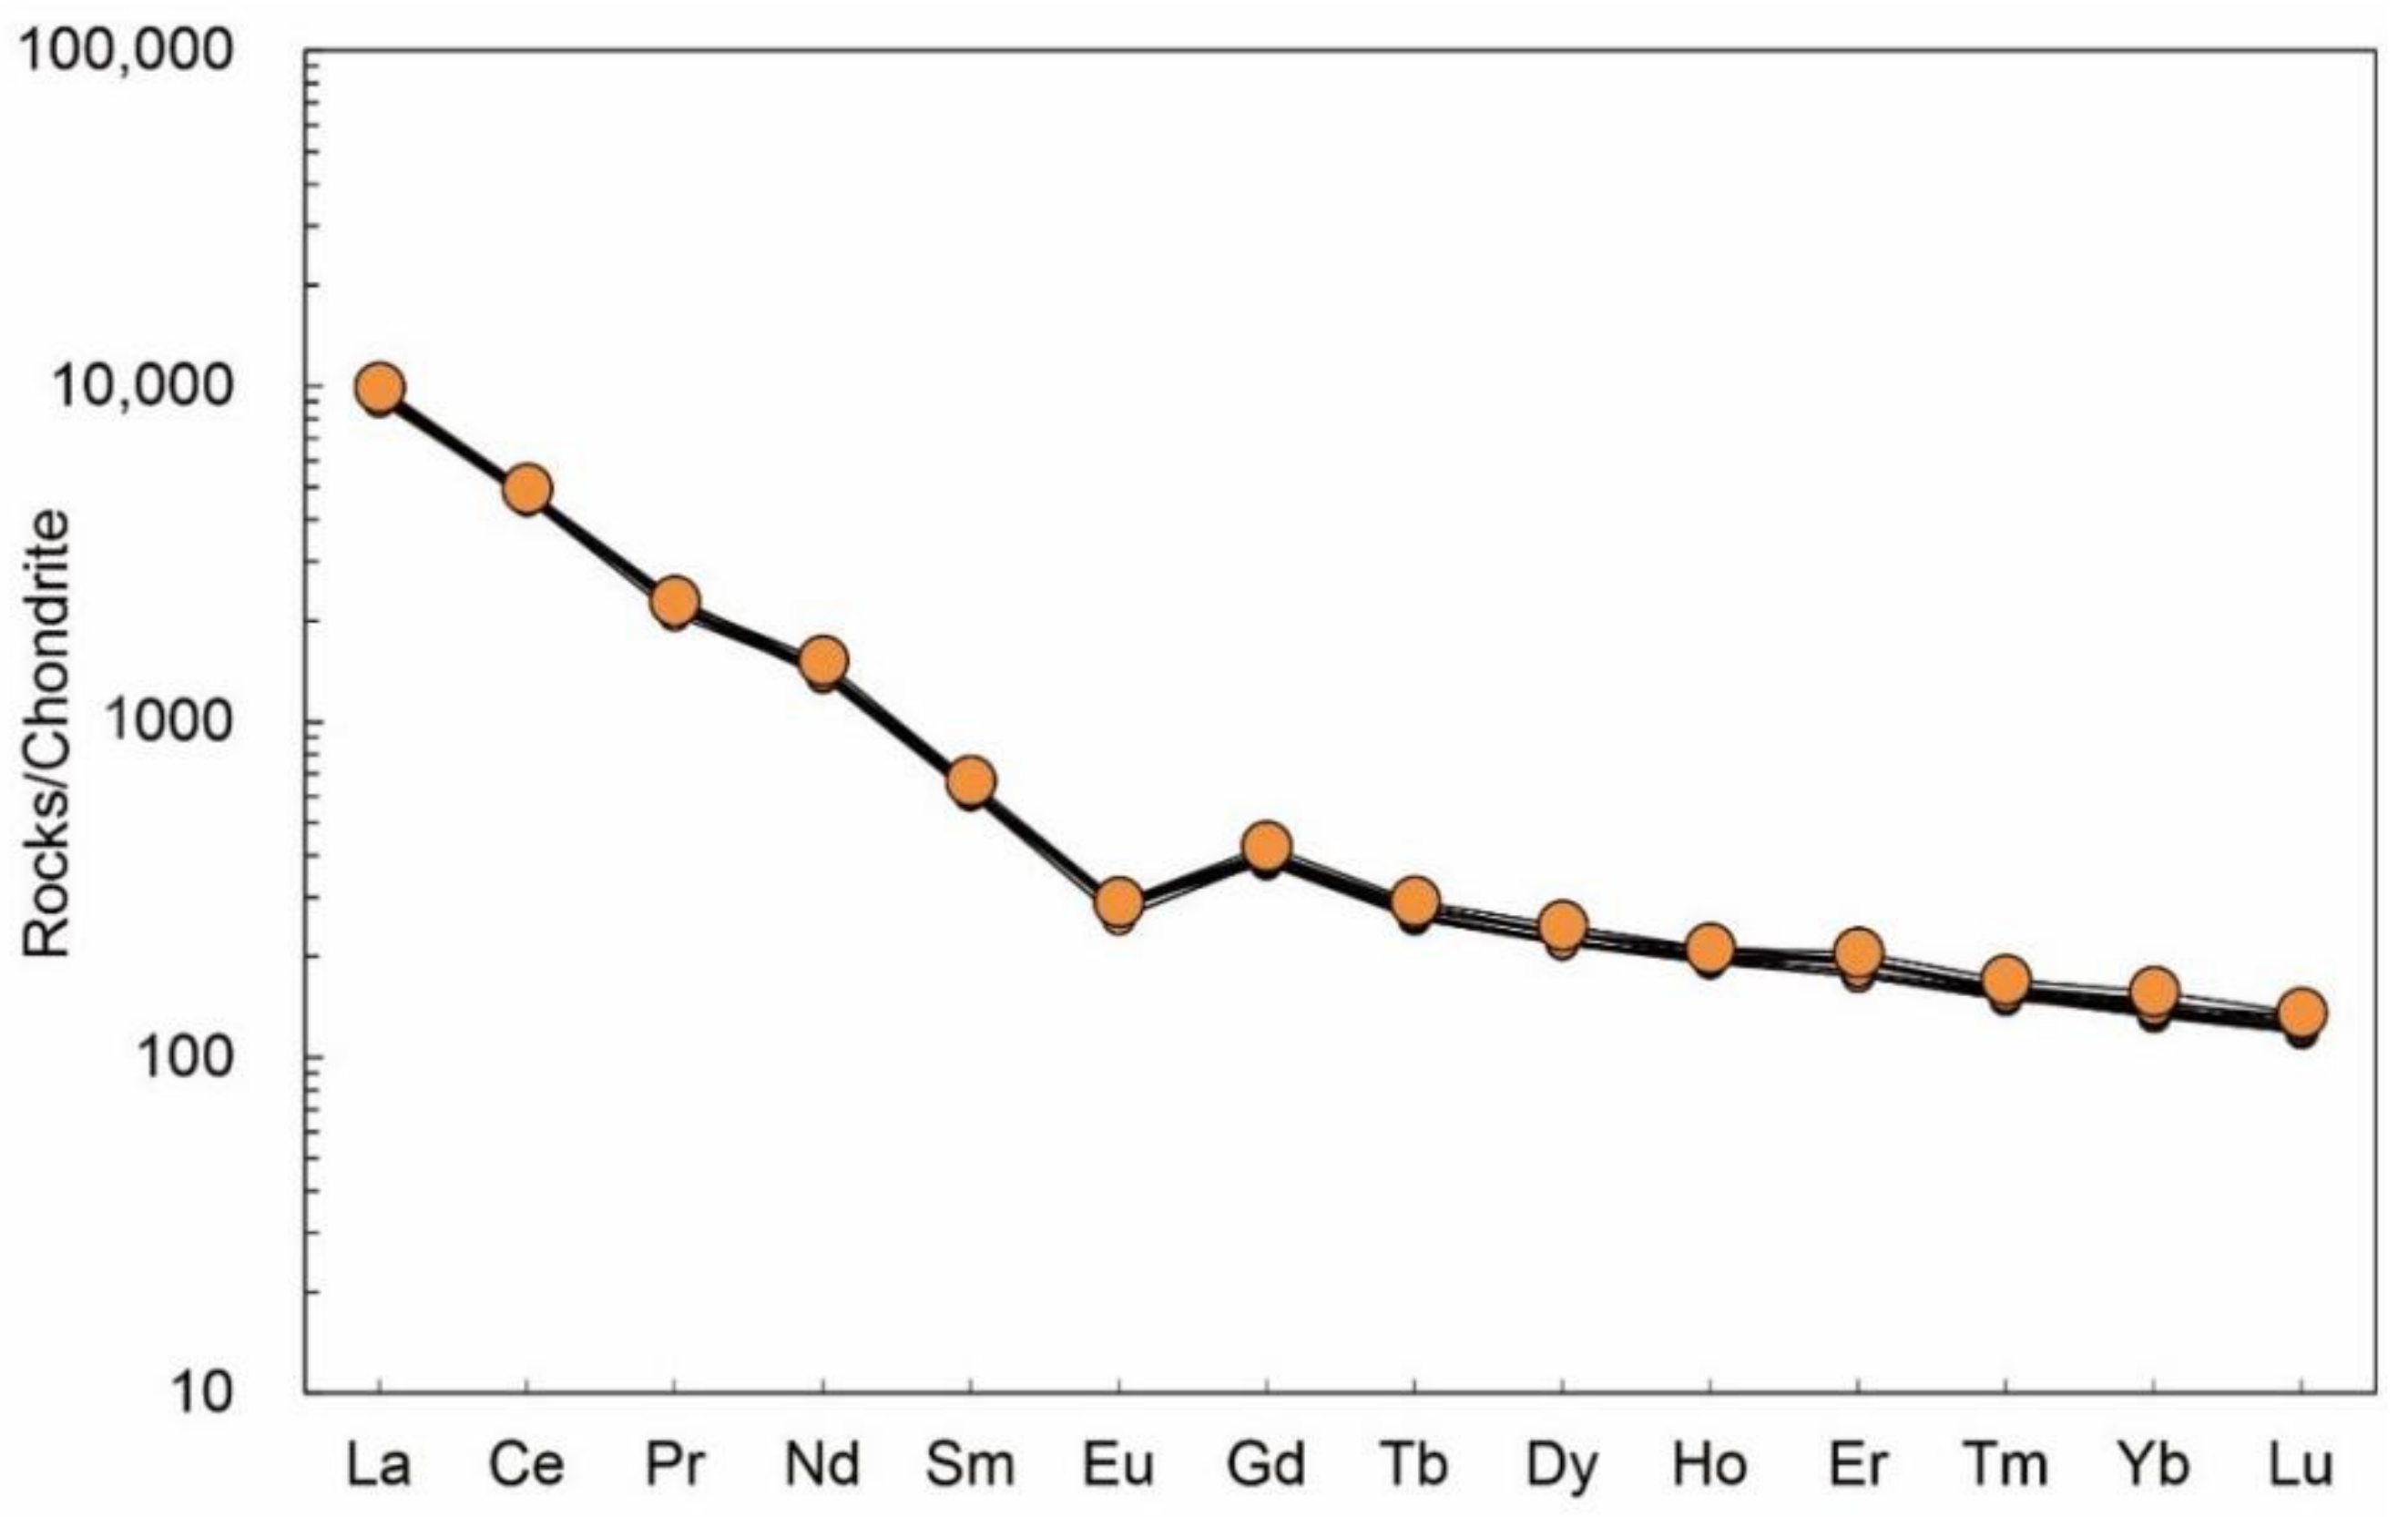
Table A3 indicate that the apatites contained a variety of trace elements. The most extensive trace elements in the Moroccan apatites were rare earth elements (La, Nd, and Ce), Sr, Th, U, Mn, etc. The samples contained 610.33–650.80 ppm of Sr, 86.76–107.82 ppm of Mn, 1.60–1.81 ppm of Pb, 181.57–204.33 ppm of Th, and 16.24–18.91 ppm of U. The total rare earth element content of the Moroccan apatite was 6031.54–6544.27 ppm, and the total LREE content was 5819.89–6307.31 ppm. The analytical results showed that in the chondrite standardisation model (
Figure 6), the samples displayed a right-skewed distribution, wherein light rare earth elements were slightly enriched and heavy rare earth elements were relatively deficient. The range of δEu was 0.53–0.59, showing a weak negative Eu anomaly; δCe ranged from 1.00 to 1.08 with no obvious Ce anomaly.
5. Discussion
5.1. Gemmological Characteristics
The test results were compared with the existing data for apatite from other origins (
Table A4), which indicated that the optical and physical properties of the apatite from Morocco are almost the same as those of apatites from all other locations. The colour of the Moroccan apatite is yellowish green, which is similar to the apatite produced in Mexico. However, most Moroccan apatites have low transparency and many cracks. Compared with the apatites from other places, the Moroccan apatite has a slightly larger RI.
5.2. Major and Trace Elements
5.2.1. Halogen Element Characteristics of Apatite
Yang’s [
41] paper studied apatites from nine origins, namely AP and MAD from Madagascar, Durango from Mexico, Otter Lake from Canada, NW–1 fron Ontario, UWA–1 from Bancroft, Slyudyanka from Lake Baikal, Mud Tank from Australia, McClure Mountain from Colorado, and SDG from Inner Mongolia (China). The relationship between the SiO
2, FeO, and MnO contents in apatite can reflect the origin of the apatite [
42], and therefore the apatites from the Moroccan region were plotted against the apatite mentioned by Yang [
41] (
Figure 7). The Moroccan apatites were thus determined to be of magmatic origin.
The F content of apatites in Morocco ranged from 2.00 wt % to 2.30 wt %, and the Cl content ranged from 0.49 wt % to 0.76 wt % (
Table A1). Projecting the F and Cl contents of the samples into the ternary diagram (
Figure 8), we found that Moroccan apatites were classified as fluorapatites. However, they had relatively high Cl contents, which indicates that Moroccan apatites are Cl–rich fluorapatites [
43]. The F and Cl contents of apatite had a negative correlation (
Figure 9), i.e., with the increase in F content, that of Cl decreased. By comparing with apatites of other origins, it was found that the apatites from Morocco had a relatively high Cl content. Since the Cl content in the apatite was directly related to the Cl content in the parent magma, it suggests that the Moroccan magma had a higher Cl content than magma from other regions. Brehler et al. [
44] stated that Cl is easily retained in fluids owing to its high solubility in water, making it easy to be removed from the parent rock during differentiation. Conversely, F is not easy to remove. Therefore, the rock mass remelted in the crust often exhibits F-rich and Cl-poor characteristics, which are reflected in the F and Cl compositions of apatite. Comparison with apatites of other origins mentioned by Yang [
41] showed that the samples had larger Cl/F ratios (0.21–0.38,
Table A1 and
Table A2), and the mineralised rocks containing such apatites may indicate that the parent magma came from the subduction zone and the higher Cl/F ratio inherited the halogen composition of the subducted oceanic crust [
45,
46].
5.2.2. Rare Earth Element Characteristics of Apatite
The trace element data for apatite of different rock types verify that apatite can accommodate a wide range of rare earth elements within its structure, with most elements showing a clear range in concentration and extent (
Table A3 and
Table A4). In the research of Yang [
41], we can know that apatite Durango (Mexico) was produced from iron deposits, MAD (Madagascar) from pegmatite, Otter Lake (Canada) from calcite, NW-1 (Ontario) from alkaline carbonatite, Slyudyanka (Lake Baikal) from metamorphic siliciclastic carbonate phosphogypsum, Mud Tank (Austalia) from carbonatite, McClure Mountain (Colorado) from anorthite, and SDG (Inner Mongolia, China) from alkaline ultramafic rocks (AP and NWA-1 generation environment unknown).
The chondrite-normalised REE distribution patterns of apatite usually show negative slopes (high (Ce/Yb)
N), indicating relative enrichment in light rare earth elements [
3]. The steepest slopes shown in
Figure 9 were Mud Tank from carbonate rocks and SDG from ultramafic rocks, which had (Ce/Yb)
N ranging from 113 to 132, whereas the (Ce/Yb)
N values of the other apatites were below 65 (
Figure 10). The Moroccan apatite had (Ce/Yb)
N = 31–36, which indicates its low HREE enrichment.
The redox transition from Ce
3+ to Ce
4+ or from Eu
3+ to Eu
2+ was abnormal in the chondrite standardisation model. Generally speaking, apatite rarely exhibits significant Ce anomalies. Only Mud Tank and Durango showed weak negative Ce anomalies, with δCe values of 0.77 and 0.90–0.93, respectively. In contrast, negative Eu anomalies (
Figure 11) are common in apatite, with Moro-1, AP, MAD, Otter Lake, Slyudyanka, and UWA-1 all showing weak negative Eu anomalies. Durango showed a strong negative Eu anomaly, NW-1 and SDG showed no Eu anomaly, and McClure Mountain showed a strong positive Eu anomaly. In conclusion, the magnitude of the Eu anomaly in apatite increased for larger fractionated rocks and may be constrained by feldspar crystallisation [
3,
47].
In addition, apatite from the Imilchil deposit, also from Central High Atlas, Morocco, was selected to compare the rare earth element characteristics with apatite from the Anemzi deposit (
Table A5). Apatite from the Imilchil deposit had a higher rare earth element with ΣREE = 10905.4 ppm [
48], while the total rare earth content of the samples was 6152–6674 ppm. Compared to the apatite from Anemzi, the (Ce/Yb)
N (= 13) of the apatite from Imilchil was smaller, which indicated a low enrichment of light rare earth elements in the apatite from Imilchil. Imilchil apatite had an Eu/Eu* value of 0.27, showing a more strongly negative Eu anomaly than the Eu/Eu* (0.53–0.57) value of Anemzi.
5.2.3. Redox Characteristics of Magma
The SO
3 content of apatite in magmatic rocks is indicative of the sulphur content, sulphur escape, and redox state in the melt with which it is in equilibrium, and it is of great significance to magma-related mineralisation [
17,
49,
50]. Sulphur in the melt enters the apatite usually in the form of S
6+, and the following two main reactions occur: S
6+ + Si
4+ = 2P
5+ and S
6+ + Na
+ = P
5+ + Ca
2+. The oxidised magma favours the presence of sulphur in the form of SO
42−. On the basis of the results of the major element test, the sulphur in the samples was mainly present as S
6+, which indicates a high degree of magma oxidation in the Moroccan area. Apatite can be classified by SO
3 content, i.e., high-sulphur apatite if greater than 0.7 wt %, medium-sulphur apatite if 0.3–0.7 wt %, and low-sulphur apatite if less than 0.3 wt % [
47,
48]. The main factors affecting the SO
3 content of the apatite are the oxygen and sulphur fugacities of the environment system [
51]. The sulphur content of the apatite from Morocco ranged from 0.4 to 0.61 wt %, which indicates that the apatite at this site is medium-sulphur apatite. The sulphur content of the apatites in other areas was found to be lower than the detection limit, thus showing that the oxygen and sulphur fugacities of the magma in Morocco are higher than those in other areas.
Mn, Eu, and Ce are elements in variable oxidation states that can be substituted with other elements in apatite. Mn2+, Eu3+, and Ce3+ are more accessible in terms of entering the apatite than Mn4+, Eu2+, and Ce4+ because they can replace Ca2+ directly or indirectly. Therefore, the oxidation status of the magma can be discerned using the Mn, Eu and Ce contents.
The Mn concentration in the apatite was negatively correlated with magma oxygen fugacity. Miles et al. [
52] proposed an empirical formula for calculating magma oxygen fugacity in terms of Mn concentration in apatite: lg fO
2 = −0.0022(±0.0003) Mn(ppm) − 9.76(±0.46). Bringing the Mn concentration of Moro-1 into the equation gives a range of lg fO
2 from −9.95 to −10.00. Overall, the magma in the Moroccan area was found to have a high oxygen fugacity.
The substitution of rare earth elements in the apatite follows the principle of proximity. The smaller the radius difference of the ions, the easier the replacement that occurs. Apatite has a more obvious preference for Eu
3+ and Ce
3+ compared with Eu
2+ and Ce
4+. This is because the ionic radius of Ca
2+ is closer to that of Eu
3+ compared with Eu
2+, whereas the radius of Ce
3+ is close to that of Ca
2+ in both seven- and ninefold coordinations [
53,
54]. Under oxidising conditions, Eu
2+ and Ce
3+ are converted into Eu
3+ and Ce
4+, respectively. With the whole-rock composition, temperature, and possible pressure kept constant, low oxygen fugacity results in higher Eu
2+/Eu
3+ and Ce
3+/Ce
4+ ratios as well as lower Eu
3+ content [
10,
55]. Therefore, the crystallisation of apatite under low oxygen fugacity will produce a strong negative Eu anomaly [
53]. In contrast, the Moroccan apatite showed a weaker negative Eu anomaly, further suggesting a relatively high oxygen fugacity of the magma in the region. However, the variation of individual elements may be controlled by not only the oxidation state of the magma but also other possible factors, such as the segregated crystallisation of feldspar, which may also affect the Eu content of the magma.
Cao et al. [
53] showed that (Eu/Eu*)
N better represents the redox state of the parent magma than (Ce/Ce*)
N. The authors emphasised that the (Eu/Eu*)
N depth anomaly represents a reducing environment, whereas a (Eu/Eu*)
N weak-to-moderate anomaly represents a more oxidising environment. On the basis of the work of Cao et al. [
53], we plotted the (Ce/Ce*)
N–(Eu/Eu*)
N diagram for Moroccan apatite (
Figure 12), and it was clear that the Moroccan apatite was located in a moderately oxidised magmatic environment. In addition, redox conditions for magmatic apatites of other origins involved in the work of Yang [
41] are also shown in
Figure 12. The apatites from Madagascar (AP and MAD) are produced from a moderately oxidising environment; the apatite from Mexico (Durango) is produced from a moderately reducing environment; and the apatites from Lake Baikal, Australia, and Colorado are produced from an oxidising environment.
6. Conclusions
The igneous apatite produced in Morocco has good scientific value and has the potential to become a standard sample. Through gemmological and spectroscopic tests on the Moroccan apatites, the Moroccan apatites were identified as fluorapatites. At the same time, the test results of the major and trace elements also showed that the Moroccan apatites contained high F and relatively low Cl contents, which are characteristic of Cl-rich fluorapatite.
Compared with apatites from other origins (Mexico, Madagascar, Canada, Ontario, Bancrof, Lake Baikal, Australia, Colorado, Inner Mongolia), the Cl content in the Moroccan apatites is relatively high, which is due to the higher Cl content in the parent magma. The SO3 content of the Moroccan apatites reach the standard of medium-sulphur apatites, which indicates the high oxygen and sulphur fugacities of the magma in the region. In addition, according to the weak negative Eu anomaly of the samples and the (Ce/Ce*)N–(Eu/Eu*)N diagram, it can be confirmed that the oxidation degree of the magma is high.
Author Contributions
Writing—original draft, P.Y.; writing—review and editing, P.Y., B.X. and Z.W.; investigation, P.Y. and D.L.; data curation, P.Y., B.X.; software, P.Y.; methodology, B.X.; resources, B.X. All authors have read and agreed to the published version of the manuscript.
Funding
This research was funded by National Key Technologies R&D Program, 2019YFA0708602, 2020YFA0714802, National Natural Science Foundation of China (42073038, 41803045), Young Talent Support Project of CAST, the Fundamental Research Funds for the Central Universities (Grant no. 265QZ2021012), and IGCP-662.
Data Availability Statement
The data presented in this study are available within the article.
Acknowledgments
This is the fourth contribution of B.X. for National Mineral Rock and Fossil Specimens Resource Center. We thank reviewers for constructive comments which helped in improving our paper.
Conflicts of Interest
The authors declare no conflict of interest.
Appendix A
Table A1.
Chemical composition and structural formula of Moroccan apatite, analysed by EMPA (in wt %).
Table A1.
Chemical composition and structural formula of Moroccan apatite, analysed by EMPA (in wt %).
| | Moro-1-1 | Moro-1-2 | Moro-1-3 | Moro-1-4 | Moro-1-5 | Moro-1-6 | Moro-1-7 | Moro-1-8 | Moro-2-1 | Moro-2-2 | Moro-2-3 | Moro-2-4 | Moro-2-5 | Moro-2-6 | Moro-2-7 | Moro-2-8 |
|---|
| CaO | 54.10 | 54.55 | 54.48 | 53.98 | 54.21 | 54.25 | 54.39 | 54.31 | 54.43 | 54.45 | 54.41 | 54.49 | 54.55 | 54.32 | 54.40 | 54.24 |
| P2O5 | 39.63 | 39.58 | 40.06 | 39.76 | 40.11 | 39.97 | 40.02 | 39.95 | 40.24 | 40.48 | 40.62 | 40.41 | 40.59 | 39.47 | 39.84 | 39.85 |
| SO3 | 0.53 | 0.60 | 0.40 | 0.53 | 0.48 | 0.40 | 0.44 | 0.44 | 0.47 | 0.40 | 0.45 | 0.43 | 0.41 | 0.49 | 0.47 | 0.46 |
| SiO2 | 0.67 | 0.82 | 0.50 | 0.63 | 0.68 | 0.65 | 0.65 | 0.69 | 0.68 | 0.59 | 0.58 | 0.56 | 0.60 | 0.66 | 0.69 | 0.70 |
| Na2O | 0.06 | 0.08 | 0.08 | 0.07 | 0.07 | 0.05 | 0.03 | 0.00 | 0.09 | 0.09 | 0.05 | 0.06 | 0.05 | 0.07 | 0.06 | 0.07 |
| FeO | 0.02 | 0.04 | 0.02 | 0.00 | 0.00 | 0.04 | 0.00 | 0.03 | 0.02 | 0.02 | 0.01 | 0.01 | 0.01 | 0.03 | 0.01 | 0.02 |
| MnO | 0.00 | 0.00 | 0.00 | 0.00 | 0.00 | 0.00 | 0.00 | 0.00 | 0.00 | 0.00 | 0.00 | 0.00 | 0.00 | 0.00 | 0.00 | 0.00 |
| SrO | 0.03 | 0.08 | 0.05 | 0.01 | 0.00 | 0.00 | 0.03 | 0.00 | 0.10 | 0.05 | 0.08 | 0.06 | 0.05 | 0.09 | 0.00 | 0.07 |
| Ce2O3 | 0.27 | 0.31 | 0.24 | 0.24 | 0.31 | 0.30 | 0.37 | 0.18 | 0.34 | 0.33 | 0.24 | 0.31 | 0.30 | 0.27 | 0.27 | 0.29 |
| As2O3 | 0.00 | 0.05 | 0.03 | 0.03 | 0.01 | 0.01 | 0.03 | 0.04 | 0.00 | 0.06 | 0.03 | 0.00 | 0.04 | 0.04 | 0.03 | 0.00 |
| F | 2.04 | 2.10 | 2.26 | 2.30 | 2.09 | 2.17 | 2.16 | 2.36 | 2.03 | 2.03 | 2.04 | 2.03 | 2.06 | 2.08 | 2.00 | 2.08 |
| Cl | 0.71 | 0.70 | 0.51 | 0.73 | 0.63 | 0.51 | 0.50 | 0.49 | 0.76 | 0.73 | 0.69 | 0.72 | 0.62 | 0.70 | 0.71 | 0.64 |
| Total | 97.69 | 98.44 | 98.42 | 97.86 | 98.20 | 98.07 | 98.31 | 98.37 | 98.76 | 98.83 | 98.86 | 98.66 | 98.99 | 97.87 | 98.07 | 97.77 |
| Cl/F | 0.35 | 0.33 | 0.23 | 0.32 | 0.30 | 0.24 | 0.23 | 0.21 | 0.38 | 0.36 | 0.34 | 0.36 | 0.30 | 0.34 | 0.36 | 0.31 |
| Cations(apfu) | | | | | | | | | | | | | | | |
| Si4+ | 0.055 | 0.067 | 0.040 | 0.052 | 0.056 | 0.053 | 0.053 | 0.057 | 0.055 | 0.048 | 0.047 | 0.046 | 0.049 | 0.054 | 0.056 | 0.057 |
| Ca2+ | 4.736 | 4.753 | 4.769 | 4.721 | 4.720 | 4.752 | 4.758 | 4.763 | 4.701 | 4.697 | 4.695 | 4.708 | 4.713 | 4.681 | 4.717 | 4.688 |
| Na+ | 0.010 | 0.013 | 0.013 | 0.011 | 0.011 | 0.008 | 0.005 | 0.000 | 0.014 | 0.014 | 0.008 | 0.009 | 0.008 | 0.011 | 0.009 | 0.011 |
| Fe2+ | 0.001 | 0.001 | 0.001 | 0.000 | 0.000 | 0.003 | 0.000 | 0.002 | 0.001 | 0.001 | 0.001 | 0.001 | 0.001 | 0.002 | 0.001 | 0.001 |
| Mn2+ | 0.000 | 0.000 | 0.000 | 0.000 | 0.000 | 0.000 | 0.000 | 0.000 | 0.001 | 0.001 | 0.000 | 0.000 | 0.001 | 0.000 | 0.000 | 0.000 |
| Ce2+ | 0.008 | 0.009 | 0.007 | 0.007 | 0.009 | 0.009 | 0.011 | 0.005 | 0.010 | 0.010 | 0.007 | 0.009 | 0.009 | 0.008 | 0.008 | 0.009 |
| P5+ | 2.741 | 2.725 | 2.771 | 2.747 | 2.760 | 2.766 | 2.766 | 2.768 | 2.747 | 2.759 | 2.770 | 2.759 | 2.771 | 2.704 | 2.746 | 2.738 |
| F− | 0.184 | 0.181 | 0.133 | 0.189 | 0.163 | 0.133 | 0.130 | 0.126 | 0.194 | 0.187 | 0.177 | 0.184 | 0.159 | 0.180 | 0.184 | 0.165 |
| Cl− | 0.099 | 0.097 | 0.071 | 0.101 | 0.087 | 0.071 | 0.070 | 0.067 | 0.104 | 0.100 | 0.095 | 0.099 | 0.085 | 0.096 | 0.098 | 0.089 |
Table A2.
Chemical composition and structural formula of apatite from other origins, analysed by EMPA (in wt %). Data derived from [
41].
Table A2.
Chemical composition and structural formula of apatite from other origins, analysed by EMPA (in wt %). Data derived from [
41].
| | AP1 | AP2 | DurangoChew | Durango Fishier | DurangoGriffin | Durango Hou | MAD | Otter Lake | NW-1 | Sltudyanka | UWA-1 | Mud Tank | McClure Mountain | SDG |
|---|
| CaO | 55.57 | 55.66 | 53.9 | 53.99 | 53.85 | 53.94 | 55.3 | 53.44 | 54.24 | 54.66 | 53.67 | 55.3 | 55.08 | 51.58 |
| P2O5 | 40.82 | 39.74 | 41.88 | 42.16 | 41.91 | 42.25 | 39.94 | 38.45 | 39.81 | 40.7 | 40.12 | 42.09 | 41.83 | 34.48 |
| SiO2 | 0.79 | 1.22 | 0.46 | 0.18 | 0.32 | 0.28 | 0.83 | 0.94 | 1.25 | 0.44 | 0.97 | 0.01 | 0.25 | 3.04 |
| FeO | 0.02 | 0.01 | 0.03 | 0.04 | 0.04 | 0.03 | 0.02 | 0.02 | 0.01 | 0.01 | bdl | 0.07 | 0.01 | bdl |
| MnO | 0.03 | 0.03 | 0.02 | 0.01 | 0.01 | 0.01 | 0.02 | 0.01 | 0.02 | 0.02 | 0.02 | 0.03 | 0.03 | 0.02 |
| MgO | bdl | 0.01 | 0.04 | 0.02 | 0.02 | 0.03 | 0.01 | bdl | 0.01 | 0.01 | 0.01 | 0.06 | 0.01 | 0.01 |
| SrO | 0.24 | 0.07 | 0.05 | 0.04 | 0.05 | 0.05 | 0.17 | 0.2 | 0.53 | 0.14 | 0.1 | 0.35 | 0.4 | 1.44 |
| Cl | 0.3 | 0.2 | 0.41 | 0.43 | 0.4 | 0.39 | 0.2 | 0.05 | 0.01 | 0.13 | 0.02 | 0.04 | 0.02 | 0.24 |
| F | 3.97 | 4.16 | 3.71 | 3.63 | 4.53 | 3.68 | 4.13 | 4.88 | 1.84 | 3.88 | 4.49 | 2.02 | 3.37 | 4.15 |
| Total | 100.01 | 99.3 | 99.21 | 99.44 | 99.54 | 99.44 | 98.83 | 96.58 | 96.96 | 99.58 | 97.42 | 99.33 | 99.59 | 93.21 |
| Cl/F | 0.08 | 0.05 | 0.11 | 0.12 | 0.09 | 0.11 | 0.05 | 0.01 | 0.01 | 0.03 | 0.004 | 0.02 | 0.01 | 0.06 |
| Cations (apfu) | | | | | | | | | | | | | |
| Ca2+ | 4.846 | 4.943 | 4.667 | 4.651 | 4.665 | 4.648 | 4.910 | 4.946 | 4.895 | 4.834 | 4.841 | 4.781 | 4.795 | 4.846 |
| Fe2+ | 0.001 | 0.000 | 0.002 | 0.003 | 0.003 | 0.002 | 0.001 | 0.001 | 0.001 | 0.001 | 0.000 | 0.005 | 0.001 | 0.001 |
| Mn2+ | 0.001 | 0.001 | 0.001 | 0.001 | 0.001 | 0.001 | 0.001 | 0.001 | 0.001 | 0.001 | 0.001 | 0.002 | 0.002 | 0.001 |
| P5+ | 2.813 | 2.789 | 2.865 | 2.870 | 2.869 | 2.877 | 2.802 | 2.812 | 2.839 | 2.844 | 2.859 | 2.876 | 2.877 | 2.813 |
| Mg2+ | 0.000 | 0.001 | 0.005 | 0.002 | 0.002 | 0.004 | 0.001 | 0.000 | 0.001 | 0.001 | 0.001 | 0.007 | 0.001 | 0.000 |
| F− | 0.077 | 0.052 | 0.105 | 0.109 | 0.102 | 0.099 | 0.052 | 0.014 | 0.003 | 0.034 | 0.005 | 0.010 | 0.005 | 0.077 |
| Cl− | 0.041 | 0.028 | 0.056 | 0.059 | 0.055 | 0.053 | 0.028 | 0.007 | 0.001 | 0.018 | 0.003 | 0.005 | 0.003 | 0.041 |
Table A3.
Chemical composition and structural formula of Moroccan apatite, analysed by LA-ICP-MS.
Table A3.
Chemical composition and structural formula of Moroccan apatite, analysed by LA-ICP-MS.
| | | Moro-1-1 | Moro-1-2 | Moro-1-3 | Moro-1-4 | Moro-1-5 | Moro-1-6 | Moro-1-7 | Moro-1-8 | Moro-1-9 | Moro-1-10 | Moro-1-11 | Moro-1-12 |
|---|
| Ti | ppm | 0.59 | 0.39 | 0.60 | 0.43 | 0.00 | 0.04 | 0.17 | 0.82 | 0.39 | 0.33 | 0.36 | 0.17 |
| Mn | ppm | 107.57 | 107.82 | 101.21 | 102.40 | 89.11 | 96.17 | 86.79 | 98.98 | 91.11 | 93.90 | 94.17 | 96.31 |
| Rb | ppm | 0.12 | 0.00 | 0.00 | 0.02 | 0.00 | 0.00 | 0.00 | 0.00 | 0.01 | 0.10 | 0.00 | 0.00 |
| Sr | ppm | 618.13 | 650.80 | 623.41 | 616.86 | 621.01 | 629.42 | 610.33 | 636.82 | 628.45 | 638.76 | 647.13 | 645.73 |
| ZrO2 | wt% | 0.00 | 0.00 | 0.00 | 0.00 | 0.00 | 0.00 | 0.00 | 0.00 | 0.00 | 0.00 | 0.00 | 0.00 |
| Nb | ppm | 0.01 | 0.02 | 0.02 | 0.01 | 0.02 | 0.02 | 0.02 | 0.01 | 0.01 | 0.03 | 0.02 | 0.03 |
| Ba | ppm | 1.29 | 1.21 | 1.25 | 1.53 | 1.31 | 1.27 | 1.32 | 1.62 | 1.34 | 1.34 | 1.31 | 1.30 |
| La | ppm | 2117.01 | 2128.08 | 2189.76 | 2206.03 | 2097.55 | 2193.51 | 2257.56 | 2328.49 | 2168.07 | 2177.43 | 2217.85 | 2304.67 |
| Ce | ppm | 2763.91 | 2886.02 | 2784.85 | 2881.89 | 2805.83 | 2851.43 | 2939.25 | 2954.81 | 2746.28 | 2797.01 | 2817.56 | 2976.57 |
| Pr | ppm | 193.71 | 202.07 | 209.67 | 208.12 | 203.39 | 209.55 | 216.96 | 218.62 | 207.44 | 209.65 | 207.02 | 212.87 |
| Nd | ppm | 639.77 | 632.75 | 635.55 | 649.15 | 621.02 | 635.10 | 663.70 | 664.60 | 635.88 | 643.40 | 670.83 | 696.82 |
| Sm | ppm | 90.72 | 90.72 | 91.95 | 94.27 | 91.13 | 94.51 | 96.99 | 100.26 | 93.16 | 96.10 | 95.95 | 99.82 |
| Eu | ppm | 14.78 | 16.02 | 15.91 | 16.51 | 14.71 | 15.73 | 15.55 | 16.63 | 15.59 | 16.45 | 15.95 | 16.55 |
| Gd | ppm | 77.45 | 75.99 | 77.15 | 79.04 | 78.10 | 80.34 | 81.74 | 82.53 | 79.06 | 82.02 | 81.73 | 85.78 |
| Tb | ppm | 9.68 | 9.50 | 9.78 | 9.76 | 9.65 | 9.81 | 10.09 | 10.45 | 9.76 | 10.06 | 10.36 | 10.72 |
| Dy | ppm | 55.94 | 54.30 | 54.42 | 55.37 | 54.32 | 55.27 | 58.10 | 58.80 | 54.57 | 58.15 | 58.43 | 61.60 |
| Ho | ppm | 10.67 | 10.60 | 10.79 | 10.72 | 10.70 | 11.06 | 11.29 | 11.68 | 10.92 | 11.03 | 11.60 | 11.71 |
| Er | ppm | 28.34 | 28.43 | 28.37 | 28.53 | 28.39 | 29.30 | 31.15 | 31.83 | 29.35 | 31.09 | 31.44 | 33.27 |
| Tm | ppm | 3.78 | 3.77 | 3.72 | 3.83 | 3.79 | 3.87 | 3.97 | 4.05 | 3.90 | 3.91 | 4.07 | 4.26 |
| Yb | ppm | 22.79 | 22.02 | 22.83 | 22.32 | 22.95 | 22.87 | 24.42 | 24.09 | 23.38 | 23.66 | 24.78 | 26.22 |
| Lu | ppm | 2.99 | 2.95 | 2.97 | 3.02 | 3.04 | 3.18 | 3.24 | 3.32 | 3.15 | 3.10 | 3.12 | 3.38 |
| Hf | ppm | 0.01 | 0.01 | 0.02 | 0.00 | 0.01 | 0.01 | 0.00 | 0.00 | 0.01 | 0.00 | 0.00 | 0.02 |
| Ta | ppm | 0.00 | 0.00 | 0.00 | 0.00 | 0.00 | 0.00 | 0.00 | 0.00 | 0.00 | 0.00 | 0.00 | 0.00 |
| Pb | ppm | 1.62 | 1.67 | 1.66 | 1.80 | 1.60 | 1.69 | 1.65 | 1.81 | 1.69 | 1.70 | 1.69 | 1.75 |
| Th | ppm | 184.37 | 181.57 | 183.30 | 188.67 | 181.81 | 190.45 | 193.79 | 201.34 | 192.29 | 195.07 | 196.11 | 204.33 |
| U | ppm | 16.48 | 17.18 | 18.09 | 18.91 | 16.24 | 17.33 | 17.31 | 17.88 | 17.20 | 17.27 | 17.52 | 18.08 |
| ΣLREE | ppm | 5819.89 | 5955.67 | 5927.67 | 6055.97 | 5833.63 | 5999.83 | 6190.02 | 6283.41 | 5866.43 | 5940.04 | 6025.15 | 6307.31 |
| ΣHREE | ppm | 211.65 | 207.57 | 210.02 | 212.60 | 210.94 | 215.69 | 224.00 | 226.73 | 214.09 | 223.01 | 225.54 | 236.96 |
| ΣREE | ppm | 6031.54 | 6163.24 | 6137.69 | 6268.57 | 6044.57 | 6215.52 | 6414.02 | 6510.14 | 6080.52 | 6163.05 | 6250.69 | 6544.27 |
| δEu | | 0.539 | 0.590 | 0.577 | 0.585 | 0.533 | 0.552 | 0.534 | 0.559 | 0.555 | 0.567 | 0.551 | 0.547 |
| δCe | | 1.058 | 1.079 | 1.008 | 1.043 | 1.053 | 1.031 | 1.030 | 1.015 | 1.004 | 1.015 | 1.020 | 1.042 |
Table A4.
Characteristics of apatite from different production areas.
Table A4.
Characteristics of apatite from different production areas.
| Origin | Color | Luster | Transparency | RI | DR | SG | Uv | Pleochroism | Size | Feature Observation |
|---|
Durango,
Mexico | Homogeneous greenish yellow | glassy lustre | transparent | 1.631–1.636 | 0.005 | 3.21 | inert to long-wave; weak yellow to short-wave | weak dichroism | the largest of which measured 14.97 × 9.47 × 7.97 mm | Emerald- and cushion-cut. The cushion-cut stone revealed straight growth zoning. The emerald-cut contained a small liquid feather. |
| Ling qiu, Shanxi Province | Yellow, dark green and dark blue-green | glassy lustre | translucent to transparent | 1.632–1.639 | 0.004 | 3.19—3.22 | inert | medium dichroism | the largest of which measured 3 × 1 × 0.5 cm | Hexagonal columnar or subhexagonal columnar crystal form; high degree of self-formation showing massive or columnar. |
Anhui
Province | light yellow | glassy lustre to weak glassy lustre | transparent | 1.633–1.637
1.635—1.638 | 0.004
0.003 | 3.19—3.20 | medium yellow-green | | the largest of which measured 1.5 × 0.4 × 0.5 cm | Sheet-like and plate-like, poorly self-formation, no obvious crystalline shape, obvious longitudinal lines between crystal faces. |
Shaanxi
Province | Gray-green | glassy lustre | transparent | 1.633–1.637
1.634–1.636 | 0.004
0.002 | 2.70–2.71 | inert | weak dichroism | the largest of which measured 6.5 × 4 × 4 mm | Massive, with obvious hexagonal columnar crystal form, high degree of self-formation, smooth surface, and poor cleavage. |
Table A5.
Chemical composition and structural formula of Moroccan apatite, analysed by LA-ICP-MS. Data derived from [
41,
48].
Table A5.
Chemical composition and structural formula of Moroccan apatite, analysed by LA-ICP-MS. Data derived from [
41,
48].
| | | AP1 | AP2 | DurangoChew | Durango Fishier | DurangoGriffin | Durango Hou | MAD | Otter Lake | NW-1 | Sltudyanka | UWA-1 | Mud Tank | McClure Mountain | SDG | Imilchil |
|---|
| Rb | ppm | 0.18 | 0.26 | 0.12 | 0.11 | 0.13 | 0.12 | 0.25 | 0.43 | 0.15 | 0.02 | 0.44 | 0.22 | 0.12 | 0.2 | - |
| Sr | ppm | 2506 | 591 | 482 | 456 | 491 | 476 | 1650 | 1668 | 5512 | 1231 | 1186 | 2681 | 3422 | 11,368 | 953 |
| Ba | ppm | 1.3 | 1.5 | 1.7 | 1.4 | 1.8 | 1.5 | 1.2 | 2 | 13 | 10 | 0.8 | 83 | 8.3 | 1.3 | 0.6 |
| Nb | ppm | 0.23 | 2.6 | 1 | 0.02 | 0.03 | 0.02 | 0.07 | 0.26 | 4.6 | 0.43 | 0.7 | 0.42 | 0.15 | 2.4 | - |
| Ta | ppm | 0.01 | 0.03 | 0 | 0 | 0 | 0 | 0.01 | 0.08 | 0.07 | 0 | 0.85 | 0.03 | 0.03 | 0.03 | - |
| Zr | ppm | 5.9 | 6.3 | 1.4 | 0.6 | 1.1 | 0.8 | 9.8 | 1.61 | 52 | 5.79 | 1.71 | 1.9 | 3.2 | 48 | 8 |
| Hf | ppm | 0.31 | 0.51 | 0.23 | 0.19 | 0.23 | 0.26 | 0.45 | 0.08 | 0.24 | 0.29 | 0.13 | 0.1 | 0.2 | 0.39 | - |
| Pb | ppm | 15 | 48 | 0.9 | 0.4 | 0.7 | 0.6 | 16 | 61 | 26 | 10 | 56 | 3 | 3.7 | 50 | 2.7 |
| Th | ppm | 647 | 2095 | 320 | 151 | 270 | 231 | 661 | 753 | 48 | 142 | 828 | 11 | 38 | 705 | 285 |
| U | ppm | 24 | 66 | 20 | 7 | 11 | 11 | 19 | 99 | 122 | 68 | 165 | 2.1 | 12 | 47 | 31 |
| La | ppm | 1925 | 2269 | 4285 | 3176 | 3819 | 3334 | 1745 | 2772 | 3576 | 77 | 2857 | 414 | 1609 | 7209 | 2457 |
| Ce | ppm | 3783 | 4261 | 5405 | 3635 | 5178 | 4561 | 3338 | 6832 | 7477 | 140 | 6876 | 980 | 2362 | 15,668 | 3708 |
| Pr | ppm | 403 | 422 | 488 | 307 | 496 | 436 | 349 | 832 | 865 | 14 | 901 | 237 | 126 | 1843 | 303 |
| Nd | ppm | 1501 | 1435 | 1677 | 1009 | 1745 | 1514 | 1290 | 3205 | 3468 | 53 | 3747 | 550 | 843 | 7344 | 1487 |
| Sm | ppm | 205 | 178 | 237 | 127 | 244 | 207 | 173 | 445 | 582 | 10 | 731 | 93 | 102 | 911 | 274 |
| Eu | ppm | 31 | 19 | 21 | 15 | 22 | 20 | 25 | 78 | 169 | 2 | 93 | 25 | 37 | 196 | 35 |
| Gd | ppm | 120 | 105 | 204 | 105 | 206 | 174 | 102 | 275 | 400 | 9 | 676 | 64 | 77 | 468 | 588 |
| Tb | ppm | 14 | 12 | 28 | 13 | 27 | 23 | 12 | 34 | 49 | 1 | 114 | 6.4 | 8.3 | 38 | 39 |
| Dy | ppm | 64 | 61 | 154 | 68 | 146 | 123 | 53 | 173 | 225 | 8 | 716 | 25 | 40 | 140 | 245 |
| Ho | ppm | 11 | 11 | 32 | 14 | 30 | 25 | 9.2 | 33 | 34 | 2 | 154 | 3.4 | 7.4 | 21 | 48 |
| Er | ppm | 25 | 26 | 83 | 34 | 77 | 64 | 21 | 85 | 68 | 5 | 421 | 6 | 18 | 49 | 129 |
| Tm | ppm | 3 | 3.3 | 10 | 4 | 10 | 8 | 2.4 | 11 | 7 | 1 | 55 | 0.5 | 2.3 | 5.5 | 16 |
| Yb | ppm | 18 | 20 | 59 | 27 | 56 | 47 | 15 | 68 | 35 | 4 | 311 | 2.4 | 14 | 33 | 81 |
| Lu | ppm | 2.3 | 2.4 | 6 | 4 | 7 | 6 | 1.9 | 8.4 | 3.6 | 0.48 | 31 | 0.25 | 1.9 | 4.3 | 8.4 |
| Y | ppm | 309 | 321 | 911 | 427 | 886 | 762 | 257 | 889 | 851 | 46 | 3583 | 73 | 206 | 605 | 1455 |
| ΣLREE | ppm | 7848 | 8584 | 12,113 | 8269 | 11,504 | 10,072 | 6920 | 14,164 | 16,137 | 296 | 15,205 | 2299 | 5079 | 33,171 | 8296 |
| ΣHREE | ppm | 257.3 | 240.7 | 576 | 269 | 559 | 470 | 216.5 | 687.4 | 821.6 | 30.48 | 2478 | 107.95 | 168.9 | 758.8 | 2609.4 |
| ΣREE | ppm | 8105.3 | 8824.7 | 12,689 | 8538 | 12,063 | 10,542 | 7136.5 | 14,851.4 | 16,958.6 | 326.48 | 17,683 | 2406.95 | 5247.9 | 33,929.8 | 10,905.4 |
| δEu | | 0.60 | 0.42 | 0.29 | 0.40 | 0.30 | 0.32 | 0.58 | 0.68 | 1.07 | 0.64 | 0.40 | 0.99 | 1.28 | 0.92 | 0.27 |
| δCe | | 1.05 | 1.07 | 0.92 | 0.90 | 0.92 | 0.93 | 1.05 | 1.10 | 1.04 | 1.05 | 1.05 | 0.77 | 1.29 | 1.05 | 1.05 |
References
- Bruand, E.; Fowler, M.; Storey, C.; Darling, J. Apatite trace element and isotope applications to petrogenesis and provenance. Am. Mineral. 2017, 102, 75–84. [Google Scholar] [CrossRef]
- Boyce, J.W.; Hervig, R.L. Apatite as a Monitor of Late-Stage Magmatic Processes at Volcán Irazú, Costa Rica. Contrib. Miner. Petrol. 2009, 157, 135–145. [Google Scholar] [CrossRef]
- Belousova, E.A.; Griffin, W.L.; O’reilly, S.Y.; Fisher, N.I. Apatite as an indicator mineral for mineral exploration: Trace-element compositions and their relationship to host rock type. J. Geochem. Explor. 2002, 76, 45–69. [Google Scholar] [CrossRef]
- Zhang, F.; Li, W.; White, N.; Zhang, L.; Qiao, X.; Yao, Z. Geochemical and isotopic study of metasomatic apatite: Implications for gold mineralization in Xindigou, northern China. Ore Geol. Rev. 2020, 127, 103853. [Google Scholar] [CrossRef]
- Ren, Z.; Cui, J.; Liu, C.; Li, T.; Chen, G.; Dou, S.; Tian, T.; Luo, Y. Apatite Fission Track Evidence of Uplift Cooling in the Qiangtang Basin and Constraints on the Tibetan Plateau Uplift. Acta Geol. Sin. Engl. Ed. 2015, 89, 467–484. [Google Scholar] [CrossRef]
- Ouabid, M.; Raji, O.; Dautria, J.; Bodinier, J.; Parat, F.; El Messbahi, H.; Garrido, C.; Ahechach, Y. Petrological and geochemical constraints on the origin of apatite ores from Mesozoic alkaline intrusive complexes, Central High-Atlas, Morocco. Ore Geol. Rev. 2021, 136, 104250. [Google Scholar] [CrossRef]
- Pasero, M.; Kampf, A.R.; Ferraris, C.; Pekov, I.V.; Rakovan, J.; White, T.J. Nomenclature of the Apatite Supergroup Minerals. Eur. J. Mineral. 2010, 22, 163–179. [Google Scholar] [CrossRef]
- Rossi, M.; Ghiara, M.R.; Chita, G.; Capitelli, F. Crystal-Chemical and Structural Characterization of Fluorapatites in Ejecta from Somma-Vesuvius Volcanic Complex. Am. Mineral. 2011, 96, 1828–1837. [Google Scholar] [CrossRef]
- Pan, Y.; Fleet, M.E. Compositions of the Apatite-Group Minerals: Substitution Mechanisms and Controlling Factors. Rev. Mineral. Geochem. 2002, 48, 13–49. [Google Scholar] [CrossRef]
- Sha, L.-K.; Chappell, B.W. Apatite Chemical Composition, Determined by Electron Microprobe and Laser-Ablation Inductively Coupled Plasma Mass Spectrometry, as a Probe into Granite Petrogenesis. Geochim. Cosmochim. Acta 1999, 63, 3861–3881. [Google Scholar] [CrossRef]
- Xu, B.; Hou, Z.-Q.; Griffin, W.L.; Lu, Y.; Belousova, E.; Xu, J.-F.; O’Reilly, S.Y. Recycled Volatiles Determine Fertility of Porphyry Deposits in Collisional Settings. Am. Mineral. 2021, 106, 656–661. [Google Scholar] [CrossRef]
- Chen, N.; Pan, Y.; Weil, J.A. Electron Paramagnetic Resonance Spectroscopic Study of Synthetic Fluorapatite: Part I. Local Structural Environment and Substitution Mechanism of Gd3+ at the Ca2 Site. Am. Mineral. 2002, 87, 37–46. [Google Scholar] [CrossRef]
- Fleet, M.E.; Pan, Y. Site Preference of Rare Earth Elements in Fluorapatite. Am. Mineral. 1995, 80, 329–335. [Google Scholar] [CrossRef]
- Mao, M.; Rukhlov, A.S.; Rowins, S.M.; Spence, J.; Coogan, L.A. Apatite Trace Element Compositions: A Robust New Tool for Mineral Exploration. Econ. Geol. 2016, 111, 1187–1222. [Google Scholar] [CrossRef]
- Rakovan, J.F.; Hughes, J.M. Strontium in the apatite structure: Strontium fluorapatite and belovite–(Ce). Can. Mineral. 2000, 38, 839–845. [Google Scholar] [CrossRef]
- Piccoli, P.M.; Candela, P.A. Apatite in Igneous Systems. Rev. Mineral. Geochem. 2002, 48, 255–292. [Google Scholar] [CrossRef]
- Hughes, J.M.; Ertl, A.; Bernhardt, H.-J.; Rossman, G.R.; Rakovan, J. Mn-Rich Fluorapatite from Austria: Crystal Structure, Chemical Analysis, and Spectroscopic Investigations. Am. Mineral. 2004, 89, 629–632. [Google Scholar] [CrossRef]
- Sudarsanan, K.; Young, R.A.; Wilson, A.J.C. The Structures of Some Cadmium ‘apatites’ Cd5(MO4)3X. I. Determination of the Structures of Cd5(VO4)3I, Cd5(PO4)3Br, Cd3(AsO4)3Br and Cd5(VO4)3Br. Acta Cryst. B Struct. Sci. 1977, 33, 3136–3142. [Google Scholar] [CrossRef]
- Peng, G.; Luhr, J.F.; McGee, J.J. Factors Controlling Sulfur Concentrations in Volcanic Apatite. Am. Mineral. 1997, 82, 1210–1224. [Google Scholar] [CrossRef]
- Perseil, E.-A.; Blanc, P.; Ohnenstetter, D. As-Bearing Fluorapatite in Manganiferous Deposits from St. Marcel - Praborna, Val D’Aosta, Italy. Can. Mineral. 2000, 38, 101–117. [Google Scholar] [CrossRef]
- Xu, B.; Hou, Z.-Q.; Griffin, W.L.; Zheng, Y.-C.; Wang, T.; Guo, Z.; Hou, J.; Santosh, M.; O’Reilly, S.Y. Cenozoic Lithospheric Architecture and Metallogenesis in Southeastern Tibet. Earth-Sci. Rev. 2021, 214, 103472. [Google Scholar] [CrossRef]
- Michard, A.; Cailleux, Y.; Hoepffffner, C. L’orogénese mésétien du Maroc: Structure, deformation hercynienne et déplacements. Mém. Serv. Géol. Maroc 1989, 335, 313–327. [Google Scholar]
- Choubert, G. Histoire geologique du Precambrien de l’Anti-Atlas. Notes Mem. Serv. Geol. Maroc 1963, 162, 352. [Google Scholar]
- Ghorbal, B.; Bertotti, G.; Foeken, J.; Andriessen, P. Unexpected Jurassic to Neogene Vertical Movements in ‘Stable’ Parts of NW Africa Revealed by Low Temperature Geochronology. Terra Nova 2008, 20, 355–363. [Google Scholar] [CrossRef]
- Oukassou, M.; Saddiqi, O.; Barbarand, J.; Sebti, S.; Baidder, L.; Michard, A. Post-Variscan Exhumation of the Central Anti-Atlas (Morocco) Constrained by Zircon and Apatite Fission-Track Thermochronology. Terra Nova 2013, 25, 151–159. [Google Scholar] [CrossRef]
- Xu, B.; Hou, Z.; Zheng, Y.; Zhou, Y.; Zhou, L.; Yang, Y.; Han, Y.; Zhen, G.; Wu, C. Jurassic Hornblende Gabbros in Dongga, Eastern Gangdese, Tibet: Partial Melting of Mantle Wedge and Implications for Crustal Growth. Acta Geol. Sin. Engl. Ed. 2017, 91, 545–564. [Google Scholar] [CrossRef]
- Teixell, A.; Arboleya, M.-L.; Julivert, M.; Charroud, M. Tectonic Shortening and Topography in the Central High Atlas (Morocco): Tectonic Shortening in Morocco. Tectonics 2003, 22, 1051. [Google Scholar] [CrossRef] [Green Version]
- Domènech, M.; Teixell, A.; Babault, J.; Arboleya, M.-L. The Inverted Triassic Rift of the Marrakech High Atlas: A Reappraisal of Basin Geometries and Faulting Histories. Tectonophysics 2015, 663, 177–191. [Google Scholar] [CrossRef] [Green Version]
- Piqué, A.; Tricart, P.; Guiraud, R.; Laville, E.; Bouaziz, S.; Amrhar, M.; Ouali, R.A. The Mesozoic-Cenozoic Atlas Belt (North Africa): An Overview. Geodin. Acta 2002, 15, 185–208. [Google Scholar] [CrossRef]
- Laville, E.; Pique, A.; Amrhar, M.; Charroud, M. A Restatement of the Mesozoic Atlasic Rifting (Morocco). J. Afr. Earth Sci. 2004, 38, 145–153. [Google Scholar] [CrossRef]
- Gouiza, M.; Bertotti, G.; Hafid, M.; Cloetingh, S. Kinematic and Thermal Evolution of the Moroccan Rifted Continental Margin: Doukkala-High Atlas Transect: Doukkala-HIGH Atlas Passive Margin. Tectonics 2010, 29, TC5008. [Google Scholar] [CrossRef]
- Michard, A.; Ibouh, H.; Charriere, A. Syncline-topped anticlinal ridges from the high Atlas: A moroccan conundrum, and inspiring structures from the syrian arc, Israel. Terra Nova 2011, 23, 314–323. [Google Scholar] [CrossRef]
- Liu, Y. Mineral Spectroscopy of Apatite. Ph.D. Thesis, Sun Yat-Sen University, Guangzhou, China, 2003. [Google Scholar]
- Xu, B.; Kou, G.; Etschmann, B.; Liu, D.; Brugger, J. Spectroscopic, Raman, EMPA, Micro-XRF and Micro-XANES Analyses of Sulphur Concentration and Oxidation State of Natural Apatite Crystals. Crystals 2020, 10, 1032. [Google Scholar] [CrossRef]
- Zolotarev, V.M. Optical Constants of an Apatite Single Crystal in the IR Range of 6–28 Μm. Opt. Spectrosc. 2018, 124, 262–272. [Google Scholar] [CrossRef]
- Li, W. Gemological and chromatographic characterization of blue-green apatite. Master’s Thesis, China University of Geosciences, Beijing, China, 2021. [Google Scholar]
- Chindudsadeegul, P.; Jamkratoke, M. Effect of Heat Treatment on the Luminescence Properties of Natural Apatite. Spectrochim. Acta Part A Mol. Biomol. Spectrosc. 2018, 204, 276–280. [Google Scholar] [CrossRef]
- Chen, C.-Y.; Huang, W.-Z.; Shao, T.; Li, Z.-B.; Shen, X.-T. Characteristics of Visible Spectrum of Apatite with Alexandrite Effect. Spectrosc. Spectr. Anal. 2021, 41, 1483–1486. [Google Scholar]
- Bačík, P.; Fridrichová, J.; Štubňa, J.; Bancík, T.; Illášová, Ľ.; Pálková, H.; Škoda, R.; Mikuš, T.; Milovská, S.; Vaculovič, T.; et al. The REE-Induced Absorption and Luminescence in Yellow Gem-Quality Durango-Type Hydroxylapatite from Muránska Dlhá Lúka, Slovakia. Minerals 2020, 10, 1001. [Google Scholar] [CrossRef]
- Sun, S.-S.; McDonough, W.F. Chemical and Isotopic Systematics of Oceanic Basalts: Implications for Mantle Composition and Processes. Geol. Soc. Lond. Spec. Publ. 1989, 42, 313–345. [Google Scholar] [CrossRef]
- Yang, Y.-H.; Wu, F.-Y.; Yang, J.-H.; Chew, D.M.; Xie, L.-W.; Chu, Z.-Y.; Zhang, Y.-B.; Huang, C. Sr and Nd Isotopic Compositions of Apatite Reference Materials Used in U–Th–Pb Geochronology. Chem. Geol. 2014, 385, 35–55. [Google Scholar] [CrossRef]
- Liu, J.-W. Characterization of Granitic Apatite Speciation in Jiu Dong and Xiao Qin Ling and its Geological Significance. Master’s Thesis, China University of Geosciences, Beijing, China, 2019. [Google Scholar]
- Hughes, J.M.; Heffernan, K.M.; Goldoff, B.; Nekvasil, H. CL-Rich Fluorapatite, Devoid of OH, from the Three Peaks Area, Utah: The First Reported Structure of Natural CL-Rich Fluorapatite. Can. Mineral. 2014, 52, 643–652. [Google Scholar] [CrossRef]
- Brehler, B.; Fuge, R. Chlorine. In Handbook of Geochemistry; Springer: Berlin, Germany, 1974; Volume 2, pp. 17A–17O. [Google Scholar]
- Xing, K.; Shu, Q.-H. Application of apatite in the study of mineralogy. Miner. Depos. 2021, 40, 189–205. [Google Scholar] [CrossRef]
- Xu, B.; Griffin, W.L.; Xiong, Q.; Hou, Z.-Q.; O’Reilly, S.Y.; Guo, Z.; Pearson, N.J.; Gréau, Y.; Yang, Z.-M.; Zheng, Y.-C. Ultrapotassic Rocks and Xenoliths from South Tibet: Contrasting Styles of Interaction between Lithospheric Mantle and Asthenosphere during Continental Collision. Geology 2017, 45, 51–54. [Google Scholar] [CrossRef]
- Van Hoose, A.E.; Streck, M.J.; Pallister, J.S. Apatite sulfur systematics and crystal population in the 1991 Pinatubo magmas. Chem. Commun. 2010, 46, 6084. [Google Scholar]
- Apen, F.E.; Wall, C.J.; Cottle, J.M.; Schmitz, M.D.; Kylander-Clark, A.R.C.; Seward, G.G.E. Apatites for Destruction: Reference Apatites from Morocco and Brazil for U-Pb Petrochronology and Nd and Sr Isotope Geochemistry. Chem. Geol. 2022, 590, 120689. [Google Scholar] [CrossRef]
- Parat, F.; Holtz, F. Sulfur Partition Coefficient between Apatite and Rhyolite: The Role of Bulk S Content. Contrib. Mineral. Petrol. 2005, 150, 643–651. [Google Scholar] [CrossRef]
- Parat, F.; Holtz, F.; Klügel, A. S-Rich Apatite-Hosted Glass Inclusions in Xenoliths from La Palma: Constraints on the Volatile Partitioning in Evolved Alkaline Magmas. Contrib. Mineral. Petrol. 2011, 162, 463–478. [Google Scholar] [CrossRef]
- Yao, C.; Lu, J.; Guo, W. Characterization of apatite generations and composition of porphyry copper ore from Copper Factory, Jiangxi Province. J. Mineral. 2007, 1, 31–40. [Google Scholar] [CrossRef]
- Miles, A.J.; Graham, C.M.; Hawkesworth, C.J.; Gillespie, M.R.; Hinton, R.W.; Bromiley, G.D. Apatite: A New Redox Proxy for Silicic Magmas? Geochim. Cosmochim. Acta 2014, 132, 101–119. [Google Scholar] [CrossRef] [Green Version]
- Cao, M.; Li, G.; Qin, K.; Seitmuratova, E.Y.; Liu, Y. Major and Trace Element Characteristics of Apatites in Granitoids from Central Kazakhstan: Implications for Petrogenesis and Mineralization: Major and Trace Element of Apatites. Resour. Geol. 2012, 62, 63–83. [Google Scholar] [CrossRef]
- Chen, L.; Zhang, Y. In Situ Major-, Trace-Elements and Sr-Nd Isotopic Compositions of Apatite from the Luming Porphyry Mo Deposit, NE China: Constraints on the Petrogenetic-Metallogenic Features. Ore Geol. Rev. 2018, 94, 93–103. [Google Scholar] [CrossRef]
- Xu, B.; Hou, Z.-Q.; Zheng, Y.-C.; Wang, R.; He, M.-Y.; Zhou, L.-M.; Wang, Z.-X.; He, W.-Y.; Zhou, Y.; Yang, Y. In Situ Elemental and Isotopic Study of Diorite Intrusions: Implication for Jurassic Arc Magmatism and Porphyry Cu-Au Mineralisation in Southern Tibet. Ore Geol. Rev. 2017, 90, 1063–1077. [Google Scholar] [CrossRef]
| Publisher’s Note: MDPI stays neutral with regard to jurisdictional claims in published maps and institutional affiliations. |
© 2022 by the authors. Licensee MDPI, Basel, Switzerland. This article is an open access article distributed under the terms and conditions of the Creative Commons Attribution (CC BY) license (https://creativecommons.org/licenses/by/4.0/).


