
Study on Structural Evolution of Synthetic Graphite Derived from Lignite Prepared by High Temperature–High Pressure Method


Abstract
:1. Introduction
2. Experimental Section
2.1. Sample Preparation by Different Temperature and Pressure Experiments
2.2. Sample Characterization
3. Result Analysis
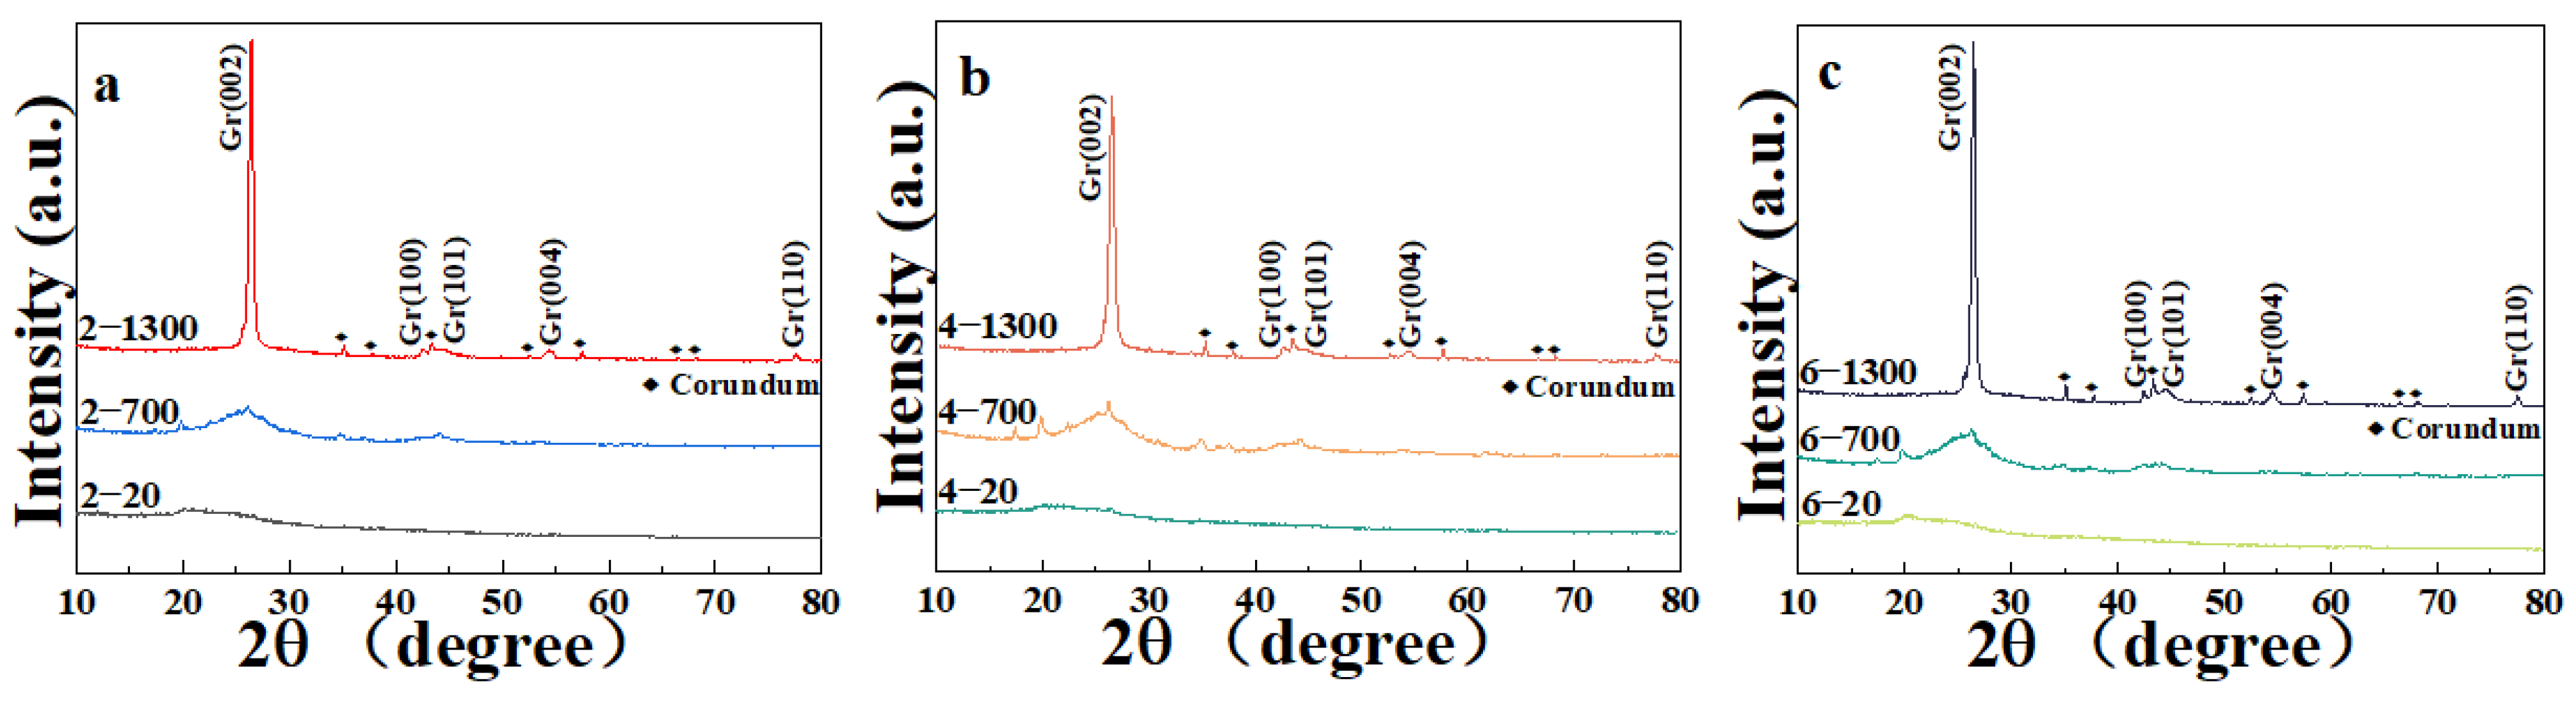
3.1. XRD Analysis
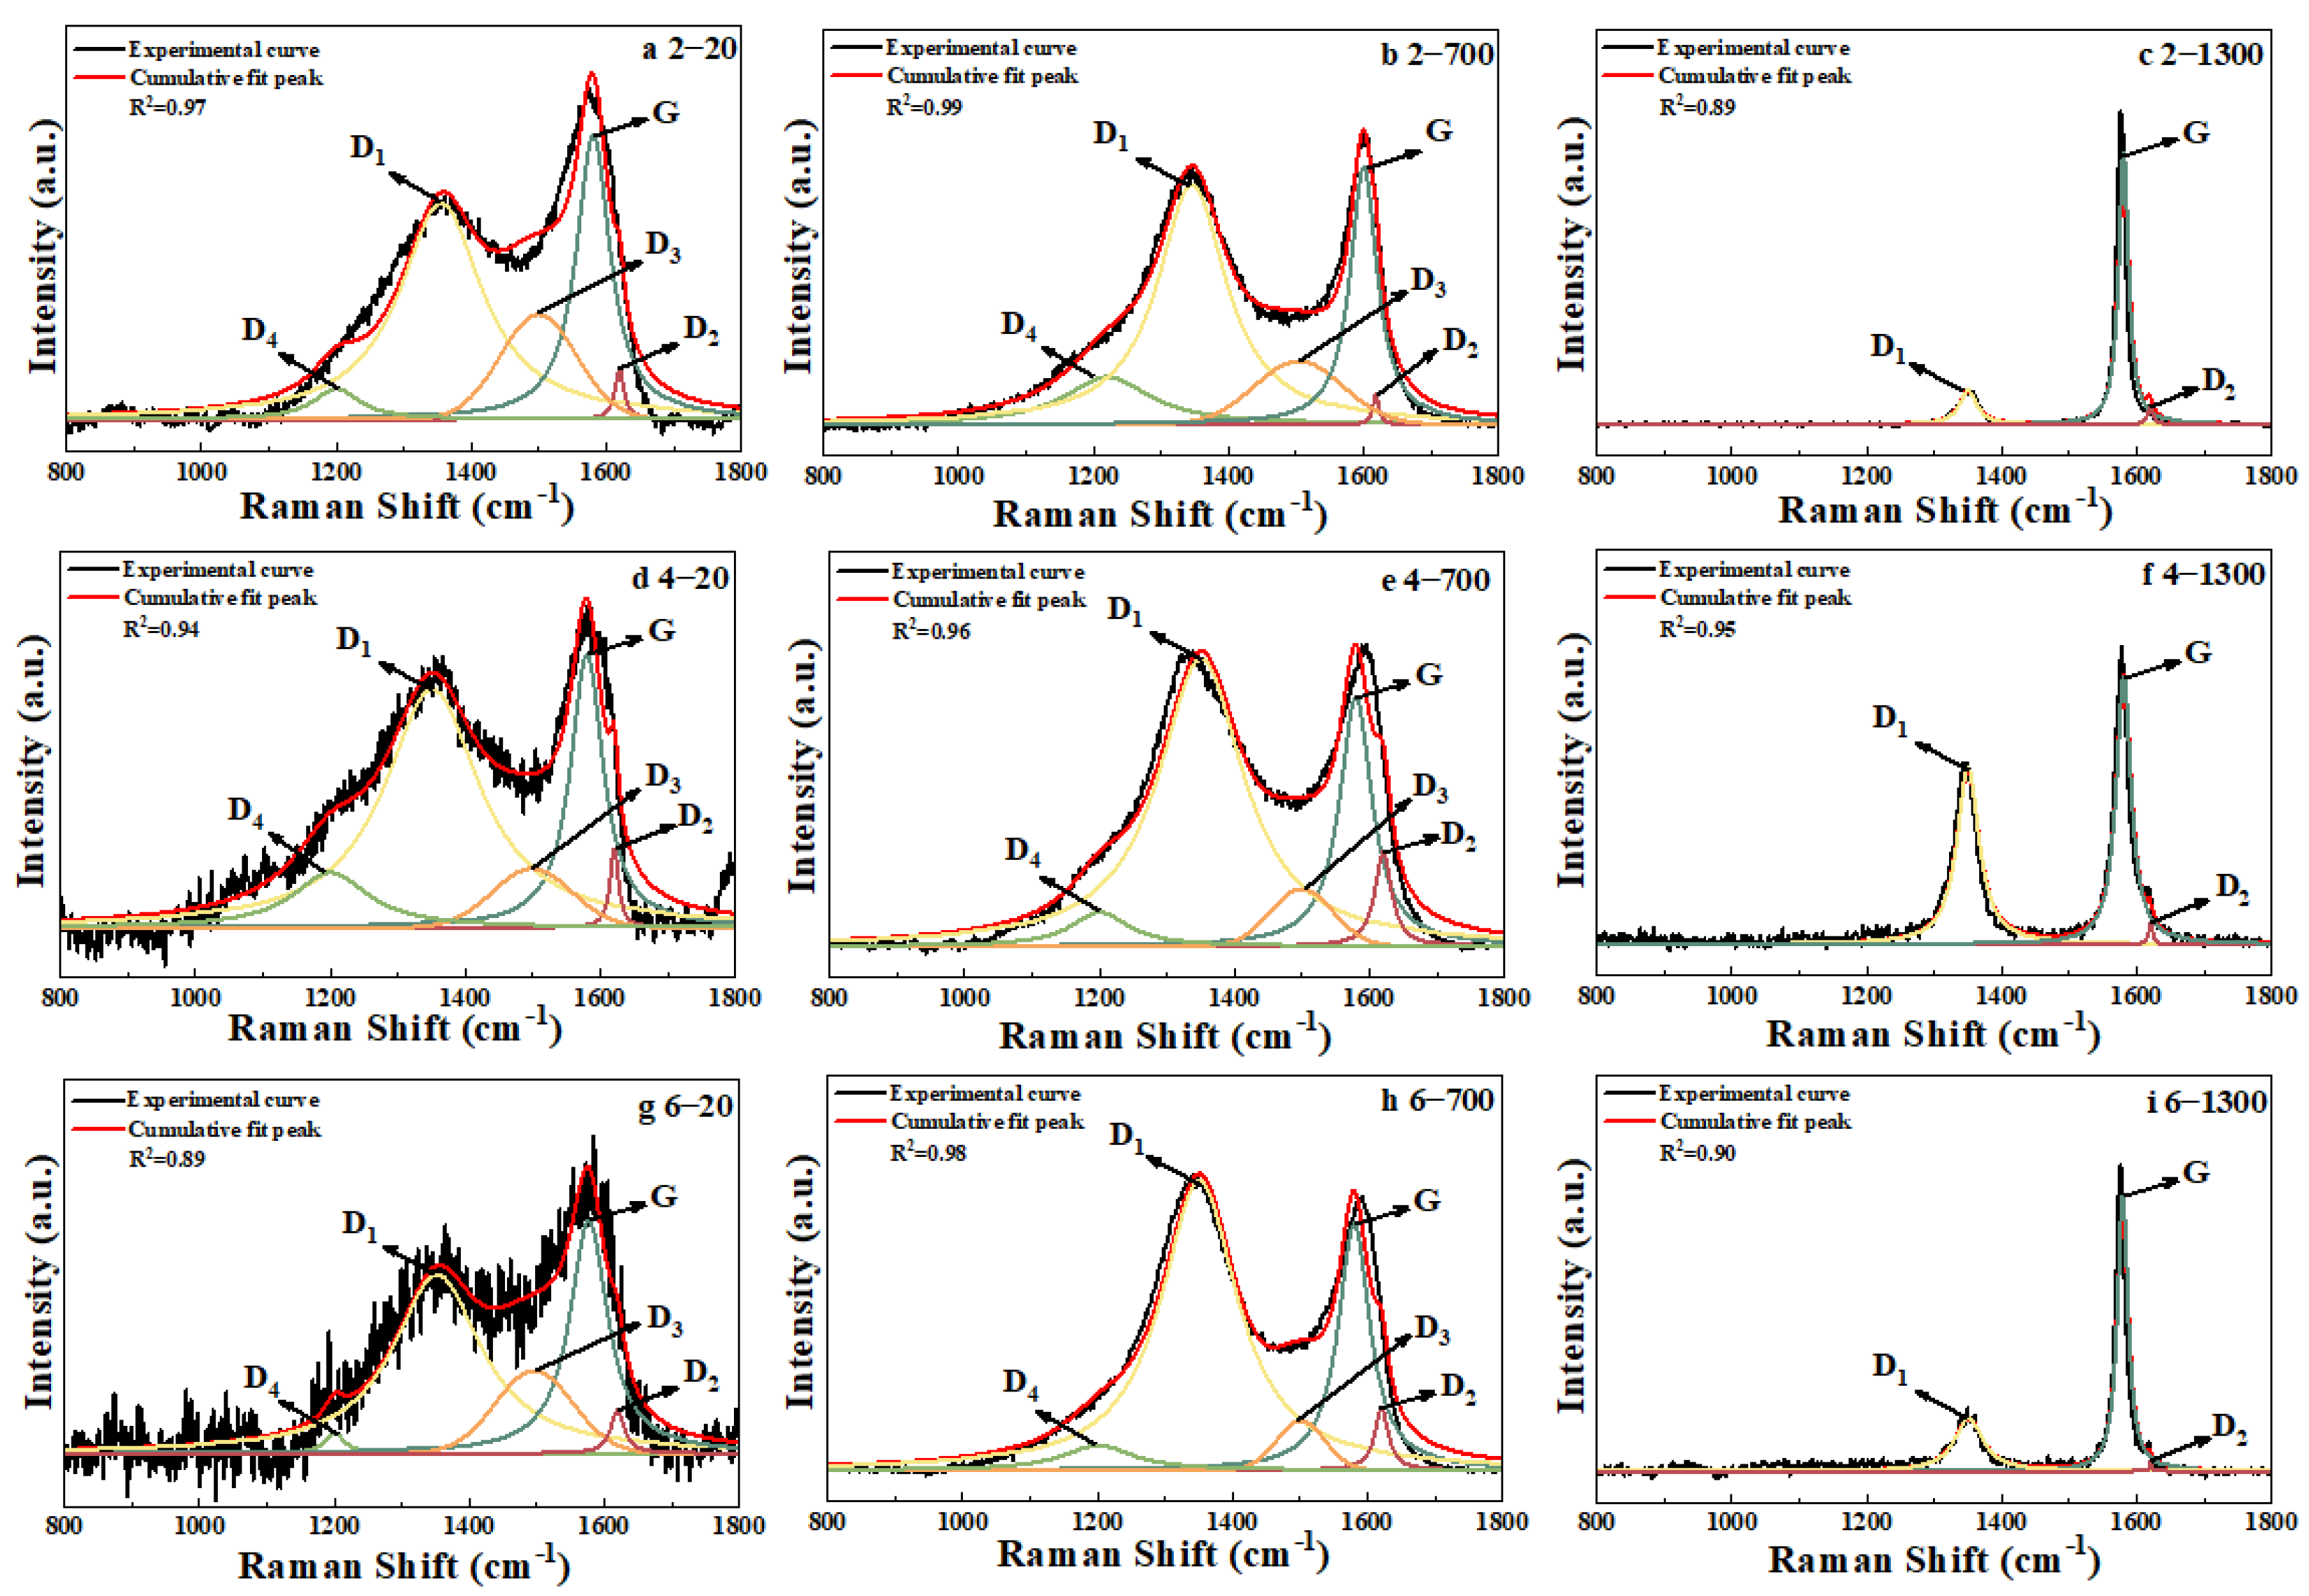
3.2. Raman Analysis
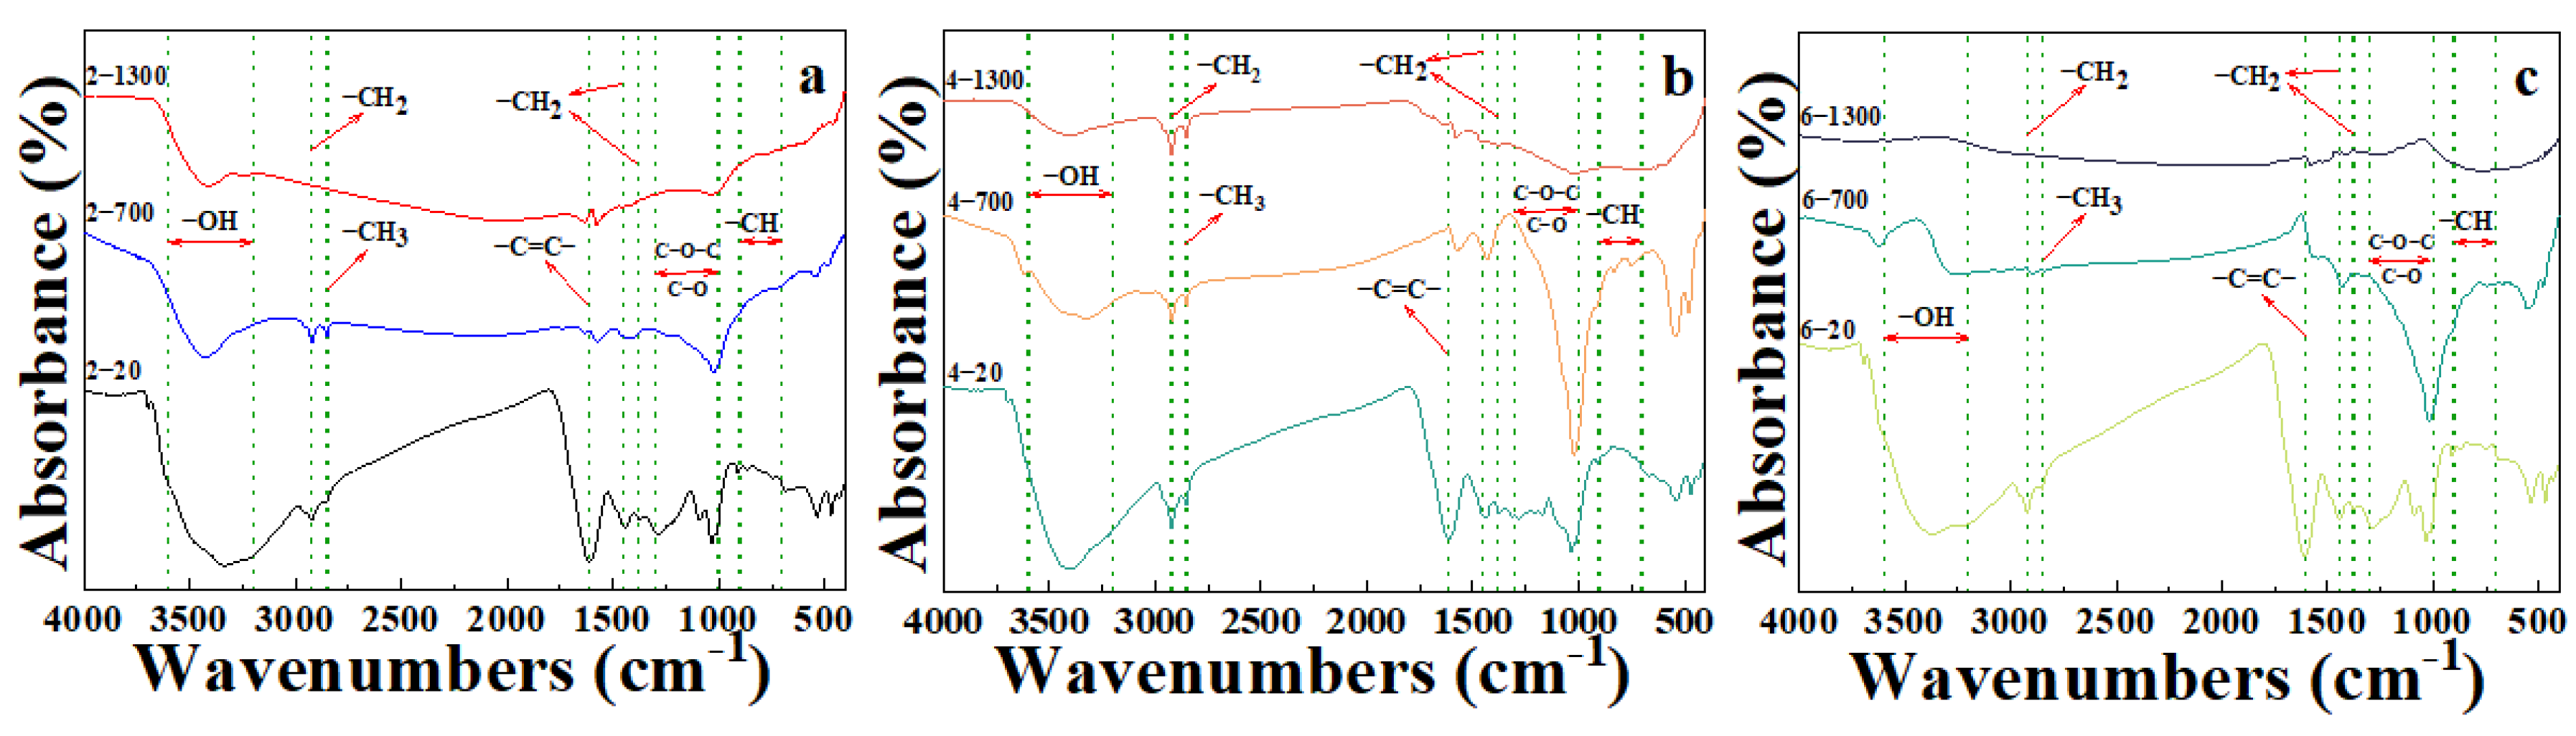
3.3. Infrared Spectroscopy Analysis
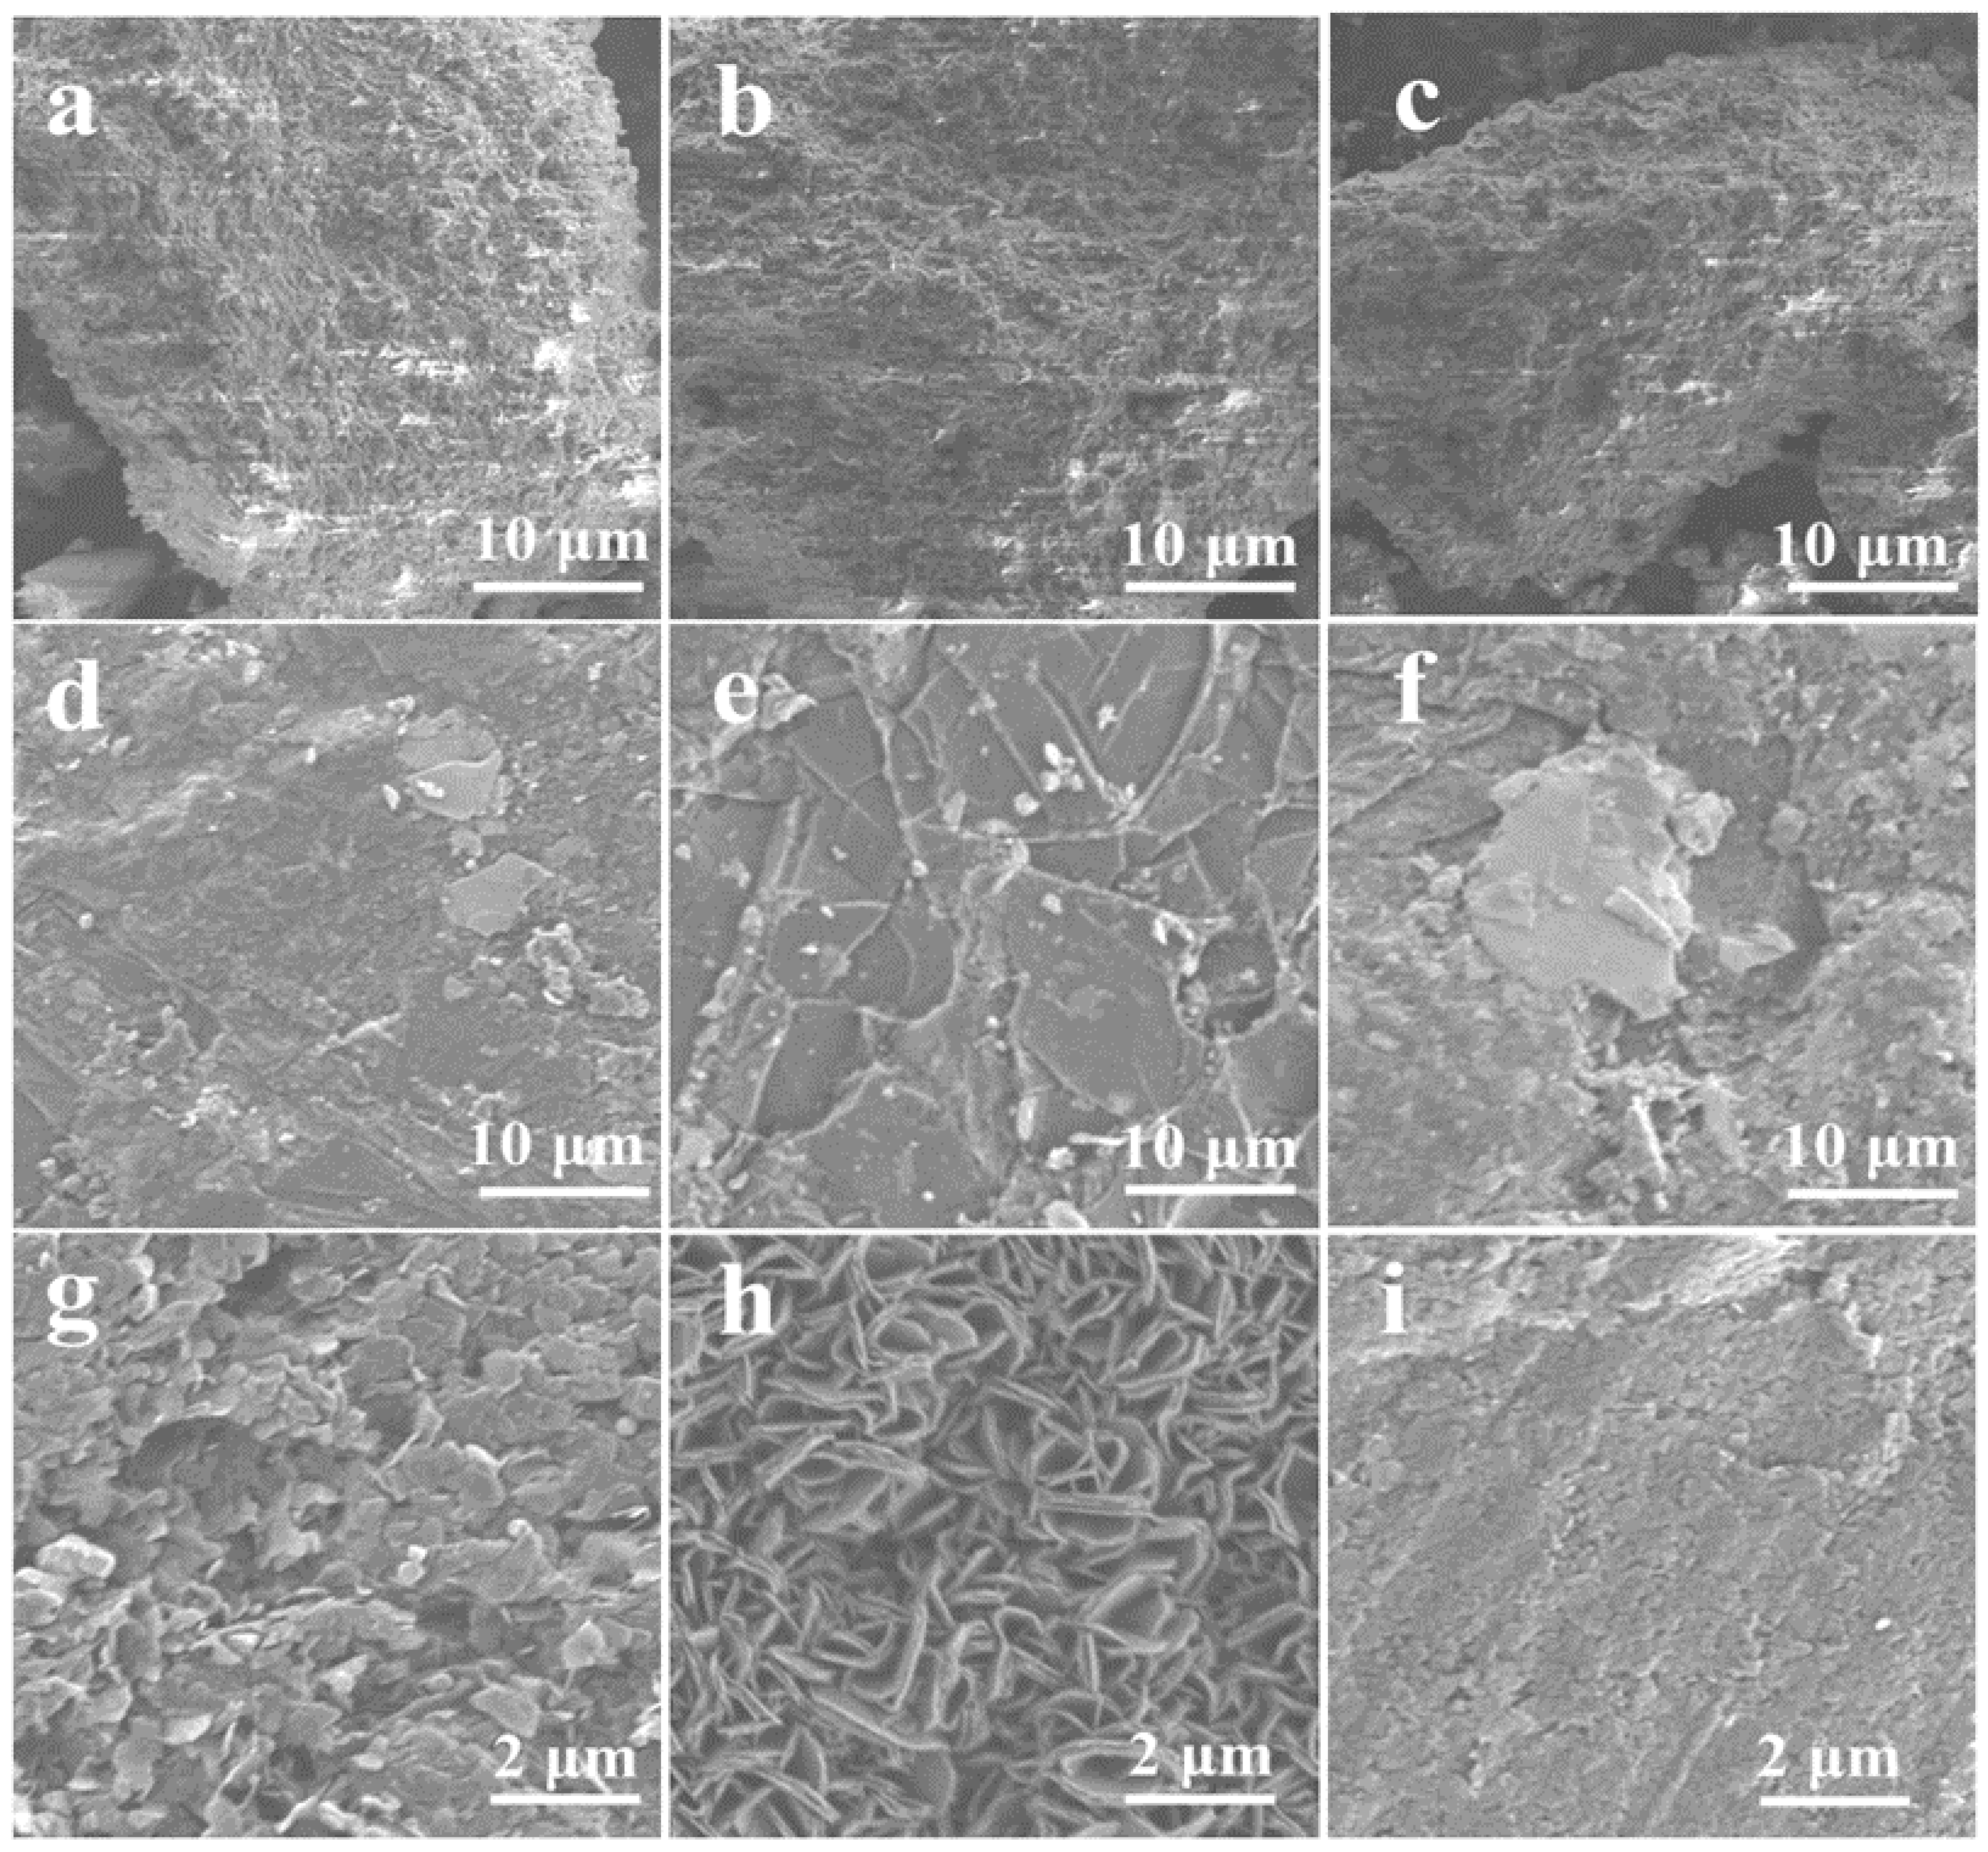
3.4. Morphological Evolution by SEM and HRTEM
4. Conclusions
Supplementary Materials
Author Contributions
Funding
Institutional Review Board Statement
Informed Consent Statement
Data Availability Statement
Acknowledgments
Conflicts of Interest
References
- Chung, D.D.L. Review graphite. J. Mater. Sci. 2002, 37, 1475–1489. [Google Scholar] [CrossRef]
- Titirici, M.M.; White, R.J.; Brun, N.; Budarin, V.L.; Su, D.S.; del Monte, F.; Clark, J.H.; MacLachlan, M.J. Sustainable carbon materials. Chem. Soc. Rev. 2015, 44, 250–290. [Google Scholar] [CrossRef]
- Kausar, A.; Rafique, I.; Muhammad, B. Aerospace application of polymer nanocomposite with carbon nanotube, graphite, graphene oxide, and nanoclay. Polym. Plast. Technol. Eng. 2017, 56, 1438–1456. [Google Scholar] [CrossRef]
- Badenhorst, C.; Santos, C.; Lazaro-Martinez, J.; Bialecka, B.; Cruceru, M.; Guedes, A.; Guimaraes, R.; Moreira, K.; Predeanu, G.; Suarez-Ruiz, I.; et al. Assessment of graphitized coal ash char concentrates as a potential synthetic graphite source. Minerals 2020, 10, 986. [Google Scholar] [CrossRef]
- Chelgani, S.C.; Rudolph, M.; Kratzsch, R.; Sandmann, D.; Gutzmer, J. A Review of Graphite Beneficiation Techniques. Miner. Process Extr. Metall. Rev. 2016, 37, 58–68. [Google Scholar] [CrossRef]
- Burgess-Clifford, C.E.; Narayanan, D.L.; Van Essendelft, D.T.; Jain, P.; Sakti, A.; Lueking, A.D. The effect of calcination on reactive milling of anthracite as potential precursor for graphite production. Fuel Process. Technol. 2009, 90, 1515–1523. [Google Scholar] [CrossRef]
- Schobert, H.H.; Song, C. Chemicals and materials from coal in the 21st century. Fuel 2002, 81, 15–32. [Google Scholar] [CrossRef]
- Andresen, J.M.; Burgess, C.E.; Pappano, P.J.; Schobert, H.H. New directions for non-fuel uses of anthracites. Fuel Process. Technol. 2004, 85, 1373–1392. [Google Scholar] [CrossRef]
- Zhou, Q.; Zhao, Z.; Zhang, Y.; Meng, B.; Zhou, A.; Qiu, J. Graphene sheets from graphitized anthracite coal: Preparation, decoration, and application. Energy Fuels 2012, 26, 5186–5192. [Google Scholar] [CrossRef]
- Gonzalez, D.; Montes-Moran, M.A.; Garcia, A.B. Graphite materials prepared from an anthracite: A structural characterization. Energy Fuels 2003, 17, 1324–1329. [Google Scholar] [CrossRef]
- Atria, J.V.; Rusinko, F.; Schobert, H.H. Structural ordering of Pennsylvania anthracites on heat treatment to 2000–2900 degrees C. Energy Fuels 2002, 16, 1343–1347. [Google Scholar] [CrossRef]
- Rodrigues, S.; Suarez-Ruiz, I.; Marques, M.; Flores, D.; Camean, I.; Garcia, A.B. Development of graphite-like particles from the high temperature treatment of carbonized anthracites. Int. J. Coal Geol. 2011, 85, 219–226. [Google Scholar] [CrossRef]
- Nyathi, M.S.; Clifford, C.B.; Schobert, H.H. Characterization of graphitic materials prepared from different rank Pennsylvania anthracites. Fuel 2013, 114, 244–250. [Google Scholar] [CrossRef]
- Zhong, M.; Yan, J.W.; Wu, H.X.; Shen, W.Z.; Zhang, J.L.; Yu, C.L.; Li, L.; Hao, Q.E.; Gao, F.; Tian, Y.F.; et al. Multilayer graphene spheres generated from anthracite and semi-coke as anode materials for lithium-ion batteries. Fuel Process. Technol. 2020, 198, 106241. [Google Scholar] [CrossRef]
- Islam, F.; Tahmasebi, A.; Wang, R.; Yu, J.L. Structure of coal-derived metal-supported few-layer graphene composite materials synthesized using a microwave-assisted catalytic graphitization process. Nanomaterials 2021, 11, 1672. [Google Scholar] [CrossRef] [PubMed]
- Shi, M.; Tai, Z.G.; Li, N.; Zou, K.Y.; Chen, Y.Z.; Sun, J.J.; Liu, Y.N. Spherical graphite produced from waste semi-coke with enhanced properties as an anode material for Li-ion batteries. Sustain. Energy Fuels 2019, 3, 3116–3127. [Google Scholar] [CrossRef]
- Li, Z.K.; Zong, Z.M.; Yan, H.L.; Wang, Y.G.; Wei, X.Y.; Shi, D.L.; Zhao, Y.P.; Zhao, C.L.; Yang, Z.S.; Fan, X. Alkanolysis simulation of lignite-related model compounds using density functional theory. Fuel 2014, 120, 158–162. [Google Scholar] [CrossRef]
- Oberlin, A. Carbonization and graphitization. Carbon 1984, 22, 521–541. [Google Scholar] [CrossRef]
- Franklin, R.E. Crystallite Growth in Graphitizing and Non-Graphitizing Carbons. Proc. R. Soc. A-Math. Phys. Eng. Sci. 1951, 209, 196–218. [Google Scholar]
- Thielemann, T.; Schmidt, S.; Gerling, J.P. Lignite and hard coal: Energy suppliers for world needs until the year 2100—An outlook. Int. J. Coal Geol. 2007, 72, 1–14. [Google Scholar] [CrossRef]
- Xue, F.F.; Li, D.; Guo, Y.T.; Liu, X.; Zhang, X.P.; Zhou, Q.C.; Ma, B.Q. Technical progress and the prospect of low-rank coal pyrolysis in China. Energy Technol. 2017, 5, 1897–1907. [Google Scholar] [CrossRef]
- Li, Z.K.; Wei, X.Y.; Yan, H.L.; Wang, Y.G.; Kong, J.; Zong, Z.M. Advances in lignite extraction and conversion under mild conditions. Energy Fuels 2015, 29, 6869–6886. [Google Scholar] [CrossRef]
- Li, C.Z. Some recent advances in the understanding of the pyrolysis and gasification behaviour of Victorian brown coal. Fuel 2007, 86, 1664–1683. [Google Scholar] [CrossRef]
- Bustin, R.M.; Ross, J.V.; Rouzaud, J.N. Mechanisms of graphite formation from kerogen: Experimental evidence. Int. J. Coal Geol. 1995, 28, 1–36. [Google Scholar] [CrossRef]
- Nover, G.; Stoll, J.B.; von der Gonna, J. Promotion of graphite formation by tectonic stress—A laboratory experiment. Geophys. J. Int. 2005, 160, 1059–1067. [Google Scholar] [CrossRef] [Green Version]
- Wang, J.; Han, Y.Z.; Chen, B.Z.; Guo, G.J.; Hou, Q.L.; Zhang, Z.G. Mechanisms of methane generation from anthracite at low temperatures: Insights from quantum chemistry calculations. Int. J. Hydrogen Energy 2017, 42, 18922–18929. [Google Scholar] [CrossRef]
- Wilks, K.R.; Mastalerz, M.; Ross, J.V.; Bustin, R.M. The effect of experimental deformation on the graphitization of Pennsylvania anthracite. Int. J. Coal Geol. 1993, 24, 347–369. [Google Scholar] [CrossRef]
- Zhao, J.G.; Yang, L.X.; Li, F.Y.; Yu, R.C.; Jin, C.Q. Structural evolution in the graphitization process of activated carbon by high-pressure sintering. Carbon 2009, 47, 744–751. [Google Scholar] [CrossRef]
- Shi, Q.L.; Qin, B.T.; Bi, Q.; Qu, B. An experimental study on the effect of igneous intrusions on chemical structure and combustion characteristics of coal in Daxing Mine, China. Fuel 2018, 226, 307–315. [Google Scholar] [CrossRef]
- Jiang, J.Y.; Yang, W.H.; Cheng, Y.P.; Liu, Z.D.; Zhang, Q.; Zhao, K. Molecular structure characterization of middle-high rank coal via XRD, Raman and FTIR spectroscopy: Implications for coalification. Fuel 2019, 239, 559–572. [Google Scholar] [CrossRef]
- Warren, B.E. X-Ray Diffraction in Random Layer Lattices. Phys. Rev. 1941, 59, 693–698. [Google Scholar] [CrossRef]
- Franklin, R.E. The structure of graphitic carbons. Acta Cryst. 1951, 4, 253–261. [Google Scholar] [CrossRef]
- Xin, L.; An, M.Y.; Feng, M.Z.; Li, K.X.; Cheng, W.M.; Liu, W.T.; Hu, X.M.; Wang, Z.G.; Han, L.M. Study on pyrolysis characteristics of lump coal in the context of underground coal gasification. Energy 2021, 237, 121626. [Google Scholar] [CrossRef]
- Zhang, S.; Liu, Q.F.; Zhang, H.; Ma, R.J.; Li, K.; Wu, Y.K.; Teppen, B.J. Structural order evaluation and structural evolution of coal derived natural graphite during graphitization. Carbon 2020, 157, 714–723. [Google Scholar] [CrossRef]
- Meng, J.Q.; Li, S.C.; Niu, J.X. Crystallite structure characteristics and its influence on methane adsorption for different rank coals. ACS Omega 2019, 4, 20762–20772. [Google Scholar] [CrossRef] [Green Version]
- Manoj, B.; Kunjomana, A.G. Study of stacking structure of amorphous carbon by X-Ray diffraction technique. Int. J. Electrochem. Sci. 2012, 7, 3127–3134. [Google Scholar]
- Qiu, S.X.; Zhang, S.F.; Wu, Y.; Qiu, G.B.; Sun, C.G.; Zhang, Q.Y.; Dang, J.; Wen, L.Y.; Hu, M.L.; Xu, J.; et al. Structural transformation of fluid phase extracted from coal matrix during thermoplastic stage of coal pyrolysis. Fuel 2018, 232, 374–383. [Google Scholar] [CrossRef]
- Xu, L.; Liu, H.Y.; Jin, Y.; Fan, B.G.; Qiao, X.L.; Jing, B. Structural order and dielectric properties of coal chars. Fuel 2014, 137, 164–171. [Google Scholar] [CrossRef]
- Bustin, R.M.; Rouzaud, J.N.; Ross, J.V. Natural graphitization of anthracite: Experimental considerations. Carbon 1995, 33, 679–691. [Google Scholar] [CrossRef]
- Kwiecinska, B.; Petersen, H.I. Graphite, semi-graphite, natural coke, and natural char classification—ICCP system. Int. J. Coal Geol. 2004, 57, 99–116. [Google Scholar] [CrossRef]
- Sadezky, A.; Muckenhuber, H.; Grothe, H.; Niessner, R.; Poschl, U. Raman micro spectroscopy of soot and related carbonaceous materials: Spectral analysis and structural information. Carbon 2005, 43, 1731–1742. [Google Scholar] [CrossRef]
- Yuan, L.; Liu, Q.F.; Mathews, J.P.; Zhang, H.; Wu, Y.K. Quantifying the structural transitions of Chinese coal to coal-derived natural graphite by XRD, Raman spectroscopy, and HRTEM image analyses. Energy Fuels 2021, 35, 2335–2346. [Google Scholar] [CrossRef]
- Beyssac, O.; Goffe, B.; Petitet, J.P.; Froigneux, E.; Moreau, M.; Rouzaud, J.N. On the characterization of disordered and heterogeneous carbonaceous materials by Raman spectroscopy. Spectroc. Acta Part A—Molec. Biomolec. Spectr. 2003, 59, 2267–2276. [Google Scholar] [CrossRef]
- Zhu, H.L.; Yu, G.S.; Guo, Q.H.; Wang, X.J. In situ Raman spectroscopy study on catalytic pyrolysis of a bituminous coal. Energy Fuels 2017, 31, 5817–5827. [Google Scholar] [CrossRef]
- Rodrigues, S.; Marques, M.; Suarez-Ruiz, I.; Camean, I.; Flores, D.; Kwiecinska, B. Microstructural investigations of natural and synthetic graphites and semi-graphites. Int. J. Coal Geol. 2013, 111, 67–79. [Google Scholar] [CrossRef]
- Bokobza, L.; Bruneel, J.L.; Couzi, M. Raman spectroscopy as a tool for the analysis of carbon-based materials (highly oriented pyrolitic graphite, multilayer graphene and multiwall carbon nanotubes) and of some of their elastomeric composites. Vib. Spectrosc. 2014, 74, 57–63. [Google Scholar] [CrossRef]
- Jin, S.; Chung, B.; Park, H.J.; Cunning, B.V.; Lee, J.H.; Yoon, A.; Huang, M.; Seo, H.; Lee, D.; Lee, Z.; et al. Ultrahigh strength and modulus graphene-based hybrid carbons with AB-stacked and turbostratic structures. Adv. Funct. Mater. 2020, 30, 2005381. [Google Scholar] [CrossRef]
- Ferrari, A.C.; Basko, D.M. Raman spectroscopy as a versatile tool for studying the properties of graphene. Nat. Nanotechnol. 2013, 8, 235–246. [Google Scholar] [CrossRef] [PubMed] [Green Version]
- Rantitsch, G.; Lammerer, W.; Fisslthaler, E.; Mitsche, S.; Kaltenbock, H. On the discrimination of semi-graphite and graphite by Raman spectroscopy. Int. J. Coal Geol. 2016, 159, 48–56. [Google Scholar] [CrossRef]
- Beyssac, O.; Rouzaud, J.N.; Goffe, B.; Brunet, F.; Chopin, C. Graphitization in a high-pressure, low-temperature metamorphic gradient: A Raman microspectroscopy and HRTEM study. Contrib. Mineral. Petrol. 2002, 143, 19–31. [Google Scholar] [CrossRef]
- Xu, L.; Cheng, L. Graphite oxide under high pressure: A raman spectroscopic study. J. Nanomater. 2013, 2013, 47. [Google Scholar] [CrossRef]
- Bai, B.Y.; Qiang, L.Y.; Zhang, S.S.; Peng, Z.W.; Mu, H.; Ma, X.X. The effect of hydrothermal pretreatment on the structure and fast pyrolysis behaviors of ShengLi lignite. Chin. J. Chem. Eng. 2021, 35, 265–274. [Google Scholar] [CrossRef]
- Wang, Y.G.; Wei, X.Y.; Wang, S.K.; Li, Z.K.; Li, P.; Liu, F.J.; Zong, Z.M. Structural evaluation of Xiaolongtan lignite by direct characterization and pyrolytic analysis. Fuel Process. Technol. 2016, 144, 248–254. [Google Scholar] [CrossRef]
- Feng, X.B.; Cao, J.P.; Zhao, X.Y.; Song, C.; Liu, T.L.; Wang, J.X.; Fan, X.; Wei, X.Y. Organic oxygen transformation during pyrolysis of Baiyinhua lignite. J. Anal. Appl. Pyrolysis 2016, 117, 106–115. [Google Scholar] [CrossRef]
- Tian, B.; Qiao, Y.Y.; Bai, L.; Feng, W.; Jiang, Y.; Tian, Y.Y. Pyrolysis behavior and kinetics of the trapped small molecular phase in a lignite. Energy Conv. Manag. 2017, 140, 109–120. [Google Scholar] [CrossRef]
- Meng, F.R.; Yu, J.L.; Tahmasebi, A.; Han, Y.N.; Zhao, H.; Lucas, J.; Wall, T. Characteristics of chars from low-temperaturepyrolysis of lignite. Energy Fuels 2014, 28, 275–284. [Google Scholar] [CrossRef]


| Sample | Space Group | a (Å) | c (Å) | V (Å3) | ρ (g/cm3) | Z |
|---|---|---|---|---|---|---|
| 2-1300 | P63/mmc (No. 194) | 2.4673 | 6.7662 | 35.67 | 2.2364 | 4 |
| 4-1300 | P63/mmc (No. 194) | 2.4659 | 6.7491 | 35.54 | 2.2445 | 4 |
| 6-1300 | P63/mmc (No. 194) | 2.4641 | 6.7363 | 35.42 | 2.2522 | 4 |
| Sample | 2θ002 (deg) | 2θ100 (deg) | β002 (deg) | β100 (deg) | d002 (nm) | La (nm) | Lc (nm) | Nave (-) | G (%) | fa (-) | La/Lc (-) |
|---|---|---|---|---|---|---|---|---|---|---|---|
| 2-20 | 25.30 | n.d. | 4.16 | n.d. | 0.3517 | n.d. | 1.9571 | 5.56 | n.d. | 0.5260 | n.d. |
| 2-700 | 26.19 | 44.17 | 4.94 | 2.86 | 0.3400 | 6.1284 | 1.6511 | 4.85 | 46.51 | 0.8418 | 3.7117 |
| 2-1300 | 26.44 | 42.49 | 0.47 | 0.35 | 0.3368 | 49.7871 | 17.3624 | 51.55 | 83.72 | 0.8619 | 2.8675 |
| 4-20 | 25.29 | n.d. | 4.47 | n.d. | 0.3519 | n.d. | 1.8214 | 5.17 | n.d. | 0.5789 | n.d. |
| 4-700 | 25.79 | 43.70 | 4.71 | 3.99 | 0.3452 | 4.3855 | 1.7303 | 5.01 | n.d. | 0.8574 | 2.5345 |
| 4-1300 | 26.34 | 42.43 | 0.57 | 0.33 | 0.3381 | 52.7938 | 14.3135 | 42.33 | 68.61 | 0.9358 | 3.6884 |
| 6-20 | 25.29 | n.d. | 4.47 | n.d. | 0.3519 | n.d. | 1.8214 | 5.18 | n.d. | 0.5789 | n.d. |
| 6-700 | 26.33 | 43.37 | 4.51 | 4.53 | 0.3382 | 3.8583 | 1.8090 | 5.35 | 67.44 | 0.7507 | 2.1328 |
| 6-1300 | 26.50 | 42.46 | 0.44 | 0.32 | 0.3361 | 54.4491 | 18.5485 | 55.19 | 91.87 | 0.8896 | 2.9355 |
| Sample | C | N | O | Si |
|---|---|---|---|---|
| 2-700 | 74.19 | 11.89 | 13.66 | 0.26 |
| 2-1300 | 84.47 | 6.27 | 4.95 | 1.31 |
| 4-700 | 83.41 | 9.44 | 6.70 | 0.46 |
| 4-1300 | 87.01 | 7.64 | 4.46 | 0.89 |
| 6-700 | 79.72 | 8.78 | 9.69 | 1.80 |
| 6-1300 | 87.19 | 7.27 | 5.04 | 0.49 |
Publisher’s Note: MDPI stays neutral with regard to jurisdictional claims in published maps and institutional affiliations. |
© 2022 by the authors. Licensee MDPI, Basel, Switzerland. This article is an open access article distributed under the terms and conditions of the Creative Commons Attribution (CC BY) license (https://creativecommons.org/licenses/by/4.0/).
Share and Cite
Wang, Y.-M.; Zhang, C.-H. Study on Structural Evolution of Synthetic Graphite Derived from Lignite Prepared by High Temperature–High Pressure Method. Crystals 2022, 12, 464. https://doi.org/10.3390/cryst12040464
Wang Y-M, Zhang C-H. Study on Structural Evolution of Synthetic Graphite Derived from Lignite Prepared by High Temperature–High Pressure Method. Crystals. 2022; 12(4):464. https://doi.org/10.3390/cryst12040464
Chicago/Turabian StyleWang, Yi-Ming, and Chun-Hua Zhang. 2022. "Study on Structural Evolution of Synthetic Graphite Derived from Lignite Prepared by High Temperature–High Pressure Method" Crystals 12, no. 4: 464. https://doi.org/10.3390/cryst12040464