Article

Gas-Sensing Properties of a Carbyne-Enriched Nanocoating Deposited onto Surface Acoustic Wave Composite Substrates with Various Electrode Topologies

1
Department of Microelectronics, Technical University of Sofia, 1000 Sofia, Bulgaria
2
Swissimpianti Sagl, 6828 Balerna, Switzerland
3
Western-Caucasus Research Center, Russian Federation, 352808 Tuapse, Russia
*
Author to whom correspondence should be addressed.
Crystals 2022, 12(4), 501; https://doi.org/10.3390/cryst12040501
Submission received: 3 March 2022 / Revised: 25 March 2022 / Accepted: 28 March 2022 / Published: 4 April 2022

Abstract

:
The application of carbyne-enriched nanomaterials opens unique possibilities for enhancing the functional properties of several nanomaterials and unlocking their full potential for practical applications in high-end devices. We studied the ethanol-vapor-sensing performance of a carbyne-enriched nanocoating deposited onto surface acoustic wave (SAW) composite substrates with various electrode topologies. The carbyne-enriched nanocoating was grown using the ion-assisted pulse-plasma deposition technique. Such carbon nanostructured metamaterials were named 2D-ordered linear-chain carbon, where they represented a two-dimensionally packed hexagonal array of carbon chains held by the van der Waals forces, with the interchain spacing approximately being between 4.8 and 5.03 Å. The main characteristics of the sensing device, such as dynamic range, linearity, sensitivity, and response and recovery times, were measured as a function of the ethanol concentration. To the authors’ knowledge, this was the first time demonstration of the detection ability of carbyne-enriched material to ethanol vapors. The results may pave the path for optimization of these sensor architectures for the precise detection of volatile organic compounds, with applications in the fields of medicine, healthcare, and air composition monitoring.

1. Introduction

Following graphene, several new two-dimensional materials have emerged, and their use is expected to have a high impact in our daily life in the near future, including mainstream microelectronics devices [1]. However, it is not only graphene that leads the interest of carbon materials. Other allotropes of carbon exist, including linear molecules, such as polyene (alternating single and triple bonds, i.e., acetylenic carbon) and cumulene (consecutive double bonds). These allotropes are called carbyne. Carbyne contains alternating single and triple carbon bonds, as opposed to polyacetylene, which contains alternating single and double bonds. Carbynes are reported to have a huge Young’s modulus of 32.7 TPa, which is 40× that of diamond [2]. Carbynes are thus emerging as a new class of very strong, very tough, and very light material that could be the next revolution of carbon in materials science, fabrics, sensors, electronics, and many more fields. Such new materials are not only important for research, but they will have a huge economic impact as well. For example, the global market for 2D materials is expected to reach USD 400 million by 2025, and this figure is only for the materials and not for the devices making use of those materials [3]. Carbon-based nanomaterials are critical for sensing applications, as they have physical and electronic properties that facilitate the detection of substances in solutions, gaseous compounds, and pollutants through their conductive properties and resonance frequency transmission capacities. However, the use of carbyne films for sensing applications is almost a virgin field with a high potential for innovation and commercial exploitation. Therefore, the fabrication and study of novel carbyne films and modified carbyne films with radical sensing properties and the demonstration of their use as novel chemical sensors would give new insight into the field. To achieve this innovative and wide-spectrum target, different sensor architectures realizing different sensing mechanisms as a result of analyte absorption by the carbyne-enriched layers should be produced and their performance should be compared.
The growing awareness of environmental problems has accelerated research and development in the chemical sensing field and, thus, many high-performing gas and vapor detection techniques have been developed with the potential to be employed in point-of-need implementations [4]. Thanks to these research efforts, several transduction principles have been proposed, implemented, and evaluated in a wide range of applications. When there is a need for highly sensitive, accurate, and rapid detection techniques for chemical agents, an attractive solution for cost and size reduction is to consider the use of micromachined technologies, which offer the capability for on-chip electronics to lower costs and provide high production yields. Among these, cantilevers and capacitive/resistive microsensors have shown huge potential for implementation in our daily life, with some products available on the market already [5,6]. Capacitive sensors were combined with several sensing materials and demonstrated the quantitative and reversible sensing of many gases, such as H2; O2; NH3; NO2; NH3; volatile organic compounds (VOCs), such as ethanol, methanol, and formic acid; and relative humidity [7,8]. Recently, a novel gas sensor based upon vapor-induced capacitance modulation of chemically functionalized porous graphene oxide (pGO) was developed [9]. The dielectric pGO matrix was assembled in situ upon an electrode surface through a combined room temperature annealing/freeze-drying process. Extraordinary vapor sensing properties were demonstrated, specifically extremely high sensitivity, wide dynamic range, rapid response and recovery times, fidelity, and detection of a broad range of molecular targets. However, they suffered several drawbacks, such as a long recovery time, low linearity depending on the membrane shape, and their performance was affected by the ambient conditions (temperature, humidity) through the variation of the sensing layer permittivity [10]. In the case of a cantilever-type sensor, there are two key components: a gas sorptive layer, such as carbon-based nanoscale materials and coatings, and a beam transducer. The fundamental resonant frequency of the device depends on the mass loading of the cantilever beam [11]. The beam structures could be designed with a range of dimensions (length, width, and thickness) to explore the effect of the device shape on its resonant frequency and mass sensitivity [12]. The uptake of different gases is monitored as a shift in the device frequency, which is reversible if the gas-sorbing layer interactions are reversible. However, the mechanical motion of these sensors requires specific assembling and packaging processes as compared to static planar devices.
The above-mentioned drawbacks have not been observed for the sensing devices using surface acoustic waves (SAW). They were commercially exploited years ago in industrial applications for the needs of communications, automotive electronics, and environmental sensing [13,14]. Supplying an alternating current (AC) with a certain frequency to electrodes with a specific pattern excites a piezoelectric material, thus generating an acoustic wave that propagates along the surface of the material (surface acoustic wave). When an analyte interacts with this sensing layer physically or chemically, changes occur. Mass and viscosity changes at the sensitive layer can be detected by recording changes in the acoustic wave properties, such as velocity, attenuation, resonant frequency shift, or time delay. Such a structure has been widely investigated for sensing and fluidic applications in advanced lab-on-chip complex devices [15]. Acoustic wave sensors are able to monitor not only mass or density changes but also changes in Young’s modulus, viscosity, dielectric, and conductivity properties, wirelessly and in real time [16].
The aim of this study was the exploration and ethanol-sensing performance evaluation of SAW-based devices coated with new carbyne-enriched films grown using the ion-assisted pulse-plasma deposition technique on different electrode topologies. Ethanol is a colorless chemical compound, which is not toxic, but its presence could be an indication of problems with food and drink quality, human medical conditions, industrial manufacturing of raw materials, etc. Therefore, the precise quantitative measurement of ethanol vapors in the range of 40–400 ppm is of great importance for many practical applications. The main characteristics of the sensing device, such as dynamic range, linearity, sensitivity, and response and recovery time were measured as a function of the ethanol concentration. To the authors’ knowledge, this is the first demonstration of the detection ability of carbyne-enriched material to ethanol vapors. The results may pave the way for optimization of these sensor architectures for precise detection of volatile organic compounds with applications in the fields of medicine, healthcare, and air composition monitoring.

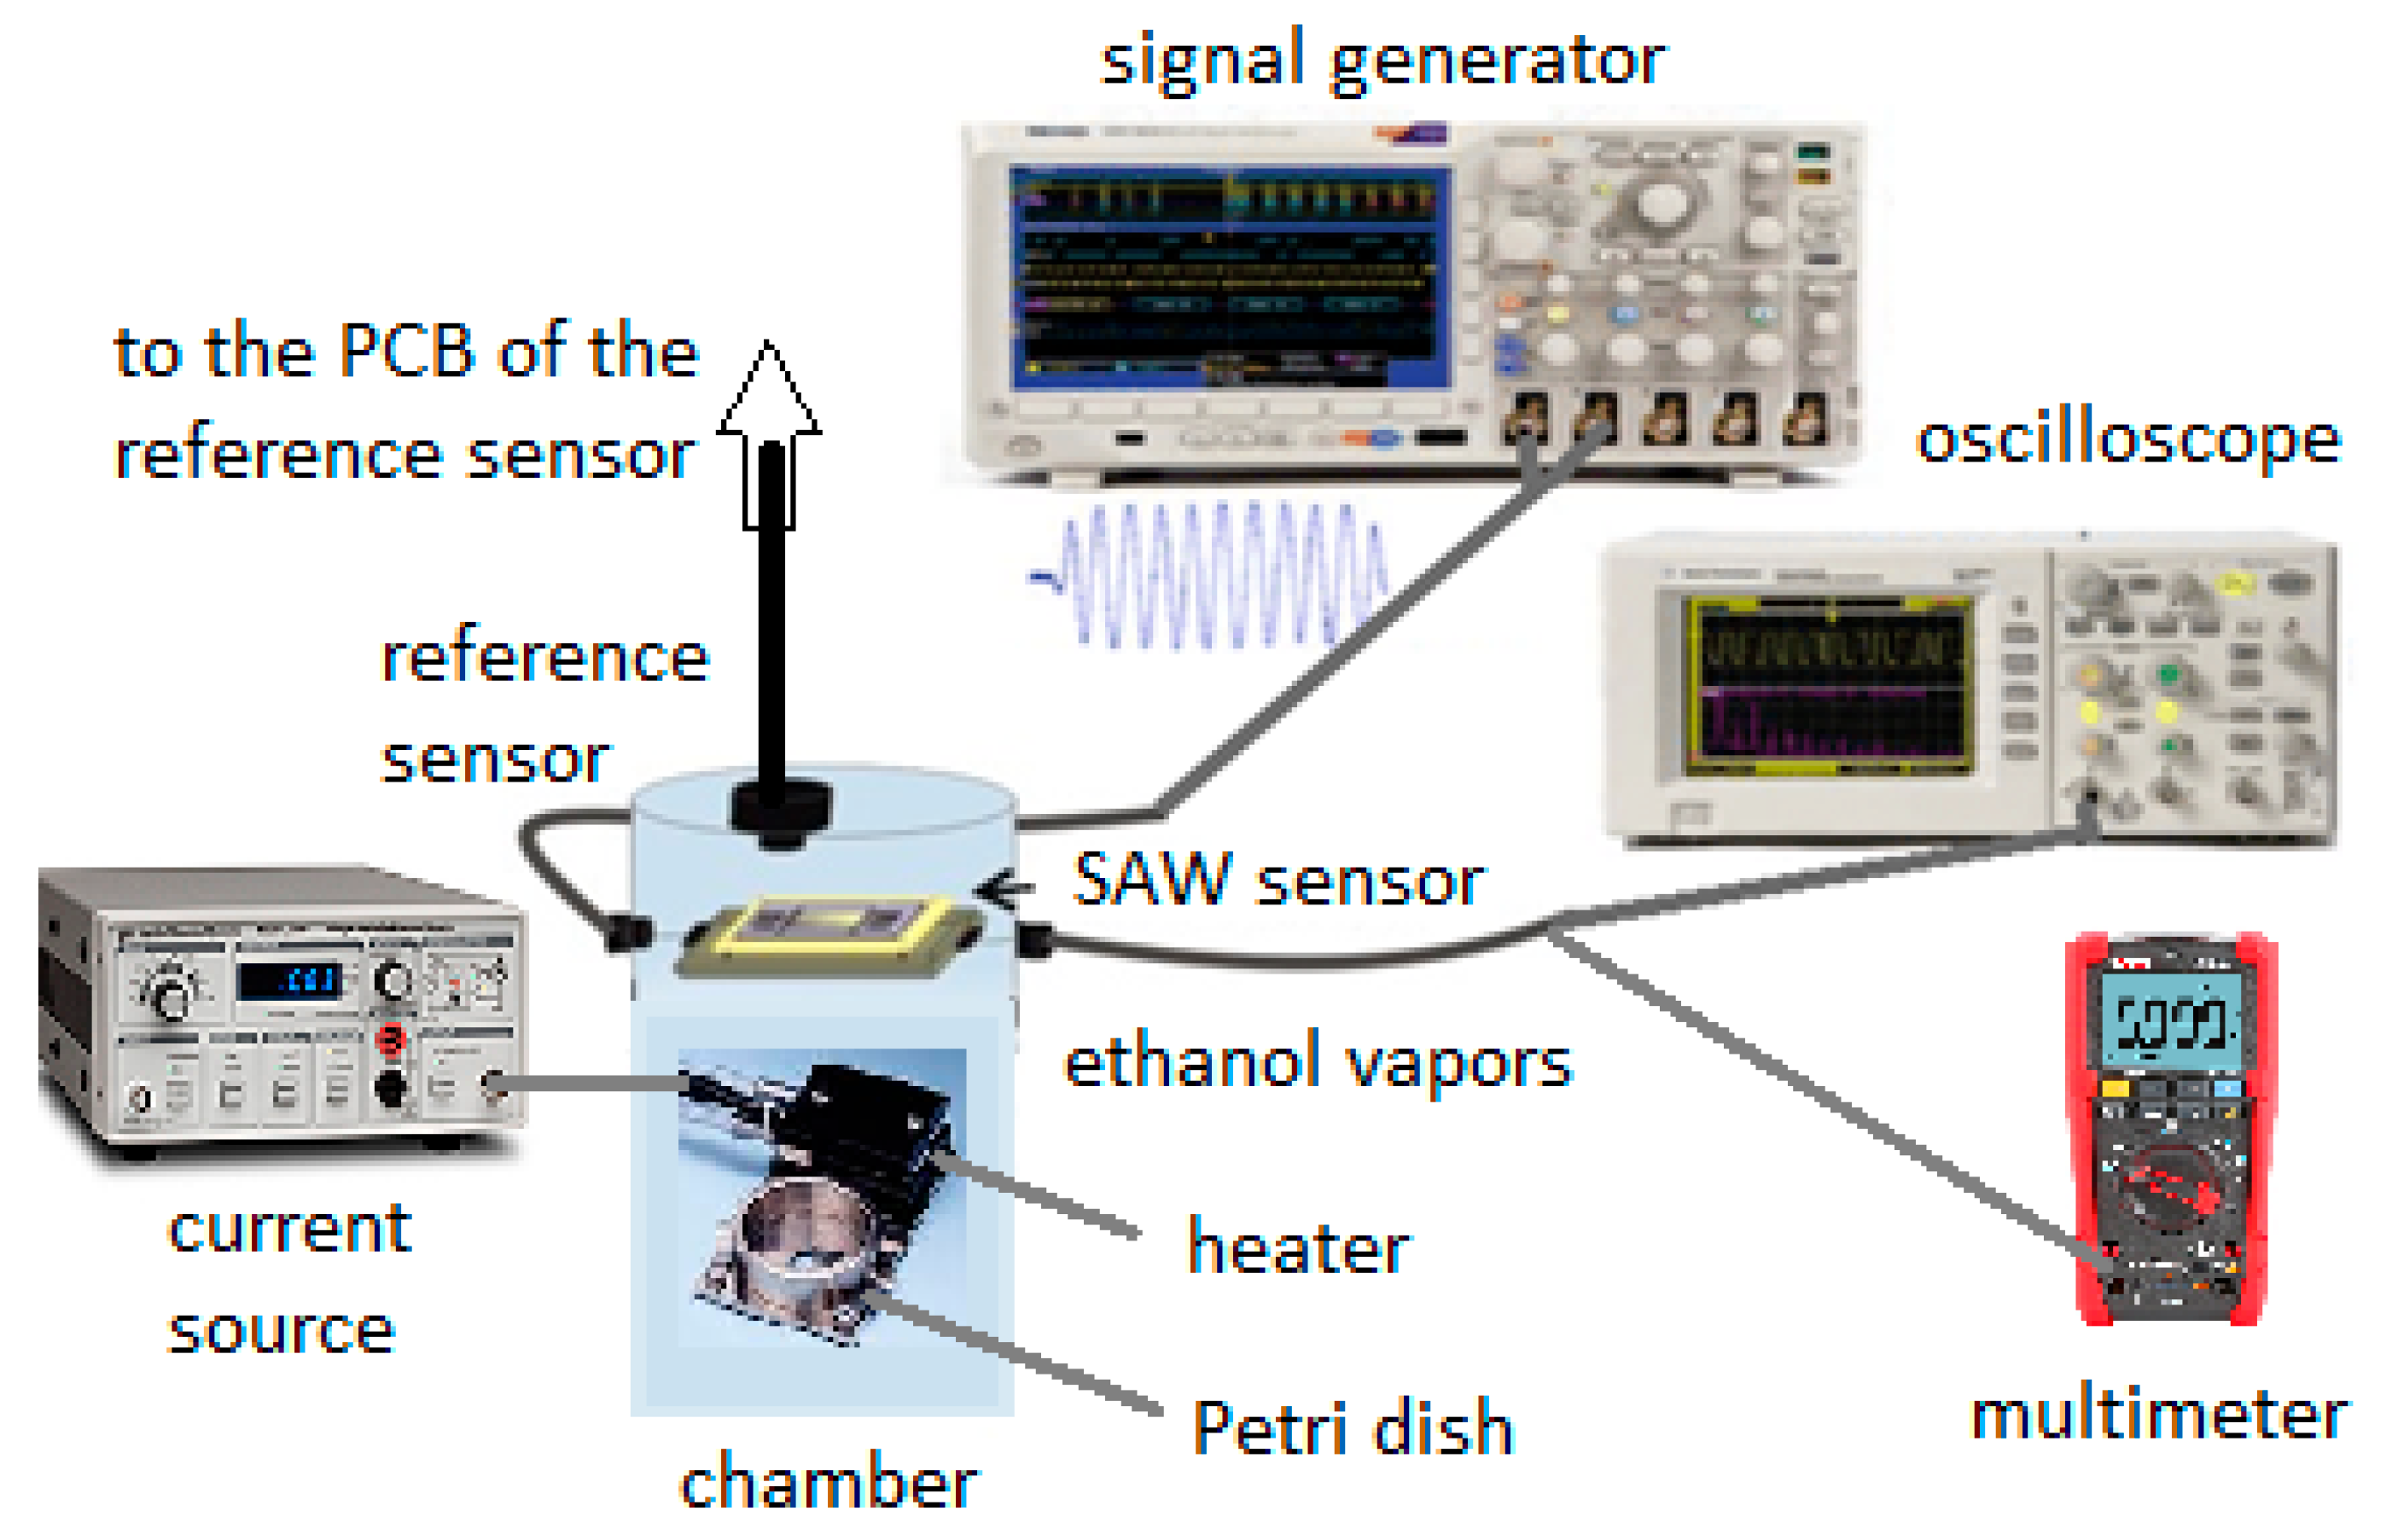
2. Materials and Methods

For the SAW fabrication, single polished pieces of LiNbO3 wafers, cleaned in ammonia-based solution, were used as substrates. The substrate was SAW grade, which means 128° Y-cut of the LiNbO3 crystal, which was characterized by good temperature stability of the electromechanical coupling factor from 20 °C to 500 °C, where the variations of this factor were <1.8% in this case [17]. This suggested temperature independence of the SAW distribution. Nickel films with a thickness of 120 nm were deposited using vacuum sputtering at a base pressure of 10-6 Torr, sputtering voltage of 1.2 kV, and plasma current of 160 mA. A conventional photolithographic patterning procedure with wet anisotropic chemical etching was applied to define the three basic topologies of the samples. The etching solution of HNO3:CH3COOH:H2SO4 = 5:5:2 was prepared. Photos of the prepared samples are shown in Figure 1a–c.
The geometrical dimensions were as follows: device 1 (Figure 1a)—finger length of the interdigital electrodes (IDT) was 260 µm, finger pitch was 50 µm, and the number of fingers in each transducer from the pair (input and output IDT) was symmetric and equal to 25; device 2 (Figure 1b)—finger length of the interdigital electrodes (IDT) was 150 µm, finger pitch was 25 µm, and the number of fingers in each transducer from the pair (input and output IDT) was asymmetric and equal to 4 and 100, respectively; device 3 (Figure 1c)—finger length of the interdigital electrodes (IDT) was 150 µm, finger pitch was 15 µm, and the number of fingers in each transducer from the pair (input and output IDT) was asymmetric and equal to 4 and 166, respectively. Metal frames and reflectors were additionally formed out of the sensing zone for suppressing wave energy dissipation and improving the signal-to-noise ratio.
Carbyne-enriched nanolayers were selectively grown on the top of the IDT electrodes using the ion-assisted pulse-plasma deposition technique, avoiding the contact pad coating. In previous experiments, new routes to encapsulating oriented linear chains of carbon atoms were established: monatomic carbon filaments in the matrix of amorphous carbon, creating bends, and controlling the end groups in the process of ion-assisted pulse-plasma growth. Within a 2D-ordered linear-chain carbon nanomatrix, the carbon atom wires (CAWs) very weakly interact with each other (due to van der Waals interaction), and therefore, the properties of such nanomatrices are actually determined by the properties of the individual CAWs. The ordered array of the one-dimensional carbon chains packed parallel to one another in hexagonal structures is oriented perpendicular to the substrate surface. The specific energy of the plasma pulse should exceed the breaking energy of the sp2 bonds (614 kJ/mol) and the sp3 bonds (348 kJ/mol), but should not exceed the breaking energy of the sp1 bonds (839 kJ/mol) in the evaporating carbon chains. The controlled bond breaking and sp-phase transformation can be provided through the predictive ion-assisted stimulation with specific energy levels. Raman spectroscopy showed that the line near 2040 cm−1 corresponded to the oscillation of long carbon chains with sp1 hybridization. The obtained spectra revealed multiphonon replicas of the 2040 cm−1 line that was evidently associated with the presence of defects in carbon chains [18,19]. Furthermore, the methods of X-ray photoelectron spectroscopy (XPS, Axis Ultra DLD, Kratos, UK) and transmission electron microscopy (Zeiss Leo 912 Omega, Carl Zeiss, Oberkochen, Germany) were previously used, which allowed one to directly register the contribution of sp1-hybridized carbon bonds, which occur exclusively in chain structures. XPS characterization results demonstrated that the carbyne-like sp1-hybridized structures were present in the samples. Microscopy images taken showed the discontinuity of the coating on the polycrystalline copper substrate due to adhesion differences, while the monocrystalline silicon allowed for better film quality. A silicon substrate also provides better coupling of vibration modes, leading to stronger chain-related Raman signals in the low-frequency region [20,21]. The thickness of the carbyne-enriched films was ~280 nm for device 1 and device 2 and 140 nm for device 3. The deposition chamber of the experimental setup is shown in Figure 2, illustrating the situation of the target carbon source, ion source, substrate position (Figure 2a), the fixing of the samples (Figure 2b), and the images from the scanning electron microscope (SEM, LYRA I XMU, Tescan, Kohoutovice, Czech Republic) of the carbyne-enriched coatings with the different thicknesses (Figure 2c,d). The deposition conditions were the same for all three samples as follows: distance between the target and the substrates of 1 meter, 3000 pulses, 300 V (the voltage for an arc discharge ignited between the main discharge cathode holding the source of carbon and the main discharge anode holding the substrate), 2000 µF (parameter of the charge of the main capacitor that formed pulses of carbon plasma), 1.5 kV, and 100 mA (parameters of the second argon plasma).
The change in the sensing layer thickness for device 3 was imposed using the attenuation of the surface acoustic wave. The sizes of the SAW devices were calculated, following methodology described elsewhere [22], considering the density and thickness of the coating as related to the IDT electrodes’ period and patch, as well as the line length for SAW distribution. The thickness was experimentally confirmed by measuring the magnitude and frequency shift of the output signals as compared to the input signals for all three devices after the sensitive layer growth. They were equal for each combination of IDT’s patterns before ethanol vapor absorption and this was the starting point of each measurement.
For the sensing device characterization, a laboratory-made measurement chamber was used. The measurement setup is illustrated in Figure 3.
Inside a heater was situated so that it was thermally insulated from the chamber. On the top of the heater, there was a Petri dish with a capacity of 3 mL. A current controller with thermocouple feedback set the current through the heater for precise control of the temperature rate change, thus establishing a specific evaporation rate for the 96% concentrated liquid ethanol and converting it into ethanol vapor distributed in the chamber via control of the vaporization time. An additional reference ethanol sensor was mounted close to the device under examination. The SAW structures were first excited with a generator, generating a signal with an amplitude of 20 V from peak to peak and a frequency between 100 kHz and 1 MHz according to the IDT topology (the finest were excited with the highest frequency and vice versa). The output voltage magnitude and shape, as well as the voltage difference and delay time between the output and the input signals, were measured using a Tektronix oscilloscope. The effective output voltage was measured using a multimeter. The control (reference) ethanol sensor was an MQ-3 (ME075) with the necessary resolution.

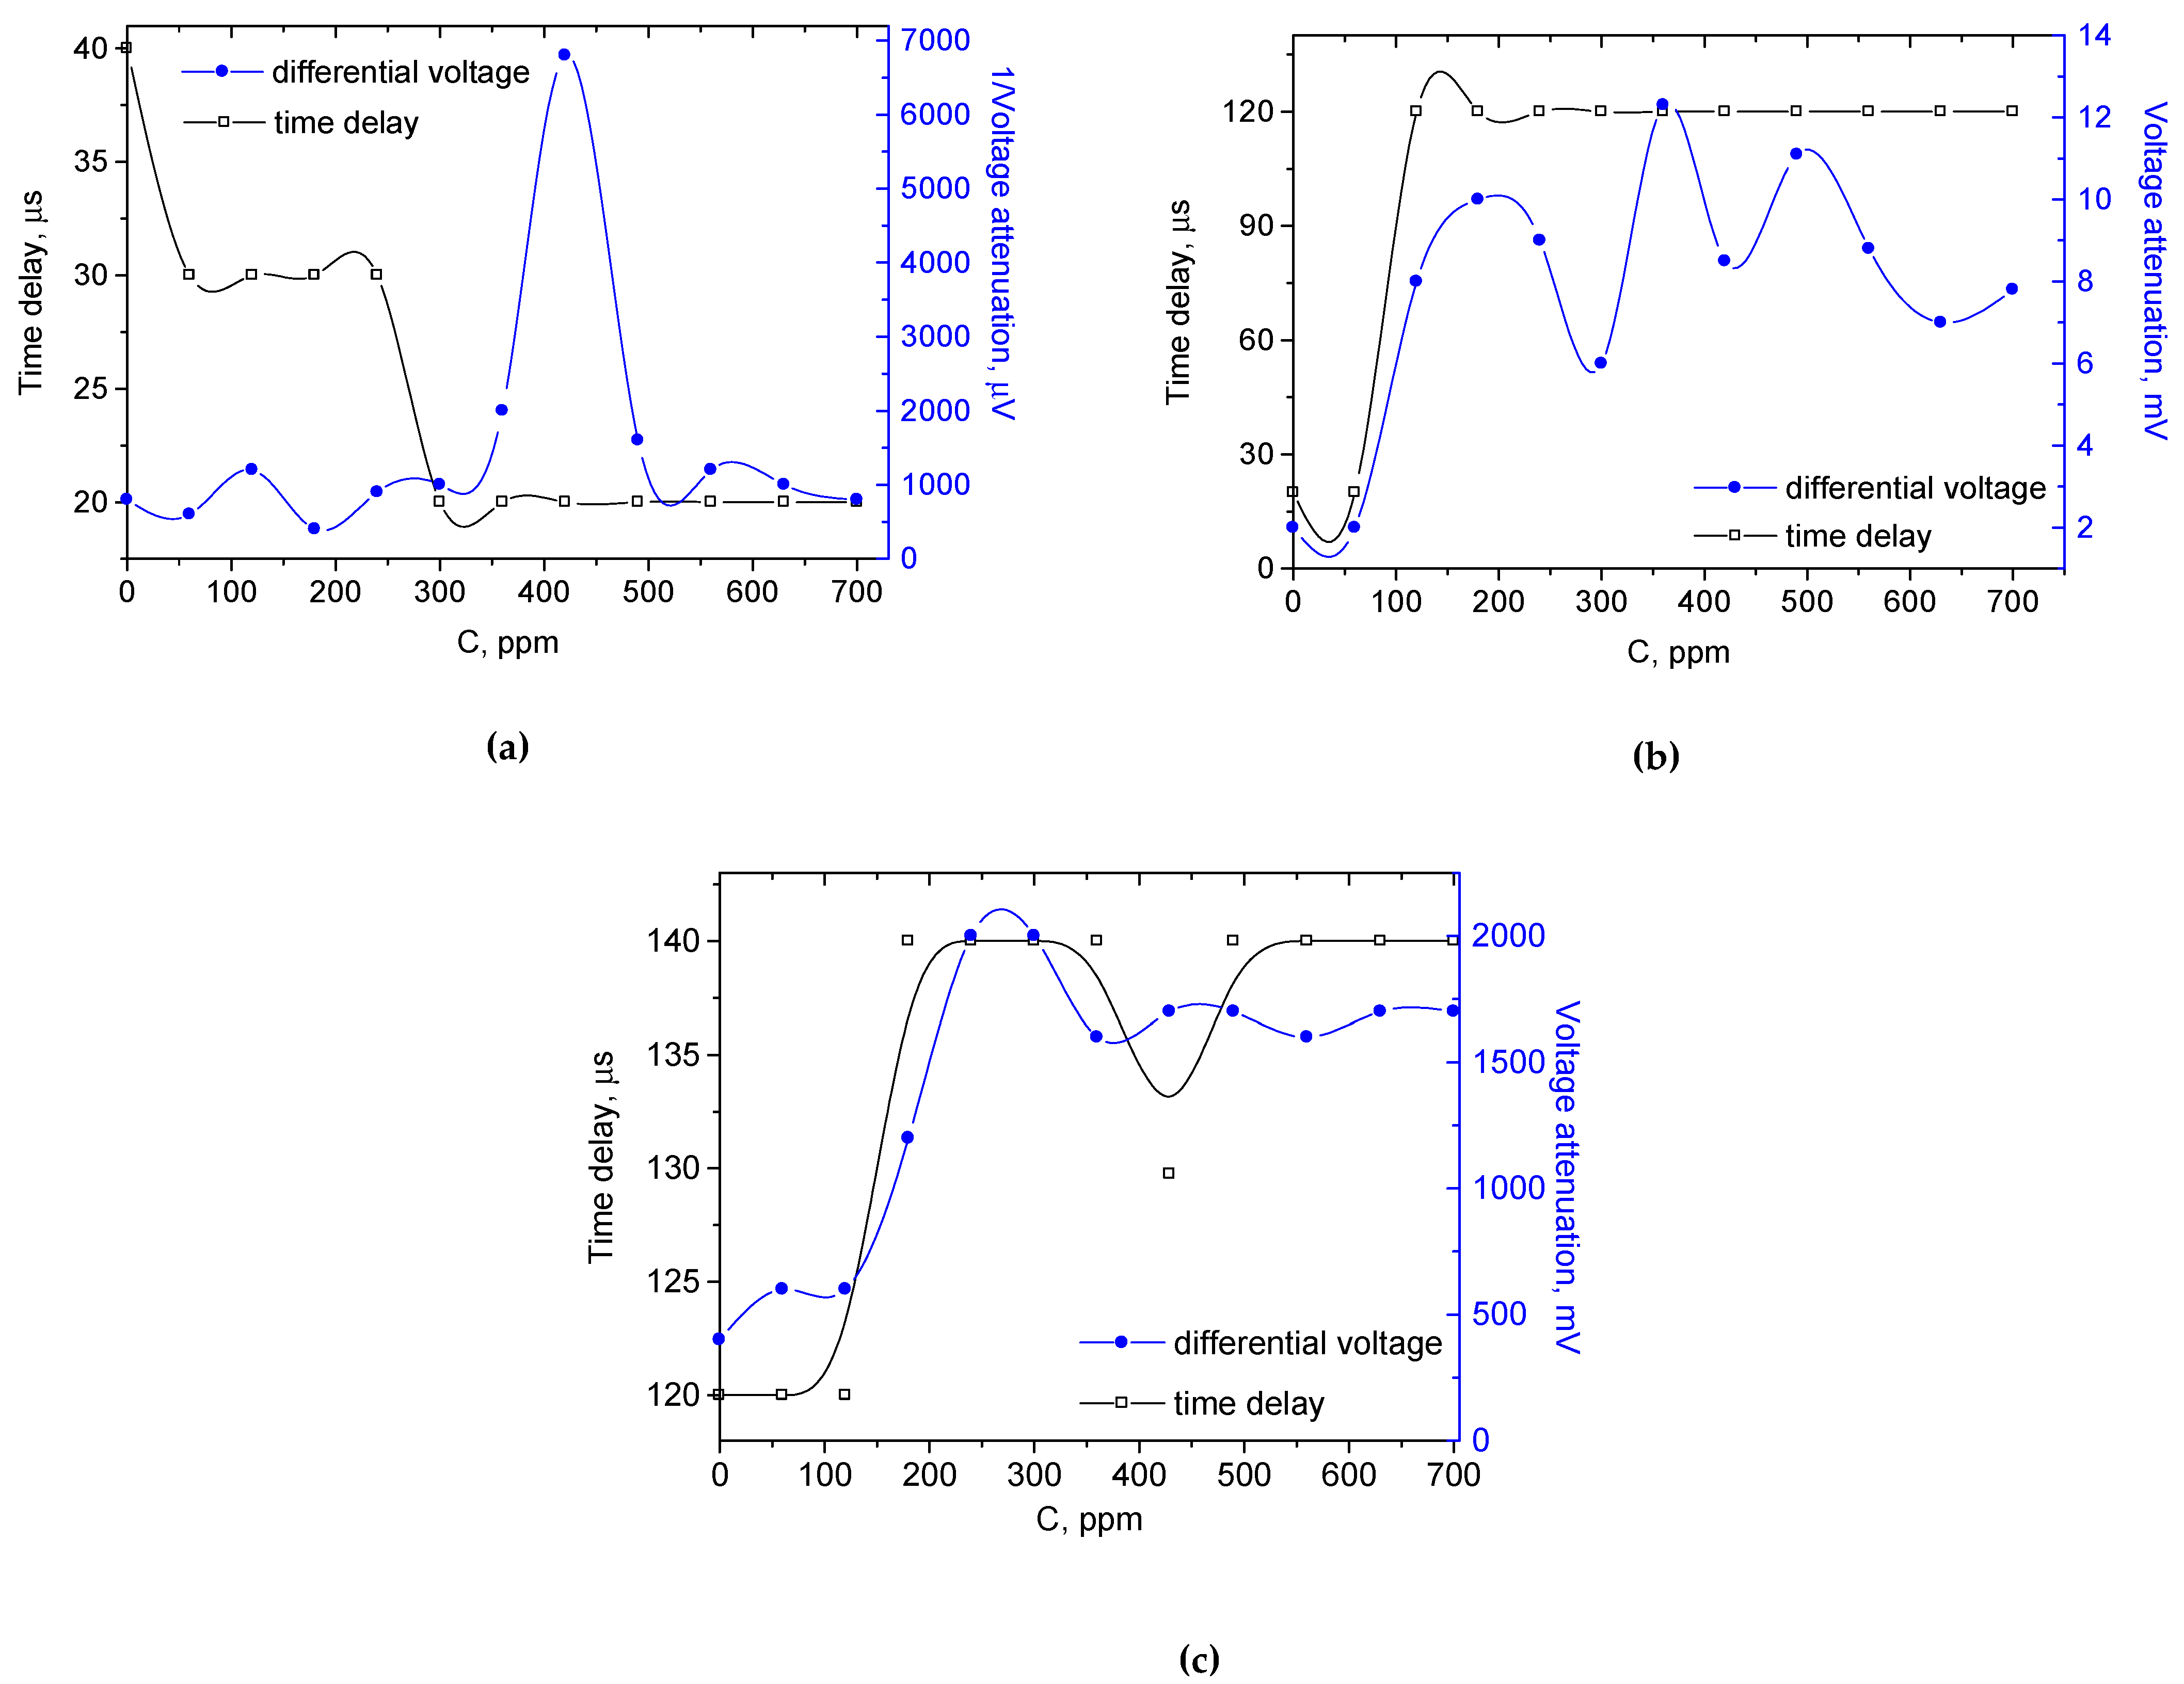
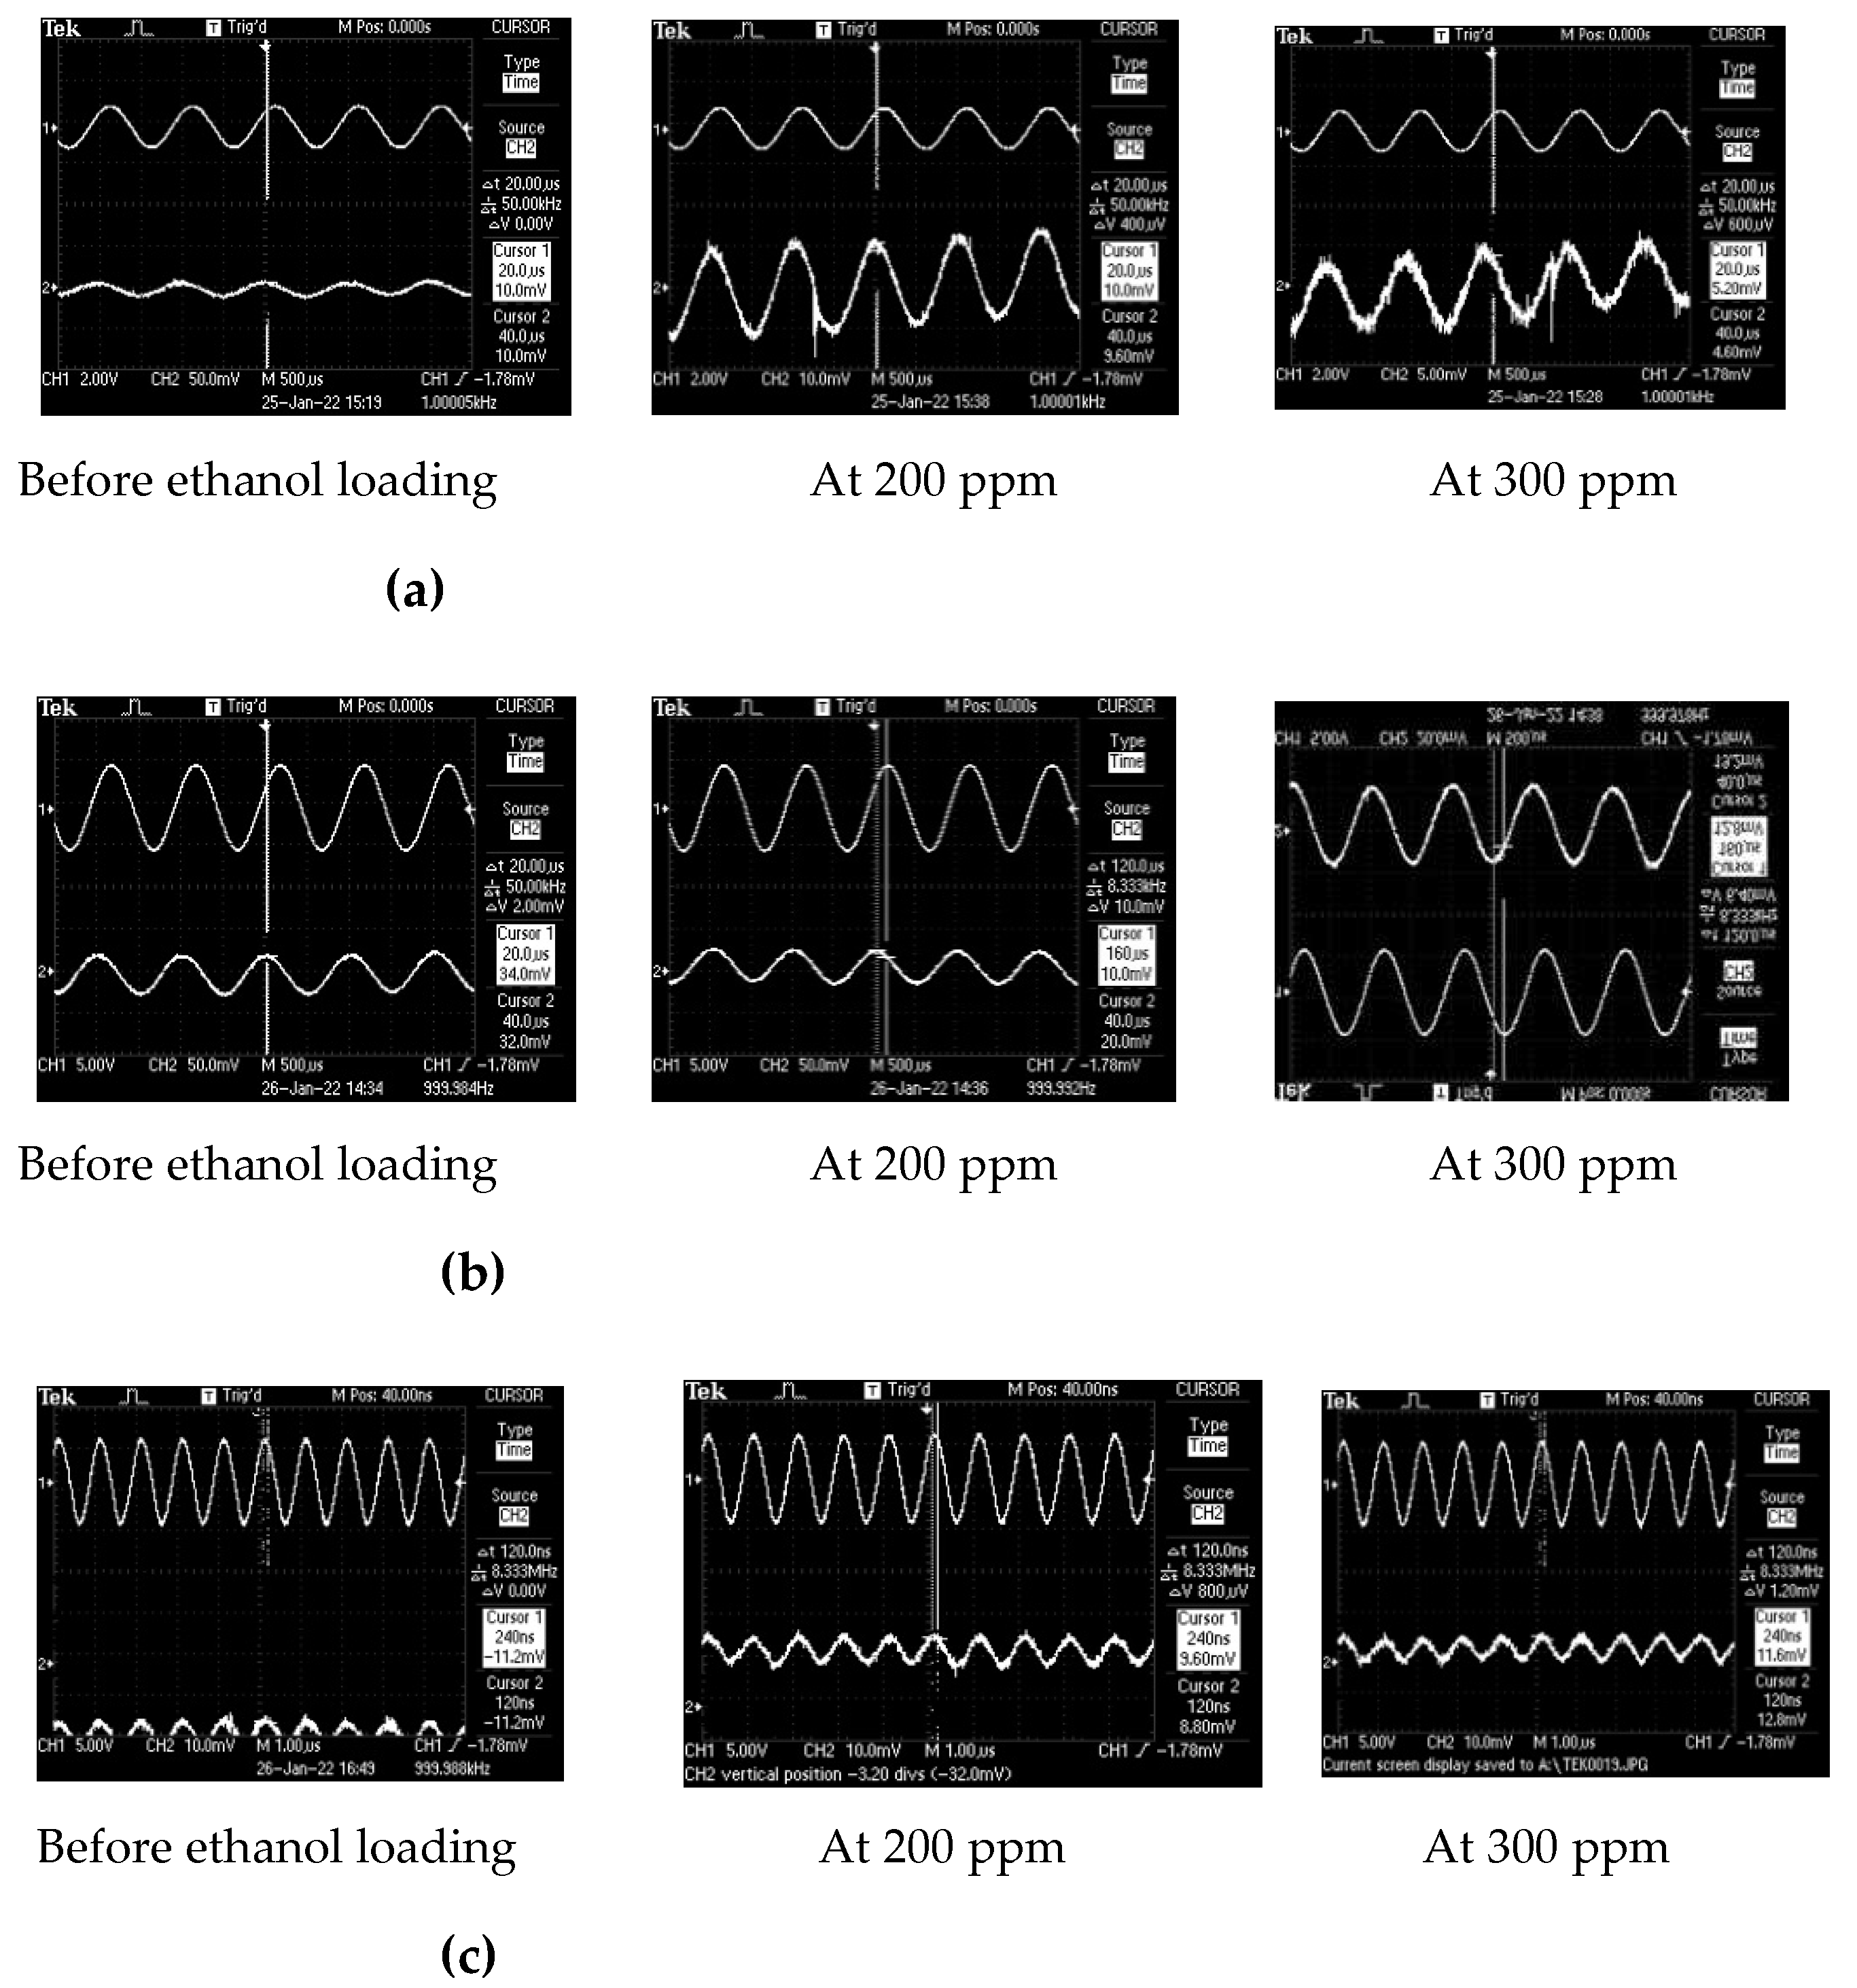
3. Results and Discussion

As can be seen in Figure 2c, the carbyne-enriched coating was characterized by a fine-grained structure and developed surface, which is favorable for sensing applications and was expected to facilitate vapor absorption.
Figure 4 shows a comparison between the output voltages of all three SAW devices as a function of the stationary conditions in the chamber for each temperature of the heater, resulting in a specific concentration of ethanol vapors in the defined volume of the measurement chamber. One of the Y-axes in each of Figure 4a–c represents the concentration of the ethanol vapors in the closed chamber when ethanol liquid evaporated at a specific temperature. The temperature increased with a slow rate of 0.3 °C/min and could be maintained at an accuracy of 0.01 °C, resulting in a gradual increase in the ethanol concentration with a uniform rate of vaporization of 12 ppm/°C up to 72 °C, where the entire quantity of ethanol was fully vaporized. This setup provided a linear relation of the ethanol vapor concentration with respect to the temperature that was used to estimate the linearity of the response of the SAW devices.
As can be seen in Figure 4a, the output voltage of the sample with the largest IDTs displayed atypical behavior, as the number of absorbed ethanol molecules caused an increase in the voltage, which suggested an increase in the intensity of the surface acoustic wave. This was possible only if the device fell into a new resonance mode due to the mass loading with ethanol vapors that provoked an up to 5 times greater amplitude of the output voltage. However, this phenomenon was observed in a limited concentration range and could not be applied to the whole range of the measured concentrations. Although the exact reasons for this electromechanical behavior are still not fully clarified, device 1 needs attention because of the promising sensitivity of 270 µV/ppm, which was the highest out of the three kinds of samples. The dynamic range of this device was found to be ~50–550 ppm and the deviation from the linearity in this range was determined to be 0.94%. As this was the narrowest dynamic range from the studied devices, it might be considered that the topology of the sample, which was characterized by the lowest number of IDTs and the greatest patch distance in between the neighboring electrode fingers, led to the lowest excitation frequency of 100 kHz. The lowest operational frequency, in combination with the greatest interelectrode gap coated with carbyne-enriched materials, probably resulted in the formation of multiple reactive capacitive components along the length of the SAW line that could strongly affect the resonant frequency change of the device and could partially explain the atypical direction of change of the output voltage. This was due to the accumulated charges on the microcapacitors that were formed by the multiplying effect at the end of the sensing line.
As can be seen in Figure 4b, device 2 showed typical behavior of attenuation regarding the output voltage, and thus, the energy of the acoustic wave with the increase of the concentration of the absorbed ethanol molecules. Following the assumptions for the previous device 1, it can be concluded that the IDT electrode gaps were sufficiently small to not affect the distribution of the energy conversion by the piezoelectric substrate. Despite the slightly lower sensitivity of device 2 of 221 µV/ppm as compared to device 1, the dynamic range was ~330 ppm (30–660 ppm), which was a broader range with a linear response. A non-linearity of ~3.9% was obtained for this device. Figure 4c shows the voltage response characteristic for the sensing device 3, which was characterized by smaller IDT features than device 1 and device 2 but also had a carbyne-enriched nanolayer with half the thickness to avoid attenuation of the SAW. It exhibited the lowest sensitivity out of all studied devices of ~80 µV/ppm, which confirmed the assumption for the van der Waals adsorption sensing mechanism. In this case, the sensitivity was limited by the thinner sensing film, which limited the adsorption capacity of the device. The non-linearity of the device was found to be 0.97%, which was close to device 1, but in contrast to this sensor, device 3 was characterized by the broadest dynamic range of ~428 ppm (59–487 ppm) and an attenuation of the output signal with the ethanol mass loading effect increase.
The response time was determined using the well-known methodology for pulsed signals, where the time for establishing 10% to 90% from a certain equilibrium condition is called the rise time and the time for the switching of the equilibrium conditions in the opposite direction is called the fall time (see Figure 5a). For device 1, a response time (rise time) of 28 s and a recovery time (fall time) of 20.1 s were measured for an ethanol concentration of C = 400 ppm, corresponding to the middle zone of linear response characteristic. This can be classified as a slow response time. The time response characteristics were relatively symmetric regarding the rise and fall times. For device 2 (Figure 5b), a response time of 20 s and a recovery time of 14.1 s were measured for the middle zone of linear response. A slightly faster response time was measured than for device 1, and a faster recovery time with a small difference between both times. For device 3 (Figure 5c), 31 s was measured for the response time and 15 s for the recovery time in the middle zone of the linear response. This was the longest response time of all the tested samples and there was a large difference between both times.
All three devices exhibited relatively good recovery ability after unloading from the ethanol molecules (Figure 5a–c). The unloading effect was achieved by a simple blowing of the chamber with an inert gas without additional heating of the sensing components. It was suggested that the van der Waals interaction between the vapor molecules and the carbyne-enriched film was boosted by the highly developed surface of the coating, as shown in Figure 2c. Thus, the higher sensitivity of devices 1 and 2, as compared with device 3, was ascribed to their higher thickness of the sensing layer, which was related to a higher capacity for physical adsorption. Therefore, full recovery of the initial state of each device can be expected if post-measurement heating of the samples is applied.
Figure 6a–c shows the changes in the time delay and voltage attenuation between the output and input signal of the IDT electrodes. These parameters determine the resonance frequency shift and damping as a function of the film mass or density shifts due to the ethanol concentration. Their behavior was distinct for each of the electrode topologies previously outlined: (a) For device 1, the time delay decreased linearly with the concentration increase from zero to 100 ppm and later from 250 to 320 ppm, while the damping or voltage difference was nearly constant, with the exception of the 430–440 ppm, where there was a maximum corresponding to strong and stable detection. (b) For device 2, the voltage difference changed more rapidly several times with the concentration with different magnitudes, while the time delay increased from the unloaded resonator value to the fully loaded value and was established at a constant level. This could mean that the upper surface of the film uniformly absorbed the vapor pressure and led to a larger deformation in the film, causing the instability of the signal. (c) For device 3, the two measured quantities increased relatively rapidly and were stable with the concentration. Some unexpected variations around 280–450 ppm that occurred in the time delay and voltage attenuation could be attributed to the changes in the mode of wave propagation due to the device’s fine geometry.
Figure 7a–c shows the oscillograms of the output voltage to demonstrate the lack of signal distortions that might affect the measurements. The total harmonic distortions (THDs) were calculated for the cases of interest and it was found that for most of the cases, they are less than 1%, except for device 1 for the cases after ethanol loading with a concentration of 200 and 300 ppm, where the THDs were 1.41% and 1.7%, respectively. Therefore, the reflectors designed according to the used IDTs topologies seemed to be suitable for suppression of the possible induced noise. The noise-susceptible structures exhibited significant stability to random effects that could induce an atypically large variation. This could be observed as a smooth output signal, not only for the devices before loading but also for the concentrations of ethanol close to the middle linear zone of detection for each topology.
Summarization of the values of the basing sensing parameters and characteristics for the three studied devices can be found in the comparative Table 1.

4. Conclusions

The prepared sensing structures exhibited strong dependences on the detection parameters of the electrodes’ topologies. It was found that the finer comb geometry was preferable for the broad dynamic range and linear response of the device. One of the benefits related to this principle of ethanol measurement was that the optimal operating temperature of such sensors was preferably low, thus having a low power consumption.
Although the dominant interaction mechanism between the organic analyte and the carbyne-enriched coating seemed to be physical adsorption, full recovery of the samples’ initial state after exposure to certain vapor concentrations was not observed. Therefore, future optimization of this parameter can be achieved via the integration of a heating component on the backside of the piezoelectric substrate, facilitating the desorption process.
Due to the most promising results for sensing device 3, it is worth further investigation and optimization. Future studies will be focused on the exposure of the devices to a variety of volatile organic compounds and humidity in order to investigate their selectivity. Moreover, future experiments will be related to full restoration of the initial condition of the sensor, which is possible with full desorption of the ethanol molecules. For this purpose, the integration of a heater on the backside of the substrate is planned and the effect of the temperature on the sensor’s full restoration (unloading) will be studied.

Author Contributions

Conceptualization, M.A. and A.L.; methodology, M.A. and A.L.; validation, A.B. and G.K.; formal analysis, M.A., G.K., and A.L.; investigation, M.A., A.B., G.K., and A.L.; resources, M.A. and A.B.; writing—original draft preparation, all authors; writing—review and editing, all authors; visualization, M.A.; supervision, M.A. and A.L.; project administration, M.A. and A.L.; funding acquisition, M.A. and A.L. All authors have read and agreed to the published version of the manuscript.

Funding

This research was funded by the Bulgarian National Science Fund, grant number KP-06-DO2/2 form 2020, under the ERA.NET RUS+ project. The research work of the Russian research team was jointly supported and funded by Russian Foundation for Basic Research (RFBR) according to the research project No. 20-58-46014.

Institutional Review Board Statement

Not applicable.

Informed Consent Statement

Not applicable.

Data Availability Statement

Data are available on request due to potential proprietary restrictions.

Conflicts of Interest

The authors declare no conflict of interest. The funders had no role in the design of the study; in the collection, analyses, or interpretation of data; in the writing of the manuscript; or in the decision to publish the results.

References

  1. Flood, P.; Babaev, V.; Khvostov, V.; Novikov, N.; Guseva, M. Carbon Material with a Highly Ordered Linear-Chain Structure. In Polyynes Synthesis, Properties and Applications; Cataldo, F., Ed.; Taylor & Francis Group: Didcot, UK, 2005; pp. 219–252. [Google Scholar] [CrossRef]
  2. Aleksandrov, A.F.; Guseva, M.B.; Savchenko, N.V.; Streletskii, O.A.; Khvostov, V.V. The Film of Two-Dimensionally Ordered Linear-Chain Carbon and Method of Its Production. Russian Patent Application No. 2564288, 10 May 2015. [Google Scholar]
  3. Graphene-Info Updates All Its Graphene Market Report. Available online: https://www.graphene-info.com/graphene-info-updates-all-its-graphene-market-report-6 (accessed on 1 March 2022).
  4. Akinwande, D.; Huyghebaert, C.; Wang, C.-H.; Serna, M.I.; Goossens, S.; Li, L.-J.; Wong, H.-S.P.; Koppens, F.H.L. Graphene and two-dimensional materials for silicon technology. Nature 2019, 573, 507–518. [Google Scholar] [CrossRef] [PubMed]
  5. Grogan, C.; Amarandei, G.; Lawless, S.; Pedreschi, F.; Lyng, F.; Benito-Lopez, F.; Raiteri, R.; Florea, L. Silicon Microcantilever Sensors to Detect the Reversible Conformational Change of a Molecular Switch, Spiropyan. Sensors 2020, 20, 854. [Google Scholar] [CrossRef] [PubMed] [Green Version]
  6. Boom, B.A.; Bertolini, A.; Hennes, E.; van den Brand, J.F.J. Gas Damping in Capacitive MEMS Transducers in the Free Molecular Flow Regime. Sensors 2021, 21, 2566. [Google Scholar] [CrossRef] [PubMed]
  7. Yao, X.; Zhang, Y.; Cui, Y. A Microfabricated Transparent Capacitor for Sensing Ethanol. J. Microelectromechanical Syst. 2019, 28, 164–169. [Google Scholar] [CrossRef]
  8. Yang, M.Z.; Dai, C.L. A Capacitive Ammonia Sensor Using the Commercial 0.18 μm CMOS Process. In Advanced Materials Research; Trans Tech Publications Ltd.: Kapellweg, Switzerland, 2015. [Google Scholar]
  9. Teradal, N.L.; Marx, S.; Morag, A.; Jelinek, R. Porous graphene oxide chemi-capacitor vapor sensor array. J. Mater. Chem. C 2017, 5, 1128–1135. [Google Scholar] [CrossRef]
  10. Mohammed, Z.; Elfadel, I.A.M.; Rasras, M. Monolithic Multi Degree of Freedom (MDoF) Capacitive MEMS Accelerometers. Micromachines 2018, 9, 602. [Google Scholar] [CrossRef] [PubMed] [Green Version]
  11. Mouro, J.; Pinto, R.; Paoletti, P.; Tiribilli, B. Microcantilever: Dynamical Response for Mass Sensing and Fluid Characterization. Sensors 2021, 21, 115. [Google Scholar] [CrossRef] [PubMed]
  12. Bouchaala, A.; Nayfeh, A.H.; Younis, M.I. Frequency Shifts of Micro and Nano Cantilever Beam Resonators Due to Added Masses. J. Dyn. Sys. Meas. Control. 2016, 138, 091002. [Google Scholar] [CrossRef]
  13. Lu, X.; Cui, M.; Yi, Q.; Kamrani, A. Detection of mutant genes with different types of biosensor methods. TrAC Trends Anal. Chem. 2020, 126, 115860. [Google Scholar] [CrossRef]
  14. Yeo, L.Y.; Friend, J.R. Surface Acoustic Wave Microfluidics. Annu. Rev. Fluid Mech. 2014, 46, 379–406. [Google Scholar] [CrossRef] [Green Version]
  15. Chen, Q.; Wang, D.; Cai, G.; Xiong, Y.; Li, Y.; Wang, M.; Huo, H.; Lin, J. Fast and sensitive detection of foodborne pathogen using electrochemical impedance analysis, urease catalysis and microfluidics. Biosens. Bioelectron. 2016, 86, 770–776. [Google Scholar] [CrossRef] [PubMed]
  16. Agostini, M.; Greco, G.; Cecchini, M. Full-SAW Microfluidics-Based Lab-on-a-Chip for Biosensing. IEEE Access 2019, 7, 70901–70909. [Google Scholar] [CrossRef]
  17. Chen, F.; Kong, L.; Song, W.; Jiang, C.; Tian, S.; Yu, F.; Qin, L.; Wang, C.; Zhao, X. The electromechanical features of LiNbO3 crystal for potential high temperature piezoelectric applications. J. Mater. 2019, 5, 73–80. [Google Scholar] [CrossRef]
  18. Streletskiy, O.A.; Zavidovskiy, I.A.; Nischak, O.Y.; Pavlikov, A.V. Multiphonon replicas in Raman spectra and conductivity properties of carbon films with different concentrations of sp1-bonds. Thin Solid Film. 2019, 671, 31–35. [Google Scholar] [CrossRef]
  19. Buntov, E.A.; Zatsepin, A.F.; Guseva, M.B.; Ponosov, Y.S. 2D-ordered kinked carbyne chains: DFT modeling and Raman characterization. Carbon 2017, 117, 271–278. [Google Scholar] [CrossRef]
  20. Streletskiy, O.A.; Zavidovskiy, I.A.; Nischak, O.Y.; Dvoryak, S.V. Electrical conductivity and structural properties of a-C:N films deposited by ion-assisted pulse-arc sputtering. Thin Solid Film. 2020, 701, 137948. [Google Scholar] [CrossRef]
  21. Boqizoda, D.; Zatsepin, A.; Buntov, E.; Slesarev, A.; Osheva, D.; Kitayeva, T. Macroscopic behavior and microscopic factors of electron emission from chained nanocarbon coatings. C 2019, 5, 55. [Google Scholar] [CrossRef] [Green Version]
  22. Ballantine, D.S.; White, R.; Martin, S.; Ricco, J.; Zellers, E.; Frye, G.; Wohltjen, H. Acoustic Wave Sensors Theory, Design and Physico-Chemical Applications: A Volume in Applications of Modern Acoustics; Elsevier Inc.: Amsterdam, The Netherlands, 1997. [Google Scholar]
Figure 1. Photos and nomenclature of the prepared SAW structures: (a) device 1, (b) device 2, and (c) device 3.
Crystals 12 00501 g001
Figure 2. Deposition of carbyne-enriched nanocoatings on the SAW samples: (a) deposition chamber, (b) fixed samples during the process, (c) SEM image of the coating with a thickness of 280 nm, and (d) SEM image of the coating with a thickness of 140 nm at the same magnification of 6480×.
Crystals 12 00501 g002
Figure 3. Measurement setup for the functionality testing of the SAW devices with carbyne-enriched nanocoatings and response measurement during ethanol exposure.
Crystals 12 00501 g003
Figure 4. Peak-to-peak voltage of the sensors’ outputs at different temperatures in the chamber, corresponding to different evaporated concentrations of ethanol in its volume: (a) device 1, (b) device 2, and (c) device 3.
Crystals 12 00501 g004
Figure 5. Response and recovery times for the ethanol concentration selected as a middle point of the linear zone of the sensors’ responses: (a) device 1, (b) device 2, and (c) device 3.
Crystals 12 00501 g005aCrystals 12 00501 g005b
Figure 6. Voltage differences between the output and input signals of the SAW and time delay of the signal vs. ethanol concentration: (a) device 1, (b) device 2, and (c) device 3.
Crystals 12 00501 g006
Figure 7. SAW’s output signal shapes and distortions at different ethanol concentrations: (a) device 1, (b) device 2, and (c) device 3.
Crystals 12 00501 g007
Table 1. Main ethanol detection parameters of SAW devices with different IDT patterns and using carbyne-enriched coating as a sensing material.
Parameter/
Device No.
Geometry and Sensing Film Thickness, nmSensitivity, µV/ppmDynamic Range, ppmLinearity, %Response Time, sRecovery Time, s
Device 1Coarse combs/280 nm2271840.942820.1
Device 2Fine combs/280 nm2213303.92014.1
Device 3Fine combs/140 nm804280.973115
Publisher’s Note: MDPI stays neutral with regard to jurisdictional claims in published maps and institutional affiliations.

