Article

Construction and Demolition Residuals as Raw Materials for the Production of Novel Geopolymer Building Materials

1
Faculty of Materials Engineering, Nuremberg University of Technology, 90489 Nuremberg, Germany
2
Department of Chemical Engineering, University Ulm, 89081 Ulm, Germany
*
Author to whom correspondence should be addressed.
Crystals 2022, 12(5), 678; https://doi.org/10.3390/cryst12050678
Submission received: 25 March 2022 / Revised: 4 May 2022 / Accepted: 6 May 2022 / Published: 9 May 2022
(This article belongs to the Special Issue Geopolymer)

Abstract

:
The increasing number of new construction projects requiring high-quality building products, which, in turn, emit enormous amounts of CO2, runs counter to European and global climate goals. The increasing occupation of valuable landfill space is also an ecological problem. To meet these challenges without having to lower living standards, more ecological building materials should be used in the future. Geopolymers or alkali-activated materials, which, unlike conventional building materials, can be produced and used without a prior burning or calcination process, offer a comparatively low-CO2 alternative. Significant CO2 emissions can already be saved by using this technology. The aim of this work is to investigate whether geopolymers can also be produced from construction and demolition residuals generated by the construction industry in order to counteract the problem of the increasing use of landfill space and, at the same time, to further reduce greenhouse gas emissions in the production of building materials. For this purpose, various residual materials from the construction and demolition industry are investigated by means of XRF, XRD, and IR spectroscopy for their setting behavior by alkaline activation. At the same time, the characteristic values of compressive strength, flexural strength, bulk density, and thermal conductivity, which are important for building materials, are determined in order to test the possible applications of the resulting materials as building materials.

1. Introduction

In 2019, 222,678 new construction projects were approved in Germany [1]. For the construction of new buildings on this scale, large quantities of suitable building materials are necessary in accordance with the requirements, such as concrete, aerated concrete, sand-lime bricks, and bricks. All the building materials mentioned have in common that significant raw material and energy resources have to be used for their production in thermoprocessing plants. During thermal treatment at high temperatures, corresponding amounts of CO2 are emitted both through the combustion of primary fuels and through the decarbonation of the mineral input materials. In order to achieve climate protection targets, building materials of the future should be characterized by lower energy consumption, reduced CO2 emissions, a feasible share of recycled material, and recyclability into the material cycle. In Germany, more than 228 million tons of construction and demolition waste were generated in 2018 [2]. For many years now, a useful recycling of valuable materials has been taking place, in which the metallic components such as iron and steel, as well as copper pipes, wood, and plastics are separated from the inorganic wall-building materials, plasters, and mortars and returned to the material cycle. However, a large proportion of the inorganic demolition materials are still sent to construction waste landfills, where they block valuable landfill space [3]. The work presented here deals with a relatively novel class of building materials called alkali-activated materials or geopolymers. These are cold-hardening binding materials that require a comparatively significantly lower primary energy consumption during their production, with correspondingly lower CO2 emissions [4]. From literature data, it is known that geopolymers based on metakaolin, fly ash, as well as blast furnace slags have been synthesized, also saving primary energy and costs [5,6,7]. The fly ash-based geopolymers are found to be particularly environmentally friendly when compared with other building materials. This is mainly attributed to the fact that combustion or drying processes are no longer necessary [8]. To further address this environmental concern, geopolymers based on crushed brick and concrete residues have also been produced [9,10,11,12,13]. In the work presented here, various typical demolition materials and residual materials from the construction sector, such as brick scrap, brick sanding dust, mixed rubble, and concrete rubble, were investigated with regard to their suitability as recycling materials for the production of novel geopolymer building materials. In particular, it was examined whether the residual materials mentioned are already suitable as singular solid components for geopolymer production. In order to detect a reaction of the starting materials by alkaline activation, both starting materials and the resulting products were investigated by Fourier-transform infrared spectroscopy (FTIR). In addition, the material parameters of compressive strength, flexural strength, bulk density, and thermal conductivity, which are important for building products, were determined. Scanning electron micrographs provided information on the morphology of the geopolymer products.

2. Materials and Methods

The residual materials used here were brick sanding dust (Figure 1a), brick scrap (Figure 1b,c), mixed rubble (Figure 1d,e), and concrete rubble (Figure 1f,g). While the brick sanding dust was already in powder form, the crumbly residual fractions of broken brick, mixed rubble, and concrete rubble were first crushed in a ball mill and then sieved to a particle size x ≤ 200 µm. Only the screened material was used for subsequent geopolymer production studies. In addition, a powdered class F fly ash from a coal-fired power plant, designated Microsit 10 (Figure 1h), was selected as a further residual material.

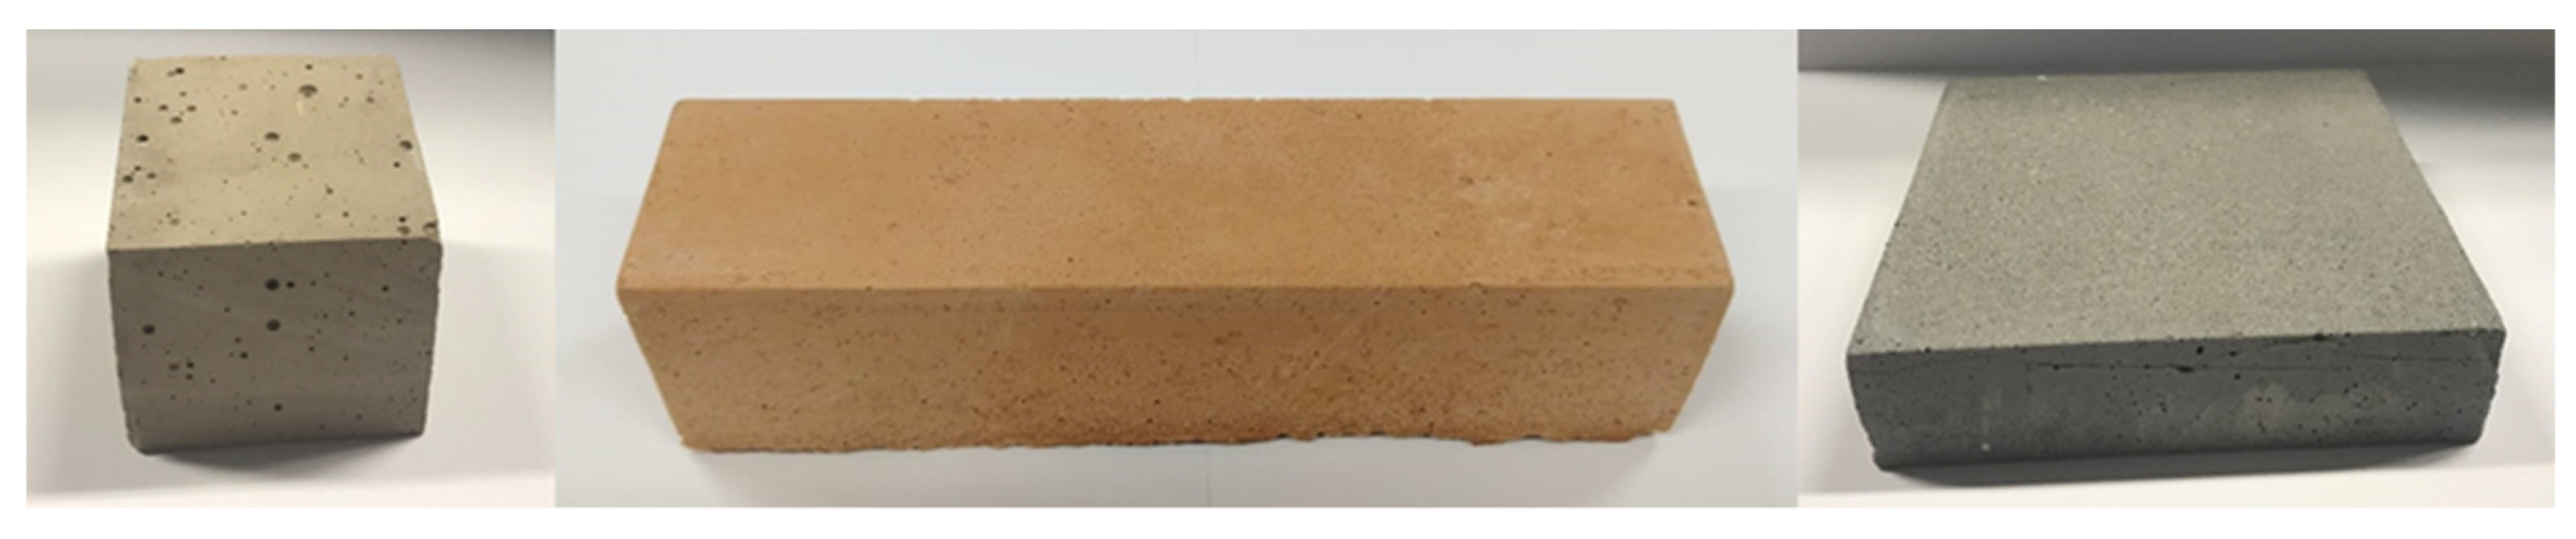
2.1. Sample Preparation

For the production of the geopolymer bricks, an alkaline activating solution of a liquid sodium silicate water glass of the grade “Betol 39 T” from Woellner-Werke, Ludwigshafen with a water glass modulus (SiO2/Na2O) of 3.0, was used. Solid NaOH pellets were slowly added under constant stirring until the solution consisted of 85.46 wt.% liquid sodium silicate and 14.54 wt.% sodium hydroxide, resulting in a water glass modulus of 1.28. During this process, the solution was stirred continuously over a period of 24 h. The activator solution thus consisted of 23.44% SiO2, 18.37% Na2O, and 57.90% H2O. To produce the geopolymer bricks, 1 kg of activator solution was added for every 3 kg of prepared residual powder. In this series of tests, the geopolymer bricks were produced exclusively from 100 wt.% of each of the prepared sorted residual aggregates, which can be seen in Figure 1a–h. The test batches were homogenized in a laboratory mixer over a period of 15 min each at a rotational speed of 250 rpm. The homogeneous paste was immediately poured into molds made of silicone, and air bubbles introduced in the process were expelled onto a vibrating plate over a period of 5 min. For curing, the binder samples were stored in a drying oven under defined conditions, namely always for a period of 48 h and at a temperature of 85 °C, protected against drying by PE film. After the curing process, the geopolymer test specimens were demolded and processed into suitable specimens by sawing and grinding. Compression test specimens of an edge length of (L × W × H) 40 mm × 40 mm × 40 mm, three-point bending fracture test specimens of an edge length of (L × W × H) 160 mm × 40 mm, and specimen plates for investigating thermal conductivity with the dimensions (L × W × H) 100 mm × 100 mm × 25 mm were produced (Figure 2). All specimens that came into contact with water during sawing and grinding were dried to constant weight in the drying cabinet before the measurement of mechanical properties and then stored in the desiccator until the measurement.

2.2. X-ray Fluorescence Analysis

X-ray fluorescence analyses (XRF) were performed to chemically characterize the different residual fractions. For this purpose, an XRF instrument of the Axios type from PANalytical was used, which is a wavelength-dispersive sequence spectrometer (WDXRF) operated with a rhodium anode. For quantitative analysis of the residues, the loss on ignition (LOI) was determined at 950 °C over a period of 2 h.

2.3. X-ray Diffraction Analysis

The XRD investigations were carried out on an X’Pert PRO X-ray diffractometer from Panalytical, whose cathode tube is operated with a copper anode. The generator settings 40 mA at 45 kV were selected. Powder-ground sample material was prepared and measured using the back loading method.

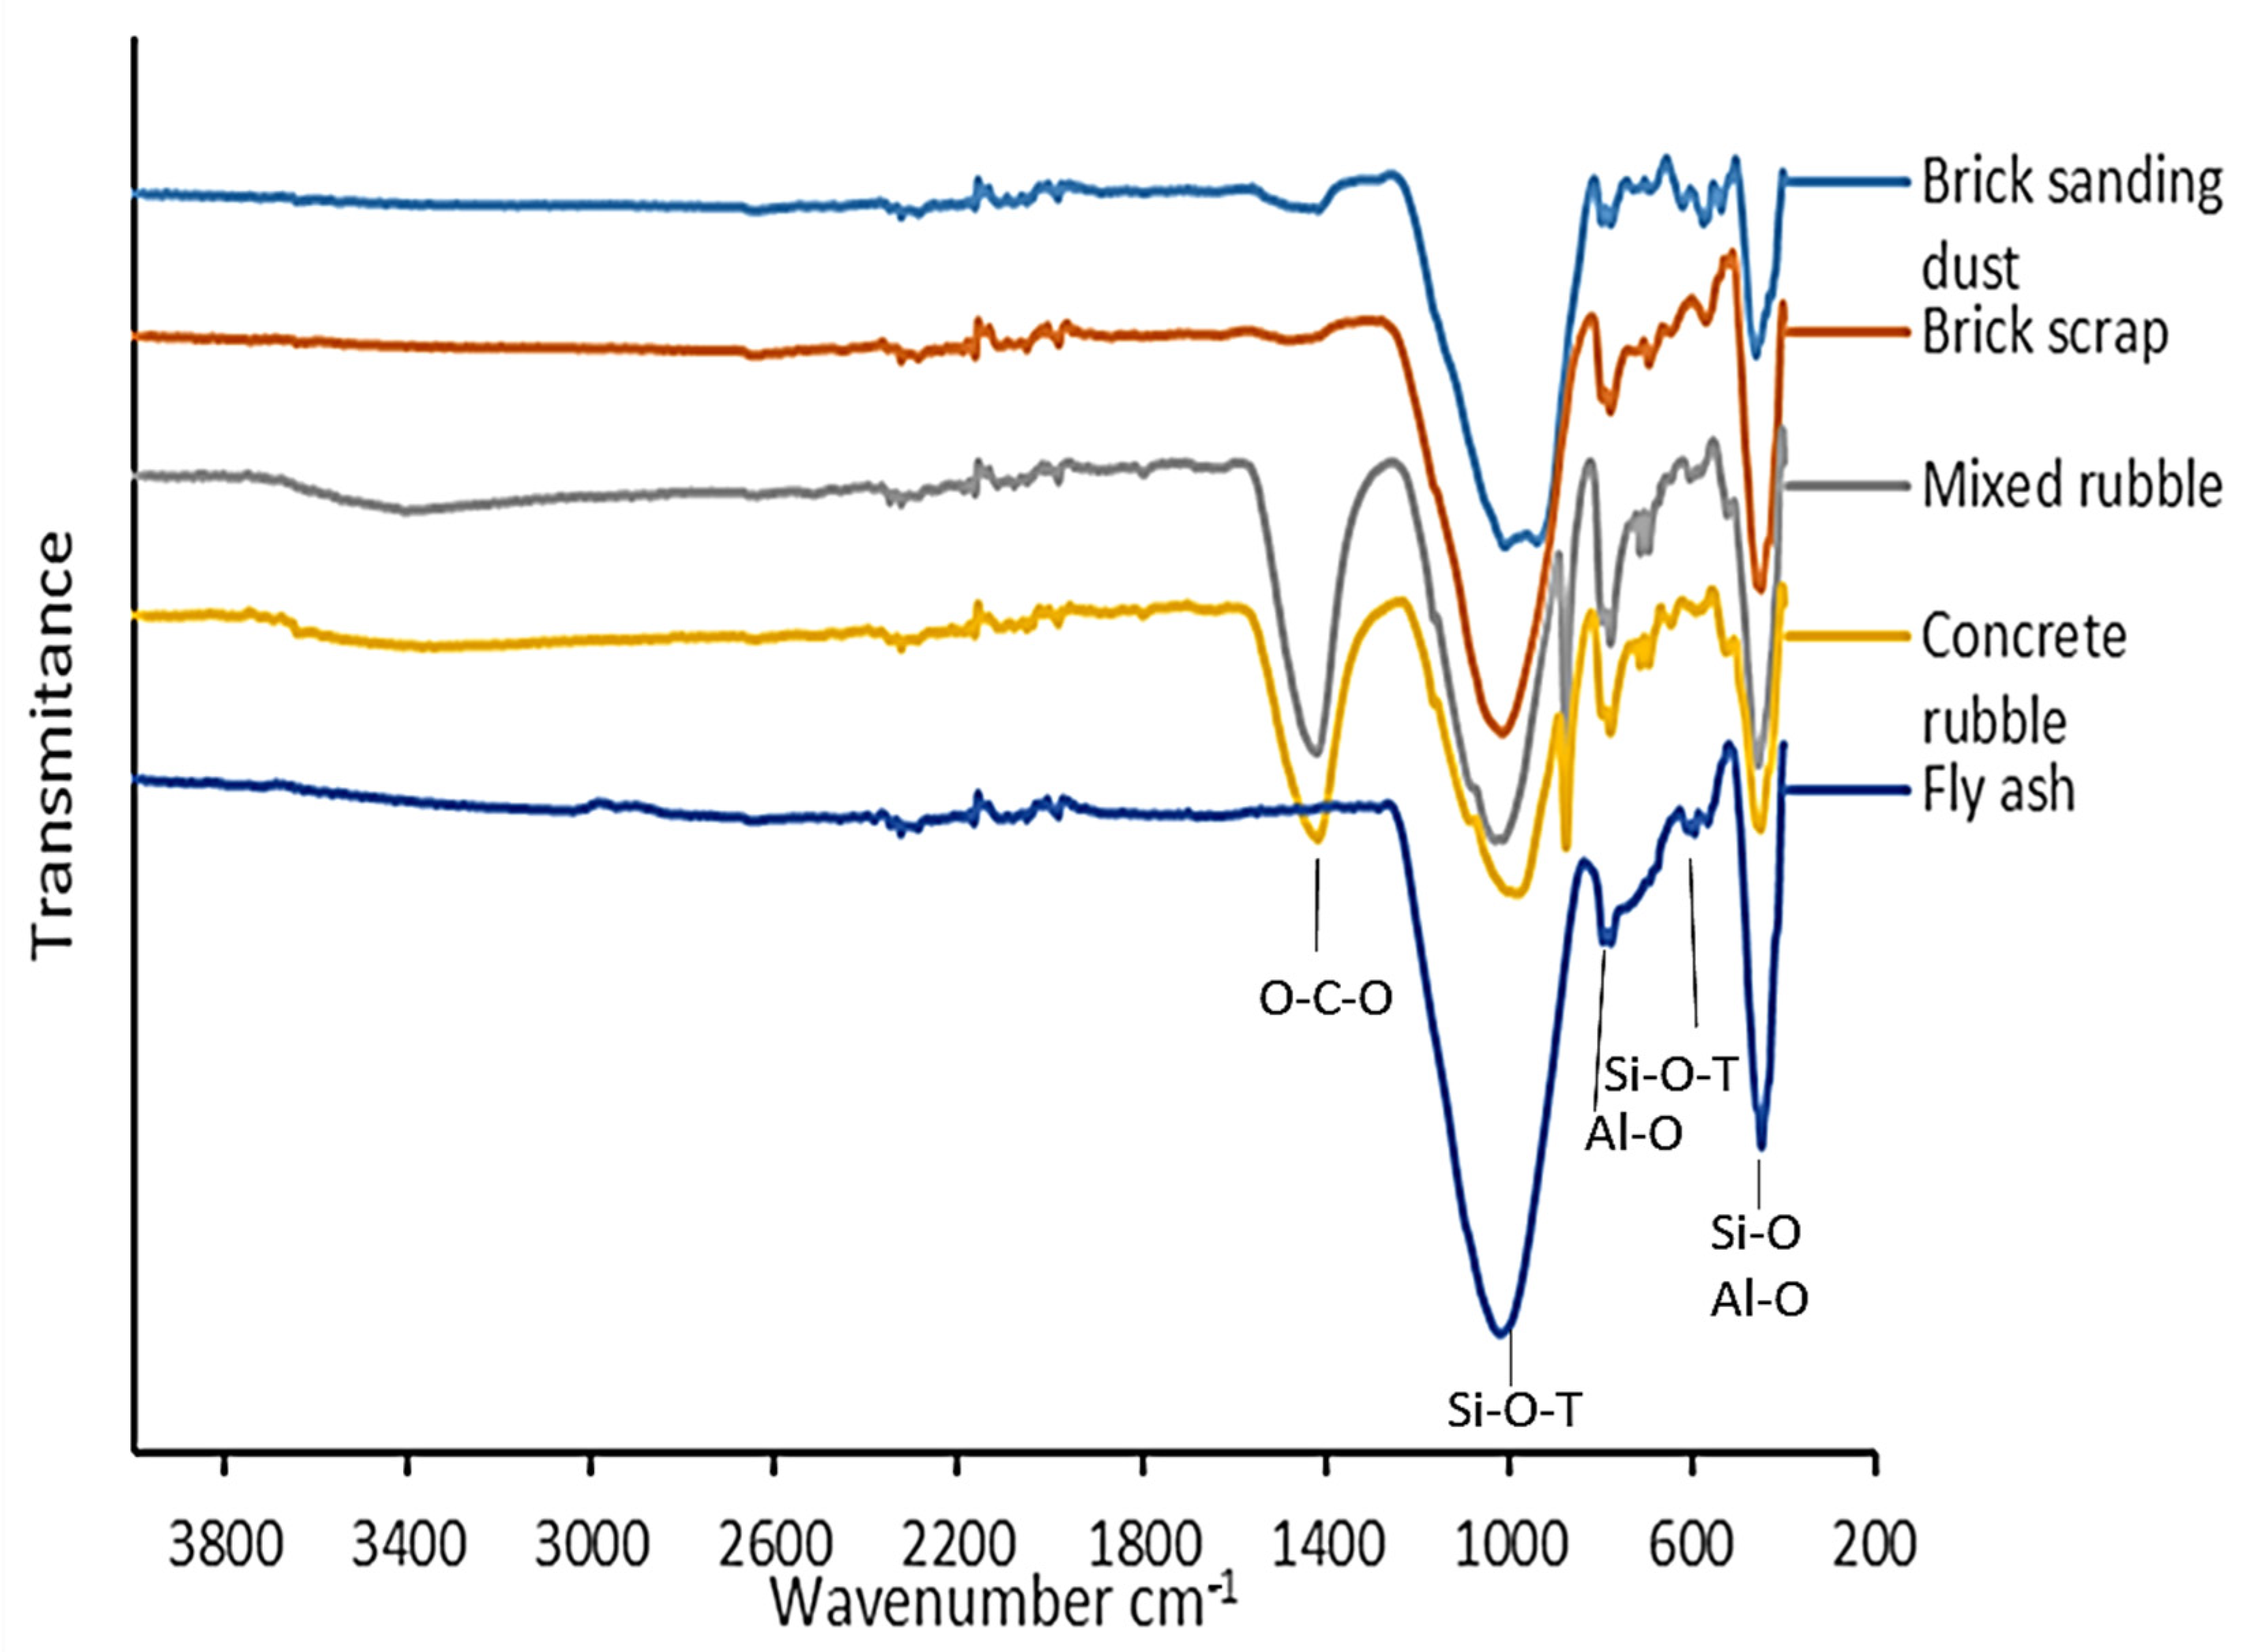
2.4. FTIR-Spectroscopy

In order to examine the structures of the produced geopolymers, Fourier-transform infrared spectroscopy (FTIR) was performed on powders using the ATR method. IR spectroscopy is a common investigation method used to visualize the structures of geopolymers [14]. The measurements were performed on a Bruker Tensor II with a KBr beam splitter in the spectral range of 5000–400 cm−1. The atmosphere was filtered out by automatic background measurements.

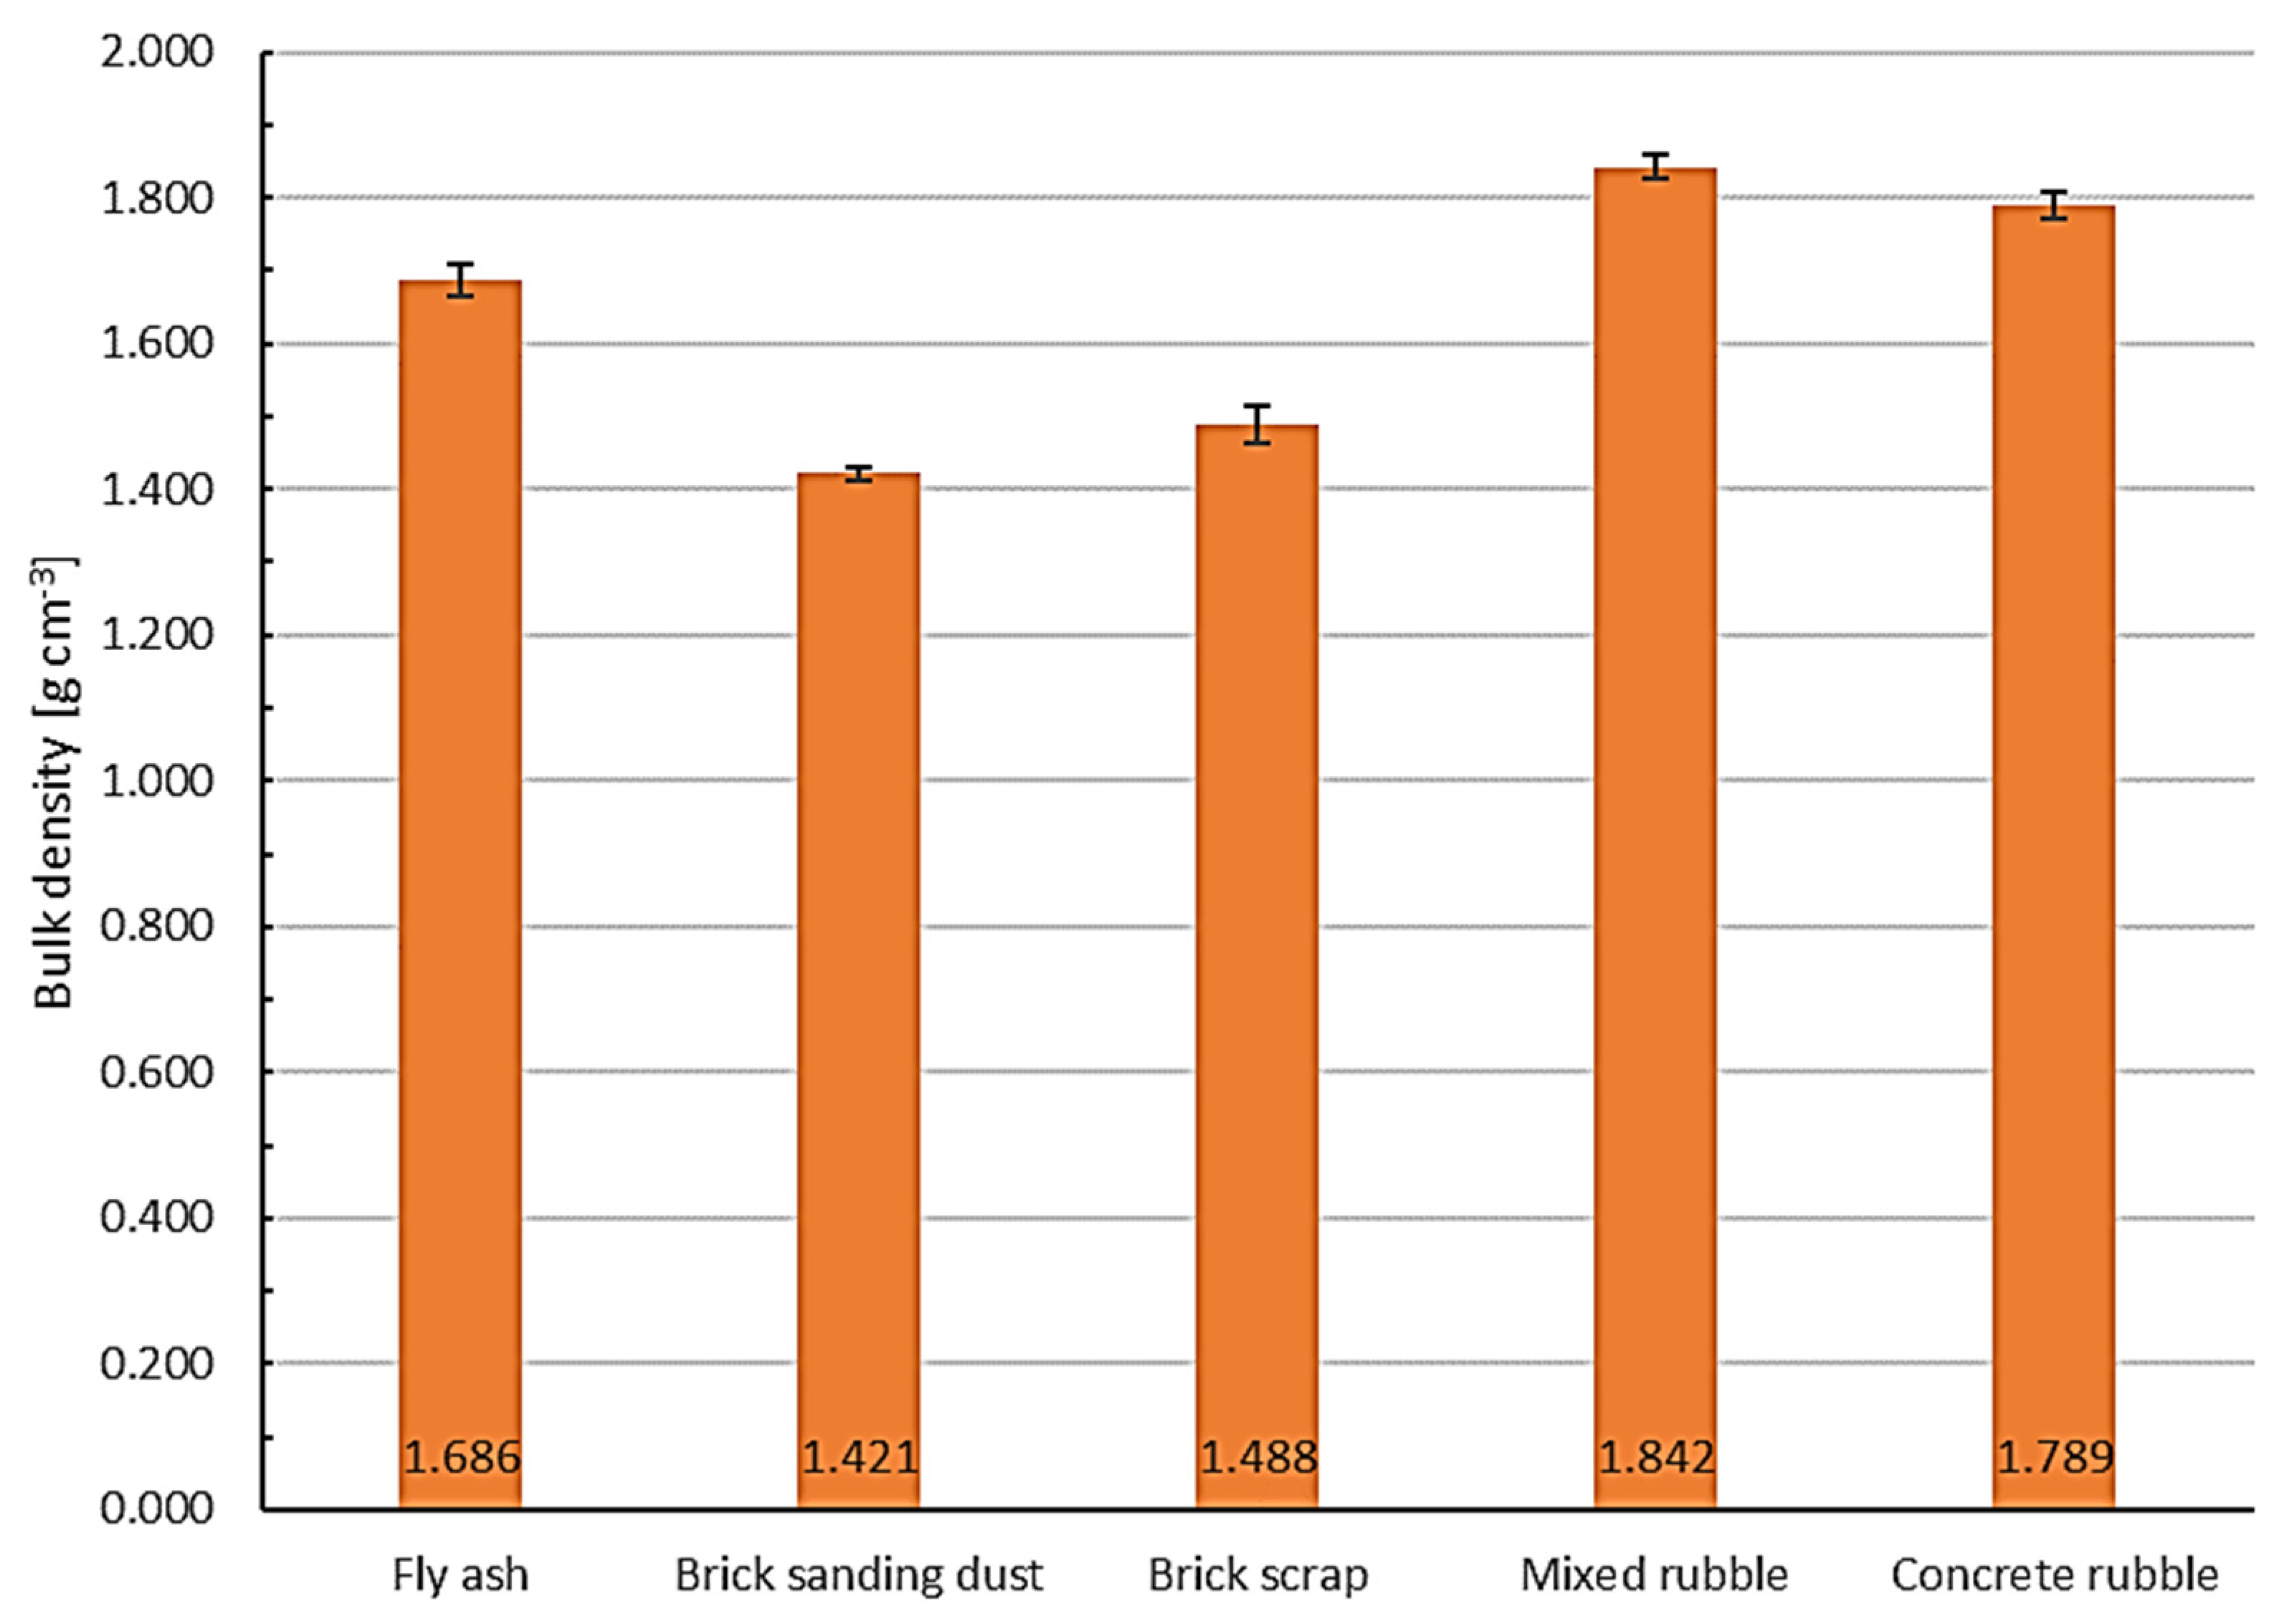
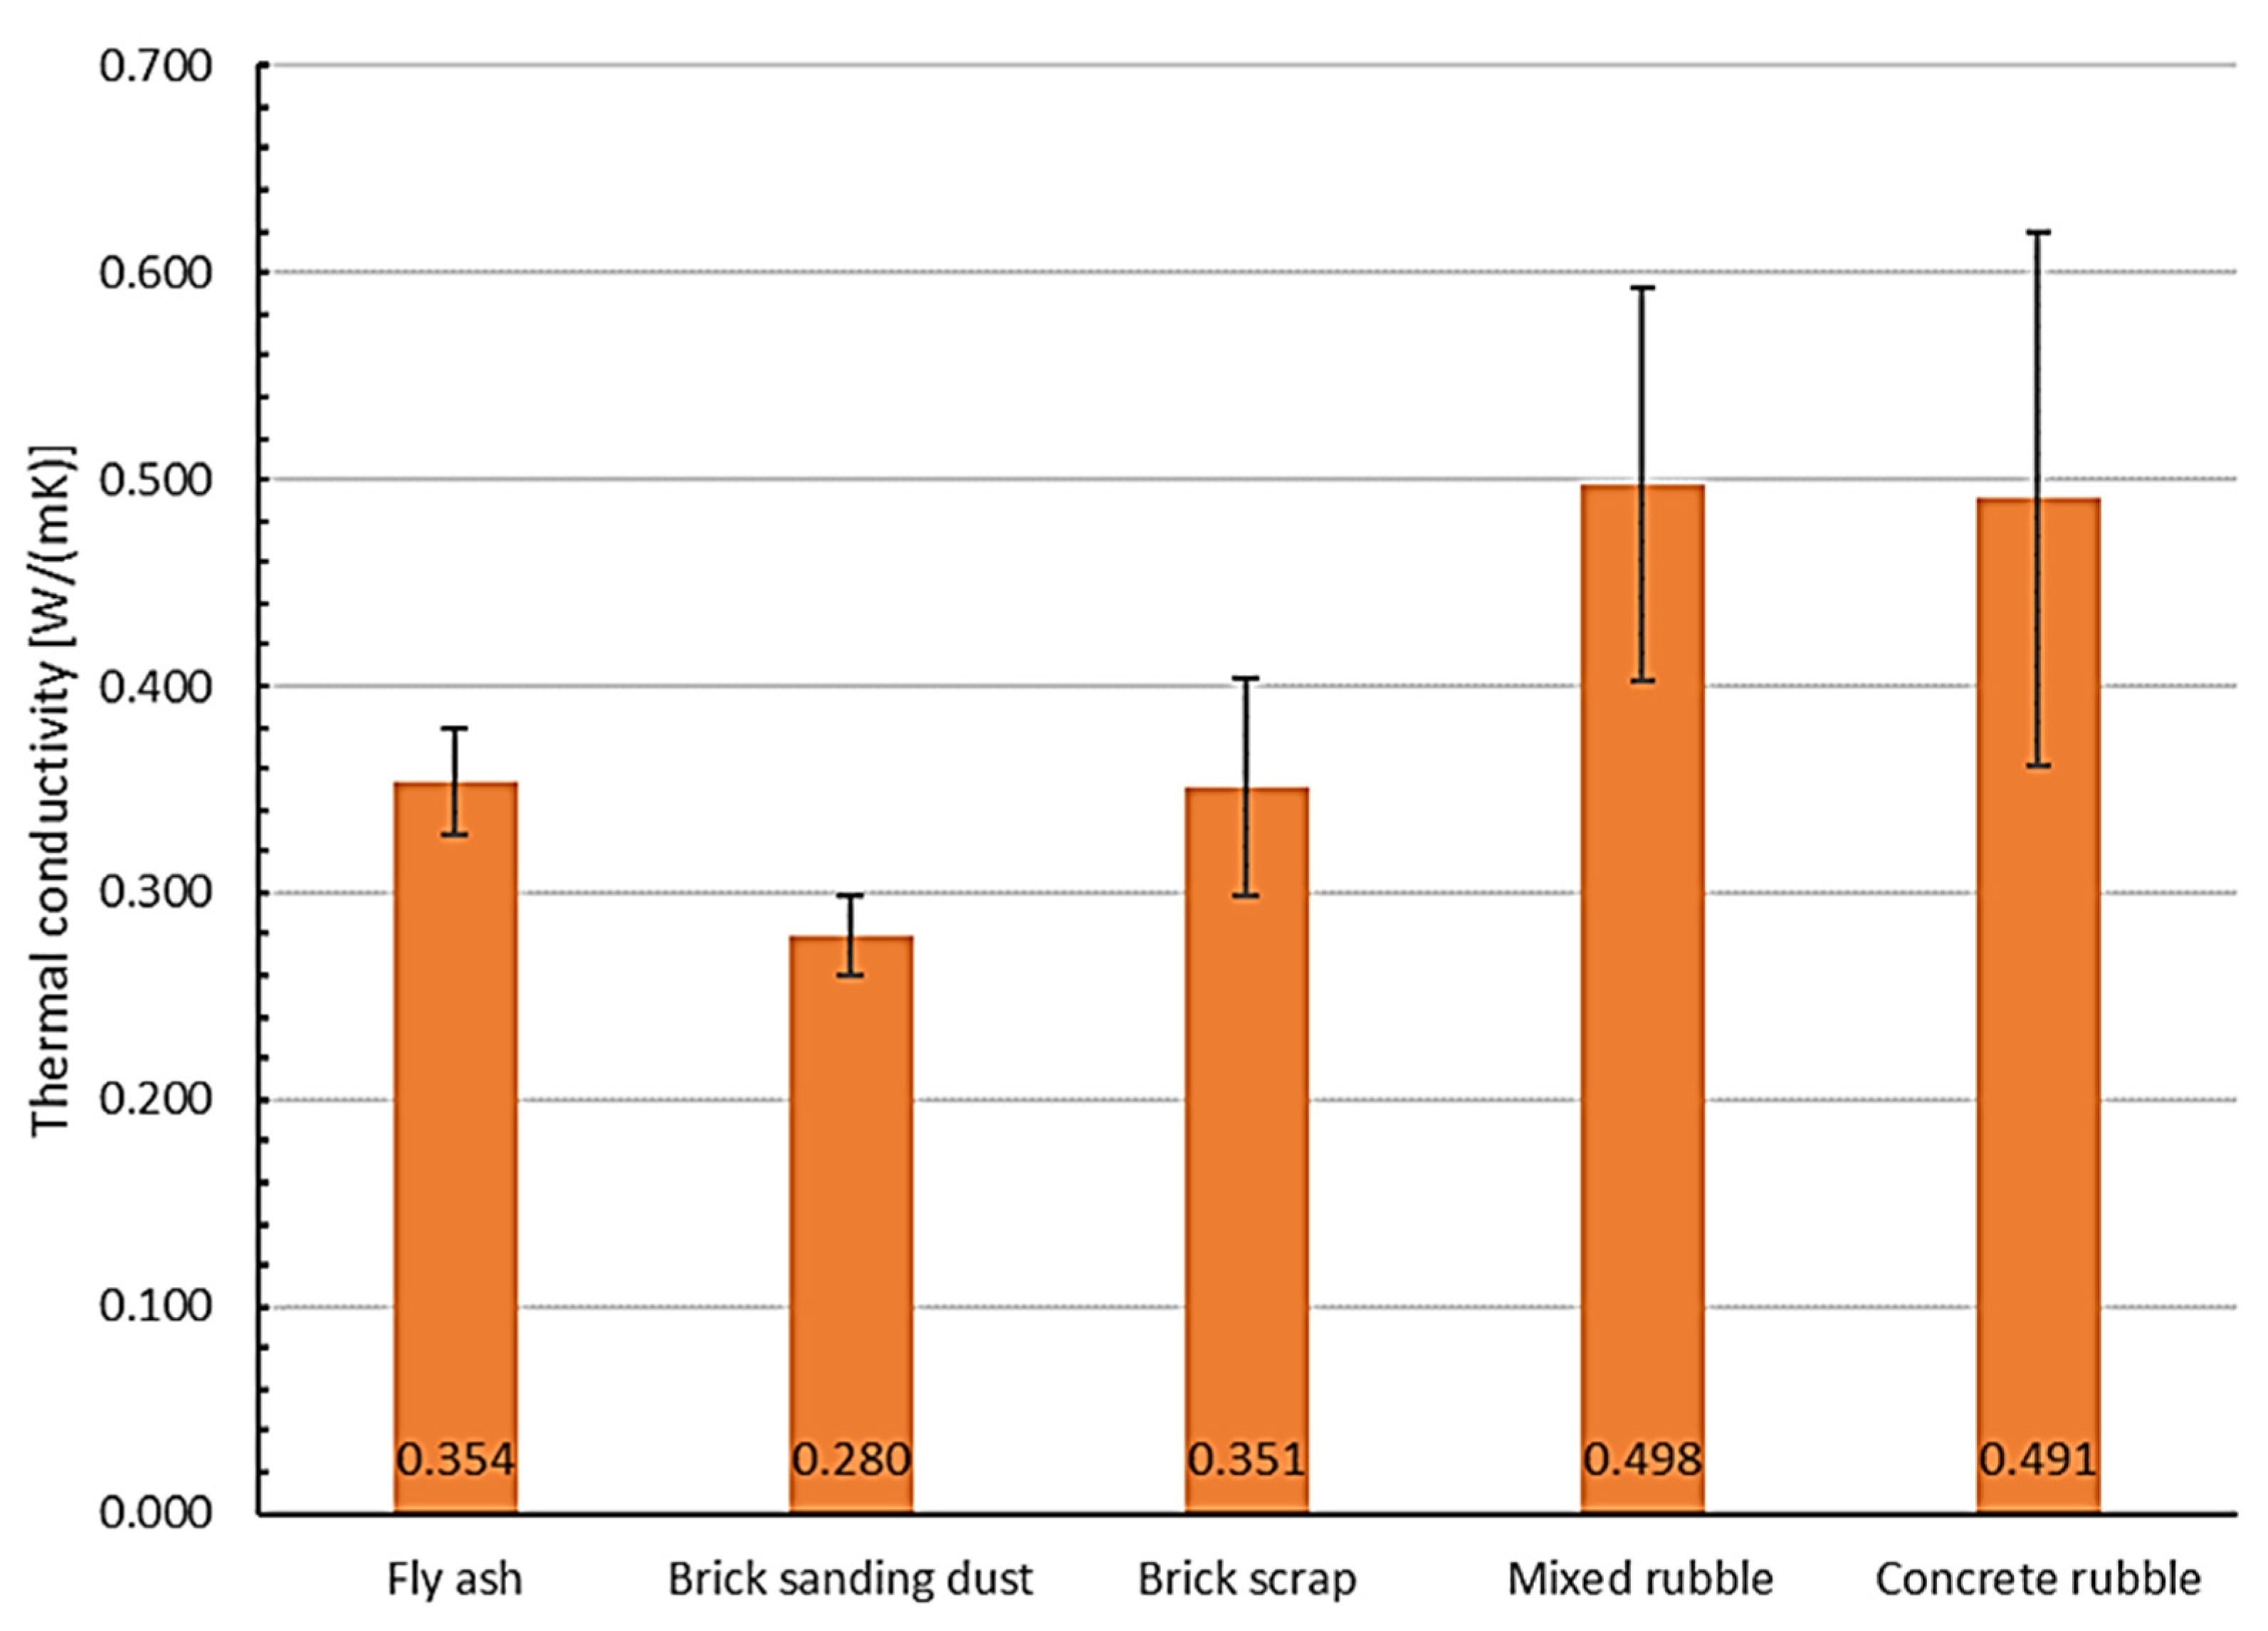
2.5. Determination of the Material Properties

The determination of the maximum compressive stresses σd was based on the standard DIN EN 196 Part 1. For the compression test, the pressure build-up on the test surface was carried out at a constant rate of 1.5 N (mm2 s)−1. The maximum compressive stress σd was calculated according to Equation (1) from the maximum applied force F at failure of the material and the cross-sectional area S of the test specimen. Fifteen test specimens of each material were tested to obtain a reliable average value.
σd = F/S
The determination of the maximum flexural strength or bending stress σf was based on the standart DIN EN 196 Part 1. The three-point bending test was performed at a constant pressure build-up of 0.5 kN s−1. The maximum flexural stress σf was calculated according to Equation (2) from the maximum applied force F, the support width L, the thickness b, and the width b of the specimens. For the determination of the mean flexural strengths, 6 specimens of each geopolymer grade were tested and the mean values and standard deviations were calculated.
σf = 3FL/(2bd^2)
For bulk density testing, the thermal conductivity test panels were first dried and cooled to room temperature. Then, the plates treated in this way were weighed and their external dimensions were determined. The calculation of the bulk density ρroh was performed according to Equation (3), using the mass m and the volume V of the test specimens.
ρroh = m/V
The thermal conductivities λ10,dr. were determined in accordance with the test standard DIN EN ISO 8302:1991 using the so-called plate method. The thermal conductivities were calculated as a function of the respective sample medium temperatures of the area A and the layer thickness d of the sample using Equation (4) below. In order to obtain a reliable average value, three specimens of each of the geopolymer grades were tested and the average values of thermal conductivity λ10,tr. were calculated.
λ = (Q · d)/(A · ΔT) = (UI · d)/(AΔT)

2.6. Scanning Electron Microscopy

In order to gain a deeper insight into the morphology of the geopolymers obtained, images were taken using scanning electron microscopy (SEM). The fracture surfaces of the geopolymers were always examined at 2000× magnification on a Zeiss EVO 25 LS. To obtain suitable images, the samples were sputtered with gold to remove excess electrons.

3. Results

3.1. X-ray Fluorescence Analysis

X-ray fluorescence (XRF) analysis was used to investigate the chemical composition of the residues. The results are shown in Table 1. The investigation showed that all the residual materials investigated contained between 52.4 and 63.4 wt.% SiO2. The Al2O3 content of brick sanding dust, brick scrap, and the fly ash ranged from 17.9 to 25.2 wt.%. In contrast, the Al2O3 contents in mixed and concrete rubble were only 5.3 and 3.1 wt.%, respectively. For the CaO content, the ratios were reversed. Here, the mixed and concrete rubble contained comparatively higher contents of 13.4 and 17.9 wt.%, respectively, while the brick sanding dust contained only 5.4 wt.%, the brick scrap only 8.6 wt.%, and the fly ash only 4.2 wt.% CaO. All residual materials contained only relatively low levels of trace constituents.

3.2. X-ray Diffraction Analysis

The results of the mineralogical analysis given in Figure 2 correlate with the results of the XRF analysis. The mineralogical analysis (XRD) showed that the brick sanding dust, Figure 3a, contained the minerals quartzite, hematite, gehlenite, albite, and microcline. In the brick scrap (Figure 3b), as a result of the same place of origin, the same minerals were contained, namely quartzite, hematite, gehlenite, albite, and microcline. Muscovite and sodium alumina silicates were also detected. The identified mineralogical phases are also presented as typical phases for fired clay in the common literature [15]. The mixed rubble (Figure 3c) contained quartzite, calcite, dolomite, and sanidine. Other mineralogical phases that would be expected were not detectable, due to concentrations that are too low. The detected phases clearly indicated a mixture of many different materials, so phases could be detected that are assigned to clay minerals and silicate materials in the literature [15], but also classical phases from cements or concretes such as dolomite and calcite [16]. The concrete rubble (Figure 3d) was mineralogically very different from the composition of the mixed rubble. The concrete rubble contained the mineral phases quartzite, hematite, gehlenite, albite, and microcline and thus consisted of typical cement phases and typical silicate phases from the fillers gravel and sand [16]. Analysis of the fly ash (Figure 3e) showed that it contained the minerals quartzite, hematite, gehlenite, albite, microcline, and an amorphous phase, which also correlates well with values from the literature [8].

3.3. FTIR-Spectroscopy

In order to demonstrate alkaline activation or geopolymerization, the IR spectra of the starting materials brick sanding dust, brick scrap, mixed rubble, concrete rubble, and fly ash (Figure 4) were first obtained and compared with the IR spectra of the geopolymer batches produced from them (Figure 5). The IR spectra of the starting materials showed transmission bands at 1016, 776, and 447 cm−1, and additionally mixed rubble and concrete rubble showed a transmission band at 3120 cm−1. The 1016 and 447 cm−1 peaks are the main bands of the silicon-oxygen and aluminum-oxygen bonds, respectively, as has also been similarly shown by Bohra [17]. In addition, except for the fly ash, all spectra of the starting materials had an additional main band at 1415 cm−1, which can be assigned to the asymmetric vibrational bands of the O-C-O bonds of carbonates [18,19]. The IR spectra of the investigated geopolymer batches are shown in Figure 5. The main transmission bands were located at 3380, 1429, 977, and 449 cm−1. The broad transmission band at about 3400 cm−1 is attributed to the O-H groups of the silanols and the hydrogen bonds between attached water molecules and the silanols. The band at 1644 cm−1 is characteristic for water molecules bound to the inorganic basic structure. A particularly important band with respect to geopolymerization is the asymmetric vibrational band of the Si-O-Si and Si-O-Al compounds (abbreviated Si-O-T, where T can stand for Si and Al), which occurred in the starting materials at 1016 cm−1. This distinct band was shifted to lower wavenumbers of 977 cm−1 in the IR spectra of the geopolymer products. It should be noted that the alkali-activated fly ash had the highest wavenumber in this peak, which, according to the literature, may indicate an increased degree of polymerization [20]. The bands of O-C-O bonds also appeared in the geopolymer products, except for the fly ash composition FA_100, at 1415 cm−1 and were more pronounced than in the starting materials.

3.4. Determination of the Material Properties

Figure 6 shows the results of the compressive strength tests. This shows that the geopolymers produced with fly ash (100 wt.%) achieved the highest compressive strengths with 96.6 MPa. The worst compressive strengths with 14.9 MPa were shown by the geopolymers produced from brick sanding dust (100 wt.%). When the brick sanding dust was exchanged for ground brick scrap (100 wt.%), geopolymer compressive strengths of 32.31 MPa resulted. The geopolymers prepared from mixed rubble (100 wt.%) and concrete rubble (100 wt.%) exhibited compressive strengths of 18.7 MPa and 19.3 MPa, respectively.
The flexural strengths of the alkali-activated materials investigated are shown graphically in Figure 7. From the investigation, it can be seen that the flexural strengths of all geopolymer grades were in the same order of magnitude. The geopolymers prepared using fly ash (100 wt.%) showed the lowest values of 2.5 MPa; the geopolymers prepared from brick sanding dust (100 wt.%) showed the highest flexural strengths of 3.2 MPa.
Figure 8 shows the results of the bulk density determination and Figure 9 shows the results of the determination of the thermal conductivities λ10,dr., each with their associated standard deviations. The investigations showed, for the geopolymer stones from brick sanding dust and from finely ground brick scrap, low bulk densities of 1.4 g cm−3 and 1.5 g cm−3, respectively, and thus correlatively the lowest thermal conductivities λ10,dr. of this test series of 0.28 W mK−1 and 0.35 W mK−1, respectively. The alkali-activated materials from mixed and concrete rubble exhibited higher densities of 1.8 g cm−3 and, correlatively, significantly higher thermal conductivities λ10,dr. of 0.49 W mK−1. The geopolymer bricks from fly ash had a mean bulk density of 1.7 g cm−3 and corresponding mean thermal conductivity λ10,dr. of 0.35 W mK−1.

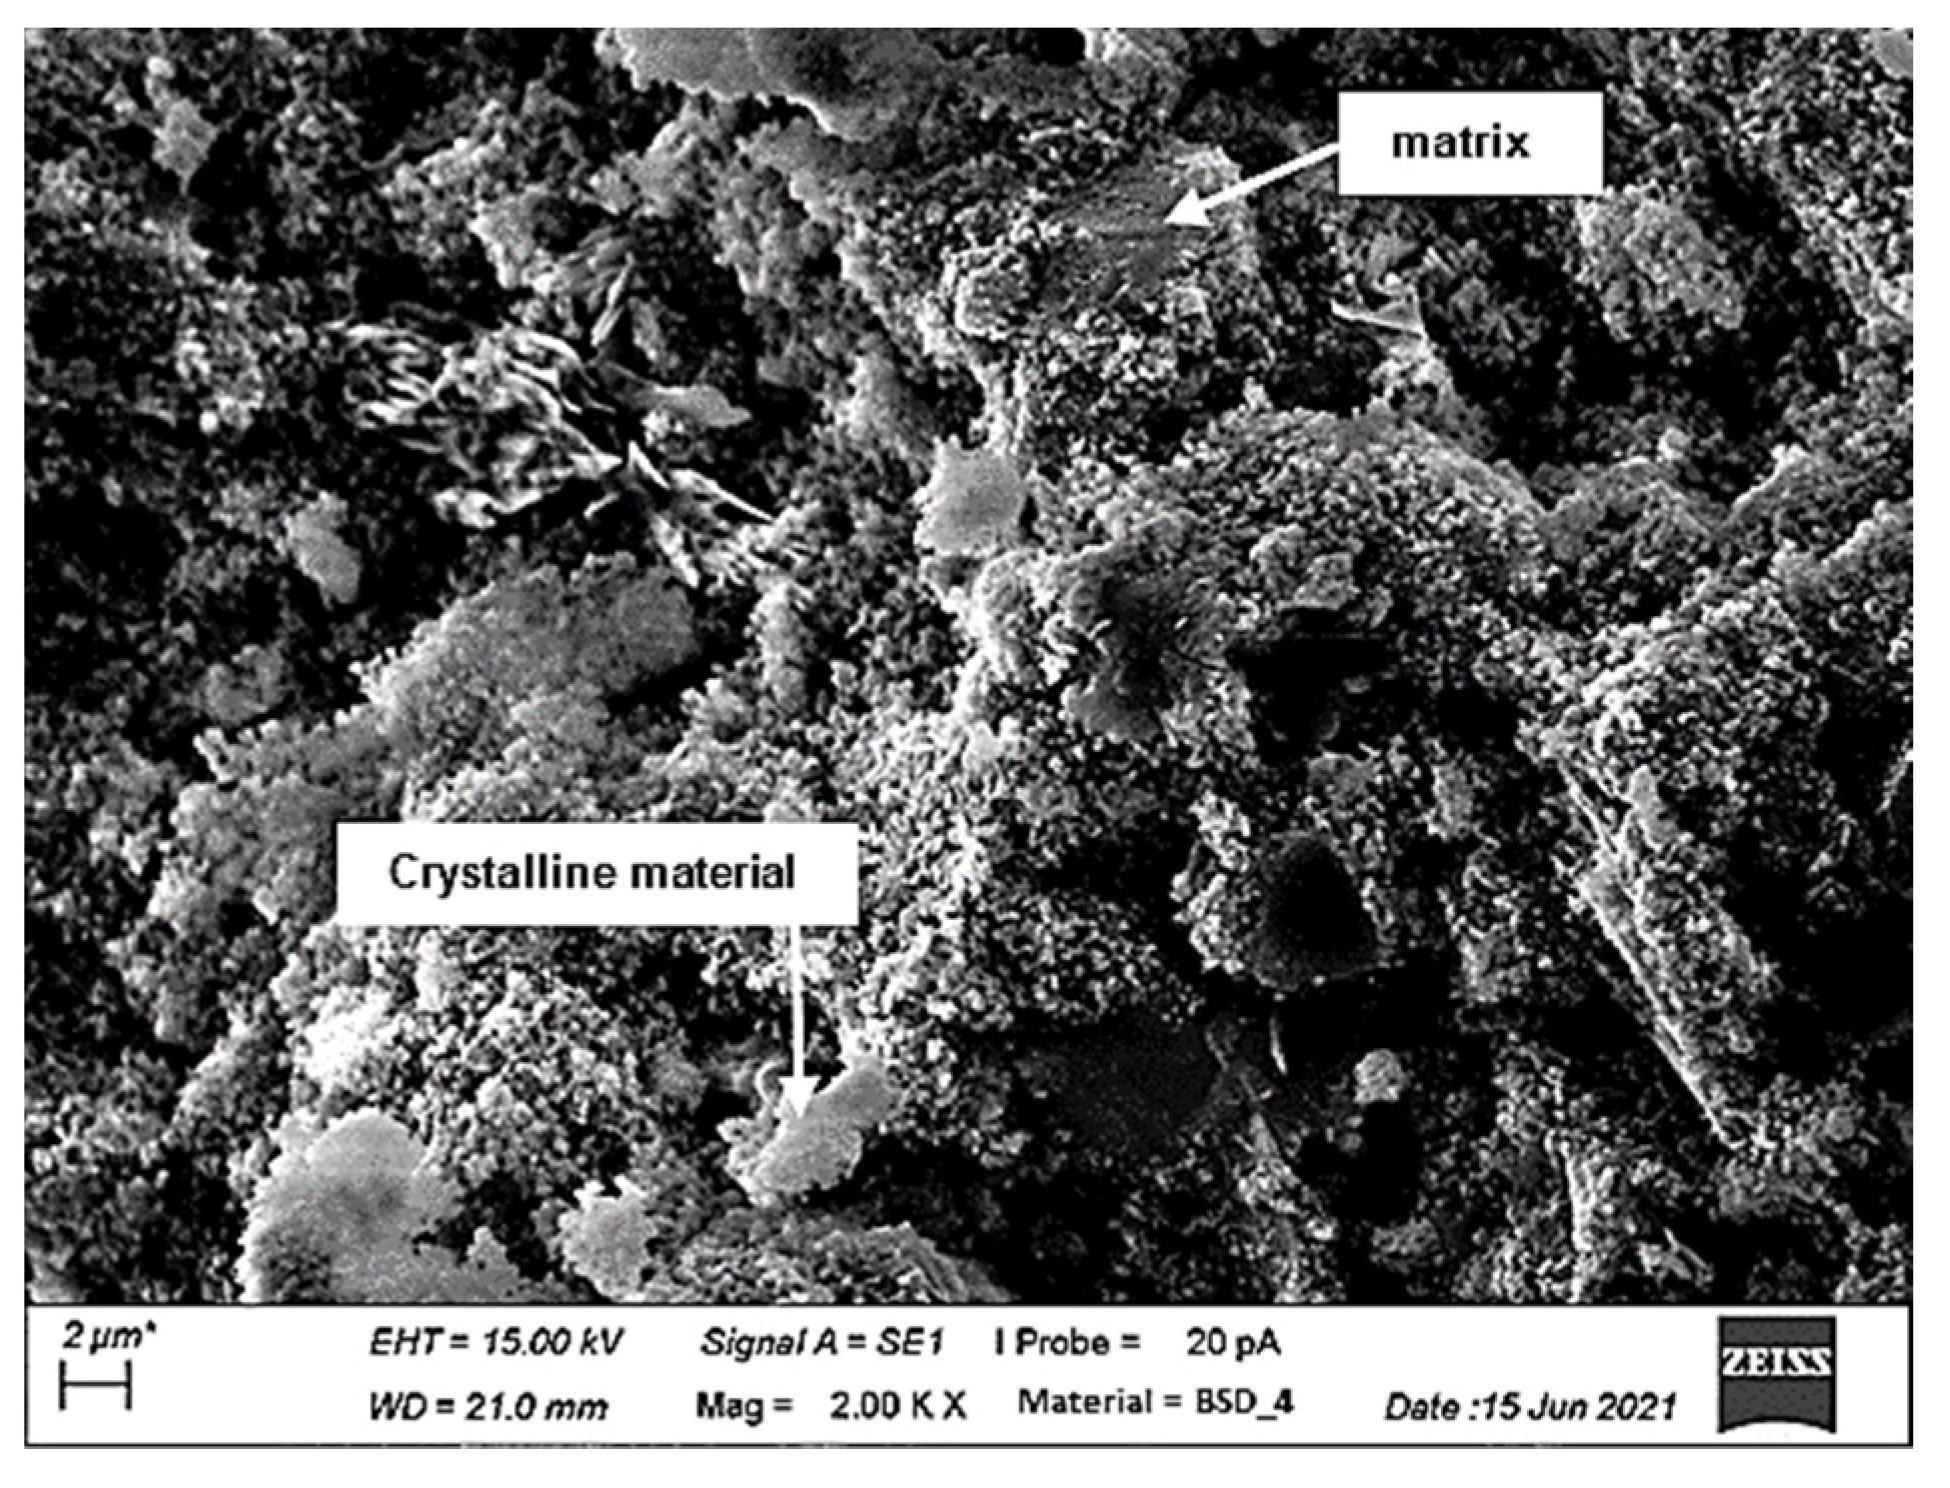
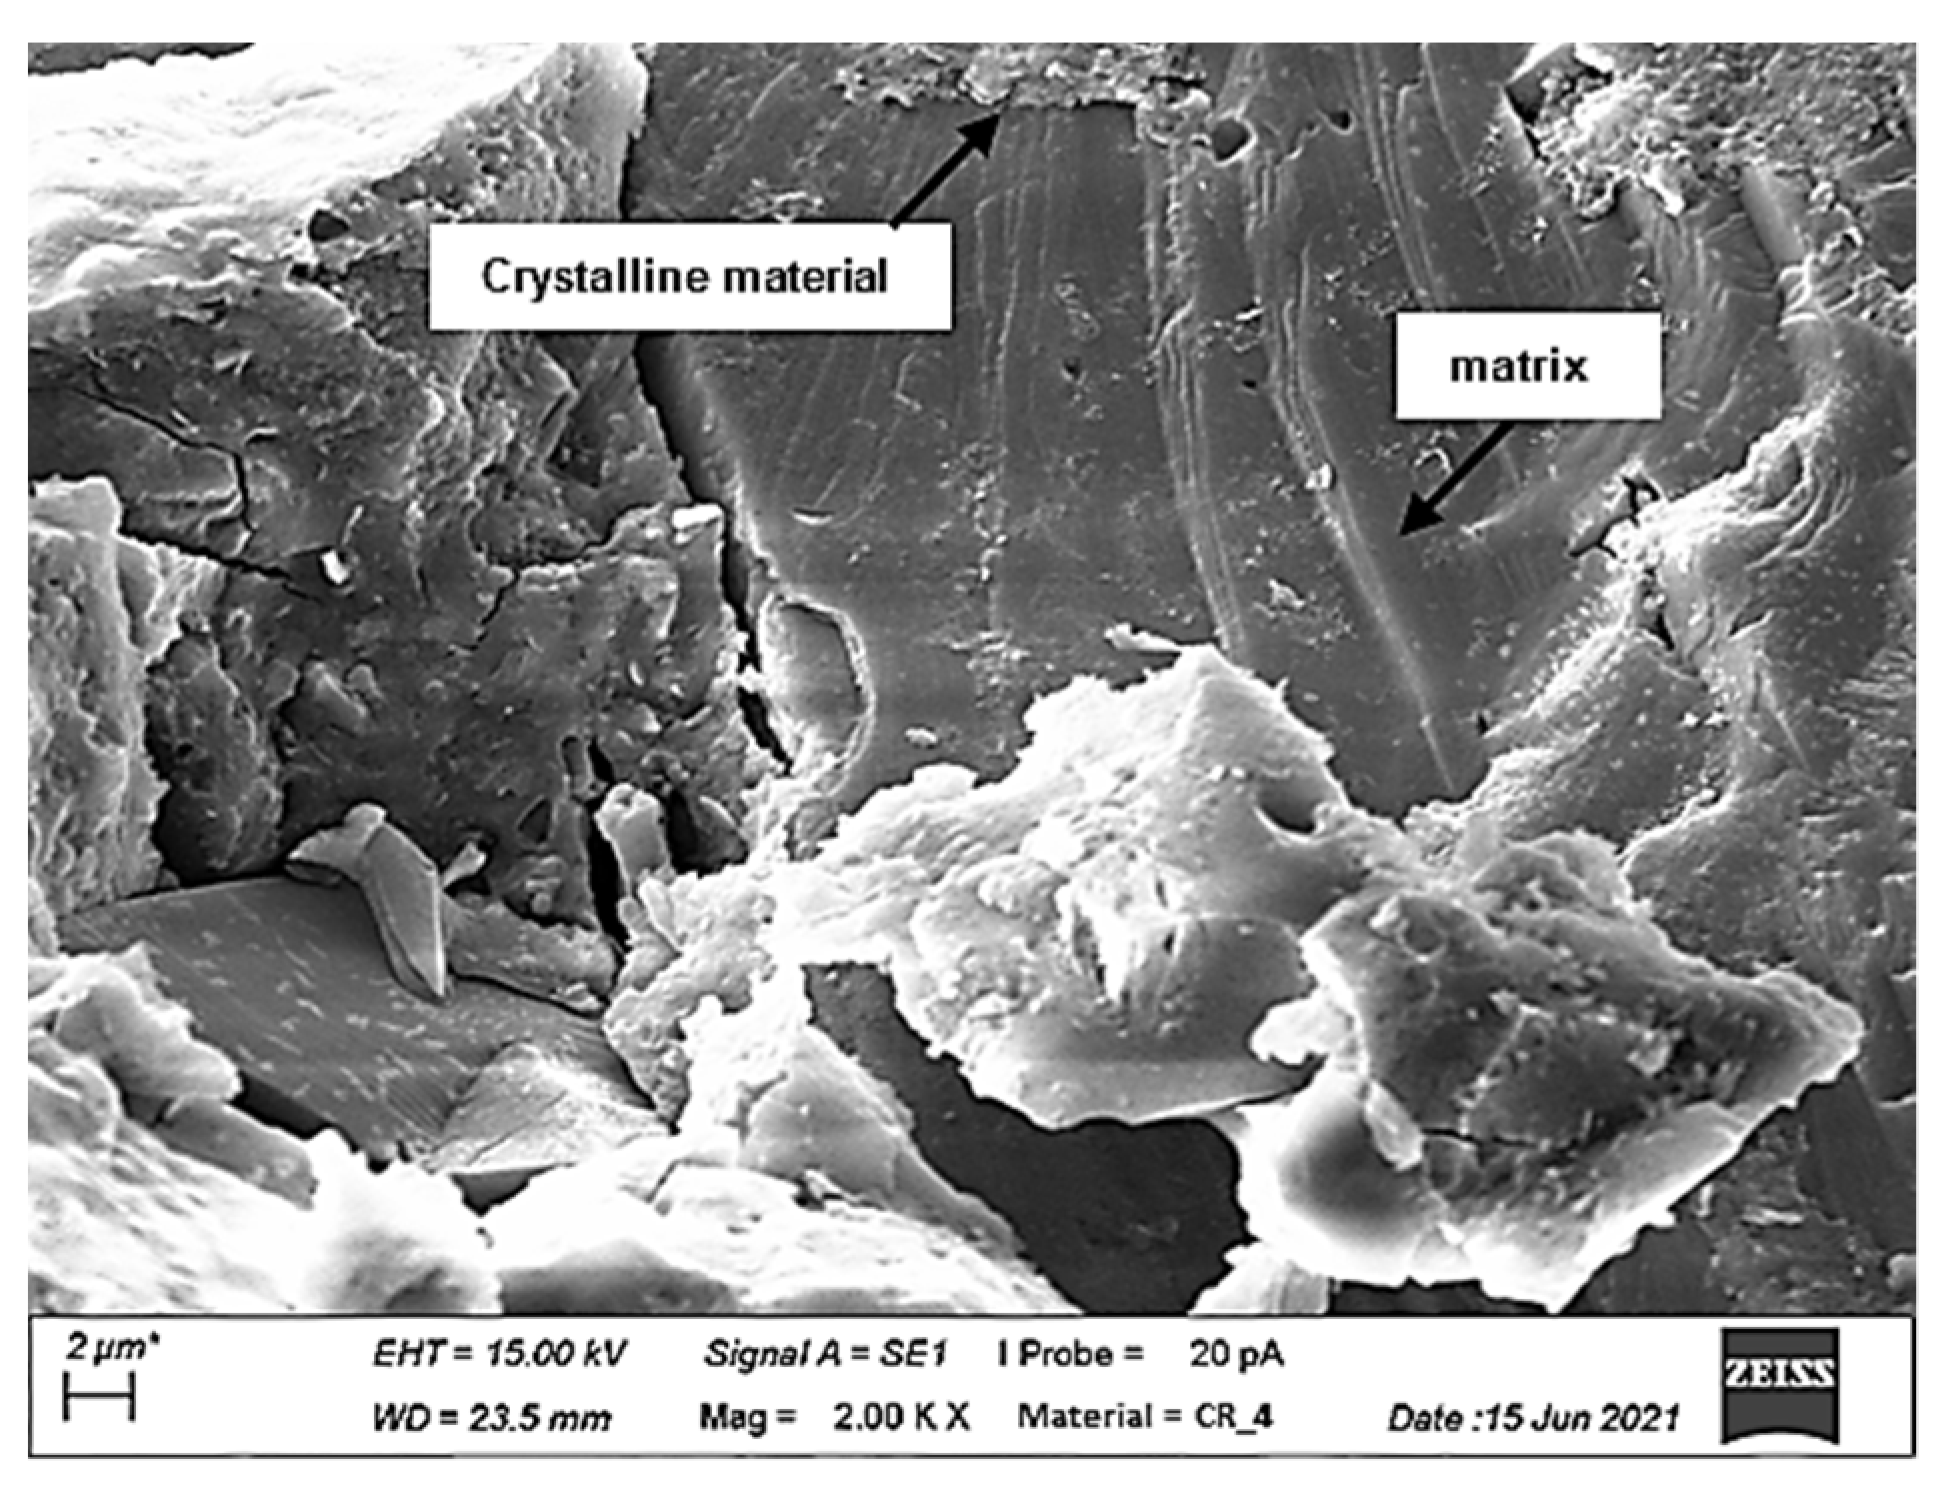
3.5. Scanning Electron Microscopy

Figure 10, Figure 11, Figure 12, Figure 13 and Figure 14 show the SEM images of the fracture surfaces of the investigated geopolymer samples. In Figure 14, one can see a fly ash geopolymer. The fly ash particles, which had not yet fully reacted, were surrounded by matrix material and some crystalline phase can be seen. A continuous matrix and crystalline material could also be detected coexisting in all construction industry residues, brick sanding dust (Figure 10), brick scrap (Figure 11), mixed rubble (Figure 12), and concrete rubble (Figure 13). The fly ash had the highest matrix ratio, followed by the concrete rubble and the mixed rubble geopolymers. The surface of the brick sanding dust and the brick scrap appeared most fractal in comparison.

4. Discussion

By analyzing the chemical and mineralogical composition of the starting materials brick sanding dust, brick scrap, mixed building rubble, concrete rubble, and fly ash, it was shown that all these residual materials are, in principle, suitable for alkaline activation. The starting materials had sufficient SiO2 as well as Al2O3 and CaO. In mineralogical terms, fly ash showed the largest amorphous fraction of all the starting materials investigated. This can favor improved setting behavior, as amorphous structures can be dissolved more quickly by the alkaline activator solution. Fly ash was chosen as a comparative material in these investigations, as the behavior of fly ash during alkaline activation has already been studied in detail in the literature [17]. Although fly ash corresponds to a Ca-poor precursor material, the mechanical properties of Ca-rich alkaline-activated materials can also be compared well.
By means of IR spectrometry, it was determined that new bands form at the wavenumbers 3400 cm−1 and 1644 cm−1, which can be assigned to the O-H groups of the silanols characteristic of geopolymers, alkaline-activated material, and to the water deposited there. These bands, which were not present in the starting materials, indicate newly formed silanol groups and water molecules bound into the geopolymer and are thus a first indicator that geopolymerization or alkaline activation has taken place [21,22]. Furthermore, a peak shift in the Si-O-T bonds was clearly demonstrated in the comparison between the starting materials and the resulting reaction products. This peak shift is an unambiguous characteristic for a geopolymerization that has taken place [19,23]. It is known from the literature that this peak shift results from the structural change in the material due to the reaction. The large shift toward lower wavenumbers can be explained by the replacement of SiO4 tetrahedra by AlO4 tetrahedra. This changes the chemical environment of the Si-O bonds [13,23]. If the shift is more intense, it can be assumed that more AlO4 tetrahedra are incorporated into the SiO4 backbone, as has been observed analogously in studies of zeolites [24,25,26]. This behavior is explained by the force constant, which is higher in Si-O bonds than in Al-O bonds. A lower force constant leads accordingly to lower wavenumbers [27]. From these two clear indicators, it can be concluded that geopolymerization has occurred. It was also found that the alkali-activated fly ash had the highest wavenumbers in this peak. Thus, from previous reasoning and in agreement with the literature, it can be assumed that the fly ash geopolymer has the highest degree of Si crosslinking [20]. Comparison of the IR spectra showed that for all products except fly ash, the O-C-O band at 1415 cm−1 increased compared to the starting materials. This indicates that new carbonates were formed as a result of geopolymerization. In agreement with the literature, this can be attributed, on the one hand, to a sodium carbonate-forming reaction of the excess sodium introduced by the activator solution with CO2 from the ambient atmosphere. As this band does not occur in the FA_100 fly ash geopolymer, it can be assumed that in this composition, the sodium is fully involved in the geopolymerization reaction [25,28]. On the other hand, these carbonates in Ca-rich alkali-activated materials can also be attributed to the reaction of free Ca cations with the CO2 of the surrounding atmosphere [29].
From this, it can be concluded that fly ash, as already suggested by the mineralogical investigations, possibly exhibits a better solidification behavior than the other residual materials investigated. This assumption is confirmed by the fact that the fly ash geopolymer FA_100 developed the highest compressive strengths at 97 MPa. This fits in as chemical stability is usually accompanied by mechanical stability [30,31]. Moreover, the increased compressive strengths compared to the other species studied are also consistent with the stronger three-dimensional crosslinking of the Si-O-Si bands observed by IR-spectroscopy.
It was already expected from the literature that fly ash would show good setting behavior and, therefore, this material was used as a comparative material in this study. However, all other residual materials also showed suitable strengths due to alkaline activation. In particular, the geopolymer stones from ground brick scrap stood out in terms of its mechanical properties compared to the other four construction residues. The geopolymers from ground brick scrap not only exhibited the highest compressive strengths of 32 MPa, but also the second lowest bulk densities of 1.5 g cm−3 and thermal conductivities of 0.351 W mK−1. Looking at the FTIR results, it can be observed that brick scrap has the best cross-linked Si-O-Si bands after fly ash, which results in the increased compressive strengths compared to the other residual materials. SEM results showed that brick scrap has the most fractal surface of all materials. This also indicates an increased porosity compared to the other materials, which is in good agreement with the low thermal conductivities and low density of the brick scrap-based material. This correspondence between thermal conductivity and density with the rough appearance in the SEM images can also be extrapolated to the brick sanding dust, which showed similarly low values in these areas. However, geopolymers from brick sanding dust also achieved the lowest compressive strength values with 15 MPa. In terms of bulk density and thermal conductivity, mixed rubble and concrete rubble had the worst properties for construction materials. The flexural strength was at the same level of about 3 MPa for all geopolymer samples from construction waste. Thus, flexural strength is the only mechanical property tested in this work where all geopolymers from construction waste achieved better properties than the comparative material from fly ash.
SEM images showed that the matrix phases were present in all activated materials. This is further evidence that geopolymerization or alkaline activation occurred as previously suspected. It is also evident from the images that the fly ash was able to form the most geopolymer matrix, which is consistent with the compressive strengths and the results of the IR studies. However, when comparing the SEM images, it is surprising that the brick rubble formed better strengths than the mixed rubble and concrete rubble fractions, as its fracture surface appears much more fractured than that of the rubble fractions. In fact, it can be assumed that more reactive material is present in the rubble fractions, which can be converted by the alkaline activation. This results in a more uniform and continuous matrix than is the case with the brick fractions. However, the nonreactive crystalline phases of the brick fractions, which make the fracture surfaces appear fractal, can lead to particle strengthening, which could explain the increased strengths compared to the rubble fractions.

5. Conclusions

The results presented here showed that it is possible to produce new building materials based on the alkaline activation process from recycled construction wastes. Due to various pretreatments and different chemical compositions of the construction waste used, the material properties of the alkaline-activated material differ considerably. For example, the use of fly ash enables the production of high-strength geopolymer bricks. This effect can be explained both by the fact that fly ashes, depending on their origin, have comparatively more activated silicate and aluminate groups, which are easily broken down by the activation solution used and are available as reaction partners for geopolymerization. It can also be explained by the fact that a more strongly three-dimensionally crosslinked polymer is formed. With regard to the bulk density of the geopolymer and the associated thermal conductivities λ10,dr., the geopolymers from brick sanding dust and brick scrap exhibited significantly lower and thus better values than the fly ash geopolymer in terms of thermal insulation properties. This effect can be attributed to the higher microporosity of the brick materials. Overall, the production of intact alkali-activated materials from all mineral construction residues used here was successful, and alkaline activation could be detected by IR spectroscopy. This even applies to the residual materials from mixed and concrete rubble, which may have less optimally accessible silicate and aluminate groups. Based on the present study, the main material parameters of the investigated alkali-activated construction and demolition residues are known. In further work, mixtures of these residual materials can be prepared and geopolymer stones with tailored properties can be produced from them. The presented material recycling of processed construction residues to novel substitute building materials offers the possibility to close open material cycles, to save raw material resources and valuable landfill volume, as well as unnecessary CO2 emissions. There is a reasonable hope that used geopolymer bricks can be recycled at the end of their service life after crushing and grinding for the production of new geopolymer bricks, as was recently demonstrated for the first time for fly ash geopolymers [32].

Author Contributions

Conceptualization, F.K.; methodology, F.K.; software, F.K. and J.A.; validation, F.K., W.K., and U.T.; formal analysis, F.K., W.K., and U.T.; investigation, F.K. and J.A.; writing—original draft preparation, F.K.; writing—review and editing, F.K.; visualization, F.K.; supervision, W.K. and U.T. All authors have read and agreed to the published version of the manuscript.

Funding

This research was funded by the European Union through the LIFE Program 2014–2020 for Environment and Climate Action under project number LIFE18 CCM/ES/001114.

Institutional Review Board Statement

Not applicable.

Informed Consent Statement

Not applicable.

Data Availability Statement

The data are contained within the article.

Conflicts of Interest

The authors declare no conflict of interest.

References

  1. Statistisches Bundesamt. Bautätigkeit—Fachserie 5 Reihe 1; Statistisches Bundesamt: Wiesbaden, Germany, 2019. [Google Scholar]
  2. Statistisches Bundesamt. Abfallbilanz (Abfallaufkommen/-Verbleib, Abfallintensität, Abfallaufkommen Nach Wirtschaftszweigen); Statistisches Bundesamt: Wiesbaden, Germany, 2018. [Google Scholar]
  3. Fehn, T.; Teipel, U. Werkstoffliche Aufbereitung von Wärmedämmverbundsystemen. Chem. Ing. Tech. 2020, 92, 431–440. [Google Scholar] [CrossRef] [Green Version]
  4. Fehn, T.; Kugler, F.; Tübke, B.; Schweppe, R.; Mebert, P.; Krcmar, W.; Teipel, U. Charakterisierung und Störstoffanalyse von rückgewonnenen Stoffströmen aus Wärmedämmverbundsystemen. Chem. Ing. Tech. 2021, 93, 771–780. [Google Scholar] [CrossRef]
  5. Provis, J.L. Alkali-activated materials. Cem. Concr. Res. 2018, 114, 40–48. [Google Scholar] [CrossRef]
  6. Turner, L.K.; Collins, F.G. Carbon dioxide equivalent (CO2-e) emissions: A comparison between geopolymer and OPC cement concrete. Constr. Build. Mater. 2013, 43, 125–130. [Google Scholar] [CrossRef]
  7. Wu, Y.; Lu, B.; Bai, T.; Wang, H.; Du, F.; Zhang, Y.; Cai, L.; Jiang, C.; Wang, W. Geopolymer, green alkali activated cementitious material: Synthesis, applications and challenges. Constr. Build. Mater. 2019, 224, 930–949. [Google Scholar] [CrossRef]
  8. Izquierdo, M.; Querol, X.; Davidovits, J.; Antenucci, D.; Nugteren, H.; Fernández-Pereira, C. Coal fly ash-slag-based geopolymers: Microstructure and metal leaching. J. Hazard. Mater. 2009, 166, 561–566. [Google Scholar] [CrossRef]
  9. Weil, M.; Buchwald, A.; Dombrowski-Daube, K. How to Assess the Environmental Sustainability of Geopolymers? A Live Cycle Perspective. Adv. Sci. Technol. 2010, 69, 186–191. [Google Scholar] [CrossRef]
  10. Zawrah, M.F.; Gado, R.A.; Feltin, N.; Ducourtieux, S.; Devoille, L. Recycling and utilization assessment of waste fired clay bricks (Grog) with granulated blast-furnace slag for geopolymer production. Process Saf. Environ. Prot. 2016, 103, 237–251. [Google Scholar] [CrossRef]
  11. Mohajerani, A.; Suter, D.; Jeffrey-Bailey, T.; Song, T.; Arulrajah, A.; Horpibulsuk, S.; Law, D. Recycling waste materials in geopolymer concrete. Clean Technol. Environ. Policy 2019, 21, 493–515. [Google Scholar] [CrossRef]
  12. Fořt, J.; Vejmelková, E.; Koňáková, D.; Alblová, N.; Čáchová, M.; Keppert, M.; Rovnaníková, P.; Černý, R. Application of waste brick powder in alkali activated aluminosilicates: Functional and environmental aspects. J. Clean. Prod. 2018, 194, 714–725. [Google Scholar] [CrossRef]
  13. Kugler, F.; Fehn, T.; Sandner, M.; Krcmar, W.; Teipel, U. Microstructural and mechanical properties of geopolymers based on brick scrap and fly ash. Int. J. Ceram. Eng. Sci. 2022, 4, 92–101. [Google Scholar] [CrossRef]
  14. Lee, W.K.W.; van Deventer, J.S.J. Use of Infrared Spectroscopy to Study Geopolymerization of Heterogeneous Amorphous Aluminosilicates. Langmuir 2003, 19, 8726–8734. [Google Scholar] [CrossRef]
  15. Telle, R.; Salmang, H.; Scholze, H. (Eds.) Keramik: 7, Vollst. Neubearb. und Erw. Aufl; Springer: Berlin, Germany, 2007. [Google Scholar]
  16. Koenders, E.; Weise, K.; Vogt, O. Werkstoffe im Bauwesen; Springer Fachmedien Wiesbaden: Wiesbaden, Germany, 2020. [Google Scholar]
  17. Bohra, V.K.J.; Nerella, R.; Madduru, S.R.C.; Rohith, P. Microstructural characterization of fly ash based geopolymer. Mater. Today Proc. 2020, 27, 1625–1629. [Google Scholar] [CrossRef]
  18. Ambroise, J.; Maximilien, S.; Pera, J. Properties of Metakaolin blended cements. Adv. Cem. Based Mater. 1994, 1, 161–168. [Google Scholar] [CrossRef]
  19. Reig, F. FTIR quantitative analysis of calcium carbonate (calcite) and silica (quartz) mixtures using the constant ratio method. Application to geological samples. Talanta 2002, 58, 811–821. [Google Scholar] [CrossRef]
  20. Ascensão, G.; Beersaerts, G.; Marchi, M.; Segata, M.; Faleschini, F.; Pontikes, Y. Shrinkage and Mitigation Strategies to Improve the Dimensional Stability of CaO-FeOx-Al2O3-SiO2 Inorganic Polymers. Materials 2019, 12, 3679. [Google Scholar] [CrossRef] [Green Version]
  21. Nath, D.C.D.; Bandyopadhyay, S.; Gupta, S.; Yu, A.; Blackburn, D.; White, C. Surface-coated fly ash used as filler in biodegradable poly(vinyl alcohol) composite films: Part 1—The modification process. Appl. Surf. Sci. 2010, 256, 2759–2763. [Google Scholar] [CrossRef]
  22. Zhang, Z.; Wang, H.; Provis, J.L. Quantitative study of the reactivity of fly ash in geopolymerization by FTIR. J. Sustain. Cem. Based Mater. 2012, 1, 154–166. [Google Scholar] [CrossRef] [Green Version]
  23. Davidovits, J. Geopolymer—Chemistry and Applications; Institut Géopolymère: Saint-Quentin, France, 2020. [Google Scholar]
  24. Alvarez-Ayuso, E.; Querol, X.; Plana, F.; Alastuey, A.; Moreno, N.; Izquierdo, M.; Font, O.; Moreno, T.; Diez, S.; Vázquez, E.; et al. Environmental, physical and structural characterisation of geopolymer matrixes synthesised from coal (co-)combustion fly ashes. J. Hazard. Mater. 2008, 154, 175–183. [Google Scholar] [CrossRef]
  25. Klinowski, J. Nuclear magnetic resonance studies of zeolites. Prog. Nucl. Magn. Reson. Spectrosc. 1984, 16, 237–309. [Google Scholar] [CrossRef]
  26. Motorwala, A.; Shah, V.; Kammula, R.; Nannapaneni, P.; Raijiwala, D.B. ALKALI Activated FLY-ASH Based Geopolymer Concrete. Int. J. Emerg. Technol. Adv. Eng. 2013, 3, 159–166. [Google Scholar]
  27. REES, C.A. Mechanisms and Kinetics of Gel Formation in Geopolymers; The University of Melbourne: Melbourne, VIC, Australia, 2007. [Google Scholar]
  28. Nayak, P.S.; Singh, B.K. Instrumental characterization of clay by XRF, XRD and FTIR. Bull. Mater. Sci. 2007, 30, 235–238. [Google Scholar] [CrossRef] [Green Version]
  29. Ascensão, G.; Marchi, M.; Segata, M.; Faleschini, F.; Pontikes, Y. Reaction kinetics and structural analysis of alkali activated Fe–Si–Ca rich materials. J. Clean. Prod. 2020, 246, 119065. [Google Scholar] [CrossRef]
  30. Kränzlein, E.; Harmel, J.; Pöllmann, H.; Krcmar, W. Influence of the Si/Al ratio in geopolymers on the stability against acidic attack and the immobilization of Pb2+ and Zn2+. Constr. Build. Mater. 2019, 227, 116634. [Google Scholar] [CrossRef]
  31. Kränzlein, E.; Pöllmann, H.; Krcmar, W. Metal powders as foaming agents in fly ash based geopolymer synthesis and their impact on the structure depending on the Na/Al ratio. Cem. Concr. Compos. 2018, 90, 161–168. [Google Scholar] [CrossRef]
  32. Criado, M.; Vicent, M.; García-Ten, F.J. Reactivation of alkali-activated materials made up of fly ashes from a coal power plant. Clean. Mater. 2022, 3, 100043. [Google Scholar] [CrossRef]
Figure 1. Waste materials used in the production of geopolymers: brick sanding dust (a); unprocessed brick scrap (b); processed brick scrap (c); unprocessed mixed rubble (d); processed mixed rubble (e); unprocessed concrete rubble (f); processed concrete rubble (g); fly ash (h).
Crystals 12 00678 g001
Figure 2. Examples of geopolymer test specimens: cube for determination of compressive strength (left), prism for determination of flexural strength (middle), and plate for determination of thermal conductivity and bulk density (right).
Crystals 12 00678 g002
Figure 3. Mineralogical composition determined by XRD: (a) brick sanding dust; (b) brick scrap; (c) mixed rubble; (d) concrete rubble; (e) fly ash.
Crystals 12 00678 g003
Figure 4. Infrared transmission spectra of the input materials: brick sanding dust, brick scrap, mixed rubble, concrete rubble, and fly ash.
Crystals 12 00678 g004
Figure 5. Infrared transmission spectra of the geopolymers produced from waste materials: BSD_4 (100 wt.% brick sanding dust), BSS_4 (100 wt.% processed brick scrap), MR_4 (100 wt.% mixed rubble), CR_4 (100 wt.% concrete rubble), and FA_100 (100 wt.% fly ash).
Crystals 12 00678 g005
Figure 6. Mean values of compressive strengths of geopolymer stones produced from residual materials with associated standard deviations.
Crystals 12 00678 g006
Figure 7. Mean values of flexural strengths of geopolymer bricks produced from residual materials with associated standard deviations.
Crystals 12 00678 g007
Figure 8. Mean values of bulk density of geopolymer bricks produced from residual materials with associated standard deviations.
Crystals 12 00678 g008
Figure 9. Mean values of thermal conductivity of geopolymer bricks produced from residual materials with associated standard deviations.
Crystals 12 00678 g009
Figure 10. SEM image of the fracture surface of the brick sanding dust geopolymer at 2000× magnification.
Crystals 12 00678 g010
Figure 11. SEM image of the fracture surface of the brick scrap geopolymer at 2000× magnification.
Crystals 12 00678 g011
Figure 12. SEM image of the fracture surface of the mixed rubble geopolymer at 2000× magnification.
Crystals 12 00678 g012
Figure 13. SEM image of the fracture surface of the concrete rubble geopolymer at 2000× magnification.
Crystals 12 00678 g013
Figure 14. SEM image of the fracture surface of the fly ash geopolymer at 2000× magnification.
Crystals 12 00678 g014
Table 1. Chemical composition of the residual materials used in wt.%, determined by XRF analysis.
OxideBrick Sanding DustBrick ScrapMixed RubbleConcrete RubbleFly Ash
LOI1.300.9211.0114.473.86
SiO261.4857.4363.4359.5052.35
Al2O317.9018.575.313.1225.19
CaO5.398.6113.3817.854.17
Fe2O35.985.912.341.336.22
TiO20830.860.240.111.15
MgO2.753.081.481.421.88
SO30.330.180.430.590.23
K2O3.042.811.811.182.09
Na2O0.900.770.260.201.09
P2O50.140.160.100.061.15
V2O50.000.000.000.000.03
Cr2O30.020.020.010.010.03
Mn3O40.100.100.060.040.07
ZnO0.020.020.010.010.05
SrO0.010.020.030.040.14
ZrO20.030.030.020.010.05
BaO0.160.140.060.050.26
Publisher’s Note: MDPI stays neutral with regard to jurisdictional claims in published maps and institutional affiliations.

