Article

Synthesis of WS2 by Chemical Vapor Deposition: Role of the Alumina Crucible

by
Neileth Stand
*,
Cesar D. Mendoza
* and
Fernando L. Freire, Jr.
Departamento de Física, Pontifícia Universidade Católica do Rio de Janeiro, Rio de Janeiro 22451-900, RJ, Brazil
*
Authors to whom correspondence should be addressed.
Crystals 2022, 12(6), 835; https://doi.org/10.3390/cryst12060835
Submission received: 25 May 2022 / Revised: 8 June 2022 / Accepted: 10 June 2022 / Published: 12 June 2022

Abstract

:
The role of the alumina crucible for the tungsten disulfide (WS2) growth on silicon dioxide substrates (SiO2/Si) under atmospheric pressure chemical vapor deposition (APCVD) was investigated. Both synthesis and properties of the APCVD-WS2 depend on the number of growth cycles when using the same alumina crucible. It was discovered that there is an ideal condition for the material’s synthesis, which is characterized by an increase in the photoluminescence (PL) yield and larger WS2 triangles. It usually happens for the first three growth cycles. For the fourth cycle and beyond, the PL decreases gradually. Simultaneously, atomic force microscopy images revealed no important changes in the topography of the WS2 flakes. As a function of the number of synthesis cycles, the progressive decrease in PL yield could be associated with materials with a higher density of defects, as identified by the LA(M)/A1g(M)−LA(M) ratio from Raman data using the green line.

Graphical Abstract

1. Introduction

Atomically thin and layered materials such as tungsten disulfide (WS2) have emerged as promising candidates for the next generation of optoelectronic devices [1,2,3]. WS2 is a semiconductor belonging to the transition metal dichalcogenide (TMD) family. Its crystalline structure consists of one transition metal layer sandwiched between two layers of sulfur (S) atoms. A single two-dimension unit with three atomic layers is approximately 6–8 Å thick [4,5,6]. By varying the number of WS2 layers, the photoluminescence (PL) quantum yield can be increased due to an indirect to direct band-gap transition from bulk to monolayer. This property, along with the strong WS2 spin–orbital coupling, opens up new possibilities in valleytronics, spintronics, photodetection, chemical sensing and flexible electronics [7,8,9,10,11,12,13,14,15]. Many fundamental studies and device prototypes are based on samples obtained through mechanical exfoliation, which allows for the rapid isolation of a TMD monolayer. However, its shape, position and size are arbitrary, making integration with current technology nearly impossible.
Chemical vapor deposition (CVD) has already been demonstrated to be a viable method for the large-scale growth of single-crystal monolayer graphene [16,17]. While allowing us to control morphological, electronic and structural properties, TMD synthesis does not provide a straightforward pathway to large-area growth. Typically, the CVD-WS2 growth on SiO2 (285 nm)/Si substrates using tungsten trioxide (WO3) and S powders as precursors occurs under an inert gas flux that works as a carrier gas into the quartz tube under both atmospheric and low-pressure conditions. The accepted growth mechanism for WS2 at high temperatures is that the S vapor partially reduces the WO3 to form suboxide species of the precursor, which are adsorbed onto the growth substrate and transformed to WS2 by the same S vapor. Keeping the thermodynamic and kinetic parameters constant should produce WS2 of comparable quality. Various groups have investigated synthesis scalability by varying parameters, such as temperature, gas flow, environment (gas mixtures), pressure (low and atmospheric), catalyzer (sodium, terephthalic acid, etc.), growth time, precursor amount and substrate cleaning [18,19,20,21,22,23,24,25,26,27,28,29,30]. These studies demonstrated divergent results even between similar growing conditions, leaving researchers puzzled about why this occurs. So far, our review of the previous literature has revealed that there are various forms of the growth substrate support. Some authors used quartz or alumina crucibles, whereas others used the same target substrate material, e.g., pieces of SiO2/Si wafer (or crystalline quartz) and sapphire [19,20,31,32,33,34]. In theory, there are no correlations between WS2 synthesis and the crucible.
Even though the alumina crucible is widely used in synthesizing TMDs by CVD, no systematic study on the effect of its reuse in the process has been carried out so far. Using a multitechnique approach, this study investigates the role of the alumina crucibles in WS2 growth under atmospheric pressure CVD (APCVD). The number of growth cycles affects the synthesis and properties of WS2. There is an optimal condition in which the PL quantum yield is increased, and the performance can be linked to contaminants on the crucible’s surface.

2. Materials and Methods

2.1. Sample Preparation

The synthesis of WS2 was carried out in a quartz tube using a horizontal furnace with two heating zones and under atmospheric pressure by employing argon as the carrier gas. Before growth started, argon gas was allowed to pass for approximately 15 min to guarantee an inert environment. Laboratory ambient conditions were controlled: 25 degrees Celsius and relative humidity 50%. The precursor was WO3 powder (20 mg) placed on an alumina crucible, which also held the substrate, SiO2 (285 nm)/Si. Another alumina crucible containing 600 mg of S powder was placed upstream of the tube. The crucibles were manufactured by Ceraltec Ceramica Tecnica Ltd. (São Paulo, Brazil) using alumina supplied by Alcoa and Hindalco. After each growth cycle, the crucible and the quartz tube were cleaned, which involved annealing the alumina crucible and the quartz tube at 1000 °C for 30 min at ambient pressure (in the air). The results reported in the next section correspond to an average over several series of growth cycles, always starting with new crucibles. A detailed description of the synthesis procedures is provided in the Supplementary Material.

2.2. Characterization Techniques

The magnified images of our samples were captured using the ZEISS Axio visor A1. The Raman measurements and PL maps were obtained using a micro-Raman spectrometer (NT-MDT, NTEGRA SPECTRA, Moscow, Russia) equipped with a charge-coupled device detector and a solid-state laser. The wavelength of the laser excitation was 473 nm (2.62 eV). We used a 100× magnification objective and an incident laser power of less than 0.2 mW to create a laser spot with an area of approximately 1 μm2. The PL maps were created using the piezoelectric stage of an atomic force microscope (AFM; NT-MDT, NTEGRA SPECTRA, Moscow, Russia). The AFM measurements were performed in contact mode with a silicon tip. The cantilever’s constant force was 0.204 N/m. We used a scanning rate of 0.5 Hz, corresponding to 5 μm/s, perpendicular to the cantilever’s main axis. We processed the topography images with a second-order plane filter to eliminate the tilt between the sample and the microscope. In addition, Raman spectra were obtained using the Horiba LabRAM HR evolution equipped with a solid-state laser of 532 nm and 150 L/mm grating for a broader spectral range. Measurements were performed using a 100× objective, giving a laser spot of the order of 1 μm2 with an incident power of less than 0.2 mW.
Scanning electron microscopy (SEM) images were obtained using a JEOL scanning electron microscope (model JSM-6701F, Tokyo, Japan) equipped with a field emission gun.
X-ray photoelectron spectroscopy (XPS, Waltham MA, USA) measurements were performed in a surface analysis chamber under ultrahigh vacuum (pressure of ~10−7 Pa) equipped with a VG Thermo Alpha 110 hemispherical analyzer positioned at a 90-degree angle to the sample surface and using the Al-Kα line (~1458 eV) as an X-ray source.

3. Results and Discussion

Figure 1a depicts the relationship between the size of the WS2 triangles and the number of growth cycles. It should be noted that we are referring to the triangle’s sides. The crucible was made of alumina, and the W precursor’s contact area was always the same (Figure S1d in Supplementary Materials). The plot exhibits a decreasing trend, with the first three growth cycles of WS2 revealing triangles with similar sizes, around 45 µm, as shown in Figure 1b,c. After the fourth growth cycle, the size decreased to around 10 µm (Figure 1a,e). As the growth cycles progressed and the contact area in the crucible remained constant, the size of the triangles decreased until the formation of WS2 ceased completely (the substrate remained clean). After several growth cycles, we replaced the quartz tube and crucibles with new ones to ensure that the observed trend did not result from tube or crucible contamination. The same behavior was observed after changing the tube. Figure 1f depicts an optical image of WS2 growth just before it stopped growing (the ninth growth cycle), with triangles having sides of about 10 µm. Figure S2 in Supplementary Materials shows a zoomed-in view of images of Figure 1e,f to examine the triangle sizes.
Figure 1d shows how the number of growth cycles affects the substrate area covered by WS2 triangles and the density of nucleation sites. After many growth cycles, the number of nucleation sites increased abruptly, whereas the size of the WS2 single crystals and, thus, the covered area decreased dramatically. The error bar in Figure 1d represents the standard deviation of the obtained data for four series of growth cycles.
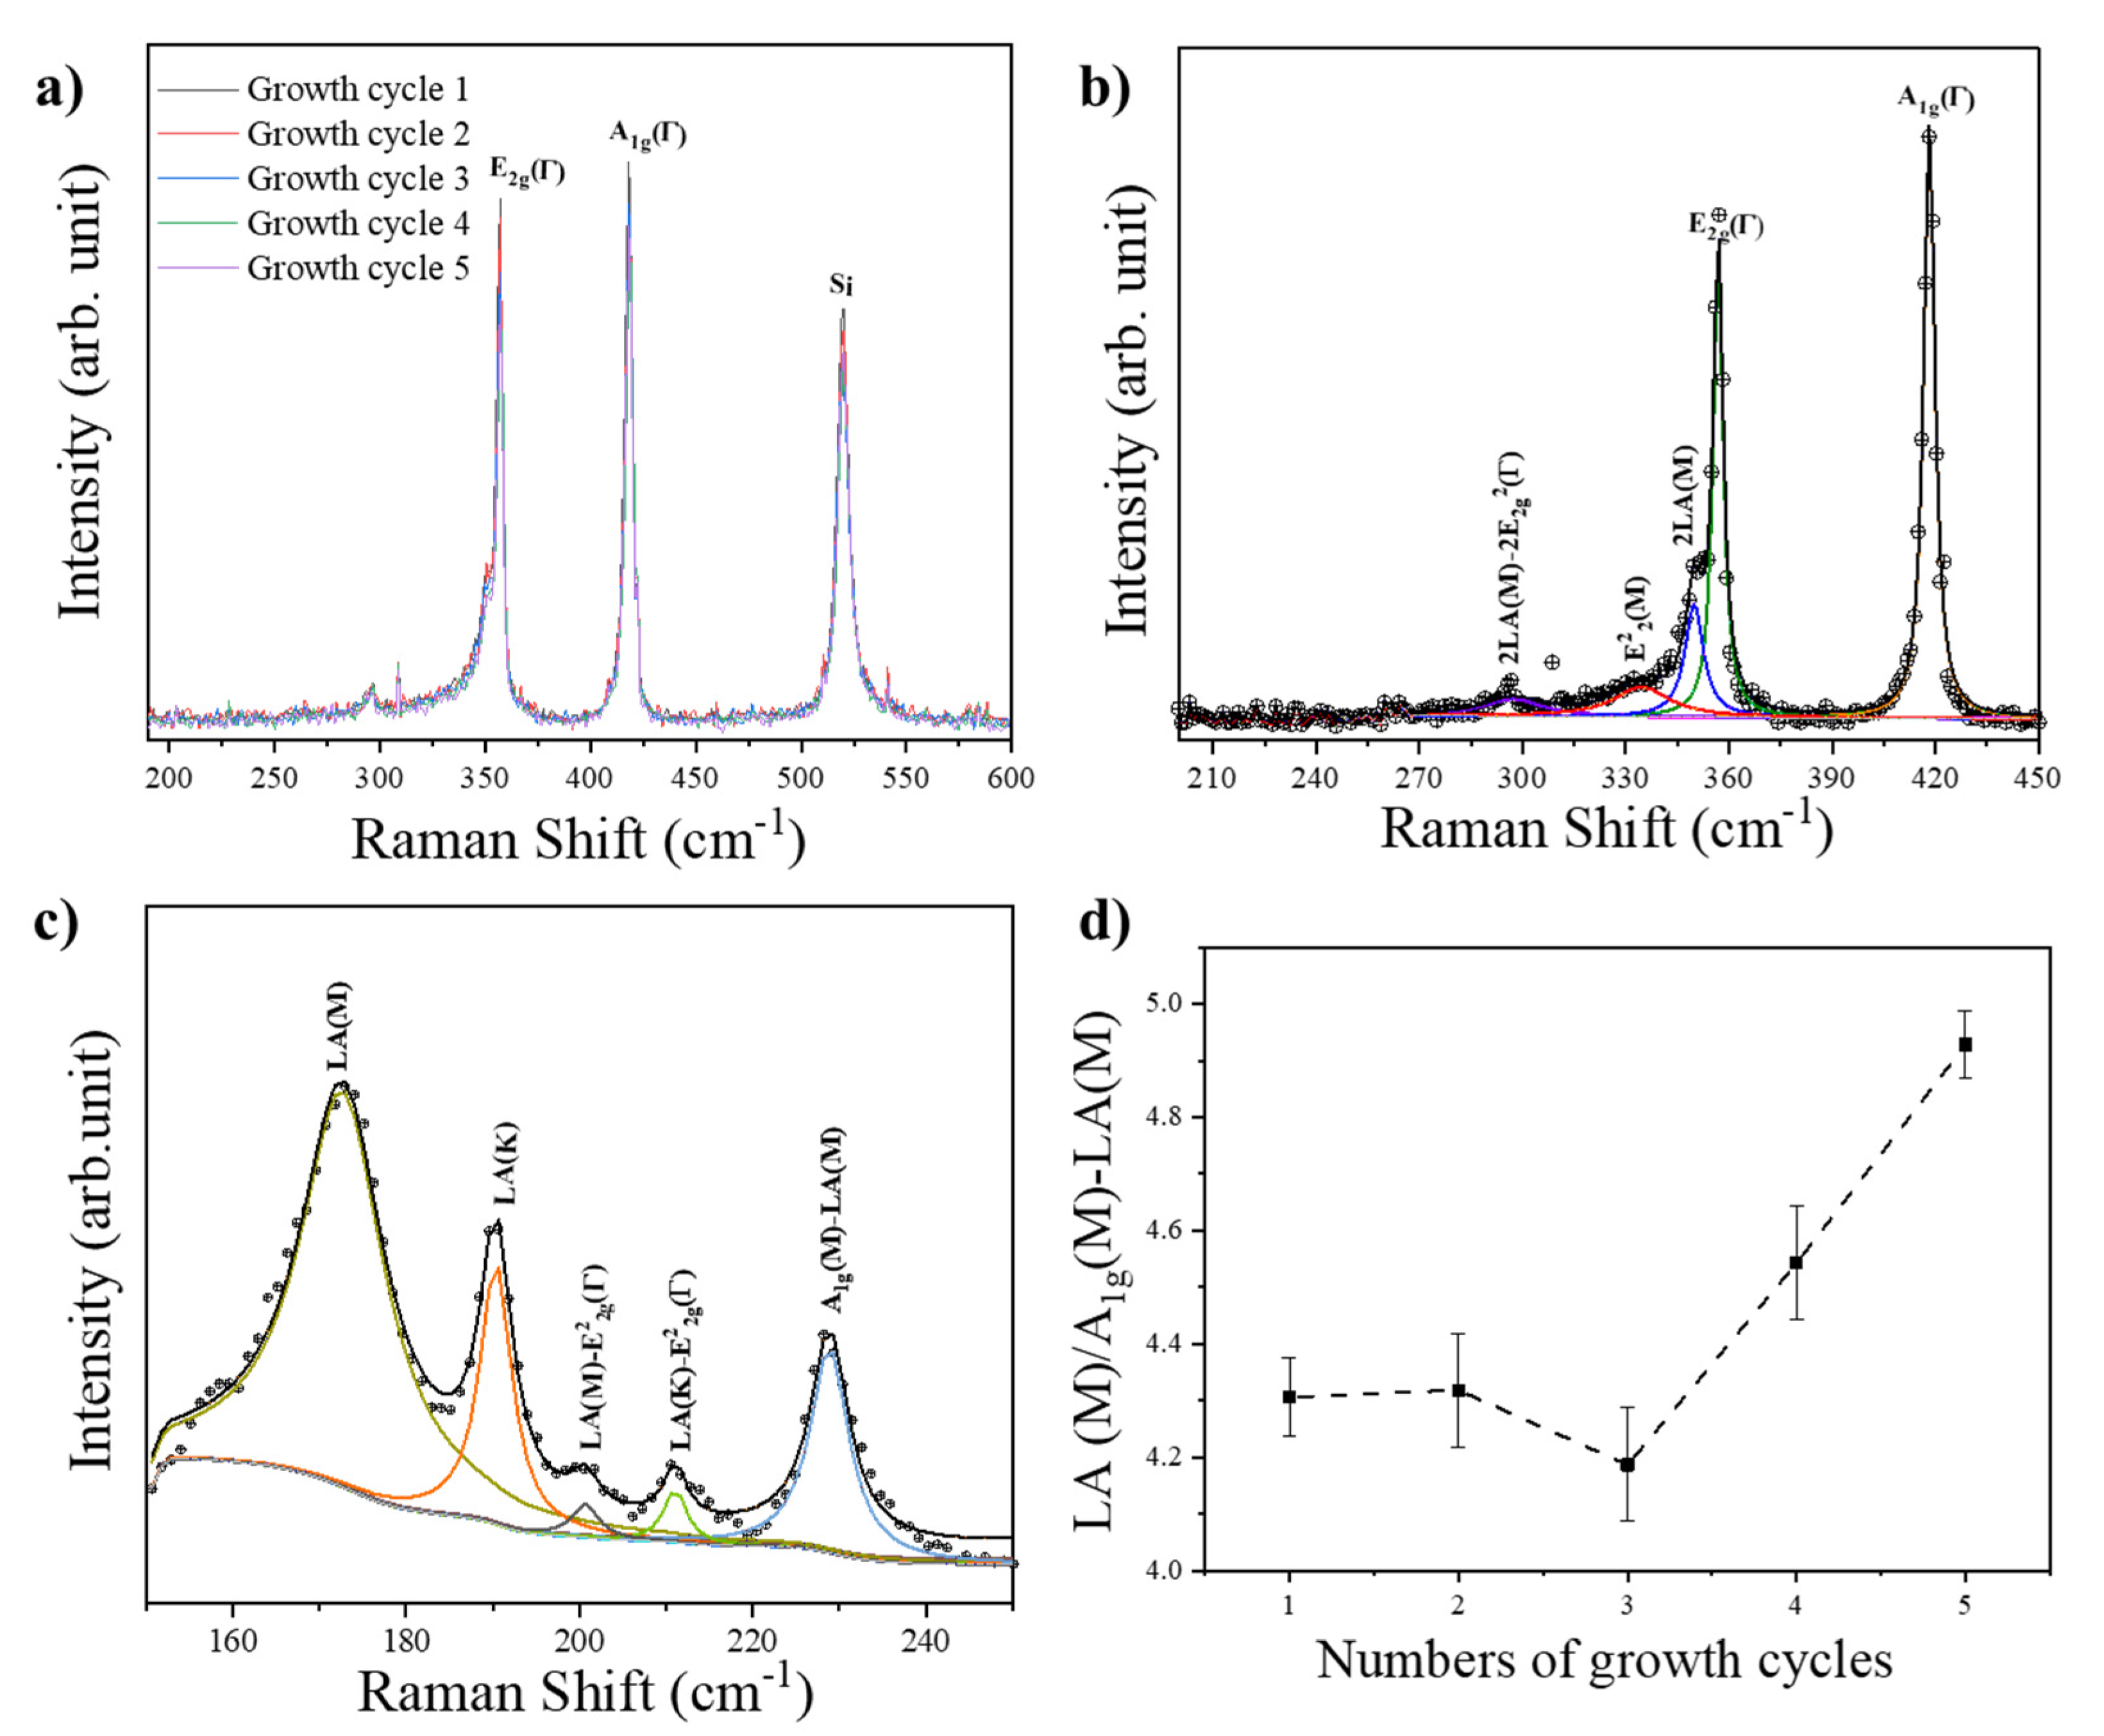
The structural properties of the WS2 crystals were monitored using Raman spectroscopy. The growth cycles were examined using a 473 nm excitation laser. The WS2 monolayer Raman spectra were found to be similar, as shown in Figure 2a. The dominant features of each spectrum were the first-order modes identified as E2g and A1g in the center of the first Brillouin zone (Γ). Figure 2b depicts the spectrum deconvolution for the sample obtained after the third growth cycle. The peak near 353 cm−1 is associated with three different contributions centered at 357.1 cm−1, 349.6 cm−1 and 333.4 cm−1, which correspond to E2g(Γ), 2LA(M) and E22(M) modes, respectively. Another peak was observed at 295.7 cm−1 due to the 2LA(M)−2E22g(Γ) mode [35,36]. Furthermore, a detailed analysis of each deconvoluted contribution was performed for each spectrum, and no variation in the main characteristics was observed (see Table S1, Supplementary Material).
Figure 2c shows the Raman spectrum of the low-frequency region obtained with the 532 nm laser line for the third growth cycle (the whole Raman spectrum can be seen in Figure S3 in the Supplementary Material). The defects are better studied using this excitation energy for WS2. Raman spectra of other samples were also obtained. Figure 2d shows the ratio between the LA(M) mode (longitudinal acoustic phonons) and the A1g(M)−LA(M) peak. The LA(M)/A1g(M)−LA(M) area ratio is a figure of merit of the defect density and clearly indicates an increase in this density from the third growth cycle [35].
A 473 nm excitation laser was used to measure the PL of WS2 monolayer samples. Figure 3a depicts the PL spectra of the WS2 monolayer for the first five growth cycles and the ninth growth cycle. The change in intensity of the total peak centered at approximately 1.95 eV indicates the PL dependence on the growth number. The intensity of PL increased, reaching its maximum in the third growth cycle. When the first and the third growth cycles were compared, the emission was found to be increased by a factor of 3 (Figure 3b). Meanwhile, beginning with the fourth growth cycle, the PL intensity decreased. For example, after the fourth growth cycle, the observed PL intensity was only one-third of the PL intensity obtained in the first growth cycle using the same alumina crucible. Figure 3a shows that the PL intensity observed in WS2 samples obtained in the ninth growth cycle was negligible. All PL spectra, like Raman measurements, were derived from an average of measurements taken from different triangles in the sample and different points of the same triangle. The error bar in Figure 3b represents the standard deviation of the obtained data.
Along with the decrease in intensity, a slight dislocation of the PL peak to lower energy (higher wavelengths, redshift) was observed. A more detailed analysis of the PL peak could reveal information about the material produced in each cycle. Figure 4a,b depict the PL peak’s deconvolution, which reveals two contributions associated with neutral excitons and trions found in the WS2 flakes. The main characteristics of PL of each synthesis are listed in Table 1. The ratio of the neutral excitons to trions (X0/XT) depends on the number of growth cycles. The contribution of trions decreases gradually, reaching a minimum that corresponds to the maximum of PL emission. The increase in S vacancies (n-type doping) could explain the redshift of neutral exciton energy [37,38]. Thus, the redshift in the central peak position corresponds to the increase in contribution due to the trions (see Table 1). Even though Raman spectroscopy results did not reveal significant crystalline changes, there is an increase in the defect density (for example, vacancies) indicated in Figure 2d. This increase in defects was probably responsible for the observed reduction in PL intensity after the third growth cycle.
Figure 4c,d show PL maps for the third and fifth growth cycles. Figure 4c shows the homogeneity of PL for the first three growth cycles, whereas Figure 4d shows the PL for longer growth cycles. PL maps clearly reflect the quality of samples grown at various growth cycles. As discussed above, for the three growth cycles, the WS2 flakes are larger and have a lower defect density than those obtained in later cycles. These characteristics are reflected in a homogeneous distribution of luminescence emission (Figure 4c). At the same time, Figure 4d shows the effect of a higher density of defects in the small grains of WS2, resulting in a non-homogeneous material. All data shown in Figure 4a–d and Table 1 were obtained with a 473 nm excitation laser.
Figure 4e,f show the topographic images of the triangles depicted in Figure 4c,d. The surface is uniform after the CVD growth and shows no signs of significant damage. According to the height profile on each growth cycle, thicknesses of 0.8 nm (±0.2 nm) and 0.6 nm (±0.2 nm), our WS2 triangles are monolayers (Figure S4, in the Supplementary Material).
To better understand the behavior of the structural and PL properties of WS2, we attempted synthesis using quartz crucible, but the results were unsatisfactory. Growth did not occur when the same synthesis parameters previously used for the alumina crucible were employed, i.e., the same experimental setup. This finding suggests that the alumina crucible plays an essential role in the material’s growth. In principle, the growth of WS2 has nothing to do with the type of crucible used. The general growth mechanism of WS2 is well understood, as described in the introduction. However, many details of the experimental setup influence the WS2 growth and are responsible for the change in both growth kinetics and dynamics. Among these is the substrate’s position in relation to the precursor and the typical synthesis parameters such as pressure, temperature, time and presence or absence of carrier gases. The results reported here describe an intriguing situation. To provide information that can help to clarify this behavior, we performed crucible analysis using XPS and scanning electron microscopy techniques.
We plotted the survey spectra from a virgin alumina crucible, the WO3 powder and CVD-WS2 monolayers (Figure S5 in the Supplementary Material). We identified that the spectrum taken from a virgin alumina crucible contains silicon, sodium, carbon, aluminum and oxygen. As alumina is purified by the Bayer process using caustic soda, NaOH, sodium is an intrinsic contaminant due to the manufacturing process, whereas carbon is an atmospheric pollutant. The same figure also depicts the high-resolution spectra for S and W. XPS spectra show the formation of W-S bonds in CVD-WS2 monolayers, as expected (Figure S5h,i in the Supplementary Material).
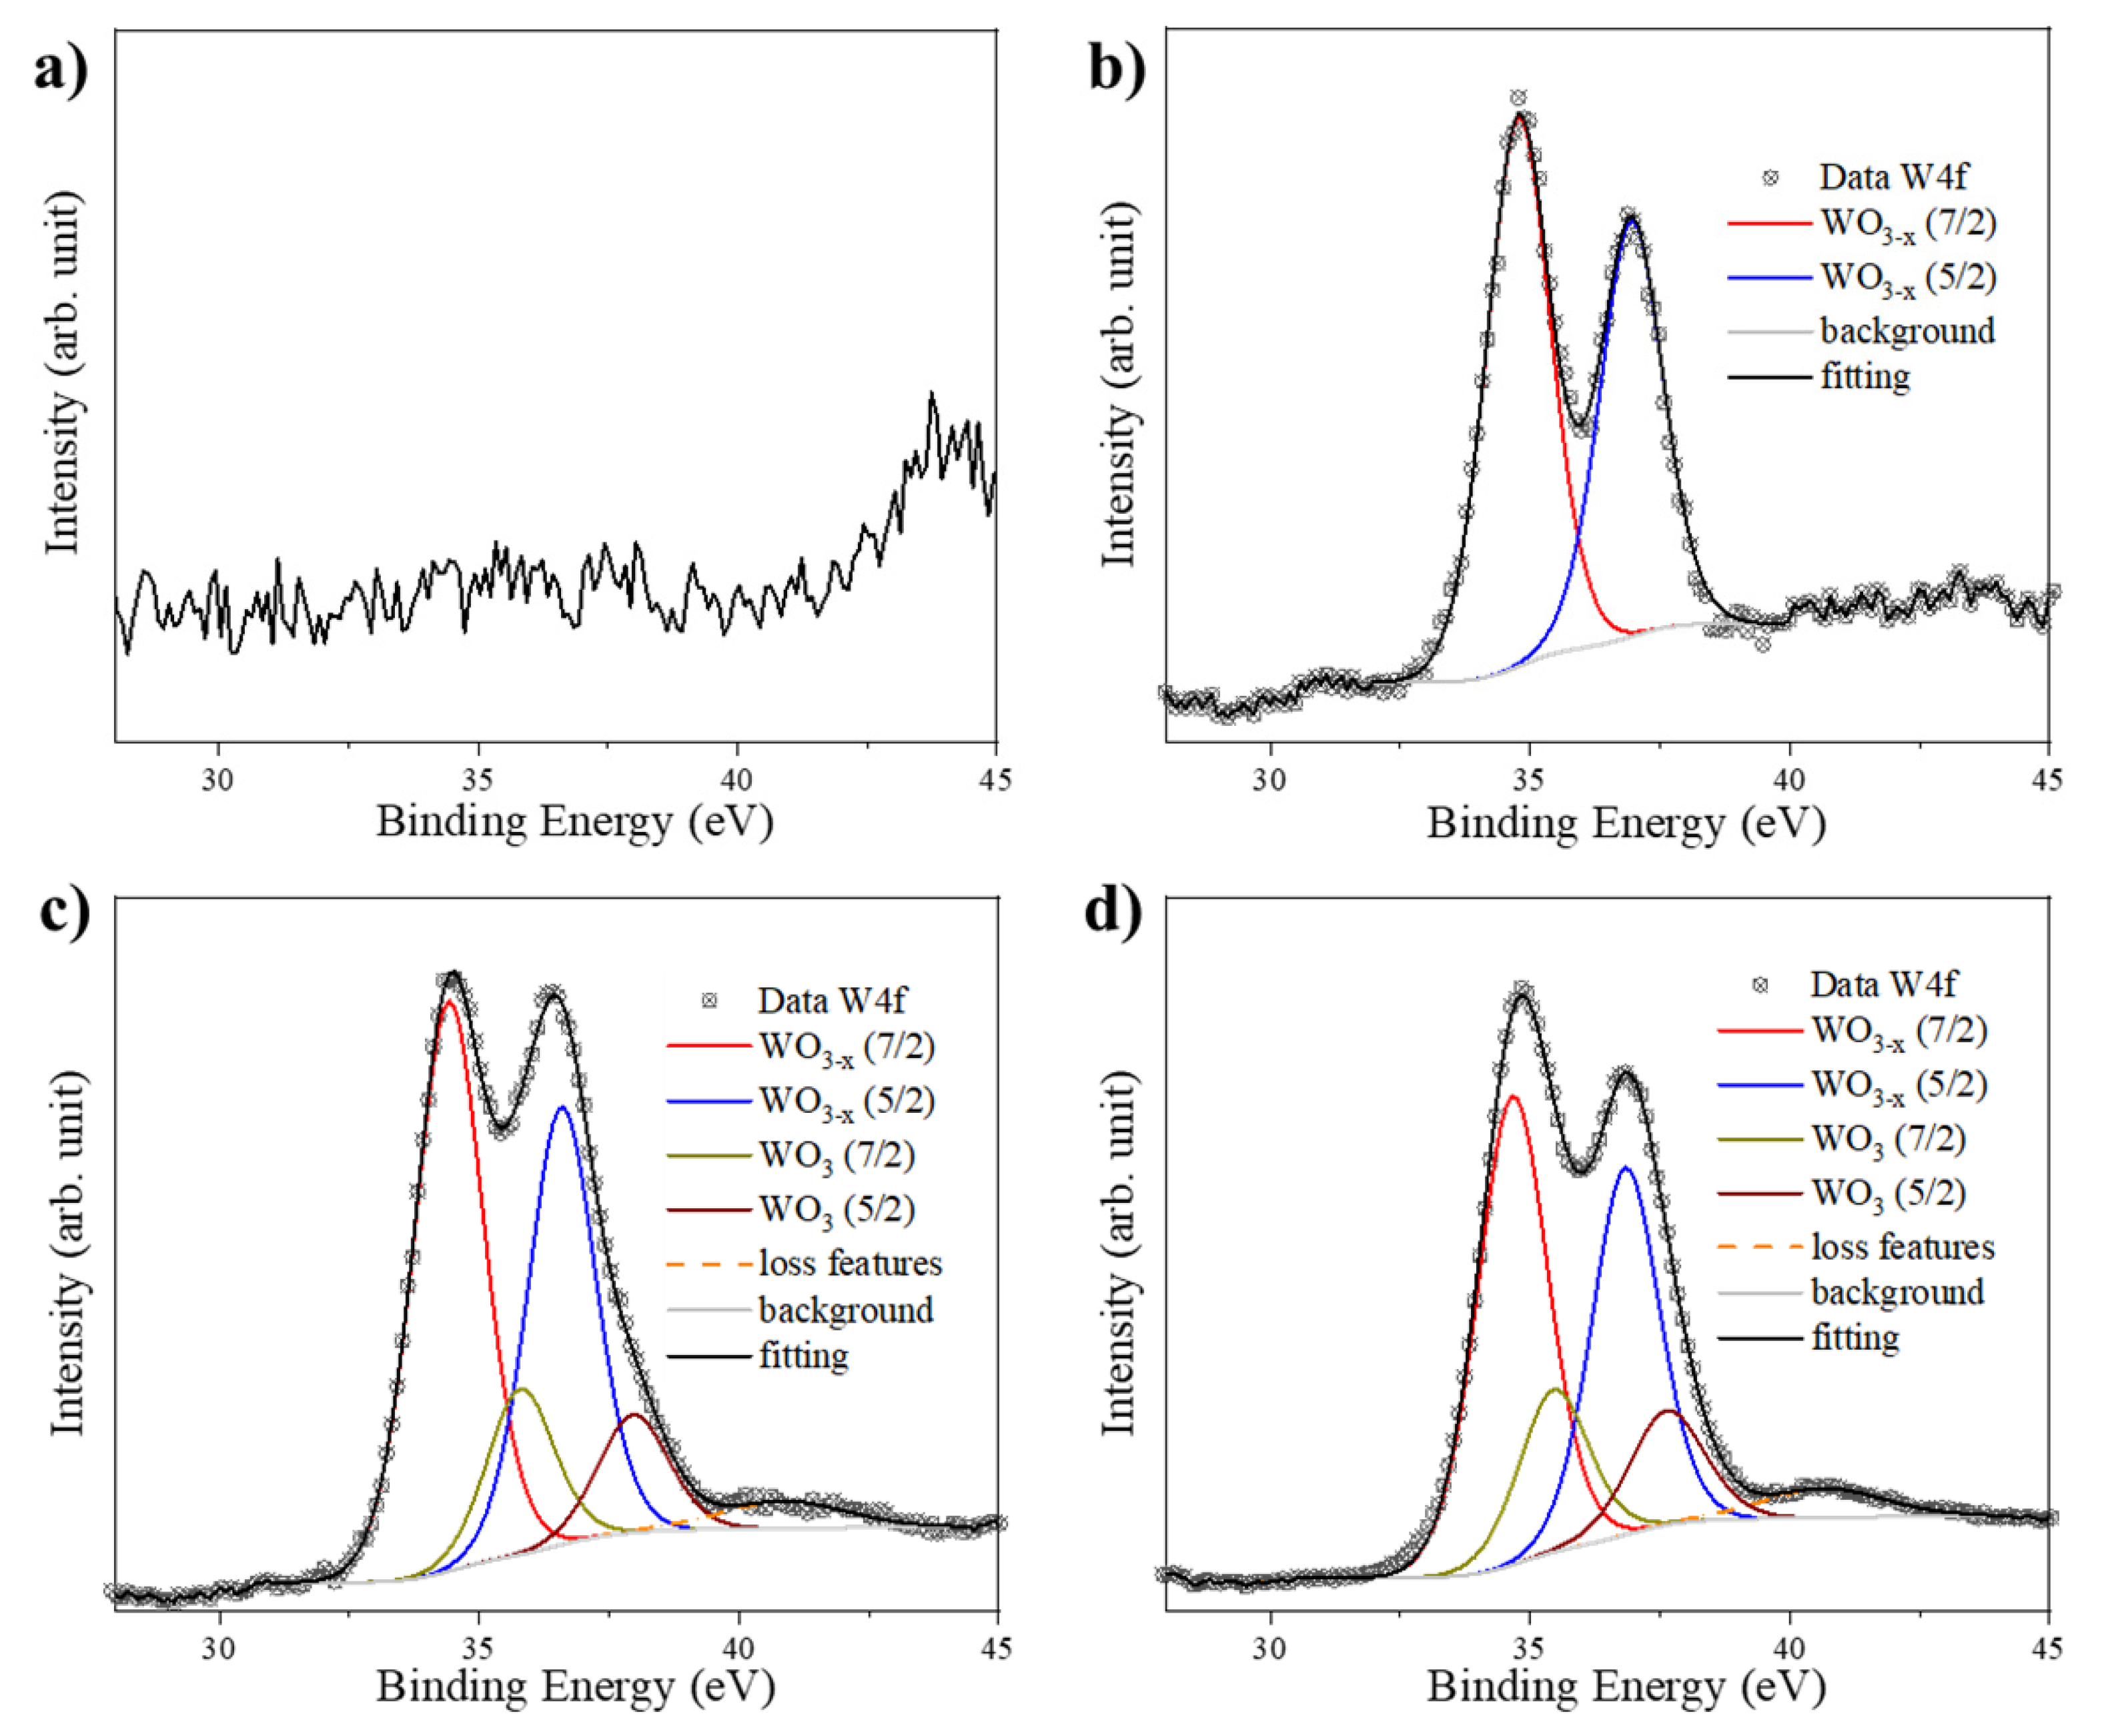
Figure 5 shows the evolution of the high-resolution W4f peak obtained from the crucible surface after each growth cycle, beginning with a virgin crucible and an analysis of its surface after the first, third and ninth growth cycles. The W4f peak presents a spin–orbit coupling corresponding to the duplet f7/2 and f5/2. Figure 5a shows no traces of W when the crucible is virgin. However, after the post-growth cleaning process, the crucible surface still shows residual W in its suboxide form after the first growth cycle (Figure 5b). This oxide is not stoichiometric W+6 (WO3) but rather a reduced phase of the WO3 (WO3-x suboxides). This reduced oxide phase persists as the number of growth cycles increases (Figure 5c,d). The phase corresponding to the W precursor (WO3) appears as a new residue, but its relative amount seems to be unaffected by the number of cycles (Table 2). One might believe that the reduced phase of the tungsten oxide, a contaminant on the surface of the crucible after the first growth cycle, aids the synthesis process. In this way, we were able to conduct some growth experiments using only the suboxide residue present on the crucible surface and not the WO3 precursor. It was not possible to obtain WS2 synthesis under these conditions. The evolution of the amount of W residue indicates an increase in W atoms at the surface, and the WO3-x and WO3 amount ratios remain constant within experimental errors but with the suboxide predominating.
XPS results also show an increase in sodium at the crucible surface (Table S2 in Supplementary Materials). It nearly triples after the ninth growth cycle (from 1 at.% to 4 at.%). It is well known that sodium acts as a catalyst in the growth of WS2 via CVD [39]. From first-principles calculations, sodium was the nucleation site of the growth process, and the amount of sodium is crucial to decreasing the formation energy of TMDs [40,41].
SEM images reveal a meaningful change on the crucible surfaces, as shown in Figure 6 (comparison between virgin (Figure 6a) and after nine growth cycles (Figure 6b)). There is an essential change in the surface appearance (e.g., texture, morphology, topography). Since the substrates were placed face down, this change can influence the Ar/S flow between substrate and W precursor, resulting, together with the change in surface property, in an inhomogeneous accumulation of W-precursor on the crucible surface that could relate to the decreasing size of the triangles. At the same time, the greater presence of Na on the surface of the crucible would be related to the increase in nucleation sites.

4. Conclusions

In summary, we investigated the role of the alumina crucible for WS2 growth on silicon dioxide substrates using the APCVD methods. Using the alumina crucible reveals one new parameter for WS2 synthesis that could be beneficial. Using the same area of the alumina crucible surface and the same synthesis parameters, we noted that the number of growth cycles affects the synthesis and properties of the APCVD-WS2. The first three growth cycles showed triangles of similar sizes. In contrast, the size of the triangles decreased in further growth cycles—the density of defects increased, as revealed by the ratio between the longitudinal acoustic phonons LA(M) and A1g(M)−LA(M) peak, accompanied by a gradual reduction in PL. As revealed by XPS measurements, the sodium amount at the surface of the crucible increases with the number of growth cycles. At the same time, SEM images showed an important change in crucible surface appearance. They could explain the change in the growth kinetics and play a role in the quality of the samples. Based on PL results, the first three growth cycles were ideal. Raman spectra revealed no important structural changes. Each Raman peak’s position, width and relative intensity did not change noticeably, indicating that the WS2 flakes maintained their intrinsic hexagonal structure even when many defects were generated. Low-frequency Raman measurements revealed the increase in the ratio between LA(M) mode (longitudinal acoustic phonons) and the A1g(M)−LA(M) peak, a figure of merit of the defect density, clearly indicating an increase in this density from the third growth cycle.
The results reported in this work are helpful for those who carry out academic research on the subject. In particular, the repetitive use of the same alumina crucible produces materials with poor optoelectronic quality, even keeping all other synthesis conditions unchanged; this is an important warning to avoid erroneous conclusions. On the other hand, more research is needed to fully understand the growth mechanisms of WS2 and the factors that affect them when alumina crucibles are used.

Supplementary Materials

The following supporting information can be downloaded at: https://www.mdpi.com/article/10.3390/cryst12060835/s1, Figure S1: (a) Photo of the alumina crucible. (b) Zone 1 (downstream), where the crucible was placed with WO3 precursor (20 mg) and the SiO2/Si substrate. Zone 2 (upstream) shows the crucible with the sulfur precursor (600 mg). The distance between the two crucibles was 30 cm. The green arrow indicates the direction of the Ar flow. (c) WO3 agglomerated (small surface area on the crucible); (d) WO3 spread (large surface area on the crucible); (e) position of the substrate inside the crucible with face down over the WO3 was diagonal. Figure S2: Optical images of specific cycles: (a) the fourth growth cycle; (b) the ninth growth cycle. Table S1: Raman modes were obtained with the 473 nm wavelength. Figure S3: The full Raman spectrum of the third growth cycle using the excitation line of 532 nm. All peaks correspond to the Raman spectrum’s deconvolution. Figure S4: (a,b) Height profiles obtained from AFM images shown in Figure 4a,b. Figure S5: (a–c) XPS spectra of virgin alumina crucible’s surface; (d–f) XPS spectra of WO3; (g–i) typical APCVD-WS2: (a,d,g) survey spectra; (b,e,h) high-resolution spectra of the S2p peak; (c) high-resolution spectrum of aluminum; (f,i) high-resolution spectra of the W4f peak obtained for WO3 and APCVD-WS2, respectively. Each contribution was associated with a duplet due to the spin–orbit presented by W4f and S2p. Table S2. W/Al and Na/Al ratios were obtained from the relative atomic concentration obtained with XPS.

Author Contributions

Conceptualization, N.S., C.D.M. and F.L.F.J.; methodology, N.S. and C.D.M.; validation, F.L.F.J.; formal analysis, N.S. and C.D.M.; investigation, N.S. and C.D.M.; resources, F.L.F.J.; data curation, N.S., C.D.M. and F.L.F.J.; writing—original draft preparation, N.S., C.D.M. and F.L.F.J.; writing—review and editing, N.S., C.D.M. and F.L.F.J.; visualization, N.S. and C.D.M.; supervision, F.L.F.J.; project administration, N.S., C.D.M. and F.L.F.J.; funding acquisition, F.L.F.J. All authors have read and agreed to the published version of the manuscript.

Funding

This research was funded by Conselho Nacional de Desenvolvimento Científico e Tecnológico (CNPq), grant number 303283/2016-5; Instituto Nacional de Engenharia de Superfícies (INCT-INES), grant number 465423/2014-0; Coordenação de Aperfeiçoamento de Pessoal de Nível Superior (CAPES), grant number 001; and Fundação Carlos Chagas de Amparo à Pesquisa no Estado do Rio de Janeiro (FAPERJ), grant numbers E-26/210.167/2018, E-26/202.978/2019 and E-26/202.357/2019.

Data Availability Statement

Not applicable.

Acknowledgments

We acknowledge André do Nascimento Barbosa for assisting with using the Horiba spectrometer.

Conflicts of Interest

The authors declare no conflict of interest.

References

  1. Chhowalla, M.; Jena, D.; Zhang, H. Two-dimensional semiconductors for transistors. Nat. Rev. Mater. 2016, 1, 1–15. [Google Scholar] [CrossRef]
  2. Tan, C.; Cao, X.; Wu, X.-J.; He, Q.; Yang, J.; Zhang, X.; Chen, J.; Zhao, W.; Han, S.; Nam, G.-H.; et al. Recent Advances in Ultrathin Two-Dimensional Nanomaterials. Chem. Rev. 2017, 117, 6225–6331. [Google Scholar] [CrossRef] [PubMed]
  3. Manzeli, S.; Ovchinnikov, D.; Pasquier, D.; Yazyev, O.V.; Kis, A. 2D transition metal dichalcogenides. Nat. Rev. Mater. 2017, 2, 1–15. [Google Scholar] [CrossRef]
  4. Ajayan, P.; Kim, P.; Banerjee, K. Two-dimensional van der Waals materials. Phys. Today 2016, 69, 38–44. [Google Scholar] [CrossRef] [Green Version]
  5. Lv, R.; Terrones, H.; Elías, A.L.; Perea-López, N.; Gutiérrez, H.R.; Cruz-Silva, E.; Rajukumar, L.P.; Dresselhaus, M.S.; Terrones, M. Two-dimensional transition metal dichalcogenides: Clusters, ribbons, sheets and more. Nano Today 2015, 10, 559–592. [Google Scholar] [CrossRef] [Green Version]
  6. Choi, W.; Choudhary, N.; Han, G.H.; Park, J.; Akinwande, D.; Lee, Y.H. Recent development of two-dimensional transition metal dichalcogenides and their applications. Mater. Today 2017, 20, 116–130. [Google Scholar] [CrossRef]
  7. Wang, Q.H.; Kalantar-Zadeh, K.; Kis, A.; Coleman, J.N.; Strano, M.S. Electronics and optoelectronics of two-dimensional transition metal dichalcogenides. Nat. Nanotech. 2012, 7, 699–712. [Google Scholar] [CrossRef]
  8. Ovchinnikov, D.; Allain, A.; Huang, Y.-S.; Dumcenco, D.; Kis, A. Electrical Transport Properties of Single-Layer WS2. ACS Nano 2014, 8, 8174–8181. [Google Scholar] [CrossRef]
  9. Baugher, B.W.H.; Churchill, H.O.H.; Yang, Y.; Jarillo-Herrero, P. Optoelectronic devices based on electrically tunable p–n diodes in a monolayer dichalcogenide. Nat. Nanotech. 2014, 9, 262–267. [Google Scholar] [CrossRef] [Green Version]
  10. Schuler, B.; Qiu, D.Y.; Refaely-Abramson, S.; Kastl, C.; Chen, C.T.; Barja, S.; Koch, R.J.; Ogletree, D.F.; Aloni, S.; Schwartzberg, A.M.; et al. Large Spin-Orbit Splitting of Deep In-Gap Defect States of Engineered Sulfur Vacancies in Monolayer WS2. Phys. Rev. Lett. 2019, 123, 076801. [Google Scholar] [CrossRef] [Green Version]
  11. Kim, H.-S.; Patel, M.; Kim, J.; Jeong, M.S. Growth of Wafer-Scale Standing Layers of WS2 for Self-Biased High-Speed UV–Visible–NIR Optoelectronic Devices. ACS Appl. Mater. Interfaces 2018, 10, 3964–3974. [Google Scholar] [CrossRef] [PubMed]
  12. Lan, C.; Zhou, Z.; Zhou, Z.; Li, C.; Shu, L.; Shen, L.; Li, D.; Dong, R.; Yip, S.; Ho, J.C. Wafer-scale synthesis of monolayer WS2 for high-performance flexible photodetectors by enhanced chemical vapor deposition. Nano Res. 2018, 11, 3371–3384. [Google Scholar] [CrossRef]
  13. Duan, X.; Wang, C.; Pan, A.; Yu, R.; Duan, X. Two-dimensional transition metal dichalcogenides as atomically thin semiconductors: Opportunities and challenges. Chem. Soc. Rev. 2015, 44, 8859–8876. [Google Scholar] [CrossRef] [PubMed]
  14. Zeng, H.; Liu, G.-B.; Dai, J.; Yan, Y.; Zhu, B.; He, R.; Xie, L.; Xu, S.; Chen, X.; Yao, W.; et al. Optical signature of symmetry variations and spin-valley coupling in atomically thin tungsten dichalcogenides. Sci. Rep. 2013, 3, 1608. [Google Scholar] [CrossRef] [Green Version]
  15. Zheng, W.; Jiang, Y.; Hu, X.; Li, H.; Zeng, Z.; Wang, X.; Pan, A. Light Emission Properties of 2D Transition Metal Dichalcogenides: Fundamentals and Applications. Adv. Opt. Mater. 2018, 6, 1800420. [Google Scholar] [CrossRef]
  16. Xu, X.; Zhang, Z.; Dong, J.; Yi, D.; Niu, J.; Wu, M.; Lin, L.; Yin, R.; Li, M.; Zhou, J.; et al. Ultrafast epitaxial growth of metre-sized single-crystal graphene on industrial Cu foil. Sci. Bull. 2017, 62, 1074–1080. [Google Scholar] [CrossRef] [Green Version]
  17. Zhang, Y.; Yao, Y.; Sendeku, M.G.; Yin, L.; Zhan, X.; Wang, F.; Wang, Z.; He, J. Recent Progress in CVD Growth of 2D Transition Metal Dichalcogenides and Related Heterostructures. Adv. Mater. 2019, 31, 1901694. [Google Scholar] [CrossRef]
  18. Cong, C.; Shang, J.; Wu, X.; Cao, B.; Peimyoo, N.; Qiu, C.; Sun, L.; Yu, T. Synthesis and Optical Properties of Large-Area Single-Crystalline 2D Semiconductor WS2 Monolayer from Chemical Vapor Deposition. Adv. Opt. Mater. 2014, 2, 131–136. [Google Scholar] [CrossRef]
  19. McCreary, K.M.; Hanbicki, A.T.; Jernigan, G.G.; Culbertson, J.C.; Jonker, B.T. Synthesis of Large-Area WS2 monolayers with Exceptional Photoluminescence. Sci. Rep. 2016, 6, 19159. [Google Scholar] [CrossRef]
  20. Kang, K.N.; Godin, K.; Yang, E.-H. The growth scale and kinetics of WS2 monolayers under varying H2 concentration. Sci. Rep. 2015, 5, 13205. [Google Scholar] [CrossRef]
  21. Liu, P.; Luo, T.; Xing, J.; Xu, H.; Hao, H.; Liu, H.; Dong, J. Large-Area WS2 Film with Big Single Domains Grown by Chemical Vapor Deposition. Nanoscale Res. Lett. 2017, 12, 558. [Google Scholar] [CrossRef] [PubMed]
  22. Sheng, Y.; Tan, H.; Wang, X.; Warner, J.H. Hydrogen Addition for Centimeter-Sized Monolayer Tungsten Disulfide Continuous Films by Ambient Pressure Chemical Vapor Deposition. Chem. Mater. 2017, 29, 4904–4911. [Google Scholar] [CrossRef]
  23. Yao, H.; Liu, L.; Wang, Z.; Li, H.; Chen, L.; Pam, M.E.; Chen, W.; Yang, H.Y.; Zhang, W.; Shi, Y. Significant photoluminescence enhancement in WS2 monolayers through Na2S treatment. Nanoscale 2018, 10, 6105–6112. [Google Scholar] [CrossRef] [PubMed]
  24. Yorulmaz, B.; Özden, A.; Şar, H.; Ay, F.; Sevik, C.; Perkgöz, N.K. CVD growth of monolayer WS2 through controlled seed formation and vapor density. Mater. Sci. Semicond. Processing 2019, 93, 158–163. [Google Scholar] [CrossRef]
  25. Xu, Z.; Lv, Y.; Li, J.; Huang, F.; Nie, P.; Zhang, S.; Zhao, S.; Zhao, S.; Wei, G. CVD controlled growth of large-scale WS2 monolayers. RSC Adv. 2019, 9, 29628–29635. [Google Scholar] [CrossRef] [Green Version]
  26. Shi, B.; Zhou, D.; Fang, S.; Djebbi, K.; Feng, S.; Zhao, H.; Tlili, C.; Wang, D. Facile and Controllable Synthesis of Large-Area Monolayer WS2 Flakes Based on WO3 Precursor Drop-Casted Substrates by Chemical Vapor Deposition. Nanomaterials 2019, 9, 578. [Google Scholar] [CrossRef] [Green Version]
  27. Meng, L.; Hu, S.; Yan, W.; Feng, J.; Li, H.; Yan, X. Controlled synthesis of large scale continuous monolayer WS2 film by atmospheric pressure chemical vapor deposition. Chem. Phys. Lett. 2020, 739, 136945. [Google Scholar] [CrossRef]
  28. Cohen, A.; Patsha, A.; Mohapatra, P.K.; Kazes, M.; Ranganathan, K.; Houben, L.; Oron, D.; Ismach, A. Growth-Etch Metal–Organic Chemical Vapor Deposition Approach of WS2 Atomic Layers. ACS Nano 2021, 15, 526–538. [Google Scholar] [CrossRef]
  29. Shi, B.; Zhou, D.; Qiu, R.; Bahri, M.; Kong, X.; Zhao, H.; Tlili, C.; Wang, D. High-efficiency synthesis of large-area monolayer WS2 crystals on SiO2/Si substrate via NaCl-assisted atmospheric pressure chemical vapor deposition. Appl. Surf. Sci. 2020, 533, 147479. [Google Scholar] [CrossRef]
  30. Chen, Y. Growth of a Large, Single-Crystalline WS2 Monolayer for High-Performance Photodetectors by Chemical Vapor Deposition. Micromachines 2021, 12, 137. [Google Scholar] [CrossRef]
  31. Zhang, Y.; Zhang, Y.; Ji, Q.; Ju, J.; Yuan, H.; Shi, J.; Gao, T.; Ma, D.; Liu, M.; Chen, Y.; et al. Controlled Growth of High-Quality Monolayer WS2 Layers on Sapphire and Imaging Its Grain Boundary. ACS Nano 2013, 7, 8963–8971. [Google Scholar] [CrossRef] [PubMed]
  32. Han, J.; Fang, R.; Zhu, L.; Geng, Z.; He, X. CVD growth of monolayer WS2 through controlled growth temperature and time. Ferroelectrics 2020, 562, 51–57. [Google Scholar] [CrossRef]
  33. Wang, J.; Luo, Y.; Cai, X.; Shi, R.; Wang, W.; Li, T.; Wu, Z.; Zhang, X.; Peng, O.; Amini, A.; et al. Multiple Regulation over Growth Direction, Band Structure, and Dimension of Monolayer WS2 by a Quartz Substrate. Chem. Mater. 2020, 32, 2508–2517. [Google Scholar] [CrossRef]
  34. Zafar, A.; Zafar, Z.; Zhao, W.; Jiang, J.; Zhang, Y.; Chen, Y.; Lu, J.; Ni, Z. Sulfur-Mastery: Precise Synthesis of 2D Transition Metal Dichalcogenides. Adv. Funct. Mater. 2019, 29, 1809261. [Google Scholar] [CrossRef]
  35. do Nascimento Barbosa, A.; Mendoza, C.A.D.; Figueroa, N.J.S.; Terrones, M.; Júnior, F.L.F. Luminescence enhancement and Raman characterisation of defects in WS2 monolayers treated with low-power N2 plasma. Appl. Surf. Sci. 2021, 535, 147685. [Google Scholar] [CrossRef]
  36. Shi, W.; Lin, M.-L.; Tan, Q.-H.; Qiao, X.-F.; Zhang, J.; Tan, P.-H. Raman and photoluminescence spectra of two-dimensional nanocrystallites of monolayer WS2 and WSe2. 2D Mater. 2016, 3, 025016. [Google Scholar] [CrossRef] [Green Version]
  37. Zhang, C.; Wang, H.; Chan, W.; Manolatou, C.; Rana, F. Absorption of light by excitons and trions in monolayers of metal dichalcogenide MoS2: Experiments and theory. Phys. Rev. B 2014, 89, 205436. [Google Scholar] [CrossRef] [Green Version]
  38. Lan, C.; Li, C.; Ho, J.C.; Liu, Y. 2D WS2: From Vapor Phase Synthesis to Device Applications. Adv. Electron. Mater. 2021, 7, 2000688. [Google Scholar] [CrossRef]
  39. Safeer, S.H.; Moutinho, M.V.O.; Barreto, A.R.J.; Archanjo, B.S.; Pandoli, O.G.; Cremona, M.; da Costa, M.E.H.M.; Freire, F.L.; Carozo, V. Sodium-Mediated Low-Temperature Synthesis of Monolayers of Molybdenum Disulfide for Nanoscale Optoelectronic Devices. ACS Appl. Nano Mater. 2021, 4, 4172–4180. [Google Scholar] [CrossRef]
  40. Yang, P.; Zou, X.; Zhang, Z.; Hong, M.; Shi, J.; Chen, S.; Shu, J.; Zhao, L.; Jiang, S.; Zhou, X.; et al. Batch solution of 6-inch uniform monolayer molybdenum disulfide catalysed by sodium in glass. Nat. Comm. 2018, 9, 979. [Google Scholar] [CrossRef]
  41. Han, W.; Liu, K.; Yang, S.; Wang, F.; Su, J.; Jin, B.; Li, H.; Zhai, T. Salt-assisted chemical vapor deposition of two-dimensional materials. Sci. China Chem. 2019, 62, 1300–1311. [Google Scholar] [CrossRef]
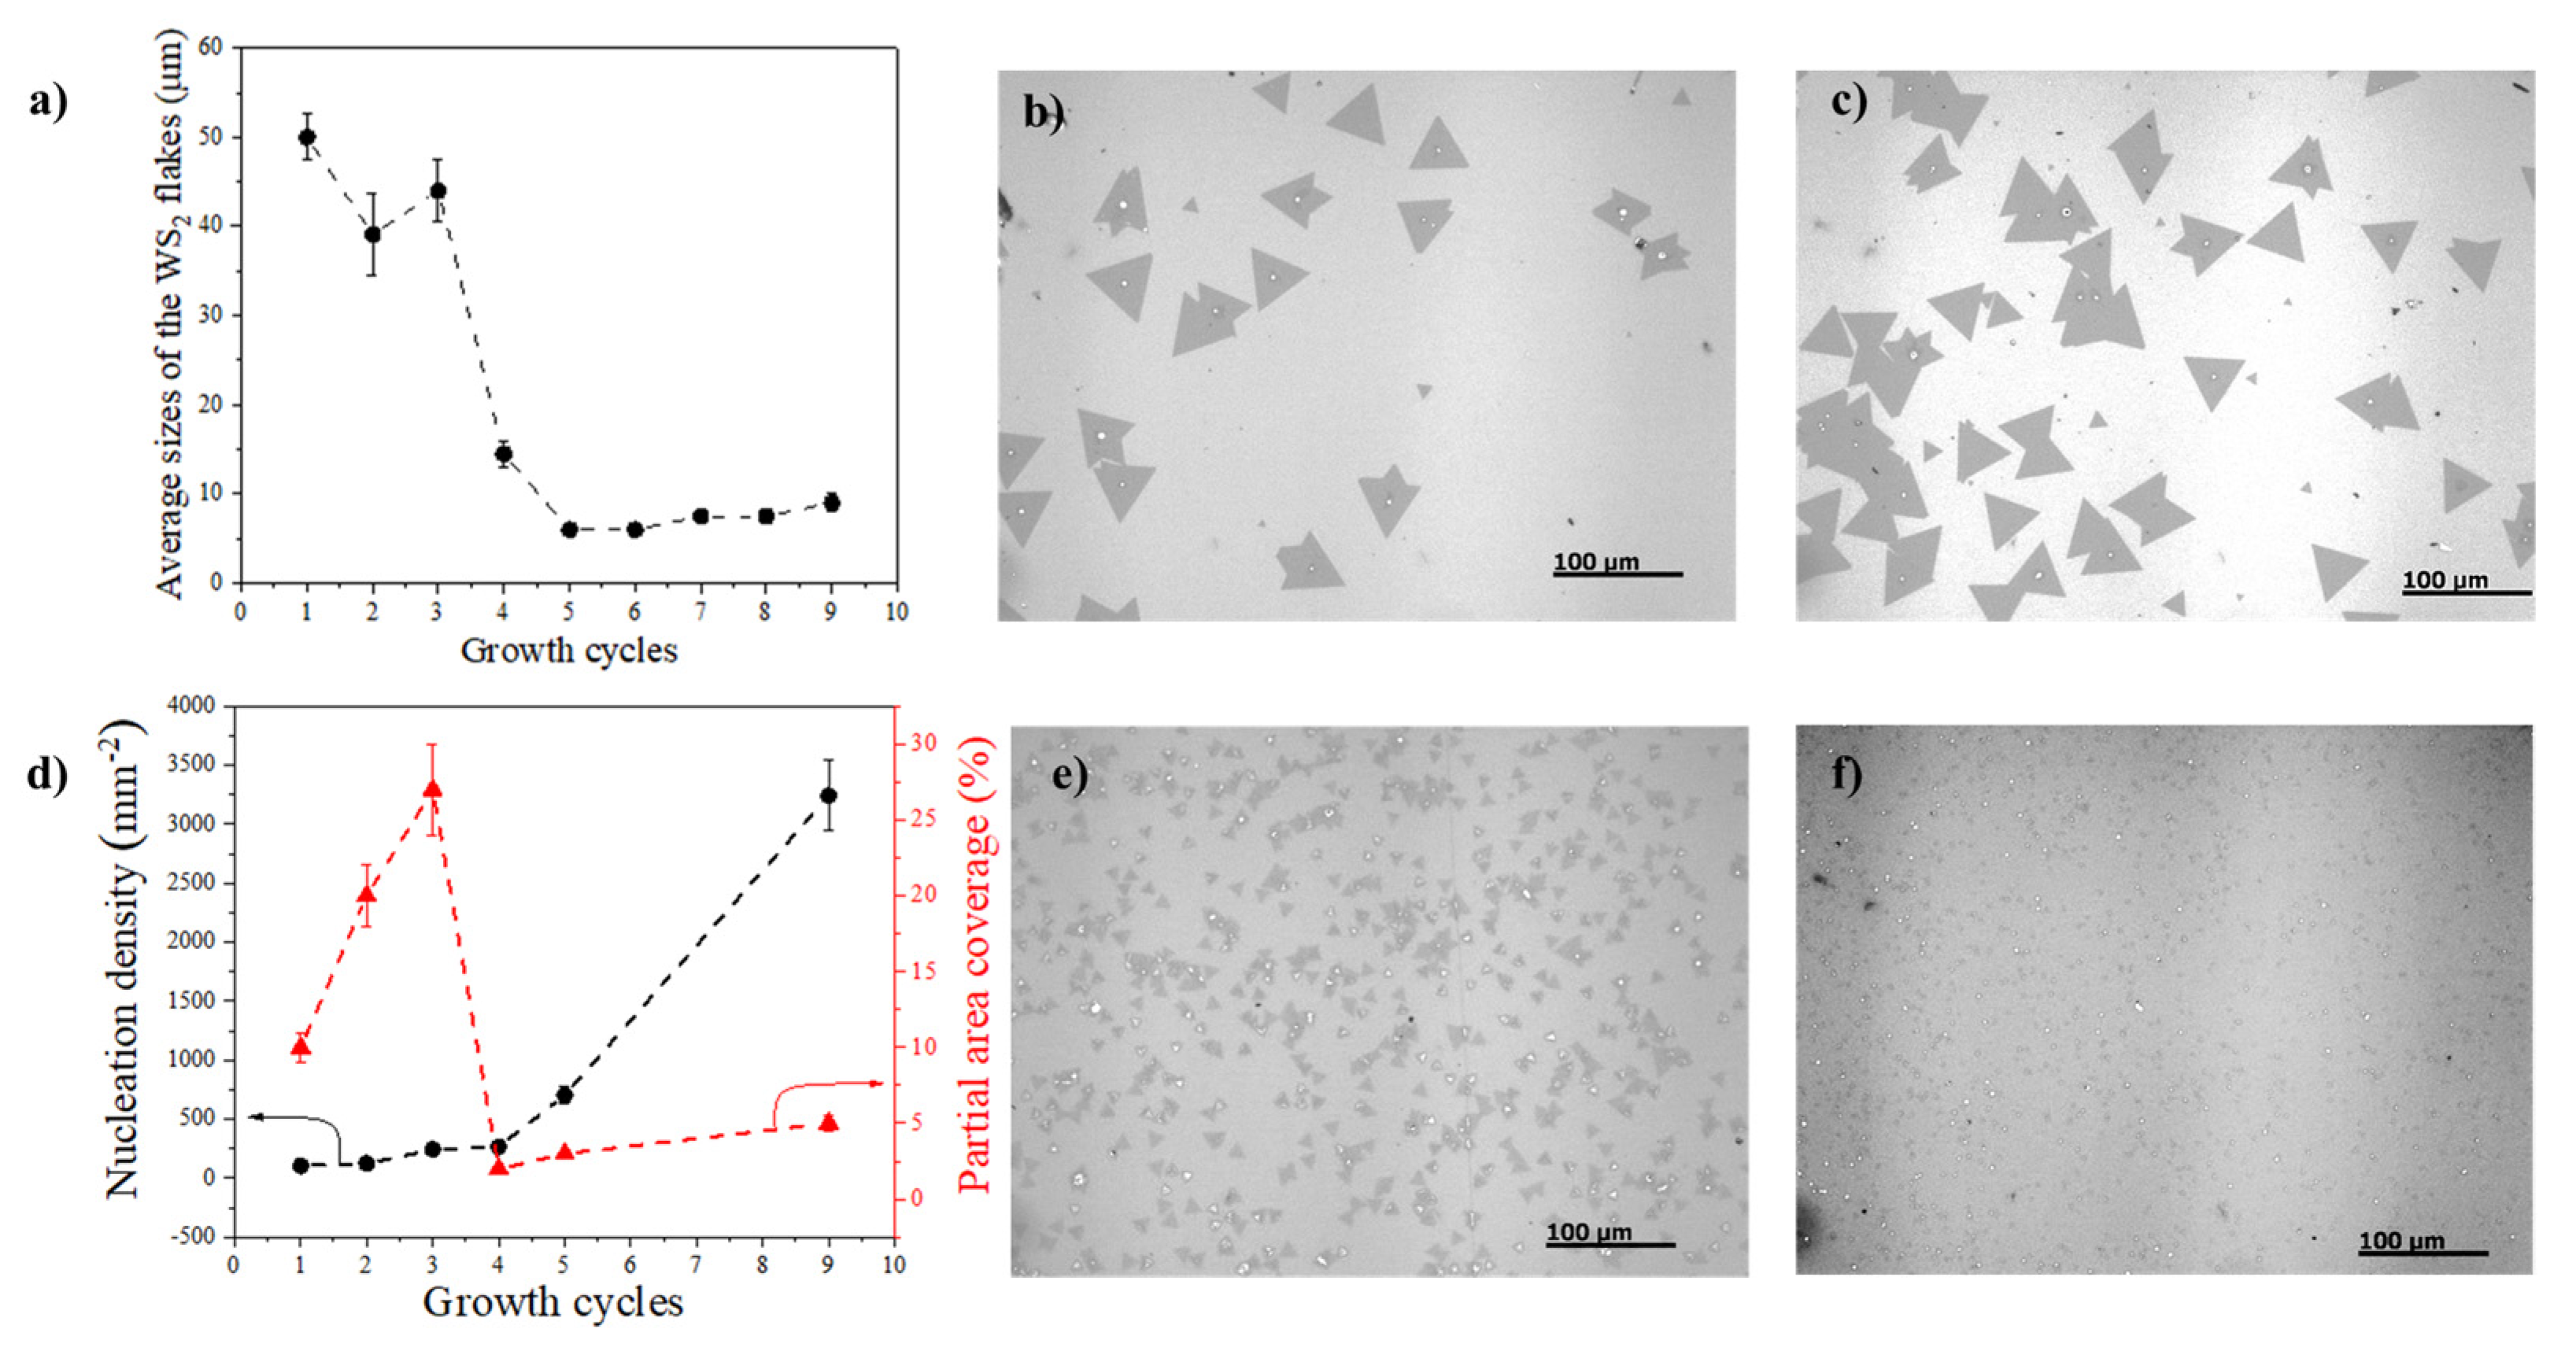
Figure 1. WS2 size trend and the nucleation density with the number of growth cycles. (a) Averages sizes of the WS2 triangles as a function of the number of growth cycles. Optical images of growth cycles: (b) first, (c) third, (e) fourth and (f) ninth growth cycles. (d) Nucleation density and area coverage as functions of the number of growth cycles. Black and red arrows indicate the axis related to every plot.
Crystals 12 00835 g001
Figure 2. Raman characterization of WS2. (a) Raman spectra of WS2 at different growth cycles obtained by APCVD; (b) the deconvolution of the Raman spectrum of WS2 obtained at the third growth cycle. The spectra shown in (a,b) were obtained with a 473 nm excitation laser. (c) Raman spectrum of the low-frequency region of WS2 grown at the third cycle; (d) LA(M)/A1g(M)−LA(M) area ratio as a function of the number of cycles. Data shown in (c,d) were acquired with a 532 nm excitation laser.
Crystals 12 00835 g002
Figure 3. Photoluminescence characterization for different samples of WS2. (a) Comparison between the PL spectra of the first five growth cycles and the ninth growth cycles, showing the evolution of intensity and dislocation in the position of the absolute peak (~1.95 eV). (b) The PL intensity is a function of the number of growth cycles. The spectra shown in this figure were obtained with a 473 nm excitation laser.
Crystals 12 00835 g003
Figure 4. Map and spectrum of photoluminescence for third and fifth growth cycles beyond AFM images. (a,b) Deconvolution of the PL peak in the sample’s two main contributions (neutral exciton and trion) corresponding to the third and fifth growth cycles. (c,d) PL maps for the third and fifth growth cycle samples, respectively. The white scale bar of the image in (c) is 10 µm, and that of the image in (d) is 1.2 µm. Topographic images obtained using AFM: (e) third and (f) fifth growth cycles. Data shown in (ad) were obtained with a 473 nm excitation laser.
Crystals 12 00835 g004
Figure 5. XPS measurements on the alumina crucible surface. High-resolution spectra of the W4f peak were obtained for different growths: (a) virgin crucible; (b) after the first growth, showing the presence of the reduced tungsten oxide; (c,d) after the third and ninth growths.
Crystals 12 00835 g005
Figure 6. SEM images of the alumina crucible surface: (a) virgin alumina crucible and (b) the same crucible after nine growth cycles.
Crystals 12 00835 g006
Table 1. PL characteristics.
Growth CyclesNeutral ExcitonTrionX0/XT Ratio
Position (nm)FWHM (10−2eV)CCD Mean Intensity (103 Counts)Position (nm)FWHM (10−2eV)CCD Mean Intensity (103 Counts)
1636.9813.23.8647.2820.01.03.57
2636.6514.16.4647.619.21.73.79
3635.9912.610.4645.920.02.64,00
4637.6516.20.8649.6020.00.32.32
5638.3117.80.4656.2520.00.21.69
Table 2. The relative concentration of the contributions of the W4f peak for conditions different from the crucible’s surface; +5 is associated with the oxide state of W (suboxide), while +6 is related to the oxide state of W in WO3.
CrucibleConcentration Relative % Ratio
W 4f
Oxidation state (+5)Oxidation state (+6)Loss features(+6)/(+5)
Virgin crucible000---
Firth growth100000
Third growth75214.00.28
Ninth growth71254.00.35
Publisher’s Note: MDPI stays neutral with regard to jurisdictional claims in published maps and institutional affiliations.