Article

Experimental Investigation and Prediction of Mechanical Properties in a Fused Deposition Modeling Process

by
Amanuel Diriba Tura
1,
Hirpa G. Lemu
2,* and
Hana Beyene Mamo
1
1
Faculty of Mechanical Engineering, Jimma University, MVJ4+R95 Jimma, Ethiopia
2
Faculty of Science and Technology, University of Stavanger, N-4036 Stavanger, Norway
*
Author to whom correspondence should be addressed.
Crystals 2022, 12(6), 844; https://doi.org/10.3390/cryst12060844
Submission received: 15 May 2022 / Revised: 13 June 2022 / Accepted: 13 June 2022 / Published: 15 June 2022

Abstract

:
Additive manufacturing, also known as three-dimensional printing, is a computer-controlled advanced manufacturing process that produces three-dimensional items by depositing materials directly from a computer-aided design model, usually in layers. Due to its capacity to manufacture complicated objects utilizing a wide range of materials with outstanding mechanical qualities, fused deposition modeling is one of the most commonly used additive manufacturing technologies. For printing high-quality components with appropriate mechanical qualities, such as tensile strength and flexural strength, the selection of adequate processing parameters is critical. Experimentally, the influence of process parameters such as the raster angle, printing orientation, air gap, raster width, and layer height on the tensile strength of fused deposition modeling printed items was examined in this work. Through analysis of variance, the impact of each parameter was measured and rated. The system’s response was predicted using an adaptive neuro-fuzzy technique and an artificial neural network. In Minitab software, the Box-Behnken response surface experimental design was used to generate 46 experimental trials, which were then printed using acrylonitrile butadiene styrene polymer materials on a three-dimensional forge dreamer II fused deposition modelling printing machine. The results revealed that the raster angle, air gap, and raster width had significant impacts on the tensile strength. The adaptive neuro-fuzzy approach and artificial neural network predicted tensile strength accurately with an average percentage error of 0.0163 percent and 1.6437 percent, respectively. According to the findings, the model and experimental data are in good agreement.

1. Introduction

Additive manufacturing is a novel technology that uses a layer-based production method to create a product straight from a computer-aided design model (CAD) model. Fused deposition modeling (FDM) is one of several three-dimensional (3D) printing techniques that employ flexible thermoplastic filament injected through a heated nozzle to build components. The thermoplastics and reinforced thermoplastic materials that can be printed with FDM include acrylonitrile butadiene styrene (ABS), polylactic acid (PLA), polycarbonate, unfilled polyetherimide (PEI), Polyether ether ketone (PEEK), Polyethylene terephthalate glycol (PETG), and fiber-reinforced thermoplastics. FDM-produced components are increasingly displacing conventional components in a variety of industries, including the automotive, aviation, and medical sectors [1,2,3,4,5]. The process variables and their settings have a substantial impact on the mechanical qualities of FDM-printed components. As a result, enhancing the mechanical qualities of printed components requires analyzing the effects of input factors and anticipating results by using adequate settings [6,7,8,9].
Several studies and predicted models of the impact of printing settings on the mechanical qualities of FDM components have been conducted by various scholars using various approaches such as the adaptive neuro-fuzzy technique (ANFIS), artificial neural network (ANN), response surface method (RSM), analysis of variance (ANOVA), group method for data handling (GMDH), and differential evolution (DE). According to Zhou, et al. [10], the infill density and printing pattern, for example, had a substantial impact on the tensile strength of polylactic acid FDM-printed components. Gebisa and Lemu [11] investigated the impact of process factors such as air gap, raster size, raster angle, contour quantity, and contour width on the tensile characteristics of components manufactured using the FDM technique and ULTEM 9085 polymeric material. According to their research, the raster angle has a significant effect on tensile properties. Byberg, et al. [12] looked at how layer alignment and build direction influenced the mechanical qualities of ULTEM 9085 thermoplastic. According to their results, the layer orientations and construction directions had a huge impact on the mechanical characteristics of the polymer.
The impact of principal directions, inclination angle, and air separation on the flexural characteristics of ULTEM 9085 fabricated by using the FDM technique with both solid and sparse building methods was examined by Motaparti, et al. [13]. Their study revealed that vertical (edge) designs had a greater elastic yield point than horizontal ones. According to Gebisa and Lemu [14], raster angle and width have a significant impact on the ULTEM 9085 polymer’s flexible pavements. The impact of process parameters (layer height and printing speed) on the mechanical characteristics of 3D-printed ABS composite was investigated by Christiyan, et al. [15]. They revealed that the material’s optimal tensile and flexural strength were achieved while using a low production speed and a minimal layer height. Hsueh, et al. [16] studied how FDM process factors impacted the mechanical characteristics of PLA and PETG materials (printing temperatures and rates). The results reveal that when the printing temperature increases, the PLA and PETG materials’ mechanical characteristics (tension, compression, and bending) are enhanced. Furthermore, when manufacturing speed rises, the PLA material’s mechanical behavior improves while the mechanical features of the PETG material deteriorate. According to Enemuoh, et al. [17], infill density has a significant impact on the tensile properties of the FDM component, followed by layer, speed, and infill patterns. Hsueh, et al. [18] investigated the impact of printing temperature and infill rate on the mechanical characteristics of FDM-printed PLA components using tensile and Shore D hardness tests. Raising the infill proportion or printing temperature, according to their results, could dramatically improve the material’s longitudinal elastic modulus, ultimate strength, elasticity, and Shore hardness.
Patil, et al. [19] evaluated the tensile and flexural strength of FDM-printed PLA components using experimental testing and finite element analysis. Using 33 trials and result data, Manoharan, et al. employed ANN to develop mathematical models for predicting the tensile properties of FDM-made PLA components. The observed tensile strength results were compared to the anticipated values using the RSM, ANN, and ANOVA findings. Pazhamannil and Govindan [20] used an artificial neural network to estimate the tensile properties of FDM-printed items at various nozzle temperatures, layer thicknesses, and infill rates. Rayegani and Onwubolu [21] used DE and the GMDH to predict and optimize the link between FDM component strength properties and operating parameters (part alignment, inclination angle, raster size, and air gap). Srinivasan, et al. [22] employed response surface methodology to predict and optimize the impact of process factors on tensile properties of FDM-produced ABS components.
According to the literature, pre-processing settings have a considerable effect on the mechanical features of FDM-produced parts. It was also crucial to examine the combined influence of FDM settings on the mechanical features of produced components. As a result, five crucial pre-processing parameters (raster angle, printing orientation, air gap, raster width, layer height) were chosen as inputs for the current study: The tensile strength characteristics (UTS) were selected as the output response. Furthermore, the application of ANFIS and ANN was used to predict the response output, validated with experimental results.

2. Materials and Methods

2.1. 3D Printer and Materials

A Flash Forge Guider II 3D printer was used to create the specimens in this study. The build envelope of the printer measures 280 × 250 × 300 mm3 and can generate components with 0.2 mm accuracy. The 3D printer’s characteristics are shown in Table 1. The study employed ABS printing materials since it is a strong thermoplastic and a typical FDM material. ABS is best suited for parts that require strength and flexibility, such as car components or household appliances. ABS is synthesized using three monomers: acrylonitrile, butadiene, and styrene, in an emulsion or continuous mass process. Acrylonitrile is a chemically resistant and thermally stable synthetic monomer made from propylene and ammonia that is used to make ABS. Butadiene is a by-product of ethylene synthesis from steam crackers that gives ABS polymer hardness and impact strength. ABS plastic gets its stiffness and processability from styrene, which is made by dehydrogenating ethyl benzene. Acrylonitrile butadiene styrene has the chemical formula C8H8·C4H6·C3H3N [23,24,25,26]. ABS has a low melting point, which enables it to be easily used in 3D printing. It is very resistant to physical impacts and chemical corrosion, which allows the finished plastic to withstand heavy use and adverse environmental conditions [27,28]. The mechanical properties of the printing materials are shown in Table 2.

2.2. Experimental Design

According to the literature, the mechanical characteristics of FDM-produced components are highly impacted by process parameters. It was also vital to examine the combined effects of FDM parameters on the mechanical characteristics of the produced components. As a result, five crucial process parameters were chosen as inputs for this research: raster angle, orientation angle, air gap, raster width, and layer height with three levels. The values of each element were adjusted according to machine manufacturer recommendations. Table 3 lists the process parameters and their ranges that were explored during this study. The other parameters were retained at their default settings. A total of 46 experiments were utilized, based on the Box–Behnken response surface experimental design, which depends on the number of input variables, and their levels as shown in Table 4.

2.3. Specimen Fabrication

The test specimen was 3D modeled using CATIA V5 software, as per the criteria. The stereo lithography (STL) format is used to save the CAD file, which is then transferred to the slicer for separation into the needed number of layers. Using flash print slicing software, the printing settings are also included. The slicer then transforms the STL file to a G-code file, which the printers use to begin layer-by-layer fabrication of the specimen. The tensile test specimens were made according to the American Society for Testing and Materials (ASTM) D638-I standard. The length, width, and thickness of ASTM D638-I are 165 × 13 × 3.2 mm as shown in Figure 1.

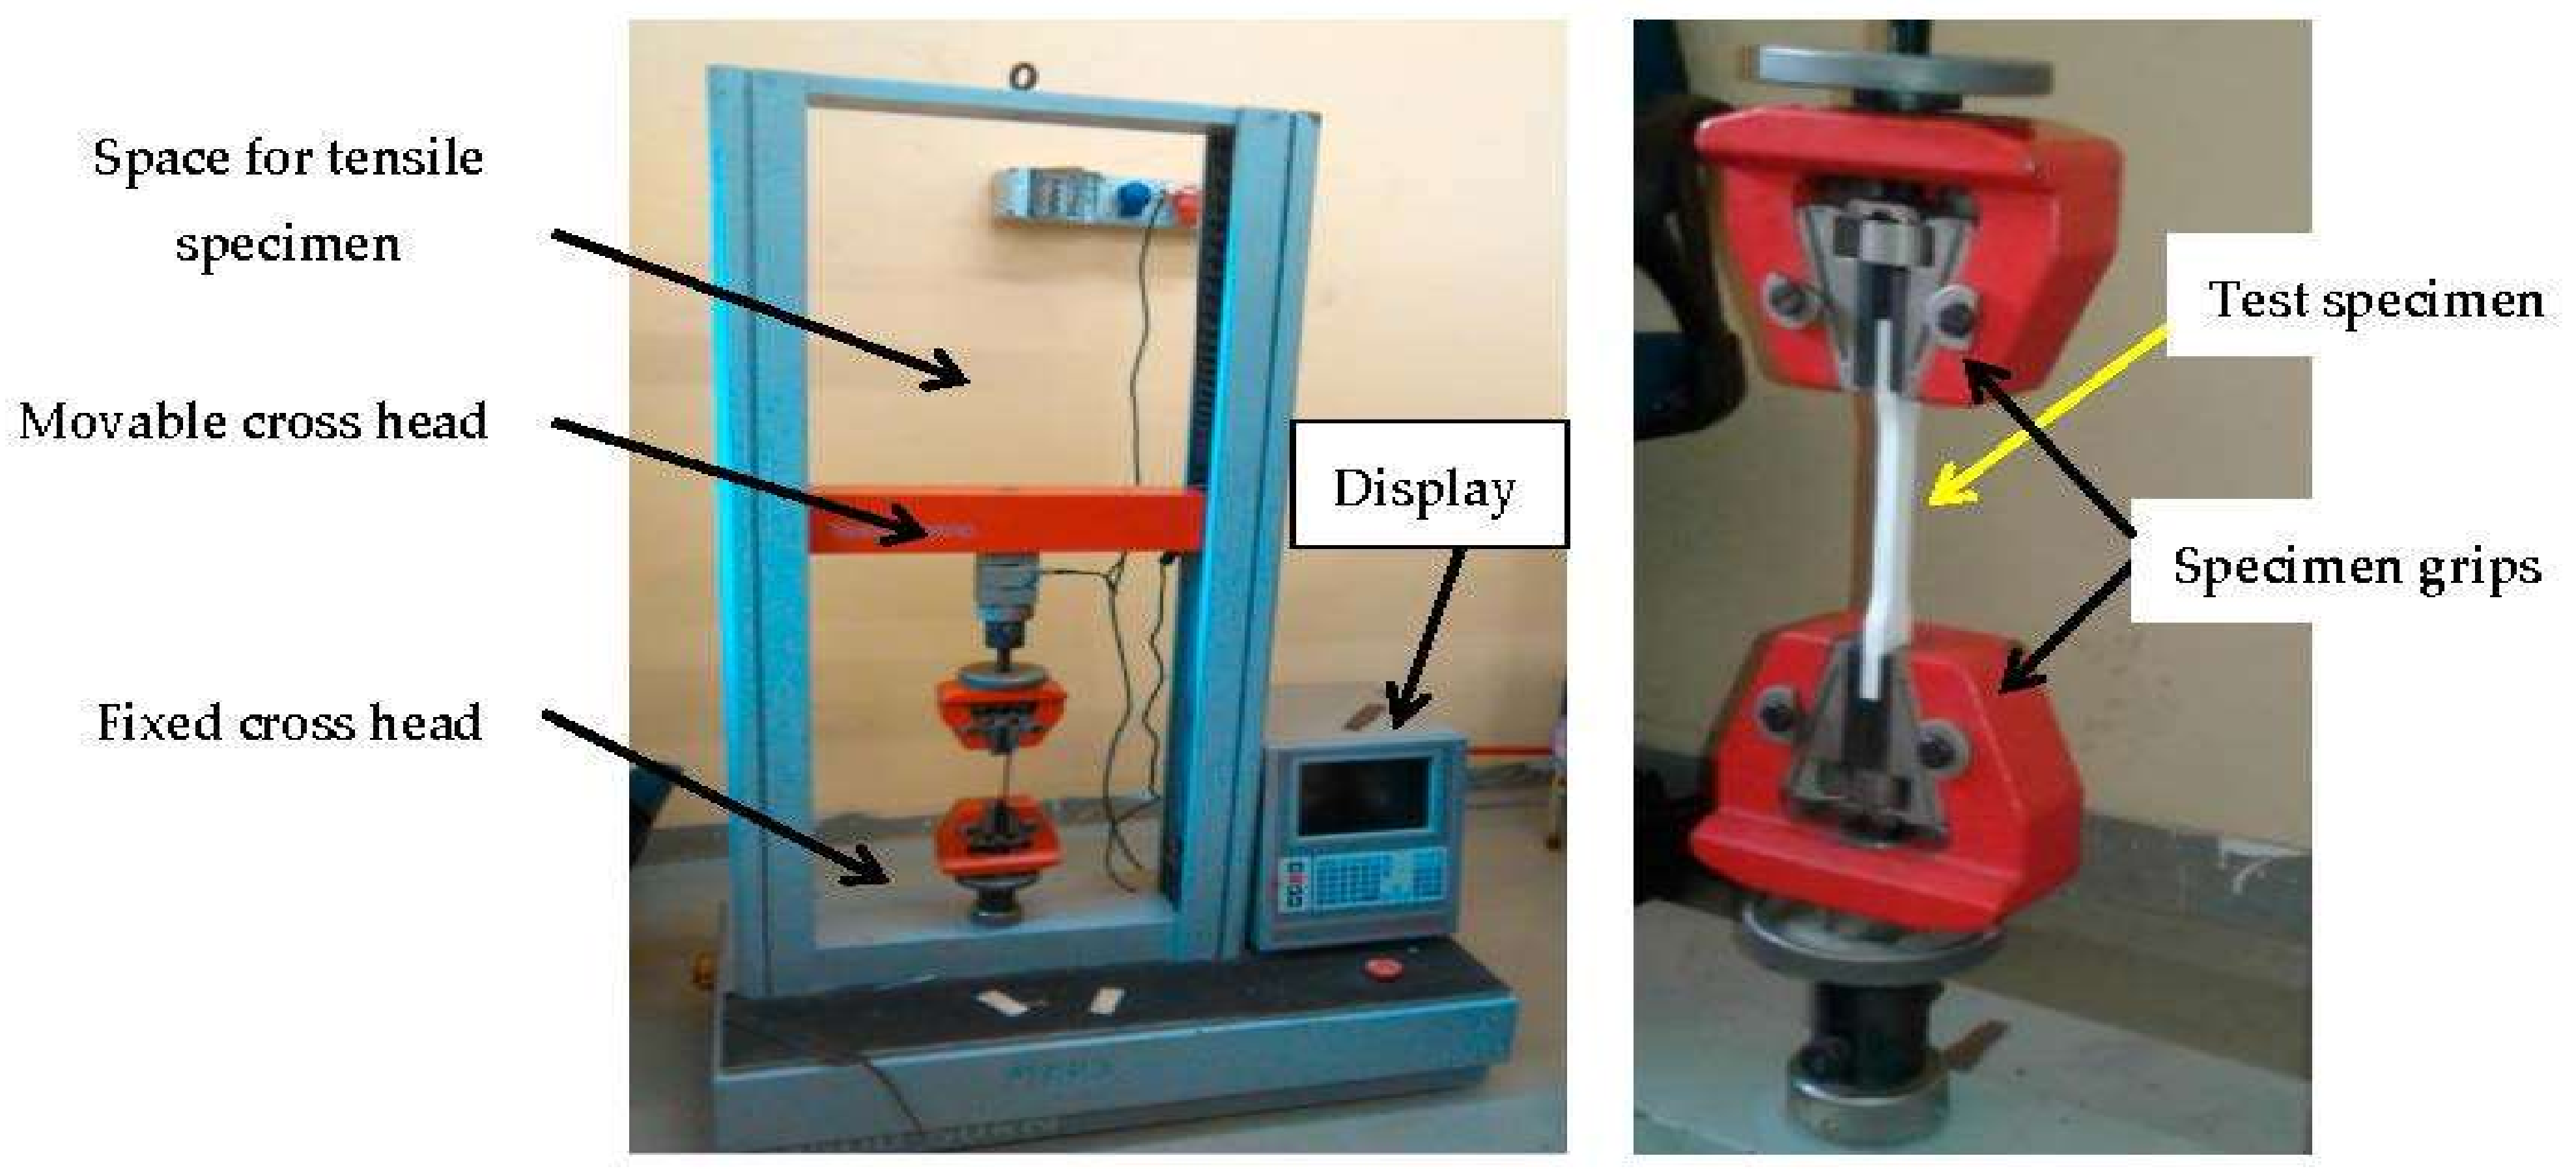
2.4. Experimental Procedure

The universal testing equipment was used to assess the tensile strength of ABS specimens that had been conditioned according to the ASTM D638 standard as shown in Figure 2. The top grip moved at a continuous rate of 2.5 mm/min with a maximum load of 100 KN and a 5 Hz signal sampling rate. The built-in program recorded the elongation and force load data. When the specimen elongates or fractures by more than 2.5 percent, the ASTM D638 test is completed. The tensile strength is calculated from the breaking load and is divided by the initial cross section area according to Equation (1). In this study, 46 experimental tests were conducted with two replications, and no differences between the two replications were observed (presented in Table 4).
Tensile strength (UTS)   =   Breaking load(Pf) orignal cross sectional area(Ao)

2.5. Adaptive Neuro-Fuzzy Modeling

The architecture and learning approach of neuro-fuzzy techniques (also known as an adaptive neuro-fuzzy model) was initially developed by Jang [29]. ANFIS is a powerful approach that integrates neural networks’ optimization and learning skills with the reasoning capabilities of fuzzy logic linguistic IF–THEN rules, which are made up of membership functions (MF). It combines the benefits of fuzzy logic with artificial neural networks. The ANFIS model is especially beneficial when data are inconsistent or nonlinear and established methodologies fail or are too difficult to apply with greater precision [30,31,32,33,34].
In this study, the ANFIS model was stimulated using the fuzzy inference system concept as a five-layered neural network. The parameters of the ANFIS model are listed in Table 5. MATLAB R2019a software was used to run the simulations. The first and last levels of the ANFIS structure and layer indicate the respective input variables (raster angle, orientation angle, air gap, raster width, and layer height) and output variable (tensile strength), as shown in Figure 3. In the second layer, the model employed first-Sugeno inference systems, which turn input parameters into membership values using membership functions called fuzzification. The model output is then deduced using a set of logical rules in the third layer.

2.6. Artificial Neural Network Modeling

Artificial neural networks (ANNs) are computational models based on the organic neural networks in the human brain. An ANN is used to mimic non-linear situations and predict output values using training data. Input and output layers, as well as multiple hidden layer neurons, comprise an ANN structural network [35,36,37]. ANN uses samples of data rather than the whole data set available in the system for quick prediction, saving money and time. ANNs can be easily replaced by existing data analysis systems [38].
The ANN model was used to train and assess the 3D printing data models. An input layer with five inputs, a hidden layer with feed-forward conditions added, and one output layer were created using MATLAB as shown in Figure 4. The experimental data from Table 4 were used to train the network. The parameters of the ANN model are listed in Table 6. Figure 4 depicts the ANN architecture and learning variables used in this investigation.

3. Results and Discussion

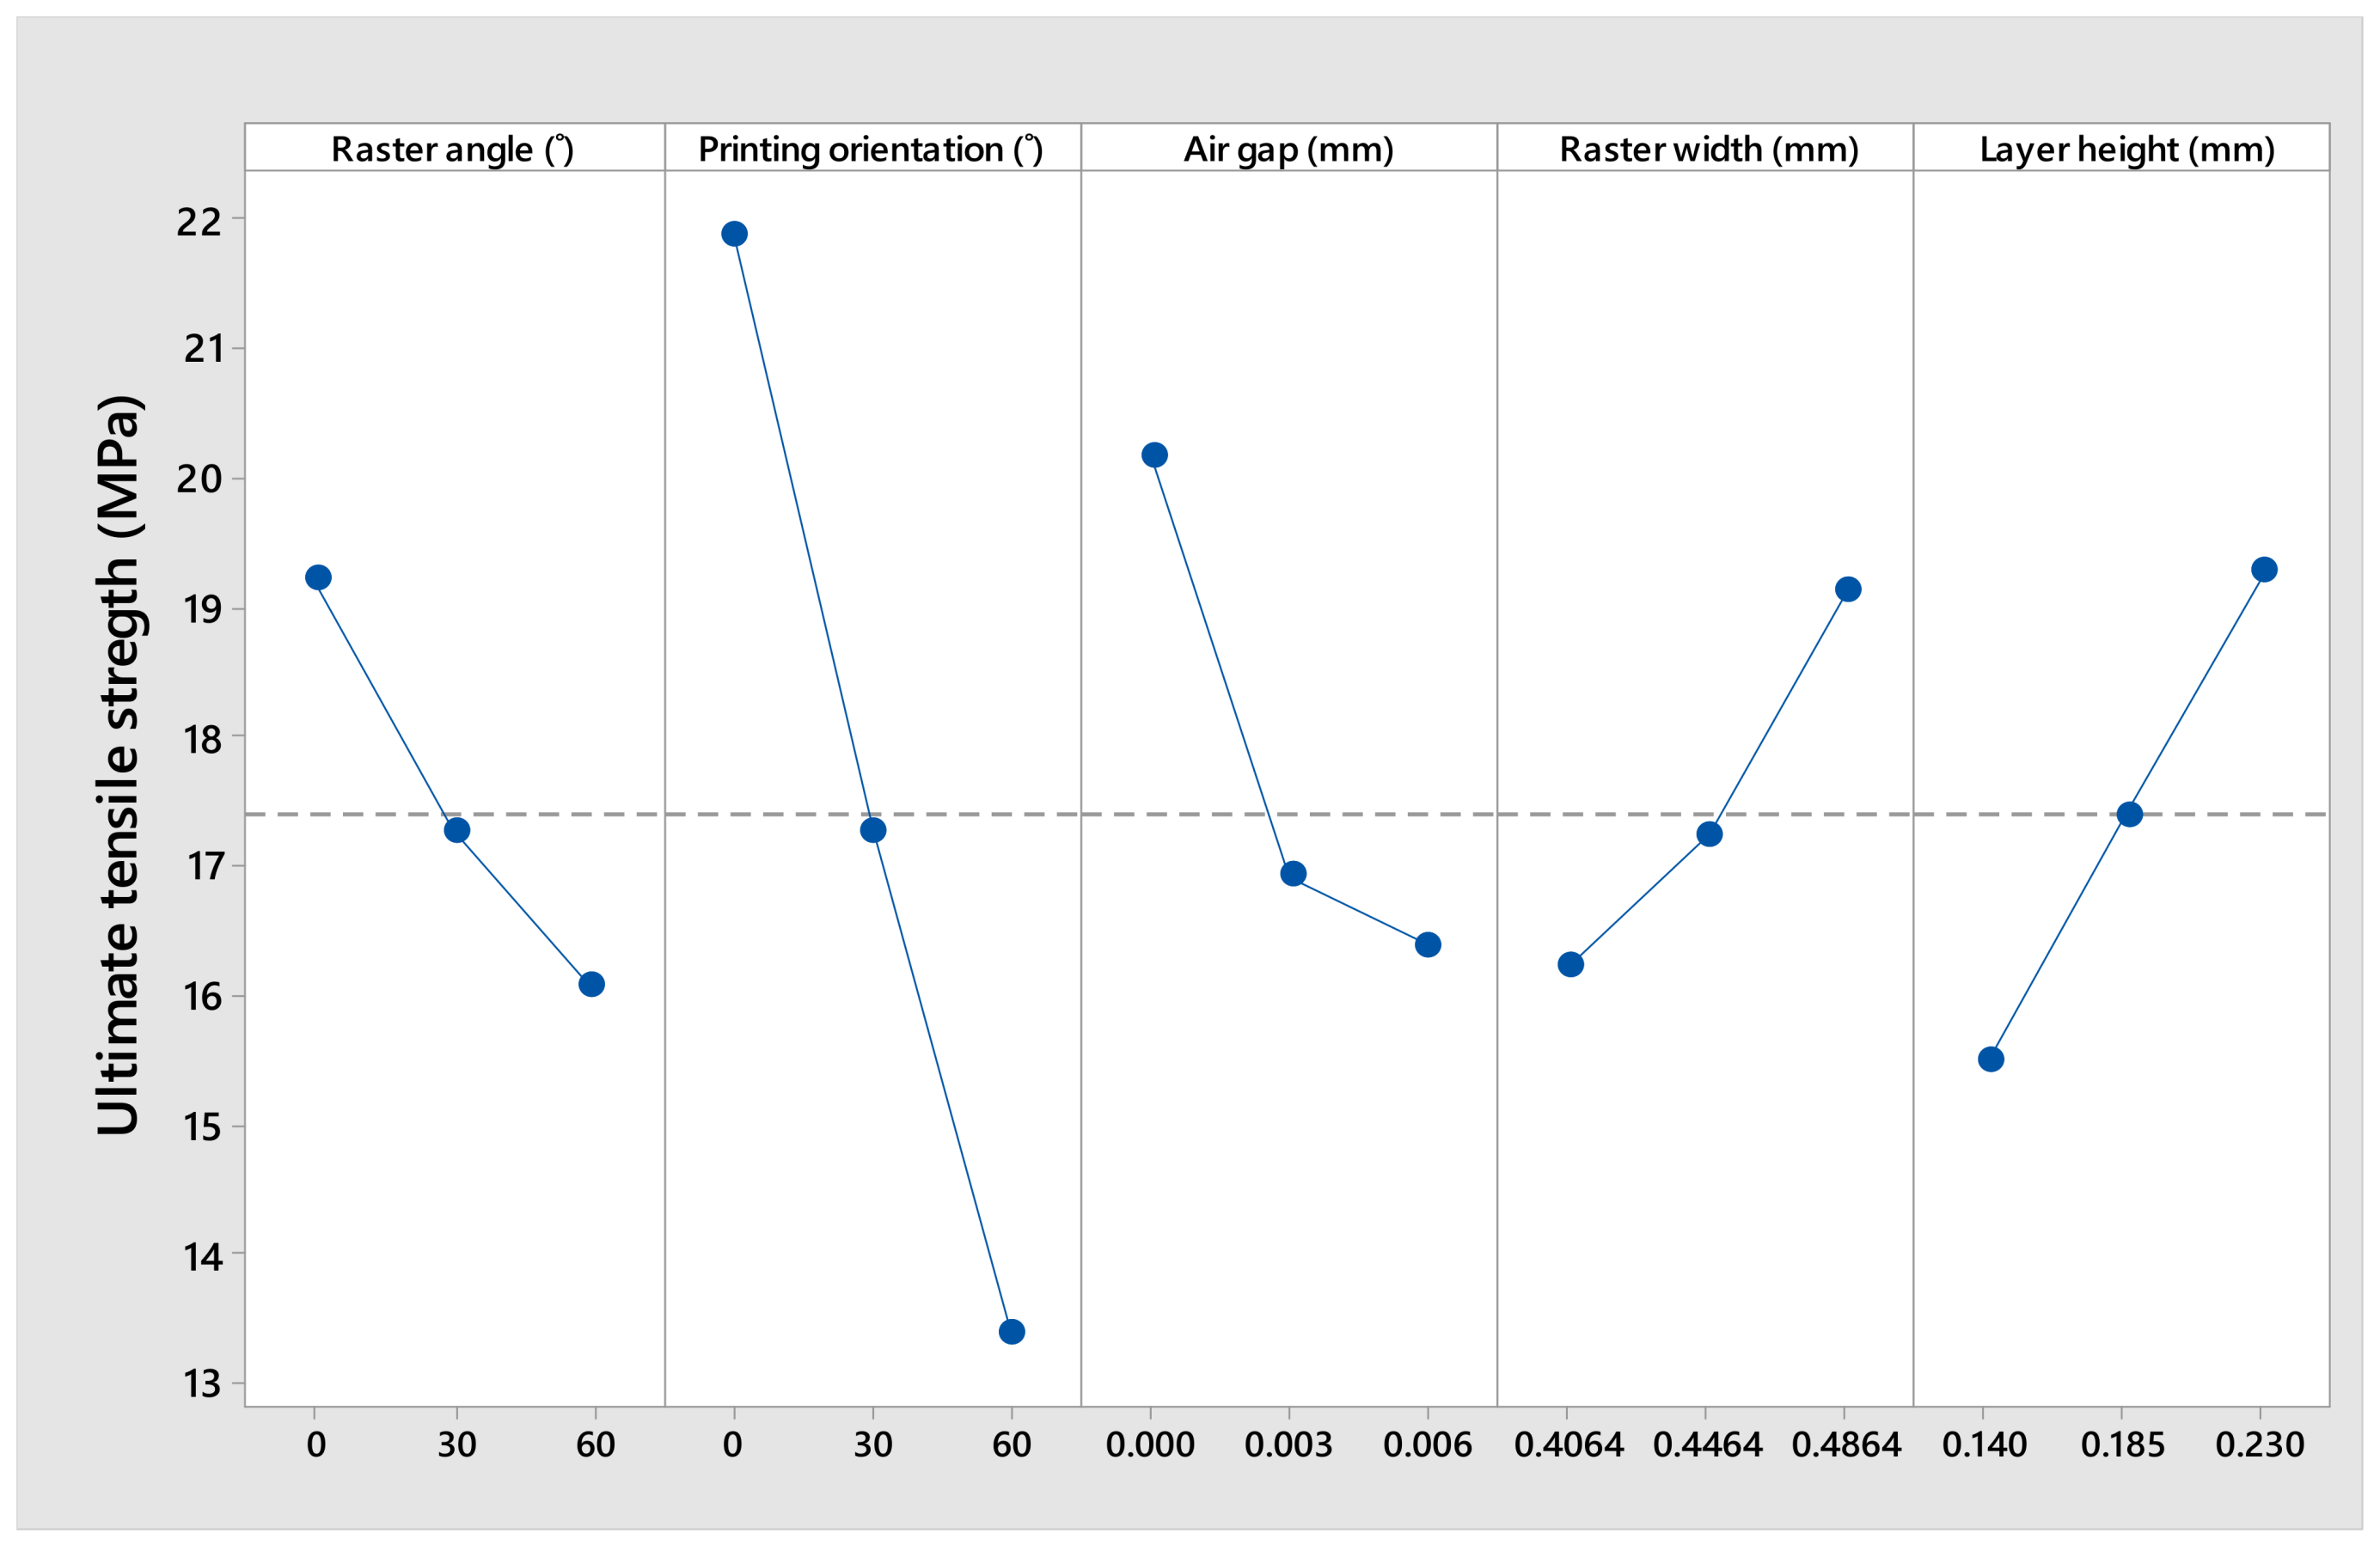
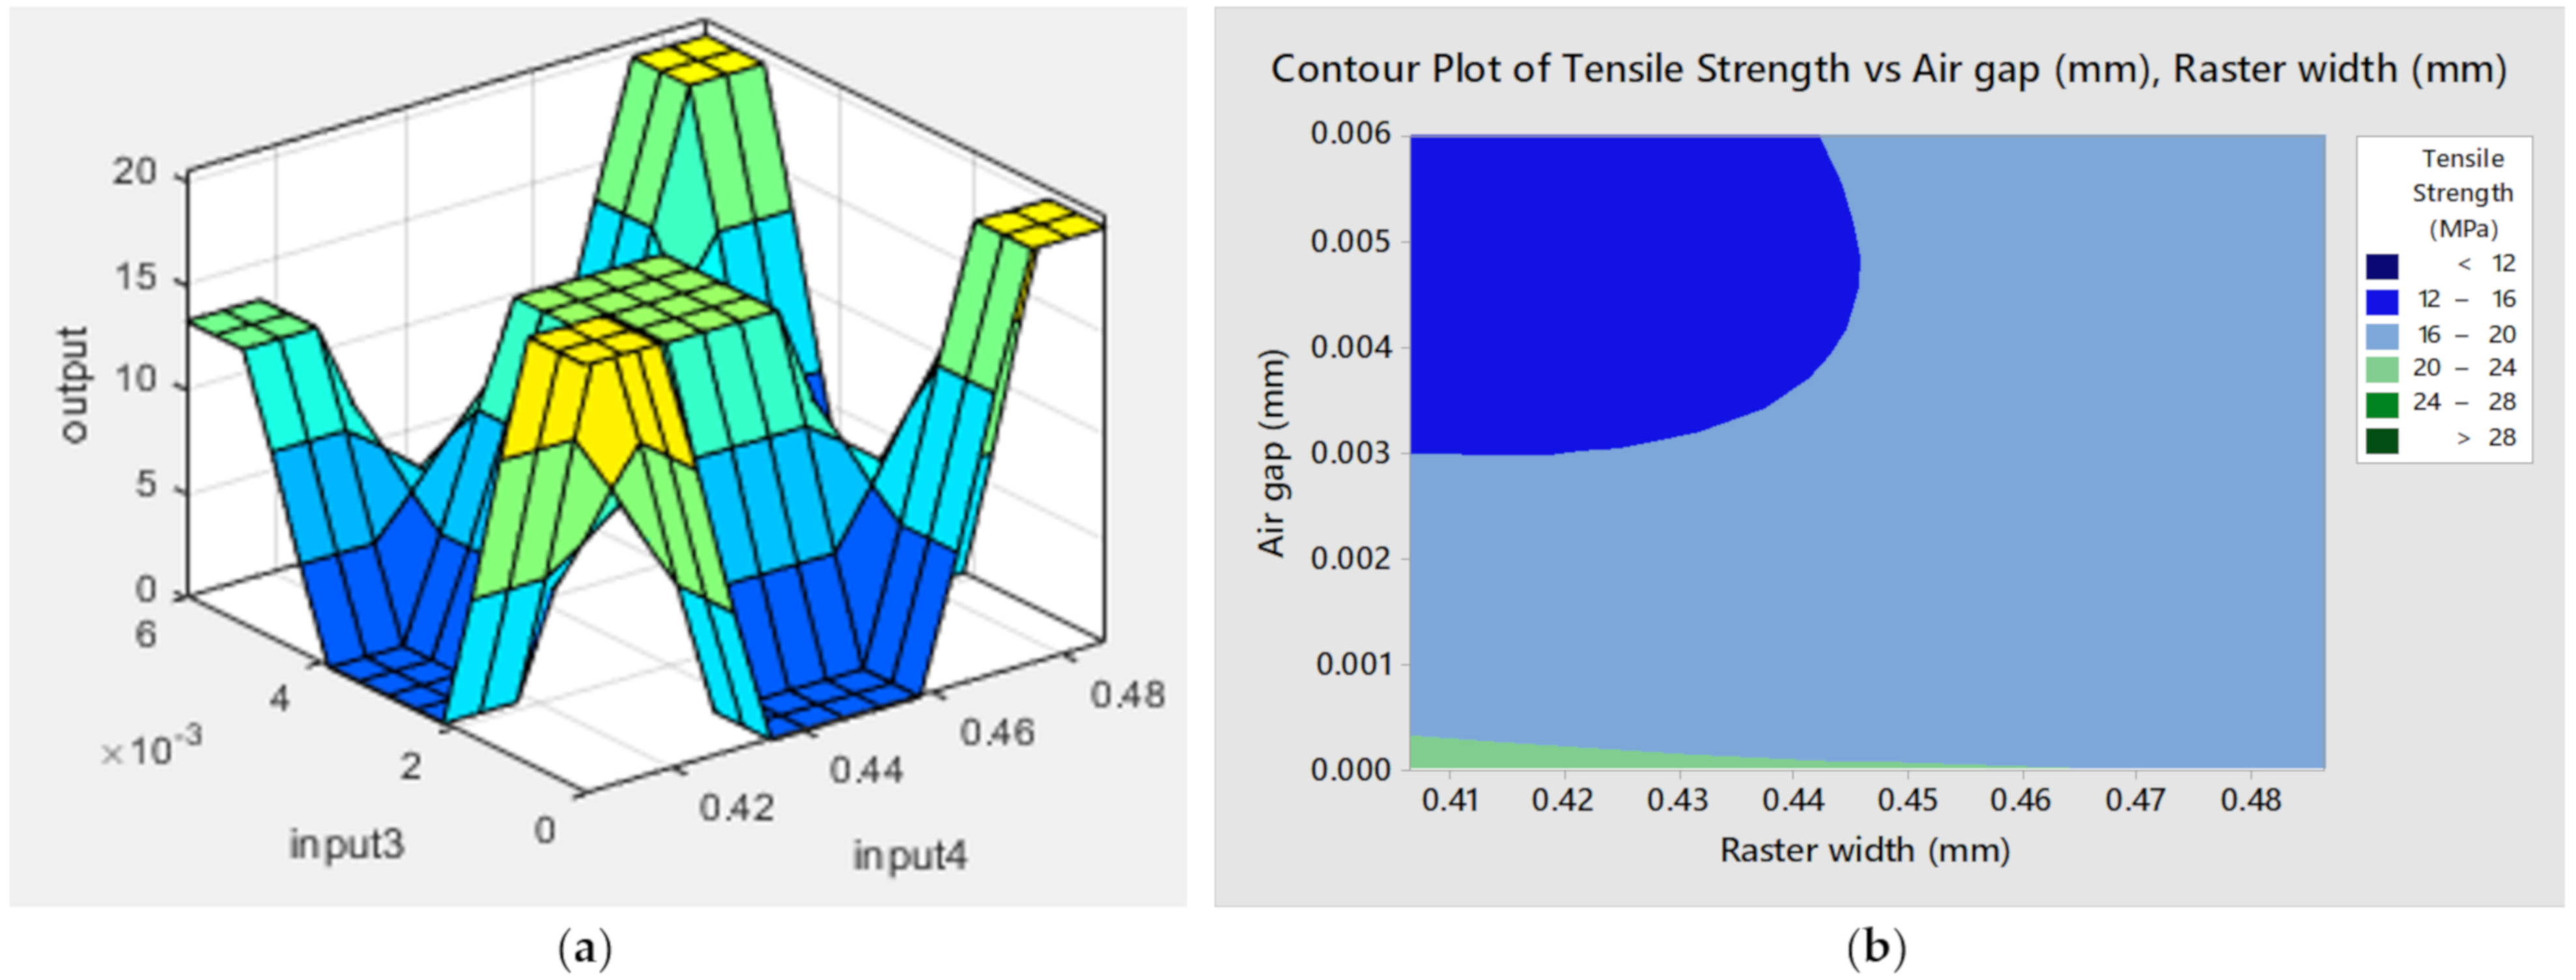
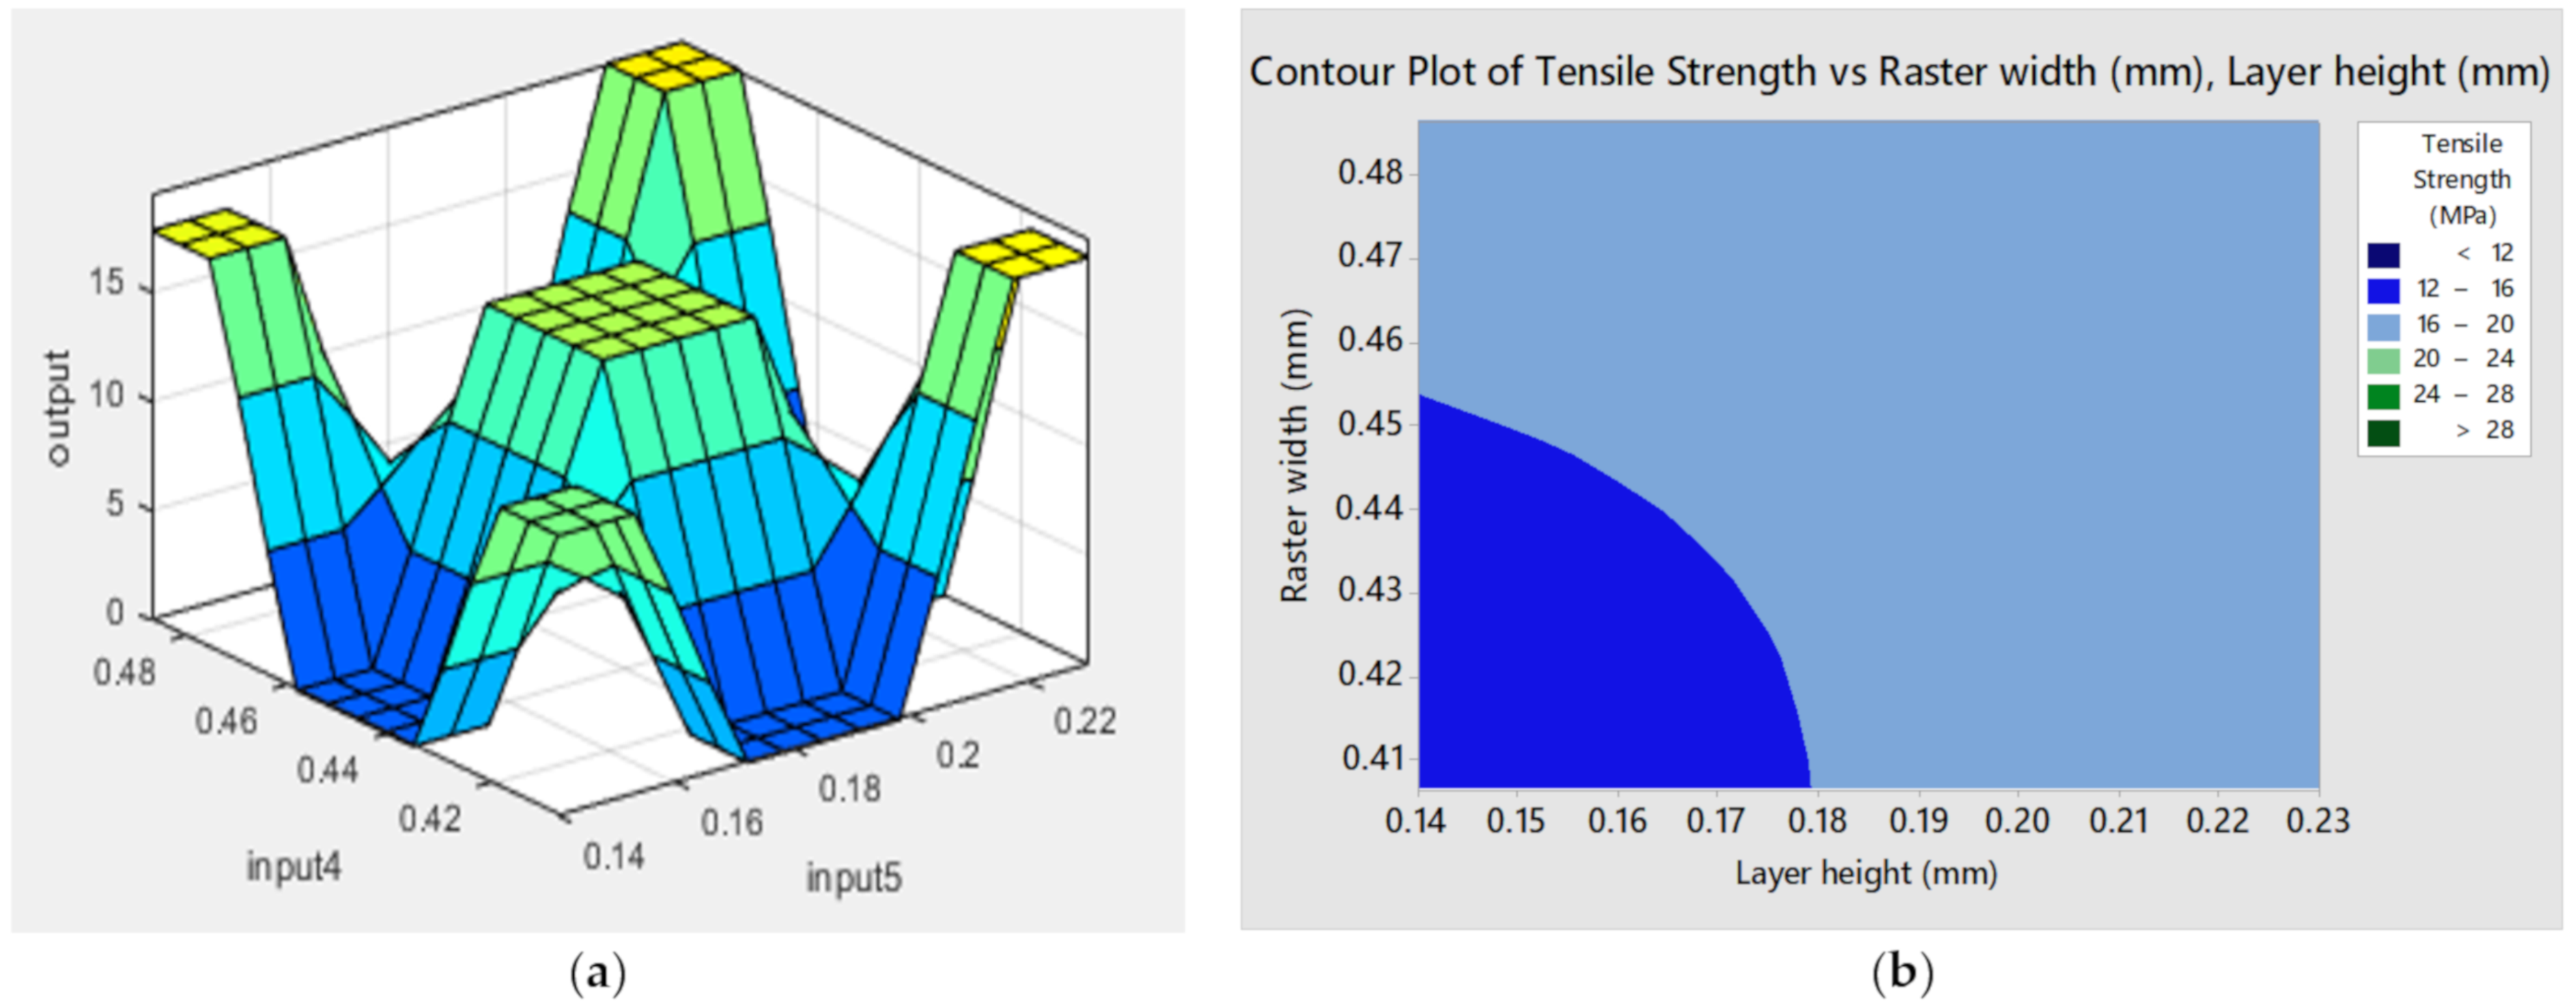
3.1. Effect of Process Parameters on Tensile Strength

Analysis of variance (ANOVA) was used to examine the results for tensile characteristics in order to explore the major factors that influence the quality measures. Factors with a very modest probability (Prob. > F-value less than 0.05) are considered significant in the ANOVA table, whereas factors with a probability (Prob. > F-value) larger than 0.1 are considered inconsequential. Furthermore, larger F-values and lower p-values have a greater impact on the performance characteristics derived from designed process parameters. Table 7 shows the ANOVA of each process parameter with respect to the ultimate tensile strength of ABS parts, where A is the raster angle, B is the printing orientation, C is the air gap, D is the raster width, and E is the layer height. According to the ANOVA table (Table 7), printing orientation, layer height, raster angle, and layer height combinations, the air gap and layer height combinations are insignificant factors that impact the ultimate tensile strength of ABS components. Since the p-values of the raster angle, printing orientation, raster width, air gap, and their combinations are less than 0.05, they have a significant impact on the UTS of ABS-printed parts.
Figure 5 illustrates the main effects plot for UTS, which shows how UTS vary depending on the inputs. The mean UTS value started to decrease with increasing raster angle, printing orientation, and air gap, as shown in this main effect graph. The UTS also improved as the raster width and layer height started escalating. According to the main effects plot shown in Figure 5, a lower raster angle, printing orientation, air gap, and higher raster width and layer height would result in enhanced UTS.
Figure 6, Figure 7 and Figure 8 show 3D and contour graphs depicting the impact of both of the input factors on the ultimate tensile strength. In these figures, blue-colored zones represent very low and low levels, green zones reflect low–medium, medium, and high–medium levels, while yellow zones represent high and very high volumes. The effect of raster angle (input 1) and printing orientation (input 2) on the UTS is shown in Figure 6. It shows that lower raster angles and printing orientation led to increased UTS values. Figure 7 depicts the influence of the air gap (input 3) and raster width (input 4) on the UTS in a similar way, showing that reduced air gaps and larger raster widths yielded higher UTS values. These interaction graphs also show that raster width had a moderate influence on UTS. The effects of raster width (input 4) and layer height (input 5) on the UTS are also shown in Figure 8. Higher UTS values were achieved when the raster width and layer height were increased.

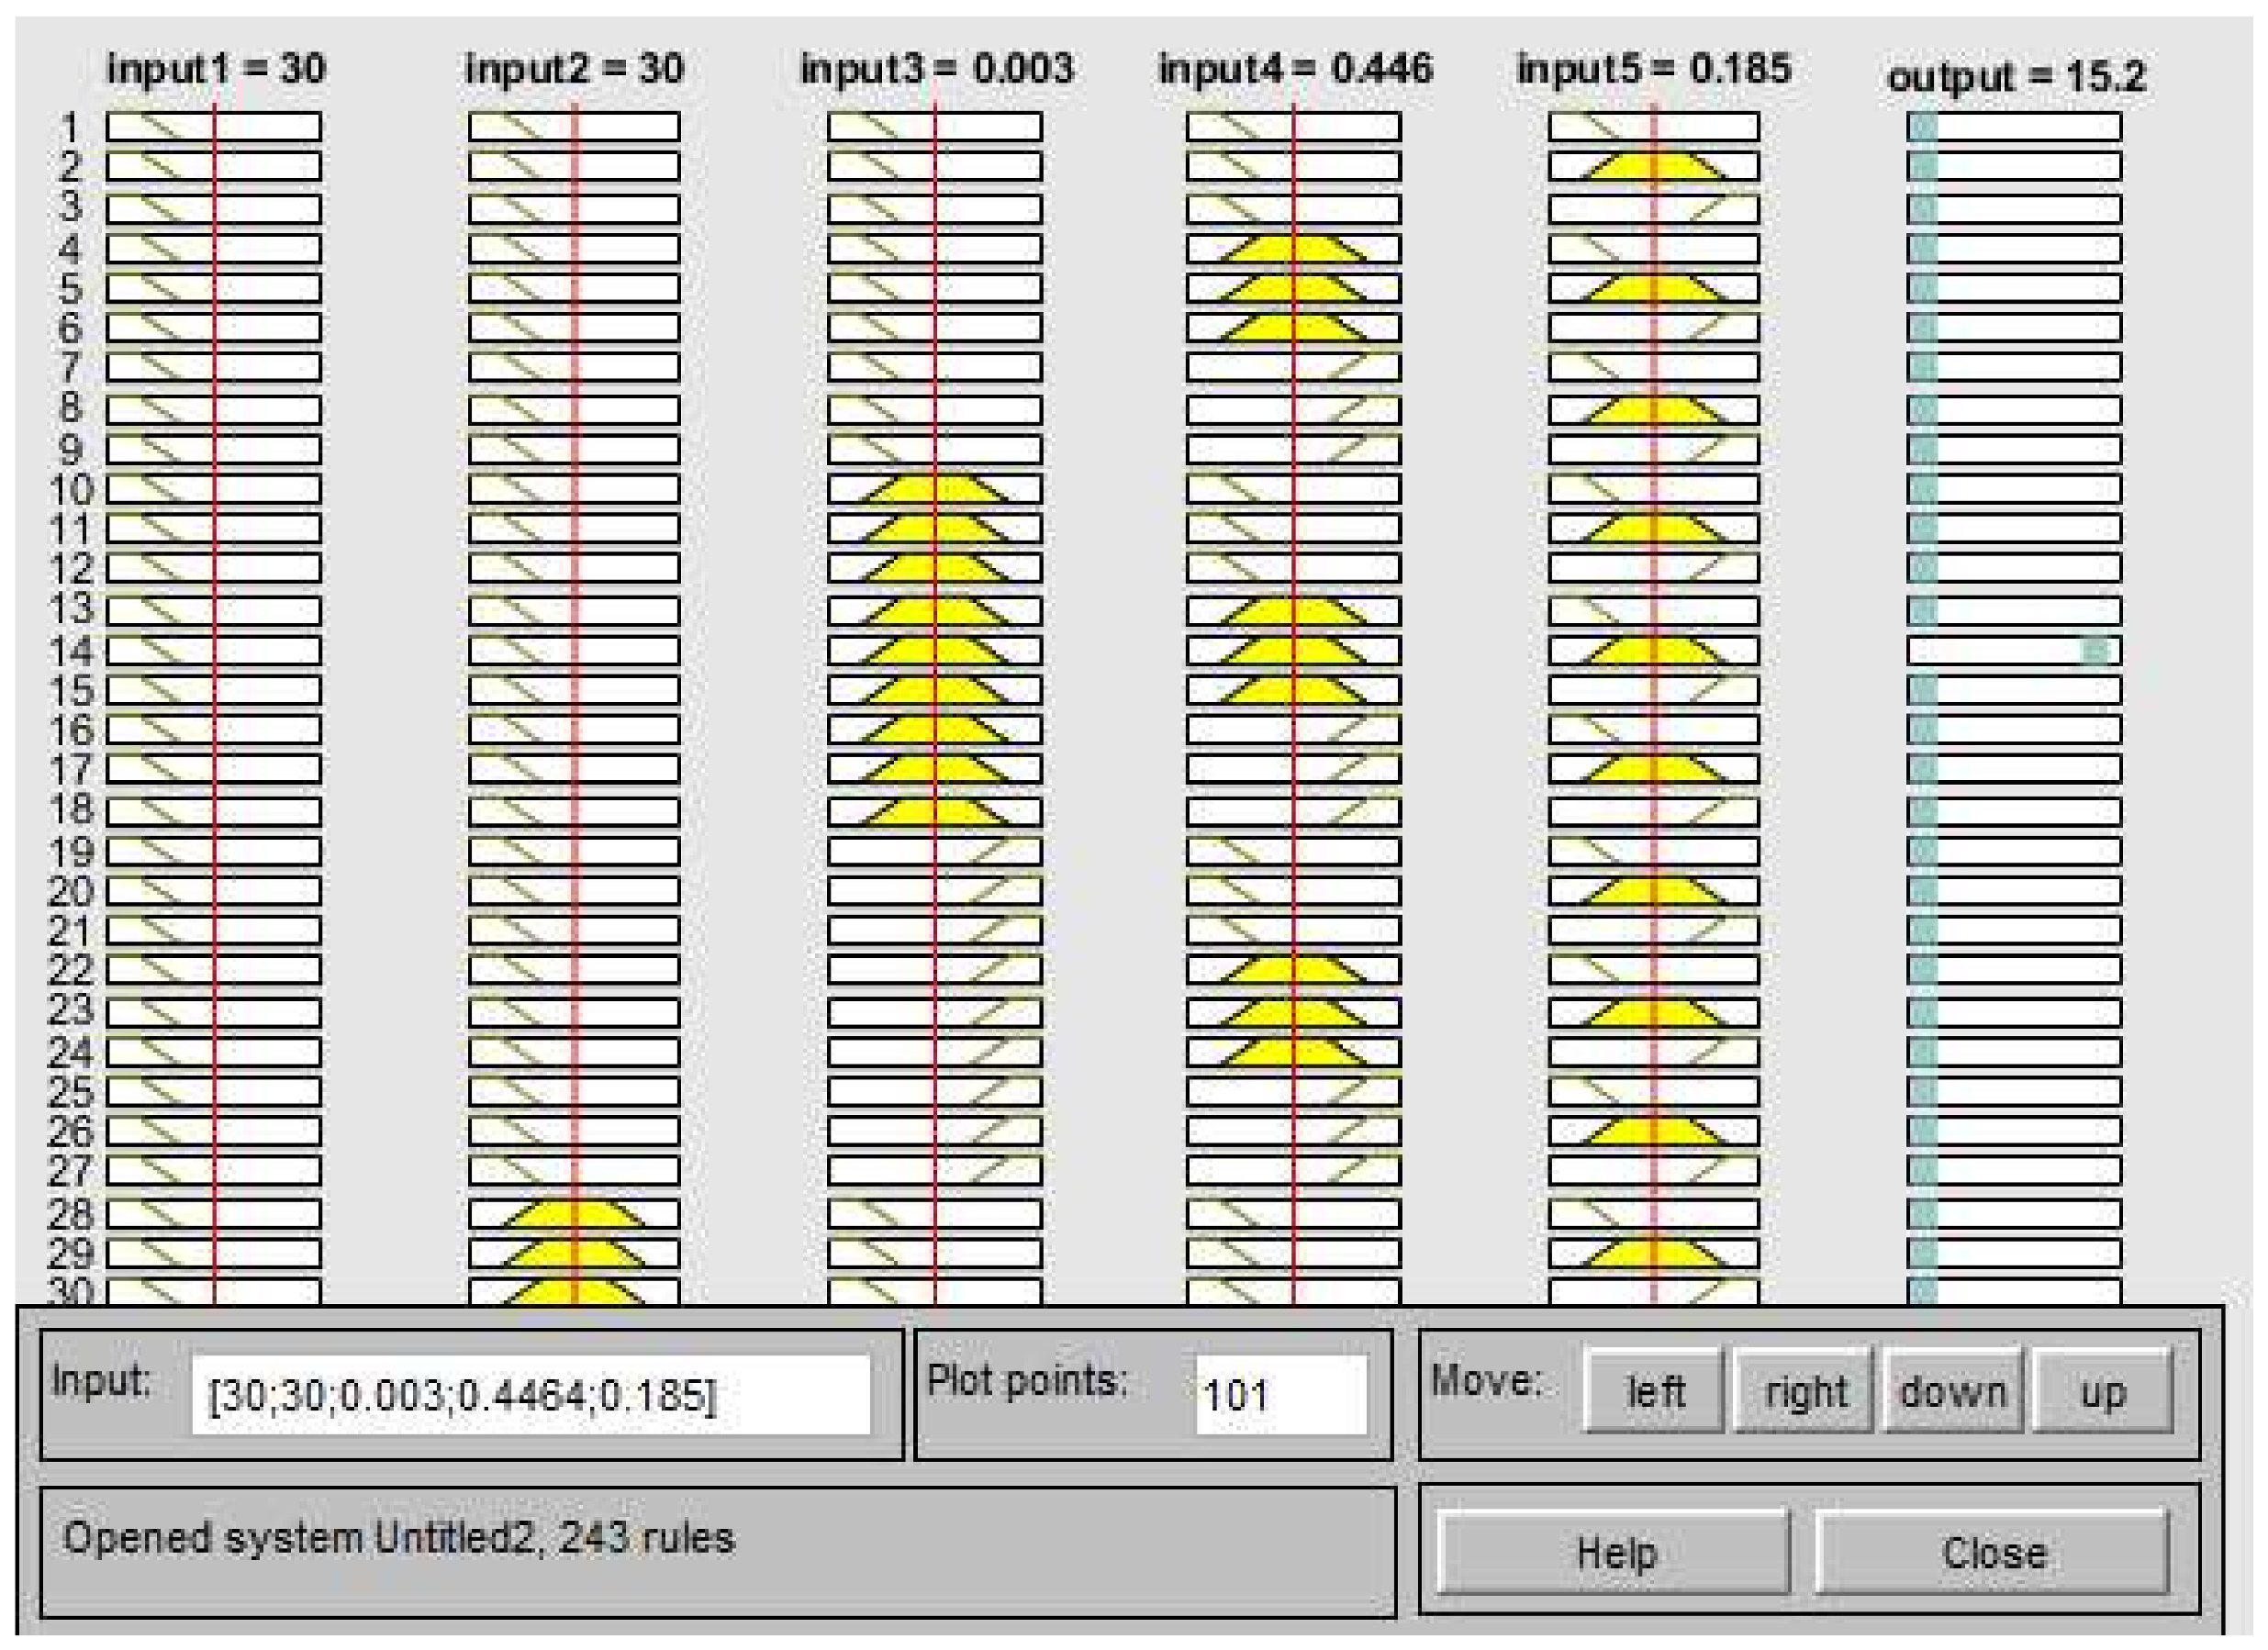
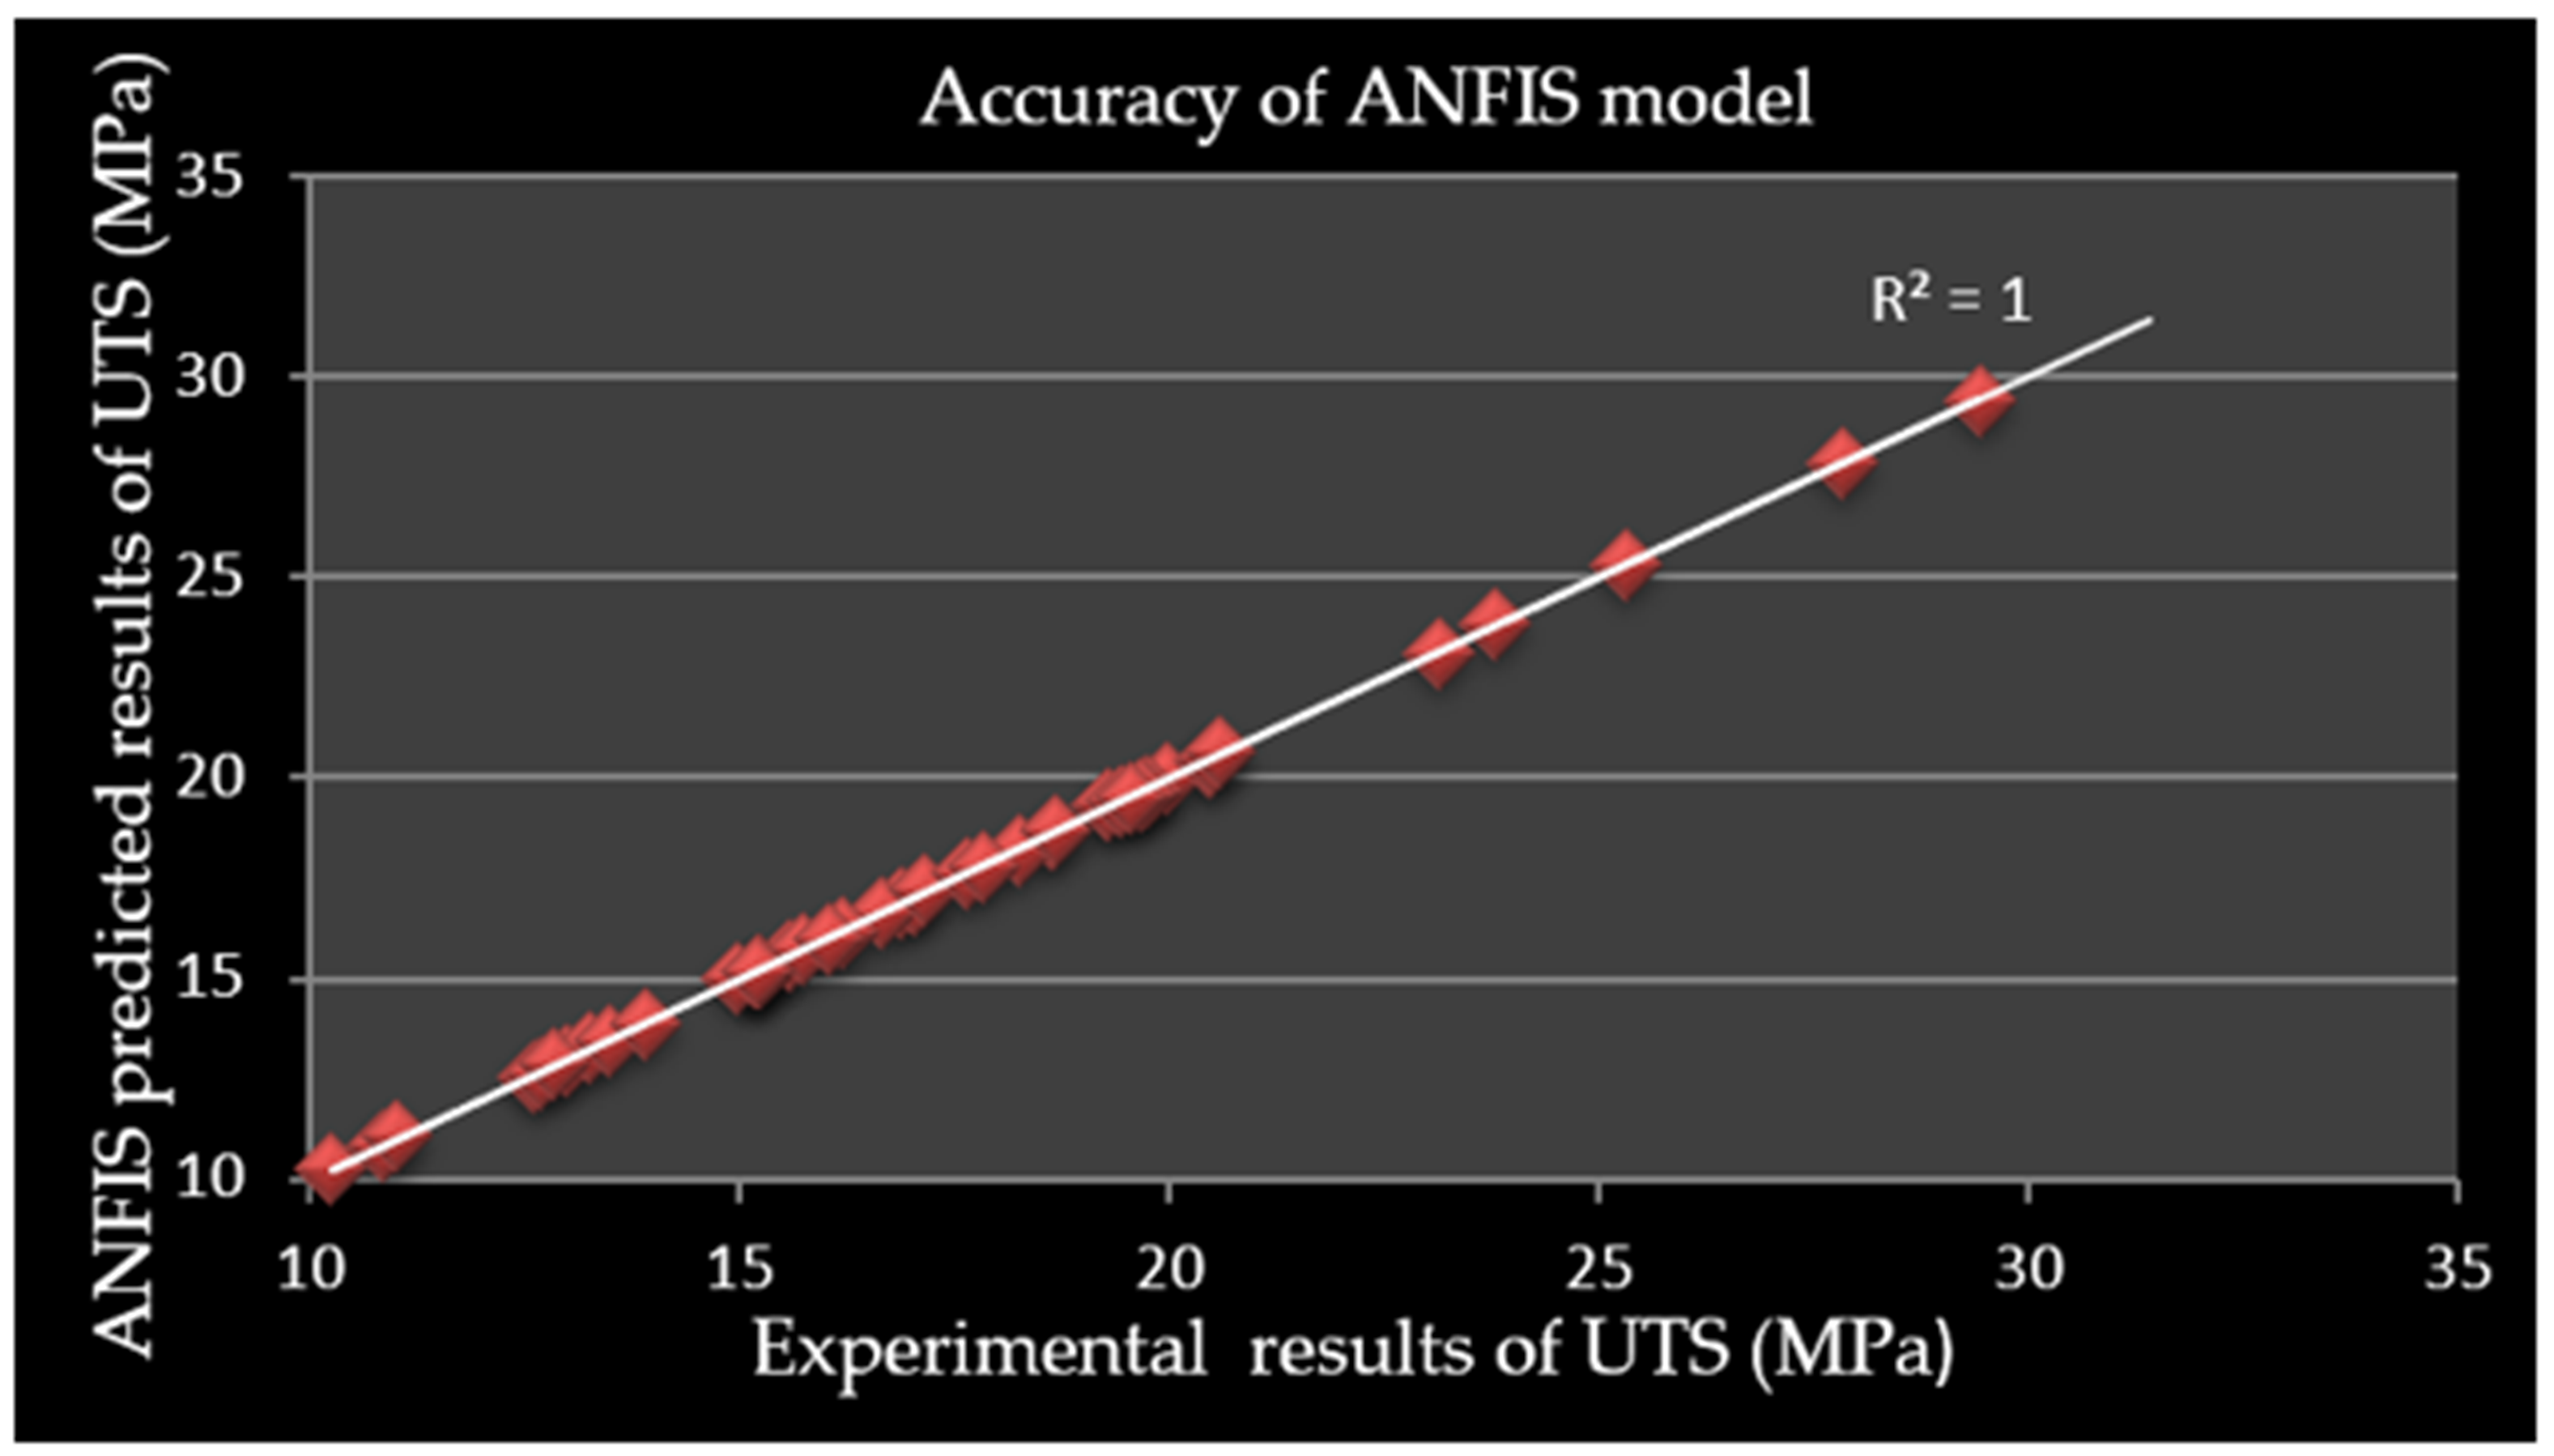
3.2. Results of ANFIS Modeling

For the prediction of the tensile strength of ABS-printed components using FDM, an ANFIS model was created utilizing the data gained from experimental measurements. A number of factors must be adjusted to identify the best model architecture for the ANFIS model. To develop a robust model with sufficient predictive performance, parameters such as the number of rules, type, and number of MFs, and logical operators must be modified. Based on the data in Table 4, the results of the proposed ANFIS model were obtained using the MATLAB R2019a program, and the predicted data are shown in Table 6. Figure 9 shows the two hundred and forty-four IF–THEN membership functions (MF) rules used to train the ANFIS model in this study. It also illustrates that the predicted results of UTS were 15.2 MPa when the raster angle (input 1) was 30 degrees, the printing orientation (input 2) was 30 degrees, the air gap (input 3) was 0.4466 mm, the raster width (input 4) was 0.185 mm, and the layer height (input 5) was 100 mm/s. The suggested model was valid after evaluating the checking data with the derived FIS model, with a minimal checking RMSE of 0.002500, which is less than 0.3080 % error. As shown in Figure 10, the R2 value between predicted and targeted values for ANFIS tensile strength demonstrated a high level of accuracy, with R2 = 0.9999, indicating that the model is valid.

3.3. Results of ANN Modeling

When the error, or the difference between the expected and predicted output, is less than a defined upper bound, or when the number of epochs exceeds a specified threshold, the ANN stops training. A score near 1 implies a strong connection, while a value close to 0 shows a random relation. Figure 11 illustrates the 12-iteration regression graphs developed by artificial neural networks. The regression plots obtained reveal that for training, testing, validation, and total data, the values were 0.98228, 0.85711, 0.92749, and 0.917, respectively, suggesting the best fitness after repeated training. This indicates that the ANN model’s anticipated outcomes appear to be in line with the experimental data. The ANN model worked adequately, as shown in Table 8, with an average percentage error of 1.6437 from the experimental results, demonstrating its potential for future usage.

3.4. Comparative Evaluation of the Predictive Models

To compare the ANFIS and ANN, the predictive results and the experimental results of UTS were analyzed by the average percentage error of the responses. The percentages of absolute errors for ANFIS and ANN were computed individually by comparing the predicted values with the test results using Equation (2). The average percentage error of the ANFIS model was 0.0163 %, and that of the ANN model was 1.6437 %, as shown in Table 8. This demonstrates that the ANFIS model is the most accurate or best-predicting model technique.
%   Absolute error = Actual predicted Actual × 100

3.5. Validation of the Models

In order to validate the relative performances of the ANFIS and ANN models, the validation parameters had different values of process parameters for eight new validation specimens. The validation parameters had the raster angle, printing orientation, air gap, raster width, and layer height as shown in Table 9. New specimens were fabricated and tested for tensile strength using the above parameters, and the percentage in deviation was computed using the means of prediction under ANFIS and ANN in MINITAB 2019a. When comparing the actual and predicted outcomes using the ANFIS and ANN approaches, the validation parameter yielded the percentage error as 0.166 and 0.767, respectively. Hence, the ANFIS model’s accuracy ranges from 1 to 2%, whereas the ANN model’s accuracy ranges from 1 to 5%.

4. Conclusions

This research proposes experimental analysis and the use of adaptive neuro-fuzzy methods and artificial neural networks to forecast the tensile strength for ABS components manufactured using fused deposition modeling. All of the investigations were carried out using a 46 Box–Behnken response surface design to alter the input parameters at different levels. Analysis of variance, main effect plots, 3D, and contour plots were used to investigate the link between input parameters and output results. The experimental outcomes were used to train and evaluate the models that were developed. The MATLAB R2019a fuzzy toolbox and neural toolbox were used to create the neuro-fuzzy system and artificial neural network, respectively. The ability of the models to forecast was tested using percentage errors. The study revealed that layer height, raster angle and layer height combinations, and air gap and layer height combinations were insignificant factors that impacted the ultimate tensile strength of ABS components. Since the p-values of the raster angle, printing orientation, raster width, air gap, and their combinations were less than 0.05, they had a significant impact on the ABS-printed components’ tensile strength. The UTS started to decrease with increasing raster angle, printing orientation, and air gap. The UTS also improved as the raster width and layer height started increasing. Enhanced mechanical strength may be achieved by using a lower raster angle, printing orientation, air gap, and larger raster width and layer height. The ANFIS and ANN models can accurately predict tensile strength with average percentage errors of 0.0163 and 1.6437, respectively. The ANFIS model’s accuracy ranges from 1 to 2%, whereas the ANN model’s accuracy ranges from 1 to 5%. This shows the predicted and experimental data are in good agreement. The arithmetical value indices of the ANFIS model indicated a better predictive performance than that of the ANN model.

Author Contributions

Conceptualization, A.D.T. and H.B.M.; methodology, A.D.T.; software, A.D.T.; validation, A.D.T.; formal analysis, A.D.T. and H.B.M.; investigation, A.D.T. and H.B.M.; resources, A.D.T. and H.G.L.; data curation, A.D.T. and H.G.L.; writing—original draft preparation, A.D.T.; writing—review and editing, A.D.T. and H.G.L.; visualization, H.G.L.; supervision, H.G.L.; project administration, H.B.M.; funding acquisition, H.G.L. All authors have read and agreed to the published version of the manuscript.

Funding

This research received no external funding.

Institutional Review Board Statement

Not applicable.

Informed Consent Statement

Not applicable.

Data Availability Statement

Not applicable.

Conflicts of Interest

The authors declare no conflict of interest.

References

  1. Sheoran, A.J.; Kumar, H. Fused Deposition modeling process parameters optimization and effect on mechanical properties and part quality: Review and reflection on present research. Mater. Today Proc. 2019, 10, 14. [Google Scholar]
  2. Amelia, N.; Ferliadi, F.; Christa, A.; Gunawan, F.E.; Asrol, M. Experimental Investigation on Influence of Infill Density on Tensile Mechanical Properties of Different FDM 3D Printed Materials. TEM J. 2021, 10, 1195–1201. [Google Scholar]
  3. Wankhede, V.; Jagetiya, D.; Joshi, A.; Chaudhari, R. Experimental investigation of FDM process parameters using Taguchi analysis. Mater. Today Proc. 2019, 27, 2117–2120. [Google Scholar] [CrossRef]
  4. Scallan, P. Comparative Study of the Sensitivity of PLA, ABS, PEEK, and PETG’s Mechanical Properties to FDM Printing Process Parameters. Crystals 2021, 11, 219–250. [Google Scholar]
  5. Milovanović, A.; Sedmak, A.; Grbović, A.; Golubović, Z.; Mladenović, G.; Čolić, K.; Milošević, M. Comparative analysis of printing parameters effect on mechanical properties of natural PLA and advanced PLA-X material. Procedia Struct. Integr. 2020, 28, 1963–1968. [Google Scholar] [CrossRef]
  6. Onwubolu, G.C.; Rayegani, F. Characterization and Optimization of Mechanical Properties of ABS Parts Manufactured by the Fused Deposition Modelling Process. Hindawi 2014, 2014, 1–13. [Google Scholar] [CrossRef]
  7. Mamo, H.B.; Tura, A.D.; Santhosh, A.J.; Ashok, N.; Rao, D.K. Modeling and analysis of flexural strength with fuzzy logic technique for a fused deposition modeling ABS components. Mater. Today Proc. 2022, 57, 768–774. [Google Scholar] [CrossRef]
  8. Wang, S.; Ma, Y.; Deng, Z.; Zhang, S.; Cai, J. Effects of fused deposition modeling process parameters on tensile, dynamic mechanical properties of 3D printed polylactic acid materials. Polym. Test. 2020, 86, 106483. [Google Scholar] [CrossRef]
  9. Lluch-Cerezo, J.; Benavente, R.; Meseguer, M.D.; Gutiérrez, S.C. Study of samples geometry to analyze mechanical properties in Fused Deposition Modeling process (FDM). Procedia Manuf. 2019, 41, 890–897. [Google Scholar] [CrossRef]
  10. Zhou, X.; Hsieh, S.; Ting, C. Modelling and estimation of tensile behaviour of polylactic acid parts manufactured by fused deposition modelling using finite element analysis and knowledge-based library. Virtual Phys. Prototyp. 2018, 13, 177–190. [Google Scholar] [CrossRef]
  11. Gebisa, A.W.; Lemu, H.G. Influence of 3D printing FDM process parameters on tensile property of ultem 9085. Procedia Manuf. 2019, 30, 331–338. [Google Scholar] [CrossRef]
  12. Byberg, K.I.; Gebisa, A.W.; Lemu, H.G. Mechanical properties of ULTEM 9085 material processed by fused deposition modeling. Polym. Test. 2018, 72, 335–347. [Google Scholar] [CrossRef]
  13. Motaparti, K.P.; Taylor, G.; Leu, M.C.; Chandrashekhara, K.; Castle, J.; Matlack, M. Experimental investigation of effects of build parameters on flexural properties in fused deposition modelling parts. Virtual Phys. Prototyp. 2017, 12, 207–220. [Google Scholar] [CrossRef]
  14. Gebisa, A.W.; Lemu, H.G. Investigating Effects of Fused-Deposition Modeling (FDM) Processing Parameters on Flexural Properties of ULTEM 9085 using Designed Experiment. Materials 2018, 11, 500. [Google Scholar] [CrossRef] [Green Version]
  15. Christiyan, K.G.J.; Chandrasekhar, U.; Venkateswarlu, K. A study on the influence of process parameters on the Mechanical Properties of 3D printed ABS composite. IOP Conf. Ser. Mater. Sci. Eng. 2016, 114, 12109. [Google Scholar] [CrossRef]
  16. Hsueh, M.-H.; Lai, C.-J.; Wang, S.-H.; Zeng, Y.-S.; Hsieh, C.-H.; Pan, C.-Y.; Huang, W.-C. Effect of Printing Parameters on the Thermal and Mechanical Properties of 3D-Printed PLA and PETG, Using Fused Deposition Modeling. Polymers 2021, 13, 1758. [Google Scholar] [CrossRef]
  17. Enemuoh, E.U.; Duginski, S.; Feyen, C.; Menta, V.G. Effect of Process Parameters on Energy Consumption, Physical, and Mechanical Properties of Fused Deposition Modeling. Polymers 2021, 13, 2406. [Google Scholar] [CrossRef]
  18. Hsueh, M.-H.; Lai, C.-J.; Liu, K.-Y.; Chung, C.-F.; Wang, S.-H.; Pan, C.-Y.; Huang, W.-C.; Hsieh, C.-H.; Zeng, Y.-S. Effects of Printing Temperature and Filling Percentage on the Mechanical Behavior of Fused Deposition Molding Technology Components for 3D Printing. Polymers 2021, 13, 2910. [Google Scholar] [CrossRef]
  19. Patil, C.; Sonawane, P.D.; Naik, M.; Thakur, D.G. Finite element analysis of flexural test of additively manufactured components fabricated by fused deposition modelling. In AIP Conf. Proc. 2020, 2311, 070026. [Google Scholar] [CrossRef]
  20. Pazhamannil, R.V.; Govindan, P.S.P. Prediction of the tensile strength of polylactic acid fused deposition models using artificial neural network technique. Mater. Today Proc. 2020, 199, 9187–9193. [Google Scholar] [CrossRef]
  21. Rayegani, F.; Onwubolu, G.C. Fused deposition modelling (FDM) process parameter prediction and optimization using group method for data handling (GMDH ) and differential evolution (DE). Int. J. Adv. Manuf. Technol. 2014, 2, 509–519. [Google Scholar] [CrossRef]
  22. Srinivasan, R.; Pridhar, T.; Ramprasath, L.S.; Charan, N.S.; Ruban, W. Proceedings Prediction of tensile strength in FDM printed ABS parts using response surface methodology (RSM). Mater. Today Proc. 2020, 3, 788. [Google Scholar] [CrossRef]
  23. Vishwakarma, S.K.; Pandey, P.; Gupta, N.K. Characterization of ABS Material: A Review. J. Res. Mech. Eng. 2017, 3, 13–16. [Google Scholar]
  24. Harris, M.; Potgieter, J.; Ray, S.; Archer, R.; Arif, K.M. Acrylonitrile butadiene styrene and polypropylene blend with enhanced thermal and mechanical properties for fused filament fabrication. Materials 2019, 12, 4167. [Google Scholar] [CrossRef] [PubMed] [Green Version]
  25. Rutkowski, J.V.; Levin, B.C. Acrylonitrile–butadiene–styrene copolymers (ABS): Pyrolysis and combustion products and their toxicity—a review of the literature. Fire Mater. 1986, 10, 93–105. [Google Scholar] [CrossRef] [Green Version]
  26. Nguyen, H.T.; Crittenden, K.; Weiss, L.; Bardaweel, H. Experimental Modal Analysis and Characterization of Additively Manufactured Polymers. Polymers 2022, 14, 2071. [Google Scholar] [CrossRef]
  27. Akessa, A.D.; Lemu, H.G.; Gebisa, A.W. Mechanical Property Characterization of Additive Manufactured ABS Material Using Design of Experiment Approach. In Proceedings of the ASME 2017 International Mechanical Engineering Congress and Exposition, Volume 14: Emerging Technologies, Materials: Genetics to Structures, Safety Engineering and Risk Analysis. Tampa, FL, USA, 3–9 November 2017. [Google Scholar]
  28. Croccolo, D.; De Agostinis, M.; Olmi, G. Experimental characterization and analytical modelling of the mechanical behaviour of fused deposition processed parts made of ABS-M30. Comput. Mater. Sci. 2013, 79, 506–518. [Google Scholar] [CrossRef]
  29. Zadeth, L.A. Fuzzy sets as a basis for a theory of possibility. Fuzzy Sets Syst. 1999, 148, 9–34. [Google Scholar] [CrossRef]
  30. Sarkar, J.; Prottoy, Z.H.; Bari, M.T.; al Faruque, M.A. Comparison Of Anfis And Ann Modeling For Predicting The Water Absorption Behavior Of Polyurethane Treated Polyester Fabric. Heliyon 2021, 7, e08000. [Google Scholar] [CrossRef]
  31. Ghorbani, B.; Arulrajah, A.; Narsilio, G.; Horpibulsuk, S.; Leong, M. Resilient moduli of demolition wastes in geothermal pavements: Experimental testing and ANFIS modelling. Transp. Geotech. 2021, 29, 100592. [Google Scholar] [CrossRef]
  32. Saleh, B.; Maher, I.; Abdelrhman, Y.; Heshmat, M.; Abdelaal, O. Adaptive Neuro-Fuzzy Inference System for Modelling the Effect of Slurry Impacts on PLA Material Processed by FDM. Polymers 2021, 13, 118. [Google Scholar] [CrossRef] [PubMed]
  33. Nafees, A.; Javed, M.F.; Khan, S.; Nazir, K.; Farooq, F.; Aslam, F.; Musarat, M.A.; Vatin, N.I. Predictive Modeling of Mechanical Properties of Silica Fume-Based Green Concrete Using Artificial Intelligence Approaches: MLPNN, ANFIS, and GEP. Materials 2021, 14, 7531. [Google Scholar] [CrossRef] [PubMed]
  34. Zhu, H.; Zhu, L.; Sun, Z.; Khan, A. Machine learning based simulation of an anti-cancer drug (busulfan) solubility in supercritical carbon dioxide: ANFIS model and experimental validation. J. Mol. Liq. 2021, 338, 116731. [Google Scholar] [CrossRef]
  35. Santhosh, A.J.; Tura, A.D.; Jiregna, I.T.; Gemechu, W.F.; Ashok, N.; Ponnusamy, M. Optimization of CNC turning parameters using face centred CCD approach in RSM and ANN-genetic algorithm for AISI 4340 alloy steel. Results Eng. 2021, 11, 00251. [Google Scholar] [CrossRef]
  36. Tura, A.D.; Mamo, H.B.; Jelila, Y.D.; Lemu, H.G. Experimental investigation and ANN prediction for part quality improvement of fused deposition modeling parts. IOP Conf. Ser. Mater. Sci. Eng. 2021, 1201, 012031. [Google Scholar] [CrossRef]
  37. Onu, C.E.; Nwabanne, J.T.; Ohale, P.E.; Asadu, C.O. Comparative analysis of RSM, ANN and ANFIS and the mechanistic modeling in eriochrome black-T dye adsorption using modified clay. S. Afr. J. Chem. Eng. 2021, 36, 24–42. [Google Scholar] [CrossRef]
  38. Deshwal, S.; Kumar, A.; Chhabra, D. Exercising hybrid statistical tools GA-RSM, GA-ANN and GA-ANFIS to optimize FDM process parameters for tensile strength improvement. CIRP J. Manuf. Sci. Technol. 2020, 5, 11. [Google Scholar] [CrossRef]
Figure 1. The ASTM D638-I tensile test sample.
Crystals 12 00844 g001
Figure 2. Universal testing machine with testing specimen.
Crystals 12 00844 g002
Figure 3. ANFIS multilayer architecture.
Crystals 12 00844 g003
Figure 4. Structure of the neural network.
Crystals 12 00844 g004
Figure 5. Main effect plots of UTS for means with all process parameters.
Crystals 12 00844 g005
Figure 6. 3D plot (a) and controur plot (b) of tensile strength vs. raster angle and printing orientation.
Crystals 12 00844 g006
Figure 7. 3D plot (a) and contour plot (b) of tensile strength vs. air gap and raster width.
Crystals 12 00844 g007
Figure 8. 3D plot (a) and contour plot (b) of tensile strength vs. raster width and layer height.
Crystals 12 00844 g008
Figure 9. Representation of rules for the generated FIS.
Crystals 12 00844 g009
Figure 10. Regression results of the ANFIS model.
Crystals 12 00844 g010
Figure 11. Regression plots for ultimate tensile strength obtained using the ANN model.
Crystals 12 00844 g011
Table 1. The specification of the Flash Forge Guider II 3D printer.
NameGuider II
Number of extruder1
Print technologyFused deposition modeling (FDM)
Build volume 280 × 250 × 300 mm
Layer resolution0.05–0.4 mm
Build accuracy ±0.2 mm
Positioning accuracyZ axis 0.0025 mm; XY axis 0.011 mm
Filament diameter 1.75 mm (±0.07)
Nozzle diameter0.4 mm
Nozzle temperature 210–250 °C
Platform temperature0–120 °C
Print speed10–200 mm/s
Table 2. The specification of the ABS printing materials.
PropertiesSpecification
MaterialABS
ColorWhite
Wire diameter 1.75 ± 0.05 mm
Recommended printing temperature230–250 °C
Recommended printing speed30–90 mm/s
Extrusion temperature (°C) 190–210
Heated bed temperature (°C)80
Density (g/cm3)1.04
Table 3. Process parameters and their range for experiments.
S.No.Process ParametersUnitsLevels
Low (−1)Medium (0)High (+1)
1Raster angle 03060
2Printing orientation 03060
3Air gapmm00.0030.006
4Raster widthmm0.40640.44640.4864
5Layer heightmm0.140.1850.23
Table 4. Box—Behnken response surface experimental design matrix and measured responses.
Run OrderStd OrderRaster Angle
(°)
Printing Orientation (°)Air Gap
(mm)
Raster Width
(mm)
Layer Height
(mm)
Tensile Strength
(MPa)
81000.0030.44640.18527.835
226000.0030.44640.18515.585
3430600.0030.44640.18510.248
30460600.0030.44640.18516.198
455303000.40640.18520.608
13630300.0060.40640.18513.283
17303000.48640.18519.983
14830300.0060.48640.18519.758
3193000.0030.44640.1419.642
171030600.0030.44640.1410.854
40113000.0030.44640.2323.129
101230600.0030.44640.2314.942
161303000.44640.18523.804
1514603000.44640.18516.654
46150300.0060.44640.18516.029
91660300.0060.44640.18516.879
331730300.0030.40640.1412.835
411830300.0030.48640.1417.810
371930300.0030.40640.2318.673
432030300.0030.48640.2319.548
222130000.44640.18529.415
2722306000.44640.18511.027
38233000.0060.44640.18515.740
182430600.0060.44640.18517.152
19250300.0030.40640.18519.639
42660300.0030.40640.18512.592
21270300.0030.48640.18518.604
362860300.0030.48640.18519.404
2929303000.44640.1419.285
123030300.0060.44640.1412.960
4231303000.44640.2320.523
73230300.0060.44640.2319.298
11330300.0030.44640.1417.006
203460300.0030.44640.1413.506
3350300.0030.44640.2320.443
253660300.0030.44640.2317.644
23373000.0030.40640.18518.239
443830600.0030.40640.18513.902
5393000.0030.48640.18525.314
284030600.0030.48640.18512.677
64130300.0030.44640.18515.210
244230300.0030.44640.18515.211
354330300.0030.44640.18515.200
324430300.0030.44640.18515.220
264530300.0030.44640.18515.210
394630300.0030.44640.18515.200
Table 5. Details of the ANFIS model used in this study.
ANFIS InformationTakagi–Sugeno–Kang
Number of MFs3 3 3 3 3
MF type (Input)Trapmf
Output MF typesConstant
Optimization methodHybrid
Error tolerance1 × 10−7
Epochs100
FIS generationGrid partitioning (GP)
Data points32
Number of fuzzy rules243
Table 6. Learning parameters designated for the ANN.
Type of NetworkFeed-Forward Neural Network
Training functionTrain Levenberg–Marquardt (LM) algorithm
Adaption Learning functionLEARNGD (Gradient descent)
Performance functionMean square error
Network topology5-50-1-1
Transfer functionTANSIG
Number of Hidden Layers1
Number of Hidden Neurons50
Training methodBack-propagation
Number of Epochs1000
Table 7. ANOVA for ultimate tensile strength of ABS parts.
SourceDFAdj. SSAdj. MSF-Valuep-Value
Regression20772.08338.6042133.880.000
A130.22430.2237104.820.000Significant
B11.1751.1754.070.054Insignificant
C139.47339.4735136.890.000Significant
D18.4248.423829.210.000Significant
E10.6430.6432.230.148Insignificant
A*A111.29211.292339.160.000Significant
B*B111.12711.127438.590.000Significant
C*C135.05535.0547121.570.000Significant
D*D112.65512.654743.890.000Significant
E*E15.7615.761419.980.000Significant
A*B182.8182.81287.190.000Significant
A*C1161655.490.000Significant
A*D115.60315.602554.110.000Significant
A*E10.1220.12250.420.52Insignificant
B*C198.0198.01339.90.000Significant
B*D117.22217.222559.730.000Significant
B*E10.090.090.310.581Insignificant
C*D112.60312.602543.710.000Significant
C*E16.5036.502522.550.000Significant
D*E14.2034.202514.570.001Significant
Error257.2090.2883
Lack-of-Fit207.2090.3604
Pure Error50.0000.0001
Total45779.292
Table 8. Comparative evaluation of predictive models.
Exp. TrialsExperimental Results of UTSANFIS ModelANN Model
Predicted Results% ErrorsPredicted Results% Errors
1.19.98319.985−0.010020.309−1.6314
2.15.58515.587−0.012815.732−0.9432
3.20.44320.4420.004920.481−0.1859
4.12.59212.593−0.007912.5780.1112
5.25.31425.317−0.011925.735−1.6631
6.15.21015.2070.019715.0940.7627
7.19.29819.2920.031119.672−1.9380
8.27.83527.839−0.014427.0172.9387
9.16.87916.880−0.005916.2213.8983
10.14.94214.9410.006714.8350.7161
11.17.00617.009−0.017617.756−4.4102
12.12.96012.961−0.007713.294−2.5772
13.13.28313.287−0.030113.647−2.7403
14.19.75819.761−0.015218.86624.5136
15.16.65416.6520.012017.263−3.6568
16.23.80423.812−0.033623.32012.0329
17.10.85410.860−0.055311.1657−2.8718
18.17.15217.1500.011717.443−1.6966
19.19.63919.6340.025519.9011−1.3346
20.13.50613.5010.037013.31811.3912
21.18.60418.6030.005418.764−0.8600
22.29.41529.4140.003428.88881.7889
23.18.23918.243−0.021917.8761.9902
24.15.21115.2040.046015.0940.7692
25.17.64417.6430.005717.6020.2380
26.15.21015.2030.046015.0940.7627
27.11.02711.0260.009110.70332.9355
28.12.67712.6760.007912.851−1.3726
29.19.28519.2810.020719.938−3.3861
30.16.19816.1960.012315.7892.5250
31.19.64219.6410.005119.645−0.0153
32.15.22015.2030.111715.0940.8279
33.12.83512.8340.007812.5871.9322
34.10.24810.2460.019510.2360.1171
35.15.20015.212−0.078915.0940.6974
36.19.40419.405−0.005220.048−3.3189
37.18.67318.6720.005419.1365−2.4822
38.15.74015.7390.006416.111−2.3571
39.15.20015.210−0.065815.0940.6974
40.23.12923.1280.004323.07530.2322
41.17.81017.811−0.005618.549−4.1494
42.20.52320.5220.004920.698−0.8527
43.19.54819.551−0.015319.785−1.2124
44.13.90213.9010.007214.204−2.1723
45.20.60820.6070.004920.812−0.9899
46.16.02916.0260.018715.9950.2121
Average percentage error0.0163 1.6437
Table 9. Process parameters for validation.
Run OrderRaster Angle
(°)
Printing Orientation (°)Air Gap
(mm)
Raster Width
(mm)
Layer Height
(mm)
Exp. Results of UTS
(MPa)
ANFIS ModelANN Model
Predicted Results (MPa)% ErrorsPredicted Results (MPa)%
Errors
115150.0020.42640.179.6909.6890.0119.5581.363
215150.0020.46640.2010.50010.508−0.07210.4820.175
315450.0040.42640.177.0437.0400.0457.0400.047
415450.0040.46640.207.0127.0100.0347.017−0.063
545150.0040.42640.207.5007.581−1.0797.1734.361
645150.0040.46640.178.9318.9300.0068.932−0.019
745450.0020.42640.207.0527.0490.0487.0510.024
845450.0020.46640.177.5417.5380.0407.5220.248
Publisher’s Note: MDPI stays neutral with regard to jurisdictional claims in published maps and institutional affiliations.

