Article

Low-Temperature Magnetothermodynamics Performance of Tb1-xErxNi2 Laves-Phases Compounds for Designing Composite Refrigerants

by
Jacek Ćwik
1,*,
Yurii Koshkid’ko
1,
Konstantin Nenkov
2,
Evgenia Tereshina-Chitrova
3,
Bruno Weise
2 and
Karolina Kowalska
1,4
1
Institute of Low Temperature and Structure Research, PAS, Okólna 2, 50-422 Wrocław, Poland
2
Leibniz IFW Dresden, Institute for Complex Materials, D-01069 Dresden, Germany
3
Institute of Physics CAS, 18221 Prague, Czech Republic
4
Faculty of Chemistry, Wrocław University of Science and Technology, Norwida 4/6, 50-373 Wrocław, Poland
*
Author to whom correspondence should be addressed.
Crystals 2022, 12(7), 931; https://doi.org/10.3390/cryst12070931
Submission received: 8 June 2022 / Revised: 25 June 2022 / Accepted: 26 June 2022 / Published: 30 June 2022
(This article belongs to the Section Crystalline Metals and Alloys)

Abstract

:
In this paper, the results of heat capacity measurements performed on the polycrystalline Tb1-xErxNi2 intermetallic compounds with x = 0.25, 0.5 and 0.75 are presented. The Debye temperatures and lattice contributions as well as the magnetic part of the heat capacity were determined and analyzed. The heat capacity measurements reveal that the substitution of Tb atoms for Er atoms leads to a linear reduction of the Curie temperatures in the investigated compounds. The ordering temperatures decrease from 28.3 K for Tb0.25Er0.75Ni2 to 12.9 K for Tb0.75Er0.25Ni2. Heat capacity measurements enabled us to calculate with good approximation the isothermal magnetic entropy ΔSmag and adiabatic temperature changes ΔTad for Tb1-xErxNi2, for the magnetic field value equal to 1 T and 2 T. The optimal molar ratios of individual Tb0.75Er0.25Ni2, Tb0.5Er0.5Ni2 and Tb0.25Er0.75Ni2 components in the final composite were theoretically determined. According to the obtained results, the investigated composites make promising candidates that can find their application as an active body in a magnetic refrigerator performing an Ericsson cycle at low temperatures. Moreover, for the Tb0.5Er0.5Ni2 compound, direct measurements of adiabatic temperature change in the vicinity of the Curie temperature in the magnetic field up to 14 T were performed. The obtained high-field results are compared to the data for the parent TbNi2 and ErNi2 compounds, and their magnetocaloric properties near the Curie temperature are analyzed in the framework of the Landau theory for the second-order phase transitions.

1. Introduction

The magnetocaloric effect (MCE) is a magneto-thermodynamic phenomenon which can be described by the isothermal magnetic entropy change, ΔSmag, and the adiabatic temperature change, ΔTad. These thermodynamic quantities evince during an exposition of a magnetically ordered material to a changing external magnetic field. For many years, compounds showing appropriate magnetocaloric properties have been extensively explored by many devoted researchers. Intensive theoretical and experimental investigations are underway to obtain optimal compounds exhibiting high MCE in the desired temperature range [1,2,3,4,5].
Unique physical properties of rare-earth (R) intermetallic compounds belonging to the Laves phase family make them promising for application in a wide temperature range. They exhibit localized magnetism of the R sublattice resulting in a large magnetic anisotropy and magnetostriction and itinerant magnetism of the 3d sublattice which, in the case of Fe and Co, provides a high magnetic moment and Curie temperature (Tc). Several excellent materials for application as permanent magnets and magnetostrictors have been discovered [6,7,8], thus making Laves phases very interesting research objects from both the scientific and applications viewpoints. For compounds with Ni, on the other hand, no magnetic moment at the nickel atoms is observed, and the magnetic interaction involves only the R sublattice [9,10]. Hence, these compounds are magnetically ordered at relatively low temperatures that reach even below 40 K with the exception of GdNi2, where the Curie temperature is equal to 75 K [9].
The combination of low temperature magnetic ordering together with a sufficiently large magnetic moment make the RNi2 compounds promising for producing working substances for cryogenic magnetic refrigerators. They can find applications in both hydrogen and helium liquefaction. It is worth mentioning that these compounds are characterized by a sufficiently large heat capacity per unit volume and high thermal conductivity around the magnetic transition temperature, which are crucial features of magnetic regenerators. Moreover, the regenerator can be adjusted for the desired working temperature using substitutions in RNi2.
Among the large group of binary RNi2 compounds, TbNi2 and ErNi2 have garnered a significant interest. Their magnetic and magnetocaloric properties have been extensively explored [9,10,11,12]. These compounds are characterized by large heat capacity anomalies observed around the ordering temperatures. According to the literature, the ordering temperature spans over the range from 37 to 46 K for TbNi2, whereas in the case of ErNi2, the temperature Tc is the lowest among RNi2 compounds, ~7 K [13]. In our previous works [11,12], we estimated the ordering temperatures of ~37.1 and 6.5 K for TbNi2 and ErNi2, respectively. The maximum values of ΔTad for the magnetic field change of 2 T reach 2.5 K at 34.5 K and 3.4 K at 6.5 K for TbNi2 and ErNi2 compounds, respectively [11,12]. The large MCE was associated with the magnetic-field-induced second order magnetic transition from ferromagnetic to the paramagnetic state, which produces a reversible MCE as a response to the applied external magnetic field. This property is desirable from the application point of view.
In this paper, the Tb1-xErxNi2 intermetallic compounds were investigated as the regenerative material. It was demonstrated that the temperature of the phase transition for compounds can be tuned in a controlled manner in a relatively wide range of temperatures by producing a solid solution. The regularities of magnetocaloric properties of investigated compounds studied by an indirect method (heat capacity measurements at low magnetic fields) have been related to direct measurements of the adiabatic temperature change for selected solid solutions over a wide field range, up to 14 T.

2. Materials and Methods

The polycrystalline Tb1-xErxNi2 intermetallics with x = 0.25, 0.5 and 0.75 were arc melted in a purified argon atmosphere at a pressure of 1.5 atm using stoichiometric mixtures of starting metals and a water-cooled copper bottom. The alloys were then remelted four times to improve homogeneity. The mass losses after melting were less than 1 wt.%. The obtained buttons were wrapped in a tantalum foil, sealed in an evacuated quartz ampoule, and annealed at 1123 K for 4 weeks. The purity of Ni and rare-earth metals was 99.99 and 99.9 wt.%, respectively. Based on the X-ray diffraction analysis that was conducted before [14] it was possible to determine the structure and phase composition of the investigated compounds. The samples are single-phase and possess the cubic C15 superstructure (space group F-43 m). It is worth mentioning that analogous to the increase of the Er content in the compound from x = 0.25 to x = 0.75, the lattice parameter decreases, respectively, from 14.3173 to 14.2626 Å. Heat capacity measurements were performed in magnetic fields of 0, 1 and 2 T in the temperature range from 2 to 100 K. The measurement was conducted by a relaxation method and the PPMS-14 installation (Quantum Design, CA, USA) was used. The measurement procedure of adiabatic temperature changes (ΔTad) was based on the extraction method. The direct measurements were performed using the proposed original setup [15]. The measurement was performed under the following conditions: the temperature ranges 4.2–50 K in magnetic fields reach up to 14 T.

3. Results and Discussion

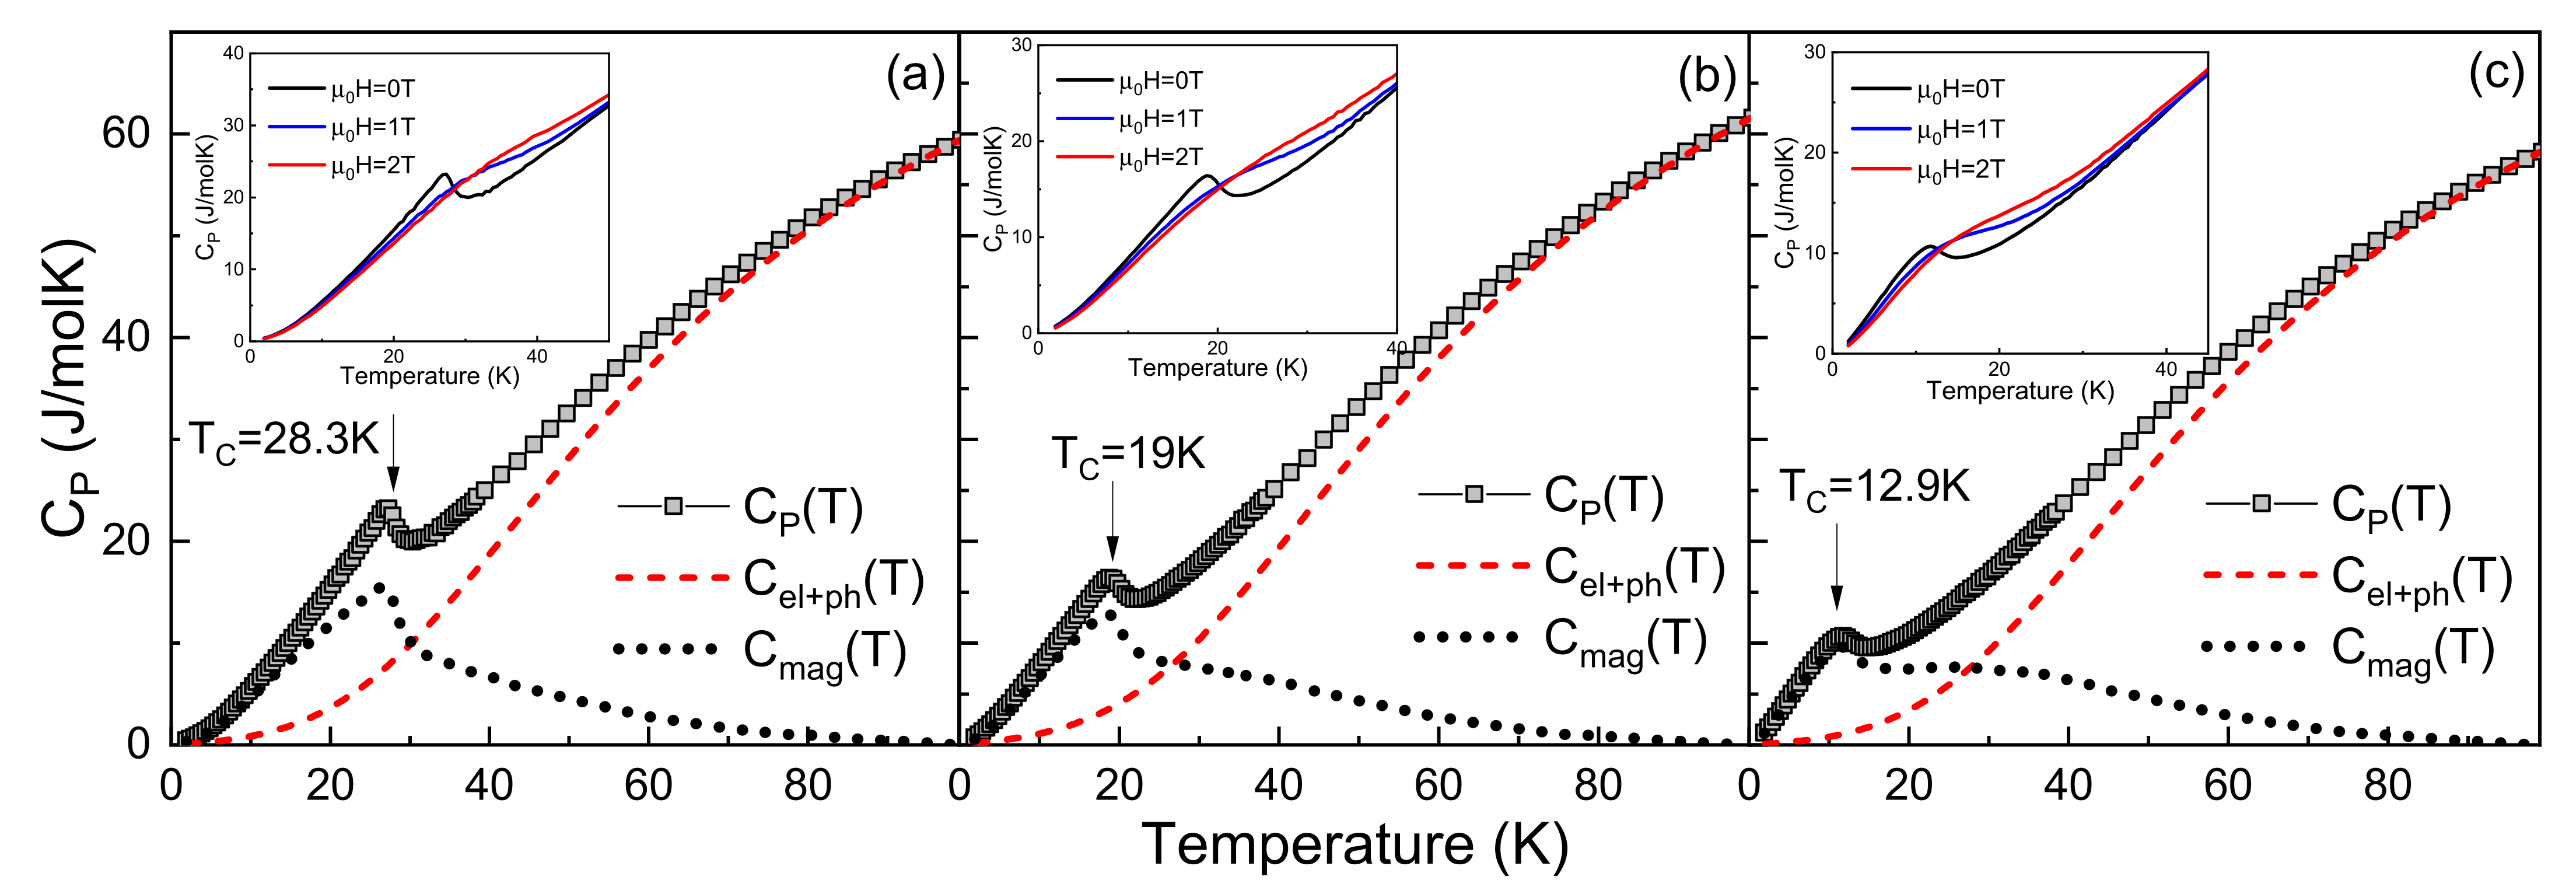
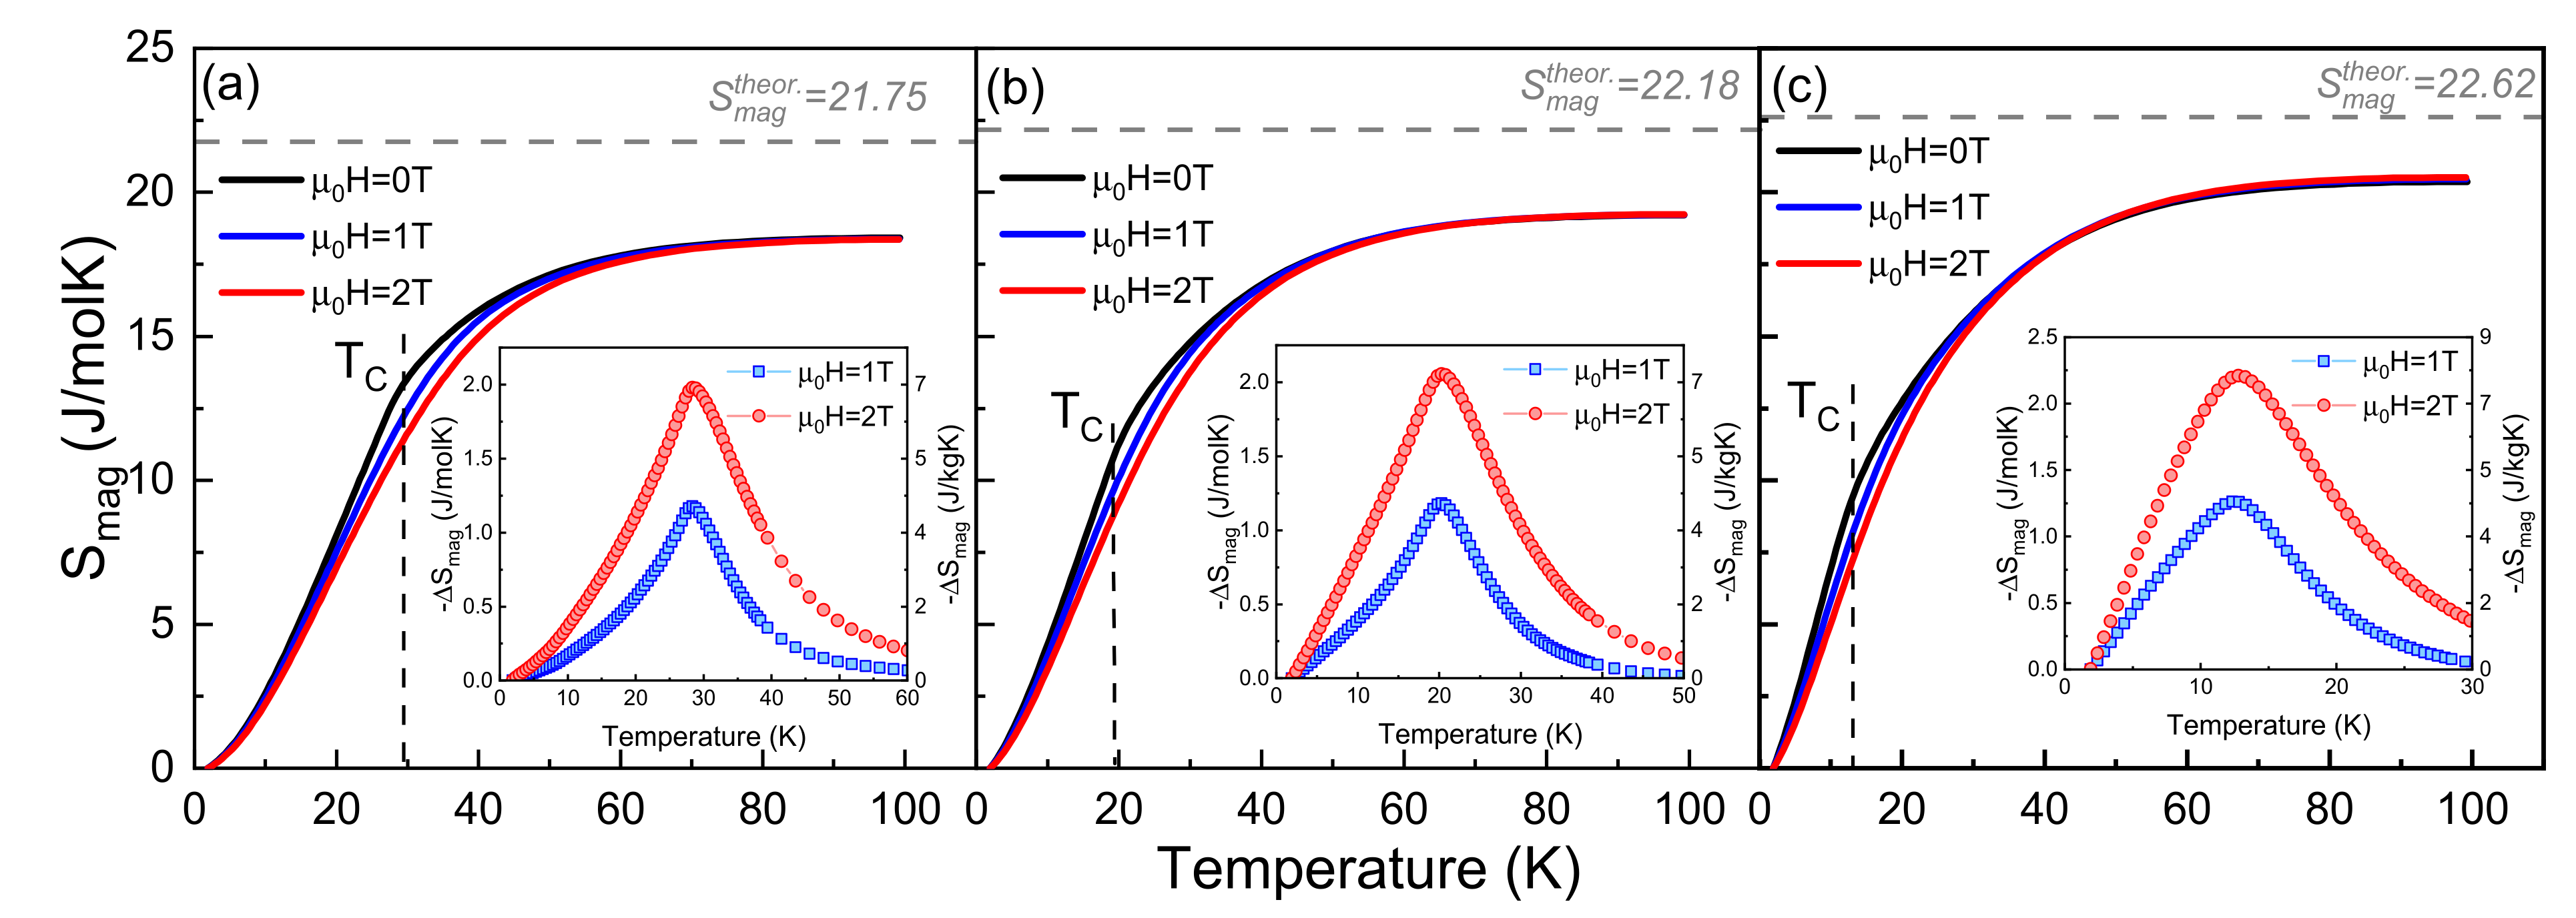
3.1. Heat Capacity Measurements

The heat capacity measurements were performed for the purpose of revealing the nature of the magnetic state and magnetocaloric properties of the Tb1-xErxNi2 compounds. The measurements were performed both in zero and various magnetic fields. Based on the measurements performed on the solid solutions, the dependence of the total heat capacity Ctot(T) on the temperature was investigated. The results for zero magnetic field are presented in Figure 1a–c. Filled symbols are directly connected with the experimental data, whereas the dotted lines correspond to the, Cmag(T). The magnetic part of heat capacity was calculated after the subtraction of Cel+ph(T), which was estimated by the Debye function according to Equation (1). The electron and phonon contribution is presented in Figure 1a–c as dashed lines.
C el + ph T = γ T + 9 N R T Θ D 3 0 Θ D / T x 4 e x e x 1 2 d x ,
where the first term corresponds to the electron heat capacity, and the second term represents the lattice contribution, N is the number of atoms per formula unit, and R is the molar gas constant equal to 8.314 J/molK. The Debye temperatures and γ coefficients for the studied Tb1-xErxNi2 compounds were calculated using the Debye function in the temperature range from 2 K to 100 K. The results are summarized in Table 1. As can be seen, the Debye temperature of the Tb1−xErxNi2 system, similar to that of the Dy1−xErxNi2 and Ho1−xErxNi2 systems [16,17], increases from 262 to 268 K as the Er content increases from x = 0.25 to x = 0.75.
A well-defined λ-like anomaly corresponds to the magnetic ordering temperature determined as TC = 28.3, 19 and 12.9 K for alloys with x = 0.25, 0.5 and 0.75, respectively. It is worth mentioning that the transition temperature values obtained from the heat capacity measurements stay in agreement with those that were determined based on magnetic measurements [14]. The λ-type anomalies associated with the TC implies that the magnetic transition at these temperatures is of second order character, and this is in line with our previous magnetic measurements [14].
The dependence of the heat capacity on the temperature is presented in insets in Figure 1a–c. The lines correspond to the measurements performed in 0 T (black), 1 T (blue) and 2-T (red) magnetic fields. The feature worth noticing is that along with the incensement in the magnetic field value, the broadening of the Ctot(T) peak and reduction of the peak height can be seen and is present for all of the study samples with different compositions.
Figure 2a–c show how the magnetic entropy Smag for the investigated compounds depends on temperature. The measurements were conducted for magnetic field equal to 0 T, 1 T and 2 T, and the temperature dependence of the magnetic entropy is calculated employing the relation described above:
S mag T = 0 T C m a g T d T  
Based on theoretical calculations, depending on the composition, the value of magnetic entropy at its maximum is estimated to be around 22 J/molK. Figure 2 shows that the magnetic entropy tends to increase abruptly at lower temperature range and then increases in a linear manner along with the temperature up to 100 K, which is the final temperature for the measurement. However, it is clearly visible that at this temperature value still no saturation can be observed. At this final point, the maximum magnetic entropy equals 18.4, 19.2 and 20.5 J/molK for the Tb0.75Er0.25Ni2, Tb0.5Er0.5Ni2 and Tb0.25Er0.75Ni2 compounds, respectively. Near the TC, about 50 % of the available magnetic entropy is used in the magnetic ordering process. Similar behavior observed for other rare-earth transitions metal compounds were previously described in the literature [19,20,21] as being attributed to the crystalline field effects. According to the literature and proved in performed measurements, the applied field equal to 0 T, 1 T and 2 T affect a decrease in magnetic entropy value near the transition temperature. In particular, the maximum value of Smag(T) for Tb0.25Er0.75Ni2 near TC decreases from 9.4 to 7.1 J/molK.
The heat capacity data obtained from the measurements in the magnetic field ranging from 0 to 2 T were used to calculate the experimental isothermal magnetic entropy change ΔSmag(T). Calculations were performed according to the procedure that was proposed in Ref. [14]. The value of magnetic entropy change is the highest for the Tb0.25Er0.75Ni2 compound and is equal to 2.2 J/molK (7.8 J/kgK) at the temperature near 12.9 K. In the case of Tb0.75Er0.25Ni2 and Tb0.5Er0.5Ni2 compounds, the value of −ΔSmag reaches 1.9 J/molK (7.1 J/kgK) and 2.1 J/molK (7.3 J/kgK) in the vicinity of TC for Tb0.75Er0.25Ni2 and Tb0.5Er0.5Ni2, respectively.
A constant value of magnetic entropy change, which is employed in the Ericsson cycle, in temperature from the range of the refrigeration process, according to the literature, can be used in a magnetic refrigerator process leading to improved regenerative processes [22,23]. For a single compound, the −ΔSmag(T) does not possess a constant value in a wide temperature range, as is clearly visible in Figure 2a–c. It reaches its maximum at a specific temperature—the magnetic transition temperature. However, if several compounds exhibit similar values of the maximum −ΔSmag, then a composite material created from a few (at least two) of those substances will show a “table-like” behavior of −ΔSmag(T) value. In the case of the Tb1−xErxNi2 system, the compounds that possess different Er concentrations should offer sufficiently wide temperature range refrigeration. In this context, numerical simulations to construct a composite material formed by (Tb0.75Er0.25Ni2)y1, (Tb0.5Er0.5Ni2)y2 and (Tb0.25Er0.75Ni2)y3 using the procedure described in Refs. [22,23] were performed. The factors yi correspond to the mass ratio of each compound under the condition y1 + y2 + y3 = 1. The calculated optimal molar ratios for the magnetic field change ranging from 0 T to 1 T, for a composition described as composite 1, are equal to y1 = 0.460, y2 = 0.194 and y3 = 0.346 for Tb0.75Er0.25Ni2, Tb0.5Er0.5Ni2 and Tb0.25Er0.75Ni2, respectively. As for the composition depicted as composite 2, where the magnetic field change was equal to 2 T, the molar ratios are equal to y1 = 0.491 for Tb0.75Er0.25Ni2, y2 = 0.115 for Tb0.5Er0.5Ni2 and y3 = 0.394 for Tb0.25Er0.75Ni2. Figure 3 shows how the change of the temperature influences the value of the isothermal magnetic entropy change −ΔSmag(T). The value of ǀΔSmagǀcomp from composite 1 and composite 2 remain constant for a wide temperature range, from 12 to 28 K. The maximum value of entropy changes for the composite observed under a magnetic field is equal to 1 T and is around 2.3 J/kgK and 4.7 J/kgK for a magnetic field equal to 2 T. Those simulations suggest that it is necessary to calculate optimal molar ratios of particular composite constituents to design a refrigerant of appropriate composition. From the perspective of potential applications, it appears that the most important process implemented in the procedure is that it utilizes the external magnetic field change in value.
The dependences of the adiabatic temperature change ΔTad, for Tb1−xErxNi2 with x = 0.25, 0.5 and 0.75 shown in Figure 4a,b were acquired from the heat capacity data measured under the influence of magnetic field changes ranging from 1 to 2 T. As can be noticed, with the increase of the applied magnetic field, the adiabatic temperature change ΔTad(T) near TC increases as well. It should be noted that in magnetic fields below 2 T, the values of the maximum ΔTad are comparable for all of the measured compounds. The only exception is the adiabatic temperature change measured for the 2 T magnetic field change. In this case, a slight difference can be seen as Er content increases, and the ΔTad value increases. The data on experimental isothermal magnetic entropy change and adiabatic temperature change is summarized in Table 2. Obtained magnetocaloric parameters are of a high-level and are comparable to those obtained for other Laves-phase solid solutions and other promising low-temperature (below 40 K) magnetocaloric materials, such as DyNi2 [11], Dy1-xErxNi2 [16], Tb1-xHoxNi2 [24], ErRu2Si2 [25] and DyHoNi2B2C [26].

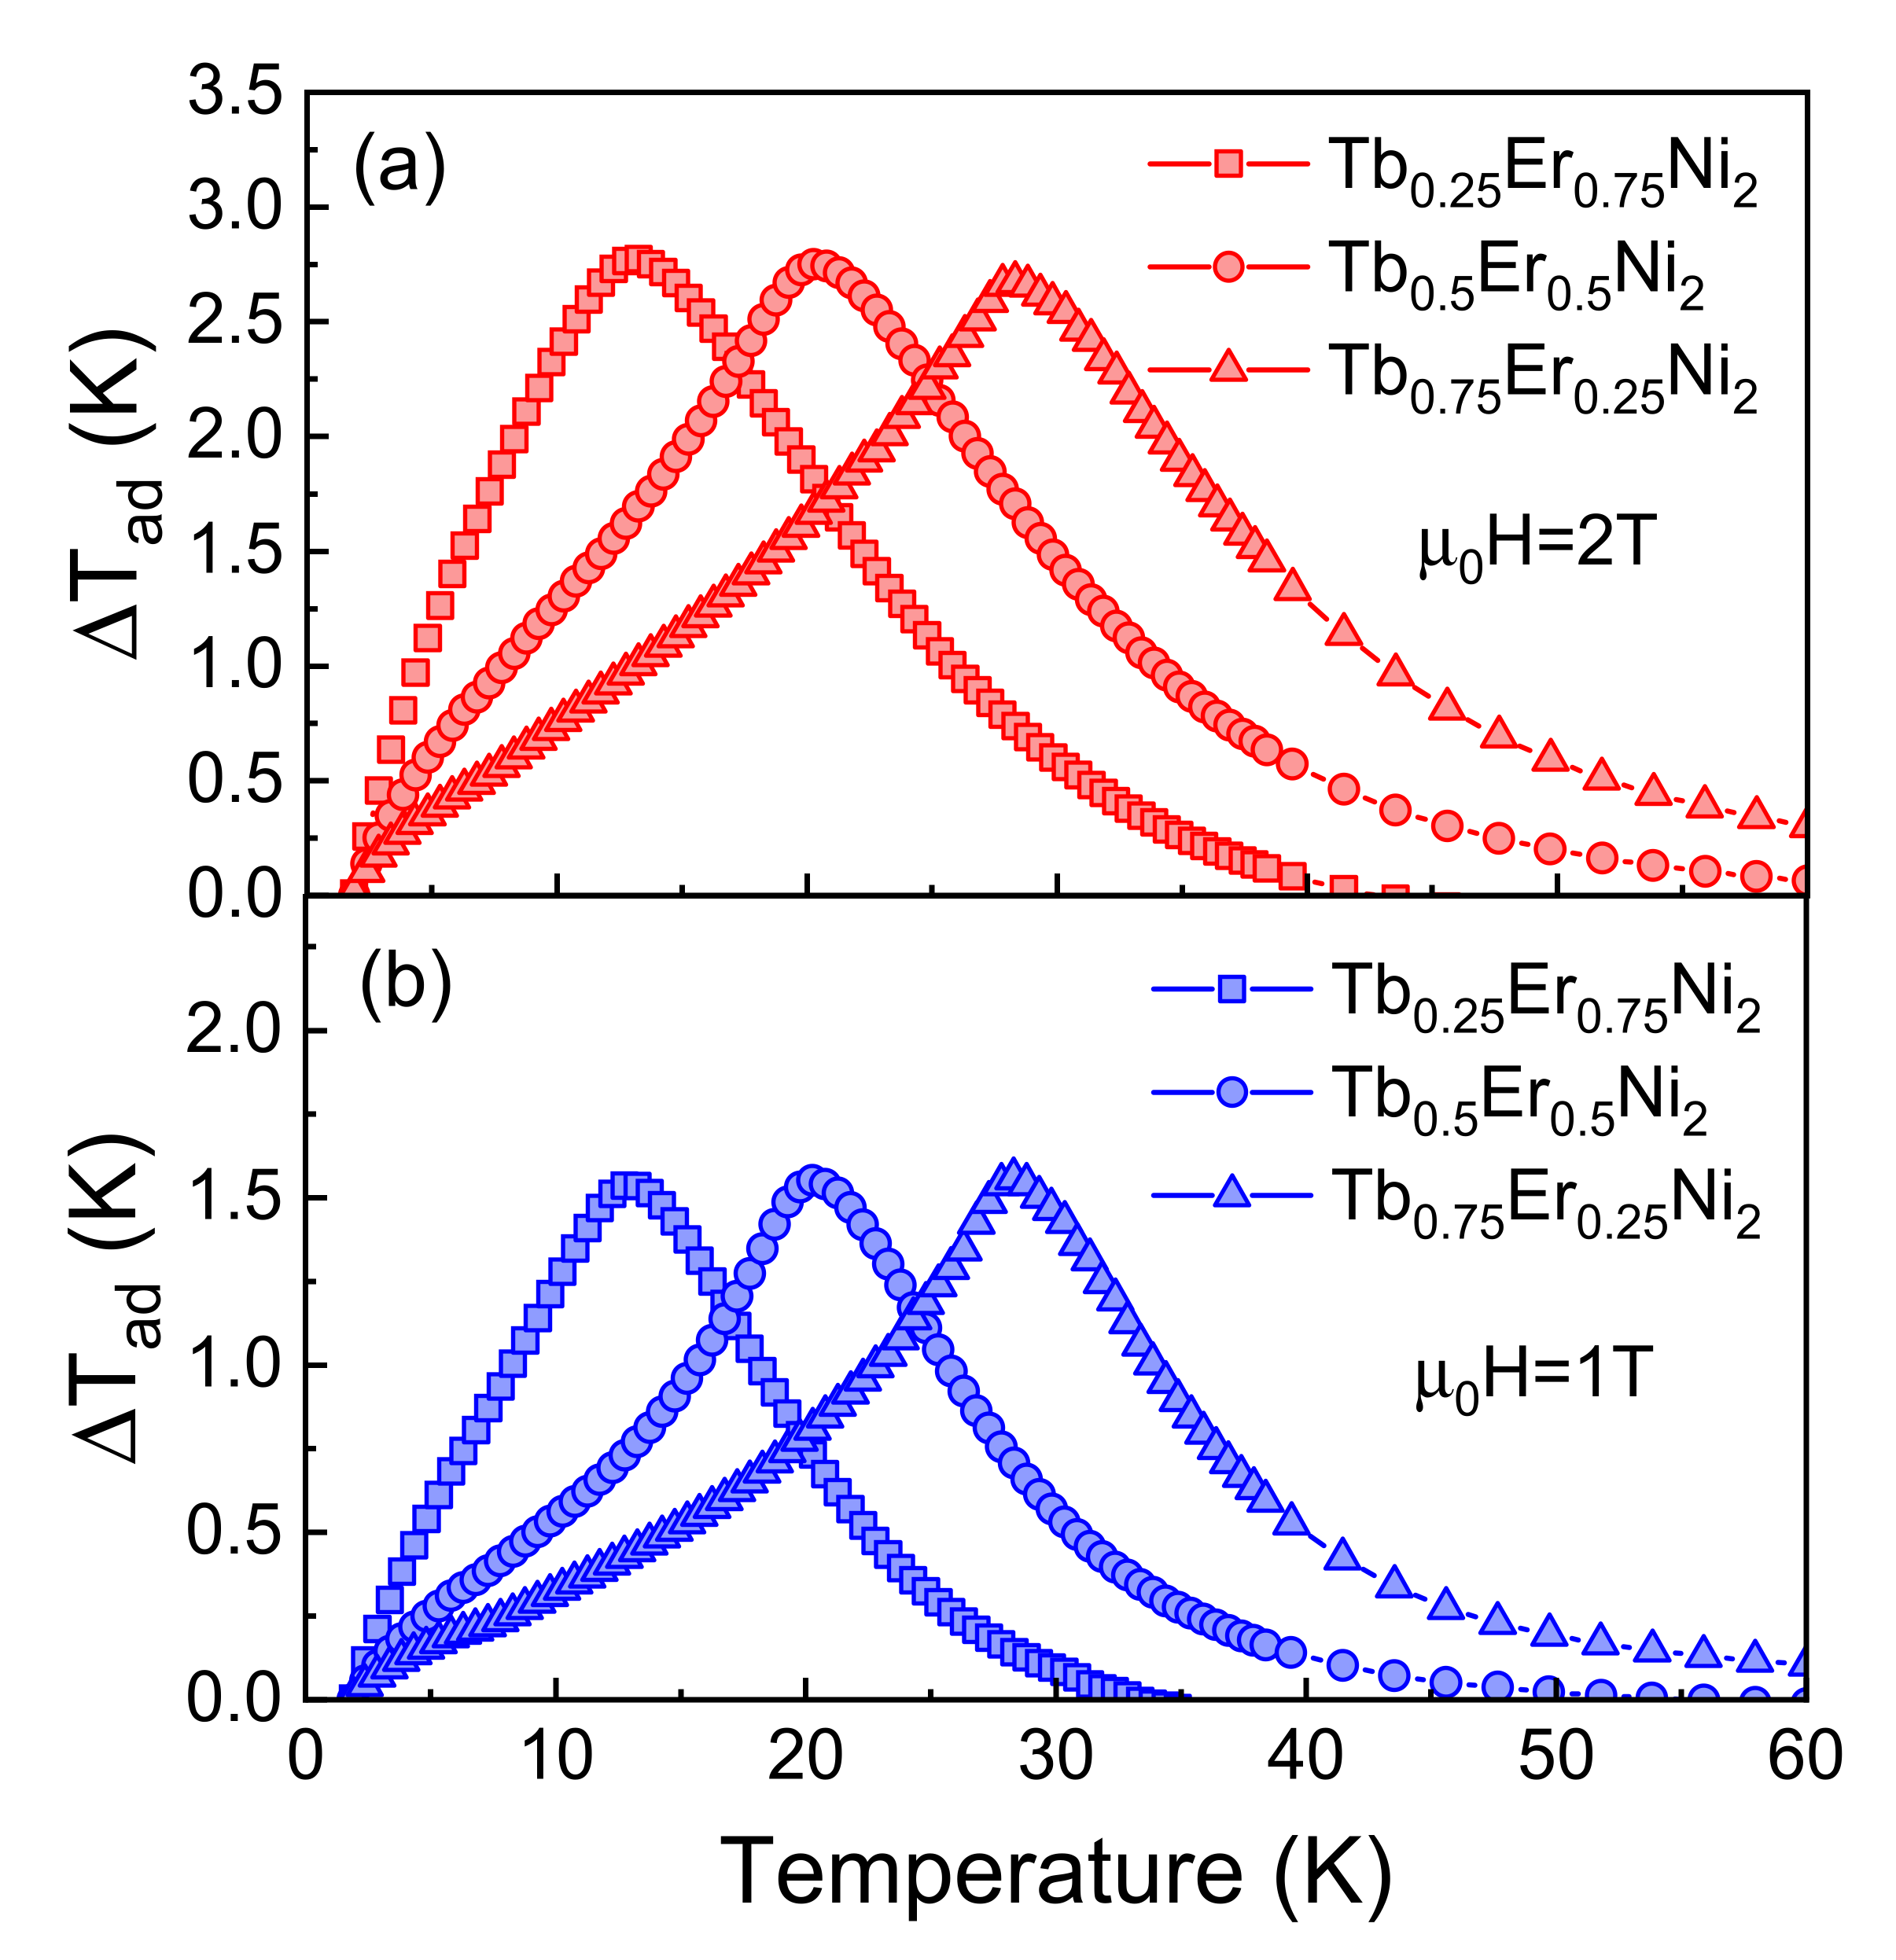
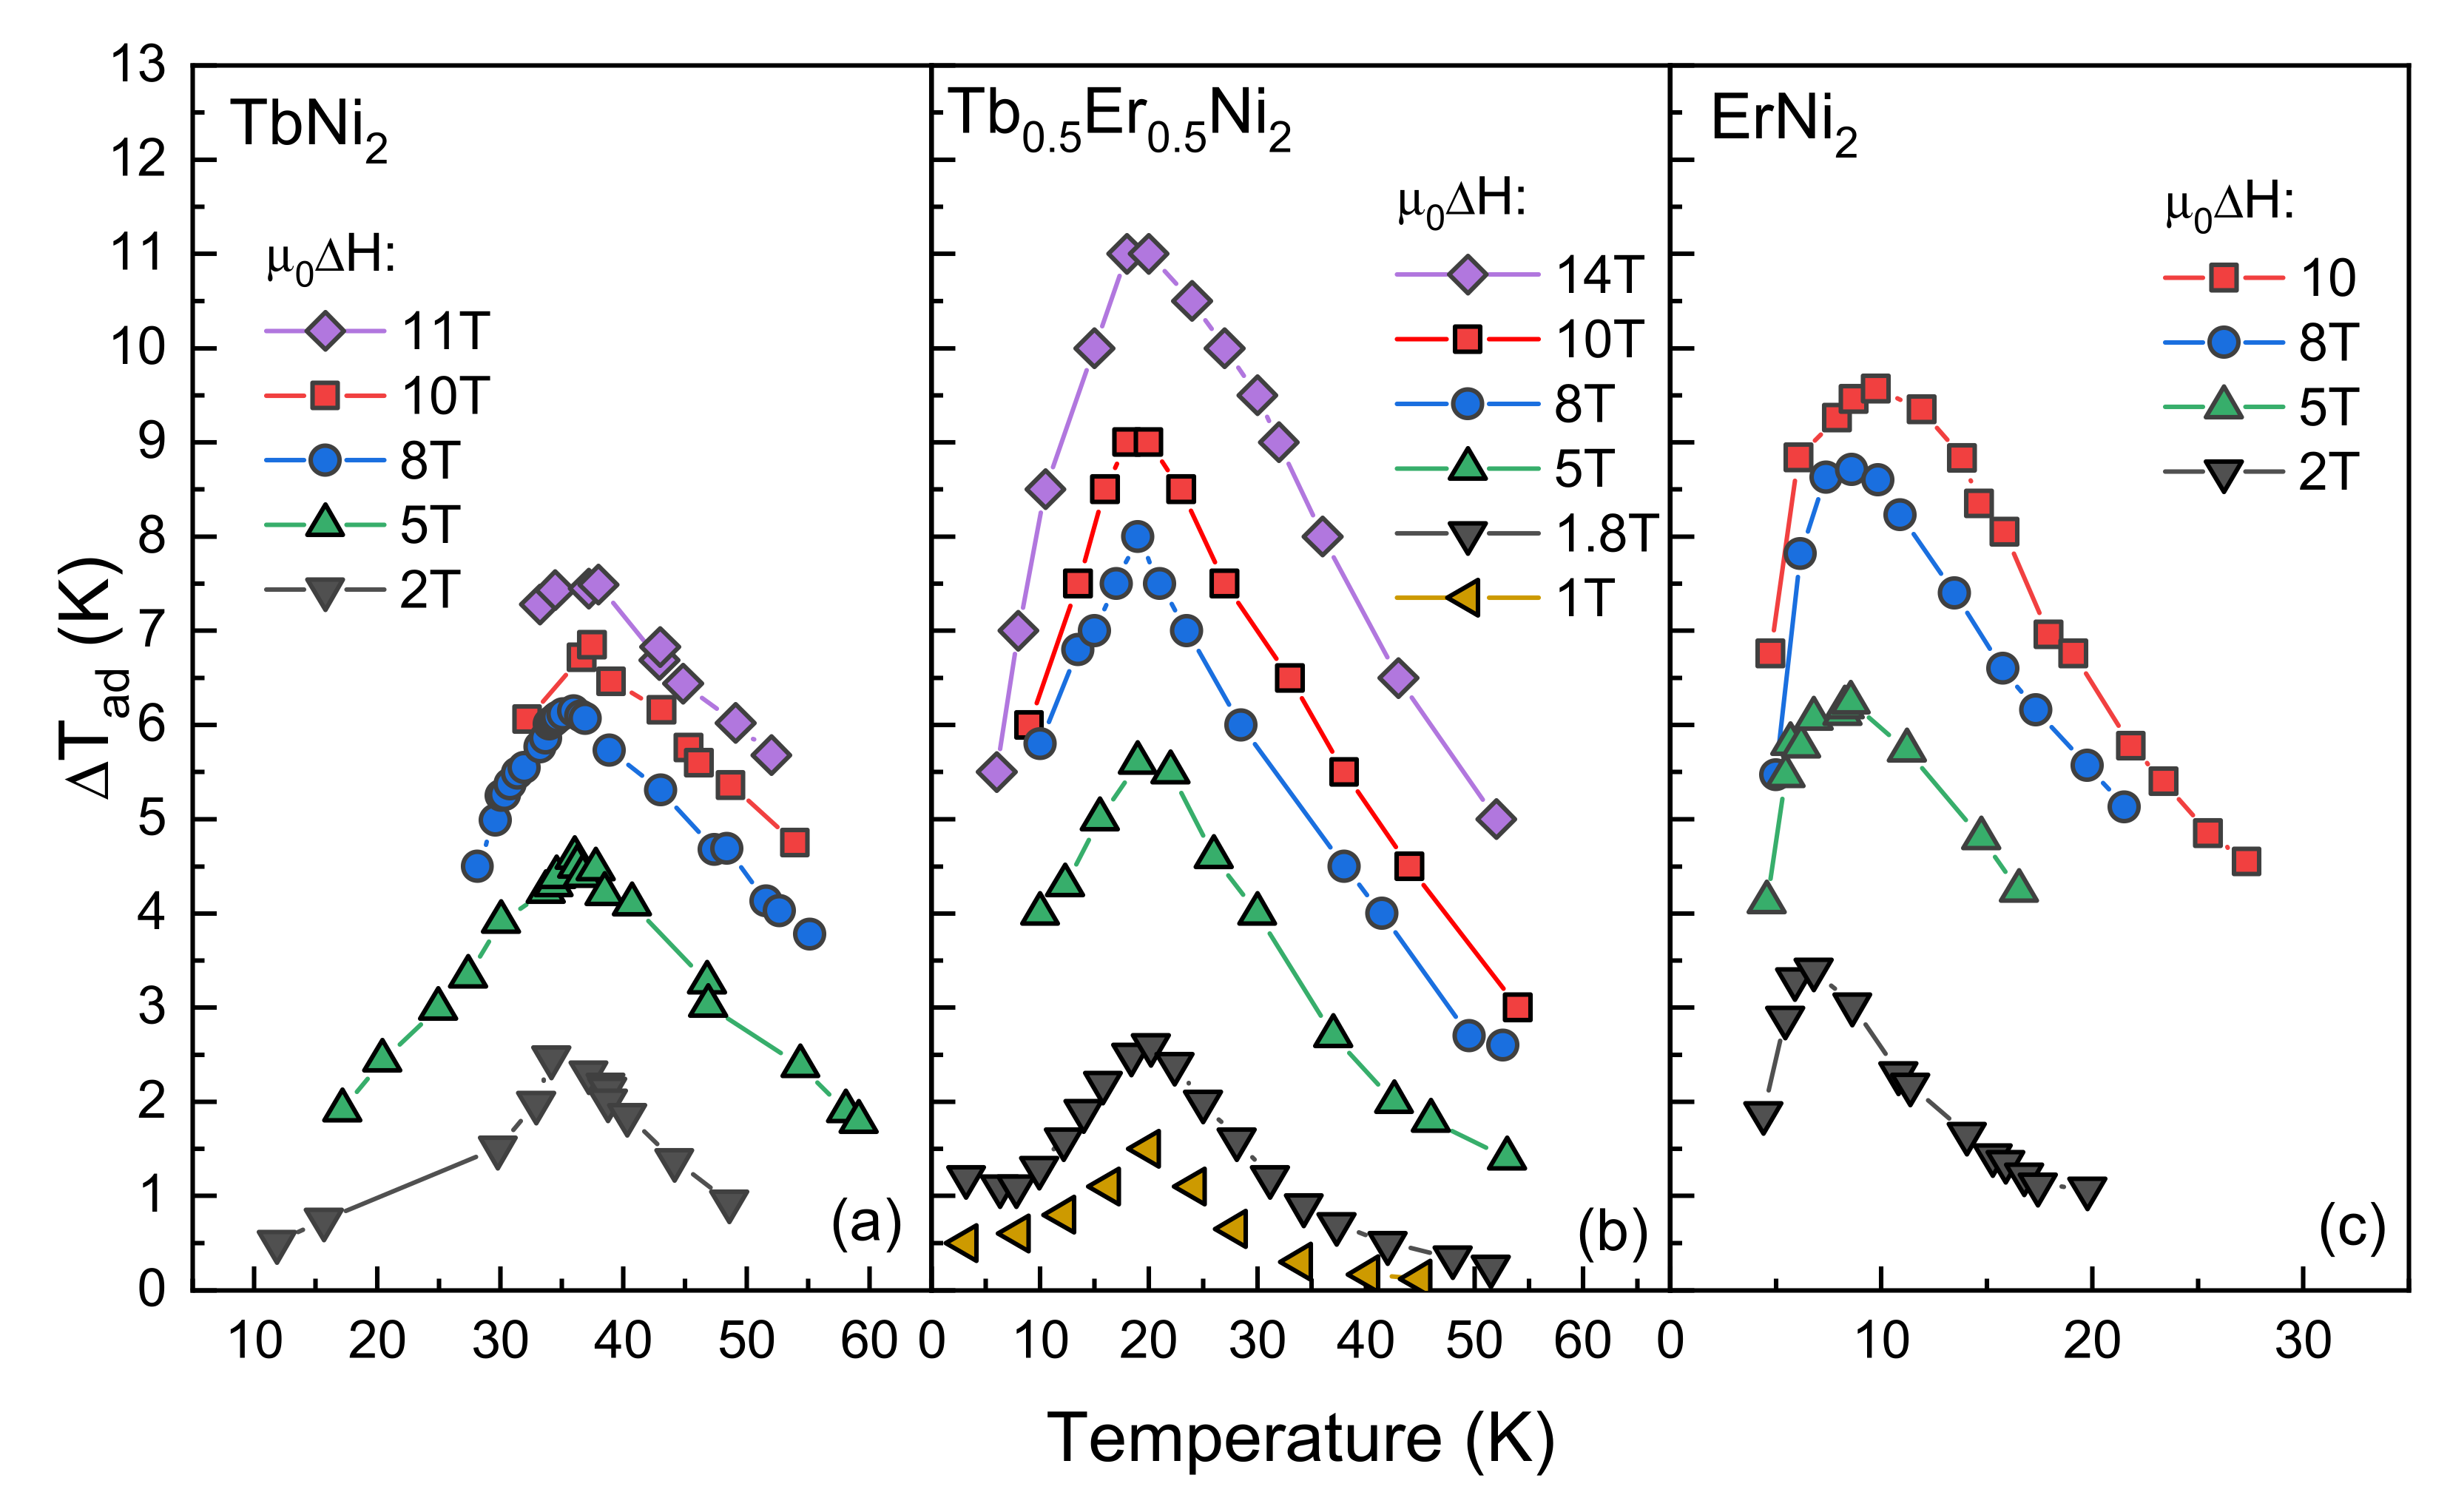
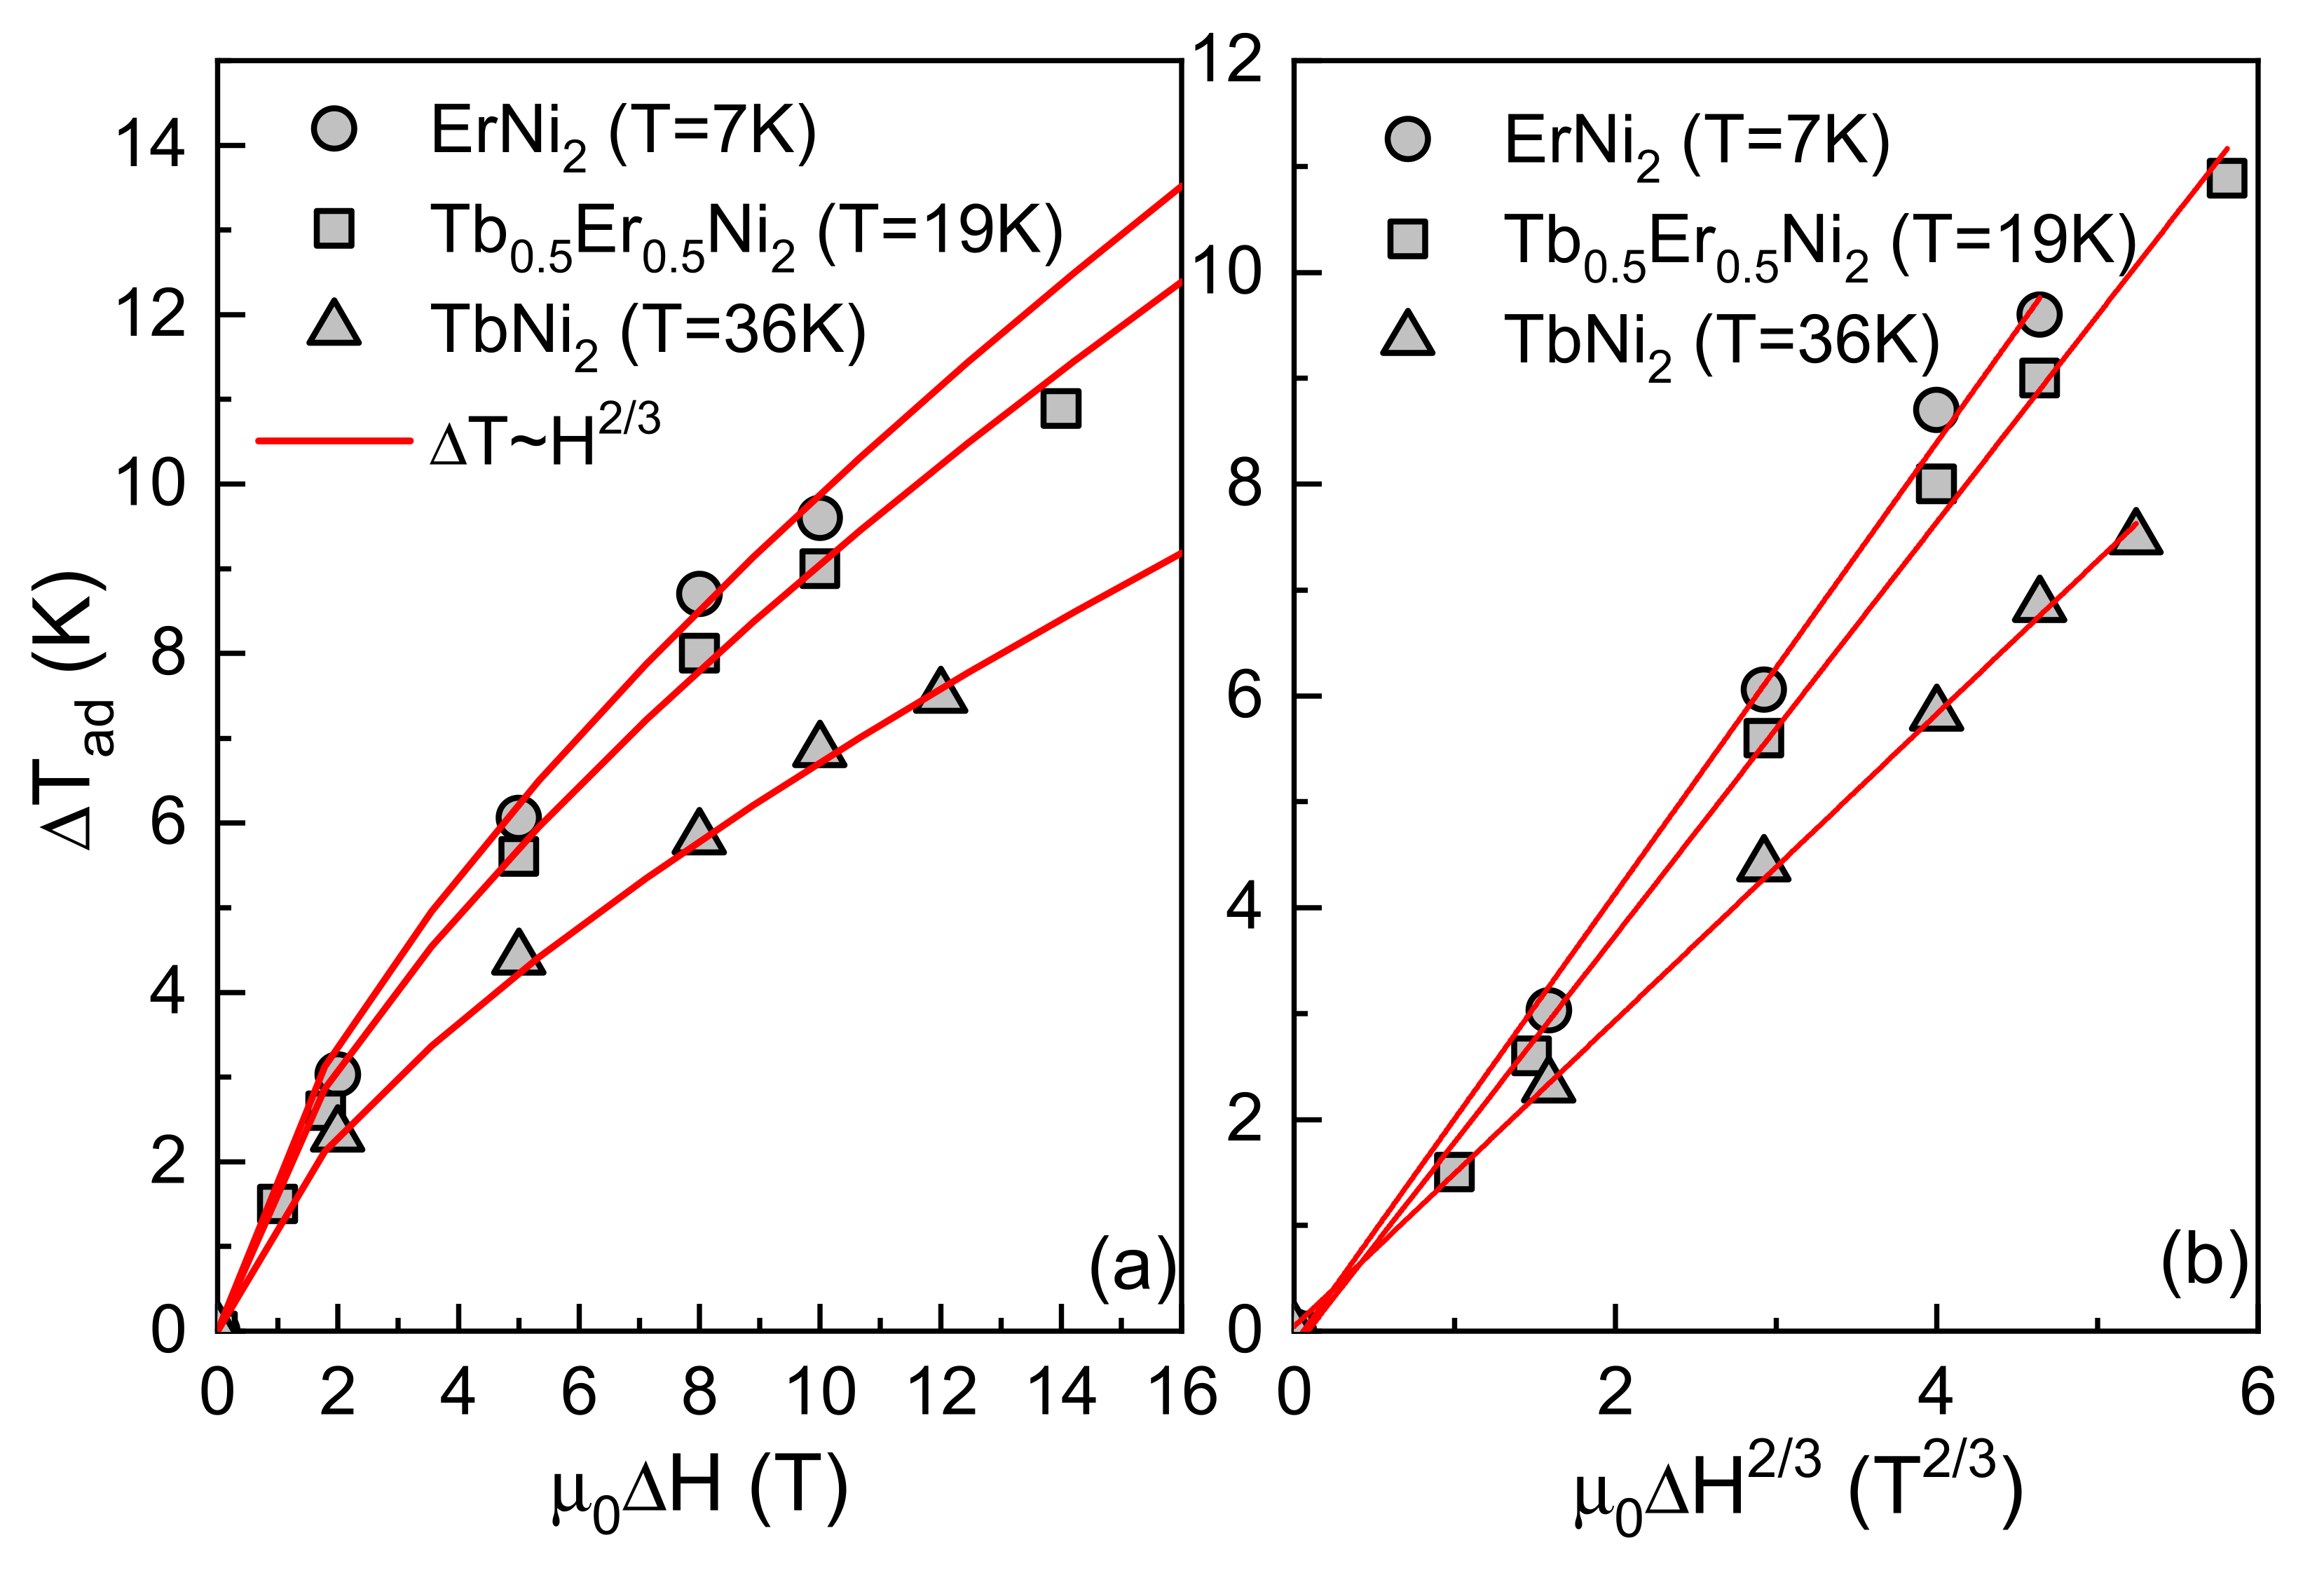
3.2. Direct Measurements of the Adiabatic Temperature Change

The dependences of the adiabatic temperature change ΔTad, obtained by direct measurements for Tb1−xErxNi2 with x = 0.5 at various magnetic field changes µ0ΔH are shown in Figure 5b. Moreover, for comparison, the results of ΔTad vs. T obtained for the parent TbNi2 and ErNi2 compounds are presented in Figure 5a,c. As expected, larger magnetic field change provides a larger temperature change. The maximum ΔTad reaches ~11 K near 19 K for a magnetic field change of 14 T. The sharp peaks observed in the ΔTad(T) dependences are related to the magnetic phase transition at the Curie temperature, where changes of magnetization are maximal. Results obtained at magnetic fields lower than 10 T are comparable with those presented in our previous work [11,12]. The reported maximum adiabatic temperature change at µ0ΔH = 10 T for ErNi2 reaches 9.6 K and 6.2 K for the TbNi2 compound. It should be noted that there is a good correlation between the presented results. As the amount of Er in the final composition increases, the adiabatic temperature change (ΔTad) value increases as well.
The experimental ΔTad maximum directly measured vs. the final magnetic field during the magnetization process in the vicinity of the magnetic phase transition is plotted in Figure 6a. As can be seen, the adiabatic temperature change grows nonlinearly with the increasing external magnetic field. The characteristic quantity ΔTad0ΔH for the Tb0.5Er0.5Ni2 compound at the Curie temperature TC = 19 K, decreases from 1.5 K/T at 1 T to 0.7 K/T at 14 T. This decrease is comparable to that observed in the case of the parent compounds, i.e., 1.4 K/T at 1 T to 0.6 K/T at 14 T for TbNi2 and from 2.1 K/T at 1 T to 0.88 K/T at 14 T for ErNi2.
The field dependence of MCE near the Curie temperature can be analyzed in a quantitative way according to the Landau theory [27]. Based on the Landau theory, the magnetic field dependence of adiabatic temperature change near the Curie temperature can be described by the following equation:
Δ H Δ T 1 / 2 = a T 1 k 1 / 2 + b T Δ T k 3 / 2
The value of T can be extracted from Equation (3) and written as follows Δ T ~ Δ H / Δ T 1 / 2 or Δ T ~ Δ H 2 / 3 . The Δ T vs. Δ H 2 / 3 dependences shown in Figure 6b were constructed to check the conformity of the Landau theory for the experimental results description. It should be emphasized that the experimental points fit a straight line well, confirming the complete applicability of Landau’s thermodynamic theory to the description of MCE of Tb0.5Er0.5Ni2 near the Curie temperature as well as for the parent compounds at high magnetic fields.

4. Conclusions

In conclusion, the solid solutions of Tb1-xErxNi2 differing in the content of particular elements (x = 0.25, 0.5 and 0.75) were prepared by the arc-melting method, and their thermomagnetic behavior was extensively investigated. The heat capacity measurements confirm that the substitution of Tb for Er atoms noticeably modifies the magnetic behavior of the Tb1−xErxNi2 system. An increase of Er concentration in the rare-earth sublattice results in magnetic dilution, i.e., in weakening of exchange interactions reflected in the decreasing ordering temperature. The TC decreases linearly from 28.3 K for Tb0.75Er0.25Ni2 to 12.9 K for Tb0.25Er0.75Ni2.
Two approaches were conducted to determine the magnetocaloric properties of the investigated compounds. The first of them, which uses the temperature measurements that depend on the heat capacity, also called the indirect method, was implemented in 0 T, 1 T and 2 T magnetic fields. The second one, conventionally called the direct method was used to measure the adiabatic temperature change ΔTad, and the results were obtained in various magnetic fields. The trend in the maximum magnetic entropy change value can be observed. The −ΔSmag increases as the content of the Er compound is becoming higher. For Tb0.75Er0.25Ni2, it is equal to 7.1 J/kgK at 28.3 K and reaches 7.8 J/kgK at 12.9 K for Tb0.25Er0.75Ni2 for a magnetic field change of 2 T. Similar dependence can be found in the case of the maximum adiabatic temperature change. As the value of ΔTad equals 2.6 K for Tb0.75Er0.25Ni2 at 28.2 K, and with increasing Er content, the ΔTad value increases to 2.8 K for Tb0.25Er0.75Ni2 in the vicinity of the Curie temperature and the magnetic field change 2 T.
The measurements performed with direct methods reveal that the maximum values of the adiabatic temperature change ΔTad is equal to 11 K near 19 K for Tb0.5Er0.5Ni2 at µ0ΔH = 14 T. Moreover, the maximum values of the adiabatic temperature change for magnetic field 1 T and 2 T obtained by implementing direct and indirect methods stays in a good agreement. Direct measurements of the adiabatic temperature change in the vicinity of the magnetic phase transition and in high magnetic fields up to 14 T have been compared with those obtained by using the Landau theory for the second-order phase transitions. It was demonstrated that the magnetization and adiabatic temperature change vs. magnetic field dependencies can be satisfactorily described by the equations derived from the thermodynamic Landau theory in high magnetic fields.
Optimal molar ratios of the individual Tb1−xErxNi2 compounds were theoretically determined to find composites suitable for use as potential refrigerants in magnetic refrigerators performing an Ericsson cycle at low temperatures. The simulated results are very promising, and the proposed candidate composite will be used in future experimental studies. The determined composite, having a high potential for the use in magnetic refrigeration devices, will be especially useful for the temperature range of hydrogen liquefaction.

Author Contributions

Conceptualization, J.Ć.; software, Y.K.; formal analysis, J.Ć., Y.K. and K.K.; investigation, J.Ć., Y.K., K.N. and B.W.; writing—original draft preparation, J.Ć.; writing—review and editing, J.Ć., E.T.-C. and K.K.; project administration, J.Ć.; funding acquisition, J.Ć. All authors have read and agreed to the published version of the manuscript.

Funding

The work was supported by the National Science Center, Poland through the OPUS Program under Grant No. 2019/33/B/ST5/01853.

Institutional Review Board Statement

Not applicable.

Informed Consent Statement

Not applicable.

Data Availability Statement

Personal library.

Conflicts of Interest

The authors declare no conflict of interest.

References

  1. Tishin, A.M.; Spichkin, Y.I. The Magnetocaloric Effect and its Applications; IOP Publishing: Bristol, UK, 2003. [Google Scholar]
  2. De Oliveira, N.A.; von Ranke, P.J. Theoretical aspects of the magnetocaloric effect. Phys. Rep. 2010, 489, 89. [Google Scholar] [CrossRef]
  3. Kitanovski, A.; Tušek, J.; Tomc, U.; Plaznik, U.; Ožbolt, M.; Poredoš, A. Magnetocaloric Energy Conversion, from Theory to Applications; Springer International Publishing: Cham, Switzerland, 2015. [Google Scholar]
  4. Bazine, W.; Tahiri, N.; el Bounagui, O.; Ez-Zahraouy, H.; Benyoussef, A. Structural, electronic, magnetic, and magnetocaloric properties in intermetallic compound TbCu2Si2. J. Magn. Magn. Mater. 2019, 481, 72–76. [Google Scholar] [CrossRef]
  5. el Boukili, A.; Tahiri, N.; Salmani, E.; Ez-Zahraouy, H.; Hamedoun, M.; Benyoussef, A.; Balli, M.; Mounkachi, O. Magnetocaloric and cooling properties of the intermetallic compound AlFe2B2 in an AMR cycle system. Intermetallics 2019, 104, 84–89. [Google Scholar] [CrossRef]
  6. Chu, F.; Chen, Z.; Fuller, C.J.; Lin, C.L.; Mihalisin, T. Superconductivity and structural transformation in HfV2 and Nb-doped HfV2. J. Appl. Phys. 1996, 79, 6405. [Google Scholar] [CrossRef]
  7. Aoki, K.; Li, X.; Masumoto, T. Factors controlling hydrogen-induced amorphization of C15 Laves compounds. Acta Metall. Mater. 1992, 40, 1717–1726. [Google Scholar] [CrossRef]
  8. Chzhan, V.B.; Tereshina, I.S.; Karpenkov, A.Y.; Tereshina-Chitrova, E.A. Persistent values of magnetocaloric effect in the multicomponent Laves phase compounds with varied composition. Acta Mater. 2018, 154, 303–310. [Google Scholar] [CrossRef]
  9. Kirchmayr, H.R.; Burzo, E. Landolt–Börnstein, New Series III/19d2; Wijn, H.P.J., Ed.; Springer: Berlin, Germany, 1990. [Google Scholar]
  10. Buschow, K.H.J. Ferromagnetic Materials, 1; Wohlfarth, E.P., Ed.; North-Holland: Amsterdam, The Netherlands, 1980. [Google Scholar]
  11. Ćwik, J.; Koshkid’ko, Y.; de Oliveira, N.A.; Nenkov, K.; Hackemer, A.; Dilmieva, E.; Kolchugina, N.; Nikitin, S.; Rogacki, K. Magnetocaloric effect in Laves-phase rare-earth compounds with the second-order magnetic phase transition: Estimation of the high-field properties. Acta Mater. 2017, 133, 230–239. [Google Scholar] [CrossRef]
  12. Ćwik, J.; Koshkid’ko, Y.; Nenkov, K.; Tereshina, E.A.; Rogacki, K. Structural, magnetic and magnetocaloric properties of HoNi2 and ErNi2 compounds ordered at low temperatures. J. Alloys Compd. 2018, 735, 1088–1095. [Google Scholar] [CrossRef]
  13. Gignoux, D.; Givord, F. Quadrupolar interactions in ErNi2. J. Magn. Magn. Mater. 1983, 31–34, 217–218. [Google Scholar] [CrossRef]
  14. Ćwik, J.; Koshkid’ko, Y.; Nenkov, K.; Tereshina-Chitrova, E.; Kolchugina, N. Correlation between the structure and thermomagnetic properties of pseudo-binary (Tb,Er)Ni2 solid solutions. J. Alloys Compd. 2021, 859, 157870. [Google Scholar] [CrossRef]
  15. Koshkid’ko, Y.; Ćwik, J.; Ivanova, T.I.; Nikitin, S.A.; Miller, M.; Rogacki, K. Magnetocaloric properties of Gd in fields up to 14 T. J. Magn. Magn. Mater. 2017, 433, 234–238. [Google Scholar] [CrossRef]
  16. Ćwik, J.; Koshkid’ko, Y.; Nenkov, K.; Mikhailova, A.; Małecka, M.; Romanova, T.; Kolchugina, N.; de Oliveira, N.A. Experimental and theoretical analysis of magnetocaloric behavior of Dy1−xErxNi2 intermetallics (x = 0.25, 0.5, 0.75) and their composites for low-temperature refrigerators performing an Ericsson cycle. Phys. Rev. B 2021, 103, 214429. [Google Scholar] [CrossRef]
  17. Ćwik, J.; Koshkid’ko, Y.; Nenkov, K.; Tereshina-Chitrova, E.; Małecka, M.; Weise, B.; Kowalska, K. Magnetocaloric performance of the three-component Ho1-xErxNi2 (x = 0.25, 0.5, 0.75) Laves phases as composite refrigerants. Available online: https://assets.researchsquare.com/files/rs-1561990/v1/55c57056-a071-4ce3-bbe2-843a20e0a7f2.pdf?c=1650484221 (accessed on 7 June 2022).
  18. Ćwik, J.; Palewski, T.; Nenkov, K. Specific heat of the Tb1-xLaxNi2 solid solutions. Acta Phys. Pol. A 2008, 113, 339. [Google Scholar]
  19. Gschneidner, K.A.; Pecharsky, V.K.; Gailloux, M.J.; Takeya, H. Utilization of the magnetic entropy in active magnetic regenerator materials. In Advances in Cryogenic Engineering Materials; Summers, L.T., Ed.; Springer: Boston, MA, USA, 1996; Volume 42. [Google Scholar]
  20. Dörr, M.; Loewenhaupt, M.; Hahn, W.; Brück, E.; Hagmusa, I.H.; Klaasse, J.C.P.; Rotter, M. Specific heat of DyCu2 single crystals in high magnetic fields. Physica B 1999, 262, 340–347. [Google Scholar] [CrossRef]
  21. Tristan, N.V.; Palewski, T.; Nenkov, K.; Skokov, K.P.; Nikitin, S.A. Magnetic properties and specific heat of the Dy3Ni intermetallic compound. J. Phys. Condens. Matter 2003, 15, 5997–6004. [Google Scholar] [CrossRef]
  22. Hashimoto, T.; Kuzuhara, T.; Sahashi, M.; Inomata, K.; Tomokiyo, A.; Yayama, H. New application of complex magnetic materials to the magnetic refrigerant in an Ericsson magnetic refrigerator. J. Appl. Phys. 1987, 62, 3873. [Google Scholar] [CrossRef]
  23. Smaïli, A.; Chahine, R. Composite Magnetic Refrigerants for an Ericsson Cycle: New Method of Selection Using a Numerical Approach. In Advances in Cryogenic Engineering Materials; Springer: Boston, MA, USA, 1996; Volume 42, pp. 445–450. [Google Scholar]
  24. Ćwik, J.; Koshkid’ko, Y.; Małecka, M.; Weise, B.; Krautz, M.; Mikhailova, A.; Kolchugina, N. Magnetocaloric prospects of mutual substitutions of rare-earth elements in pseudobinary Tb1−xHoxNi2 compositions (x = 0.25–0.75). J. Alloys Compd. 2021, 886, 161295. [Google Scholar] [CrossRef]
  25. Samanta, T.; Das, I.; Banerjee, S. Magnetocaloric effect in Ho5Pd2: Evidence of large cooling power. Appl. Phys. Lett. 2007, 91, 152506. [Google Scholar] [CrossRef]
  26. Li, L.; Nishimura, K.; Huo, D.; Kadonaga, M.; Namiki, T.; Qian, Z. Large Magnetic Entropy Change in Dy1-xHoxNi2B2C (x = 0–1) Superconductors. Appl. Phys. Exp. 2011, 4, 093101. [Google Scholar] [CrossRef]
  27. Belov, K.P. Magnetic Transitions; Bureau, C., Ed.; Consultants Bureau: New York, NY, USA, 1961. [Google Scholar]
Figure 1. Total heat capacity CP(T) of Tb0.75Er0.25Ni2 (a); Tb0.5Er0.5Ni2 (b); and Tb0.25Er0.75Ni2 (c); measured in a zero magnetic field. The calculated sum of electronic and phonon contributions Cel+ph(T) as well as estimated magnetic contribution Cmag(T) are shown. The insets in (ac) show the heat capacity as a function of temperature measured in zero, 1- and 2 T magnetic fields, respectively.
Crystals 12 00931 g001
Figure 2. Temperature dependences of the magnetic entropy Smag(T) for Tb0.75Er0.25Ni2 (a); Tb0.5Er0.5Ni2 (b); and Tb0.25Er0.75Ni2 (c); in zero, 1- and 2 T magnetic fields. The horizontal dashed lines correspond to the theoretical maximum value Smag = Rln(2J + 1), and the vertical dashed lines correspond to the magnetic phase transition temperature TC. Insets show the magnetic entropy change −ΔSmag(T) measured for the magnetic field changes of 1 and 2 T.
Crystals 12 00931 g002
Figure 3. Temperature dependences of the isothermal magnetic entropy change −ΔSmag(T) for composites based on the investigated compounds for the magnetic field change of 1 and 2 T.
Crystals 12 00931 g003
Figure 4. Adiabatic temperature change vs. temperature calculated from heat capacity data for the Tb1-xErxNi2 compounds (x = 0.25, 0.50 and 0.75) calculated for the magnetic field change: (a) µ0ΔH = 2 T; and (b) µ0ΔH = 1 T.
Crystals 12 00931 g004
Figure 5. Temperature dependences of the adiabatic temperature change, ΔTad, obtained by direct measurements for TbNi2 (a); Tb0.5Er0.5Ni2 (b); and ErNi2 (c); at different magnetic field changes µ0ΔH. The results for the binary TbNi2 (a) and ErNi2 (c) compounds taken from Refs. [11,12] are shown for comparison.
Crystals 12 00931 g005
Figure 6. The maximum adiabatic temperature change, ΔTadmax, for TbNi2, Tb0.5Er0.5Ni2 and ErNi2 (a) as a function of the magnetic field change, µ0ΔH and as a function of (µ0ΔH)2/3 (b). Solid lines present the relation ΔTad = A(µ0ΔH)2/3, with A listed in Table 3. The results for the binary TbNi2 and ErNi2 compounds are taken from Refs. [11,12].
Crystals 12 00931 g006
Table 1. Experimental results for the Tb1−xErxNi2 intermetallic compounds obtained from heat capacity data: TC is a Curie temperature; ƟD is a Debye temperature; γ is the Sommerfeld coefficient; Smag is magnetic entropy; maximum theoretically calculated at the TC temperature and at the temperature of 100 K.
CompoundTC, [K]ƟD, [K]γ, [mJ/molK2]Smag, [J/molK]
Theor., Rln(2J + 1)T = TCT = 100 K
TbNi237.1 [11]261 [18]17.5 [18]---
Tb0.75Er0.25Ni228.326254.521.7512.918.4
Tb0.5Er0.5Ni219.026452.322.1810.919.2
Tb0.25Er0.75Ni212.926850.122.629.620.5
ErNi26.5 [12]-----
Note: The values of the characteristic temperatures were calculated to an accuracy of ±0.1 K. The magnetic entropy was calculated to an accuracy of ±0.1 J/molK.
Table 2. Magnetocaloric parameters for the parent TbNi2, ErNi2 and compounds Tb0.75Er0.25Ni2, Tb0.5Er0.5Ni2, Tb0.25Er0.75Ni2 and composites based on them estimated from heat capacity measurements for the magnetic field change of 1 and 2 T. −ΔSmag is the maximum magnetic entropy change; ΔTad is the maximum adiabatic temperature change. Composite 1 is (Tb0.75Er0.25Ni2)0.46(Tb0.5Er0.5Ni2)0.194(Tb0.25Er0.75Ni2)0.346. Composite 2 is (Tb0.75Er0.25Ni2)0.491(Tb0.5Er0.5Ni2)0.115(Tb0.25Er0.75Ni2)0.394.
Compound−ΔSmag (J/kgK)ΔTad (K)
0–1 T0–2 T0–1 T0–2 T
TbNi2 [11]3.46.51.42.4
Tb0.75Er0.25Ni24.27.11.62.6
Tb0.5Er0.5Ni24.37.31.62.7
Tb0.25Er0.75Ni24.67.81.62.8
ErNi2 [12]8.613.02.23.8
Composite 12.4---
Composite 2-4.7--
Note: The values of characteristic temperatures were calculated to an accuracy of ±0.1 K. The magnetic entropy was calculated to an accuracy of ±0.1 J/kgK.
Table 3. Experimental data characterizing the adiabatic temperature change, ΔTad, due to MCE caused by the magnetic field change, µ0ΔH, for the parent TbNi2 and ErNi2 binary compounds and for the Tb0.5Er0.5Ni2 compound. A is the coefficient from equation ΔTad = A0ΔH)2/3. The data were obtained by direct measurements of ΔTad during the field change, µ0ΔH, achieved by using the extraction method in a Bitter magnet. The values of ΔTad marked with symbol are estimated by the extrapolation of the ΔTad = A0ΔH)2/3 relation.
CompoundTC (K)ΔTad (K)A (K/T2/3)
0–1 T0–2 T0–5 T0–8 T0–10 T0–14 T
TbNi2 [11]37.11.5 2.44.66.26.98.4 1.45
Tb0.5Er0.5Ni219.01.52.6 0–1.8 T5.68.09.011.01.95
ErNi2 [12]6.22.1 3.56.28.89.812.2 2.13
Notes: the characteristic temperatures were calculated to an accuracy of ±0.1 K.
Publisher’s Note: MDPI stays neutral with regard to jurisdictional claims in published maps and institutional affiliations.

