Article

Room-Temperature 181Ta(TiO2): An e-γ TDPAC Study

1
II. Physikalisches Institut, Georg-August Universität Göttingen, 37077 Göttingen, Germany
2
European Organization for Nuclear Research (CERN), 1211 Geneva, Switzerland
3
Institute for Materials Science and Center for Nanointegration Duisburg-Essen (CENIDE), University of Duisburg-Essen, 45141 Essen, Germany
4
Helmholtz-Institut für Strahlen- und Kernphysik, University of Bonn, 53115 Bonn, Germany
5
Institut Laue-Langevin, 38042 Grenoble, France
6
Escola Politécnica, Universidade de São Paulo, 158 Av. Prof. Luciano Gualberto, 05508-900 São Paulo, Brazil
*
Author to whom correspondence should be addressed.
Crystals 2022, 12(7), 946; https://doi.org/10.3390/cryst12070946
Submission received: 8 March 2022 / Revised: 25 June 2022 / Accepted: 27 June 2022 / Published: 5 July 2022
(This article belongs to the Section Crystal Engineering)

Abstract

:
In this work, we report on the hyperfine parameters of the foreign 181Ta probe in the rutile structure of the single crystal TiO2 using the e−γ and γ−γ time differential perturbed angular correlation (TDPAC) technique. We implanted 181Hf ions into a sample of single crystal rutile TiO2 in the Bonn Isotope Separator. The implanted sample was then thermally annealed at a temperature of 873 K for 315 min in a vacuum. The 181Hf radioisotopes decayed by β emission, followed by a cascade to the ground of γ rays or conversion electrons into a stable state 181Ta. The 181Ta probe substitutes the Ti lattice site with a unique nuclear quadrupole interaction, allowing for the precise measurement of the largest electric field gradient (Vzz) and asymmetry parameter (η). The hyperfine parameters obtained from the e−γ TDPAC spectroscopy agree with those of the γ−γ TDPAC spectroscopy at room temperature, apart from a calibration factor, both from our experiments and the literature. This suggests that the electronic recombination following the internal conversion of the L shell electron takes less time (ps) than the intermediate lifetime of the metastable 181Ta state (ns).

1. Introduction

In this work, we investigate the hyperfine parameters obtained by applying the room-temperature spectroscopic technique of e−γ time differential perturbed angular correlation (TDPAC) to 181Hf→181Ta probe nuclei implanted in single crystal rutile TiO2 as host material (this is called 181Ta(TiO2) e−γ TDPAC spectroscopy hereinafter).
TiO2, also known as titanium dioxide in the literature, is a solid inorganic compound with wide technological applications in the industry. Pure TiO2 crystal is available in three phases: rutile, anatase, and brookite [1]. Anatase and brookite are metastable states and thus convert irreversibly into rutile TiO2 upon heating to 600–800 °C and beyond in air [2]. Typical uses of TiO2 include but are not limited to (1) photocatalytic applications [3,4], (2) as an ultraviolet-light blocker in sunscreen materials [5], and (3) as a white pigment or whitening material in various everyday commodities such as paints, papers, foods, medicinal pills, tablets, and toothpaste [6].

1.1. State of the Art (181Ta(TiO2) γ−γ TDPAC Spectroscopy)

The first 181Ta(TiO2) γ−γ TDPAC spectroscopy was done by Adams & Catchen [7]. They measured the hyperfine parameters of a 181Ta probe in bulk polycrystalline rutile TiO2 over a wide range of temperatures, acquiring signals corresponding to the presence of the single-site electric-field gradients (EFGs), but no local magnetic ordering in 181Ta(TiO2). This was confirmed by Darriba et al. in their corresponding temperature-dependent study of bulk single crystal rutile 181Ta(TiO2), accompanied by their ab initio density-functional theory simulations to explain the effect of the background temperature on the EFG of rutile 181Ta(TiO2) [8].
Further studies of 181Ta(TiO2) γ−γ TDPAC spectroscopy at room temperature were conducted by a group in the Bhabha Atomic Research Centre. They measured the EFGs of the bulk 181Ta(TiO2) system in both the rutile and anatase crystalline phases [9] and probed the EFGs of the 181Ta probe in the TiO2 nanocrystal environment [10]. The room-temperature TDPAC signature(s) of the 181Ta probe located at both the surface and the bulk of the TiO2 nanocrystal (anatase and rutile) were obtained. They simultaneously implanted both 111In→111Cd and 181Hf→181Ta probe nuclei into a bulk rutile TiO2 sample and detected signals corresponding to the EFGs of 111Cd and 181Ta, located at the substitutional sites of the TiO2 sample [11]. Their research applications involved the study of the γ-radiation and the leaching behavior on the 181Ta(TiO2) crystal matrix [12].
Schell et al. conducted 181Ta(TiO2) γ−γ TDPAC spectroscopy over a range of temperatures, the host TiO2 material being a thin film instead of the usual bulk phase [13,14]. They collected TDPAC signals corresponding to the presence of the EFGs of the 181Ta probe at two unique sites of the thin film TiO2. The magnitude of the EFGs at one such site suggests that the local environment of the 181Ta probe nucleus is like that of anatase TiO2, suggesting that the implantation of the 181Hf nucleus modifies the local structure of the TiO2 thin film.
Finally, at the 2011 International Nuclear Atlantic Conference held in Belo Horizonte (Brazil), Martucci et al. presented their 181Ta(TiO2) TDPAC and their corresponding X-ray diffraction (XRD) results on the effects of thermal annealing on polycrystalline samples produced using the sol-gel Pechini method [15]. A literature review of the sol-gel Pechini method [16] on the precipitation of TiO2 powder reveals the formation of anatase and rutile phases, with their ratio determined by the molar ratio of citric acid/metallic Ti cations as reagents [17]. They have shown that if their TiO2 powder is subjected to a 10 h thermal annealing of 1273 K in the nitrogenic atmosphere, their XRD and 181Hf→181Ta γ−γ TDPAC spectroscopies demonstrate a complete phase transformation from the anatase phase to the rutile phase, consistent with reference [2].
Further literature on TDPAC spectroscopy applied to TiO2 is available in reference [18], which gives room-temperature results from various TDPAC probes.

1.2. Physics and Properties of Rutile TiO2

Bulk rutile TiO2 is spatiality related to the tetragonal space group P42/mnm [19]. The lattice parameters of the unit cell are such that it has lattice translational vectors R = i 1 , 2 , 3   n i a i , where i 1 , 2 , 3 ,     n i , alongside a 1 = a x ^ ,     a 2 = a y ^ , a 3 = c z ^ , with the lattice parameters a = 4.65922 Å and c = 2.9574 Å [20]. The unit cell comprises of 2 titanium ions, located at both [0,0,0] and [0.5a,0.5a,0.5c], and 4 oxygen ions, located at [±xa,±xa,0] and [(0.5 ∓ x)a,(0.5 ± x)a,0.5c], where x is defined as the internal parameter, is dimensionless and is experimentally verified as 0.30496 [20].
Under this perfect lattice configuration, both of the titanium ions in the unit cell are site-equivalent, forming bonds with its 6 nearest neighbor oxygen ions under the distorted octahedral geometry. It is more precisely understood as having a D2h site symmetry. Each of the oxygen atoms in the unit cell are site-equivalent as well, forming a 3-fold coordinated bond with its 3 nearest neighbor titanium ions in a trigonal planar form, their site symmetry being C2v.
In practice, high-quality single crystal rutile TiO2 could be commercially manufactured using, for example, the Verneuil method [21]. However, it is known that even for such a refined method, there exists a non-trivial number density of oxygen vacancies (site defects where the supposing oxygen atoms are missing) for freshly fabricated single crystal rutile TiO2. This phenomenon has been verified over the course of numerous experiments, including a recent 2018 experiment using the Femtosecond Time Resolved Spectroscopy on bulk rutile TiO2 to determine its charge carrier dynamics. This revealed that the presence of innate oxygen vacancies as a trap site contributes to a fast recombination/annihilation lifetime (<1 ns) of the electrons (as a charge carrier) [22].
The existence of the oxygen vacancies (if numerous enough) creates a large density of localized states in the band gap of rutile TiO2. As the name implies, electrons in these localized states are not mobile (compared to the delocalized states at the valence and conduction bands). However, quantum tunneling between localized states is possible. With that principle, an electron can travel from one localized state to another, a phenomenon known as “hopping transport”, “variable range hopping”, or “hopping conduction” [23,24].
At the surface and interfaces, the phenomenon of hopping transport becomes a lot more important due to the existence of surface states (another set of localized electronic states) caused by the sharp transition (surface reconstructions) between atoms of both materials located near the interface (air and vacuum can be understood as material in this sense) [23].
Numerous experimental studies have been conducted on the nature of the electronic surface states of rutile TiO2, which (1) includes the longer vacuum decay length of the Ti(3d) surface electronic states over the O(2p) surface electronic states (discovered using Scanning Tunnel Microscopy) [25], (2) the nature of the oxygen adatoms at the surface (using sensitive Fast Atomic Force Microscopy), which could exist as single quantum dots [26], and (3) a paper that explores on the electronic structures of rutile (110), anatase (101) and anatase (001) single crystal surfaces using Resonant Photoemission and X-ray Absorption Spectroscopy [27]. They have discovered that the rutile single crystal surfaces, prepared under cycles of bombarding and annealing in a vacuum, show a higher concentration of oxygen vacancies over the anatase variant, which is consistent with the findings of [22]. Moreover, they have shown that the method of surface preparation, and thus, the concentration of the oxygen vacancies, is proportional to the σ -antibonding hybridization between the Ti(3d-eg) and the O(2p) states (using X-ray Absorption Spectroscopy), and that the π -bonds between the Ti(3d-t2g) and the O(2p) states are increasingly disrupted as the amount of surface defects increases (using Resonant Photoemission).
Theoretically, Density Functional Theory (DFT) techniques have been used to study the electronic structure of bulk rutile TiO2 with various point defects (including oxygen vacancies) [28], alongside the electronic structure of surface rutile TiO2 in various surface orientations [29].
To encapsulate the discussion in this section, semiconductor oxides like TiO2 present very interesting electronic properties in the hopping transport (a form of quantum-mechanical tunneling), which, once well-understood, can increase the number of high technological applications of the material, including the enhancement of its photocatalysis capability [24,30].

1.3. Motivation for Applying the e−γ TDPAC Spectroscopy to the TiO2 Material

The e−γ TDPAC spectroscopy could probe physics typically inaccessible from its much more experimentally established γ−γ TDPAC counterpart. The degree to which the e−γ and γ−γ TDPAC signals differ from each other depends on the timescale (and hence speed) of the host material to provide its recombination electrons to the TDPAC nuclear probe following internal conversion of the excited 181Ta to ground state 181Ta as a TDPAC probe (Further details are contained in Section 2).
This is wonderfully demonstrated in the recent 181Ta(GaN) TDPAC experiment by Barbosa et al. [31], where they have performed a temperature- and “Si- and Zn- dopant” concentration-dependent study. In Figure 1 of the corresponding paper, they had shown that their e−γ signals differ from those of the corresponding γ−γ signals. Furthermore, with the help of their in-house dynamic fitting program PACmeTM and DFT, they can assign electronic charges to the metastable states related to their e−γ signals. These metastable states represent the various stages (around the nanosecond scale) in which the recombination electrons will fill the holes following the internal conversion process of the excited 181Ta to ground state 181Ta as a TDPAC probe (Further details are contained in Section 2 as well).
On a related note on the topic of electronic recombination, Schell et al. have conducted and compared the signals acquired from both single crystals (111In→111Cd)TiO2 and (111mCd→111Cd)TiO2 TDPAC spectroscopies [32]. While both TDPAC spectroscopies exhibit a common set of hyperfine parameters (largest EFG and asymmetry parameter, see Section 2) relating to the Ti-substitutional site, an additional set of hyperfine parameters (with a high asymmetry parameter) is manifested in the (111mCd→111Cd)TiO2 TDPAC spectroscopy (colloquially referred to as the second site). DFT simulations accompanying this study also revealed that the individual EFGs (and hence the largest EFG and the asymmetry parameter, see Section 2) of a single charge-deficient Cd atom resting in the Ti-substitutional site is consistent with the second site. Noting that the valence number of 111In and 111mCd in TiO2 are +3 and +2, respectively, (Ti has a valence number of +4), and the fact that the half-life of the intermediate 111Cd state is 85ns, 111In→111Cd requires only one recombination electron from the host TiO2 material, whereas 111mCd→111Cd needs two. This implies that, at least qualitatively, the time needed to fill up two holes in a single 111Cd atom sitting in the Ti-substitutional site is around the order of tens of nanoseconds.
Thus, e−γ TDPAC spectroscopy, complementing γ−γ TDPAC spectroscopy, can probe even further into the electronic structure in TiO2, both in the bulk and on the surface. For bulk rutile TiO2, we can compare the degree to which their e−γ and γ−γ 181Ta(TiO2) TDPAC signals differ, to verify that the recombination lifetime of the electrons is indeed on the sub-ns scale according to [22]. Further possible applications of e−γ TDPAC on TiO2 could be done on its surfaces and interfaces, where we can further probe the local electronic characters of the Ti and O ions around our TDPAC probe in a more precise manner as compared to other typical experimental methods.

2. Time Differential Perturbed Angular Correlations

TDPAC spectroscopy is a technique used in solid-state nuclear physics. It is sufficiently sensitive to observe the hyperfine interactions between the nuclear moments of the incorporated TDPAC probe and the local electric and magnetic fields of the immediate surrounding host material. This implies that precise measurements of the local EFGs and the local hyperfine magnetic field of the host material can be determined (see references [33,34,35] for an overview). This allows for the study of the structural and electronic properties of the host material applicable to the relevant fields of physics [36,37], chemistry [38], and even biology [39]. One advantage of TDPAC spectroscopy is that it requires only parts per billion number density of TDPAC probe atoms for effective characterization, keeping the electronic structure of the host material virtually intact.
In a typical TDPAC experiment, a suitable TDPAC probe is introduced into a host material. It can occupy an interstitial (in between the native ions in the lattice of the host material) and/or substitutional (directly occupying the space in which the native ions should sit) position, depending on the annealing conditions and probe-incorporation methods. The typical TDPAC probe then undergoes a consecutive two-stage decay (Figure 1a); with each stage of decay, a particular particle is released into the environment and then captured by the relevant detectors for signal acquisition. In the intermediate state of the TDPAC probe, which is defined as the state after the first-stage decay but before the second-stage decay, its nuclear moments can be coupled to the surrounding local electric or magnetic fields of the host material. This process can alter the direction of the emission of the gamma ray or conversion electron associated with the second-stage decay relative to the first-stage decay.
For the more traditional gamma-gamma (γ−γ) TDPAC spectroscopy, γ rays of various energies are released at each stage and acquired by the compatible photomultiplier tubes of the detectors (Figure 1b). Both γ rays are associated with the consecutive de-excitation of the nucleus of the TDPAC probe.
ISOLDE-CERN [41] is equipped to perform electron-gamma (e−γ) TDPAC spectroscopy [42,43] with Siegbahn-type magnetic lenses [44] to detect the conversion electrons arising from the first stage of the decay (Figure 1c), and the corresponding γ rays arising from the second stage of 181Hf decay.
Thus, the subtle difference between γ−γ TDPAC spectroscopy and e−γ TDPAC spectroscopy comes from the change in the local electronic environment of the host material around the vicinity of the implanted TDPAC probe after the first stage of decay. This is especially applicable to e−γ TDPAC spectroscopy because, in the first-stage decay, the excited nucleus interacts with specific inner-shell electron(s), resulting in the ejection of the given electron from the TDPAC probe nucleus. This process is called “internal conversion” in the literature, and the ejected electron is called a “conversion electron” (See left side of Figure 2).
In response to the vacancy left in the electronic inner shell of the TDPAC probe by the conversion electron, an electron cascade (or recombination process) occurs, where electrons from the higher-energy shells fill the lower-energy shells emitting characteristic X-rays, Auger electrons, or both. The process of electron cascade terminates when the vacancy (hole) induced by the ejection of the conversion electron is transferred to the valence shell of the TDPAC probe and filled by “recombination electrons” provided by the host material (See right side of Figure 2).
For the first-stage process of an isomer probe in γ−γ TDPAC spectroscopy, the TDPAC probe nucleus is de-excited, releasing γ rays of a specific energy that thus do not interact with the electron shells of the TDPAC probe. This is not the case with probes decaying via electron capture, such as 111In(111Cd). However, 181Hf decays via the beta-minus emission to the 1/2+ excited nuclear level in 181Ta. This level has a half-life of 17.6 μs [45], which is long enough for electronic rearrangements. Thus, no after-effects [46] from the primary 181Hf decay are expected in the subsequent TDPAC cascades proceeding via the 5/2+ state with a 10.8 ns half-life (See Figure 1a for the 181Hf→181Ta decay path).
This scenario implies that if the electron recombination process is at least on the order of the half-life t1/2 of the intermediate stage of the 181Hf(181Ta) probe or above, we should observe, for e−γ TDPAC spectroscopy, a characteristic dynamic signal determined by the hyperfine parameters that differs significantly from the characteristic signal of the corresponding γ−γ TDPAC spectroscopy. Conversely, if the recombination process is much less than t1/2 of the intermediate stage of the TDPAC probe, then both e−γ and γ−γ TDPAC spectroscopy will produce the same hyperfine parameters.
The use of e−γ TDPAC spectroscopy dates back to the 1970s [47,48,49,50] with the experimental group HISKP from the University of Bonn. Their e−γ TDPAC spectrometer was significantly upgraded later and brought to its full capacity at the Solid-State Physics ISOLDE-CERN facility in the early 1990s [42,43,44]. Recent experiments using the modern e−γ TDPAC spectrometer include a temperature- and “Si- and Zn-” dopant concentration-dependent study on 181Ta(GaN) [31], which provides signals related to the recombination process and with the help of simulations based on DFT. On this basis, researchers ascribe this phenomenon to variable-range hopping in the low-temperature regime and thermally mobile electrons (electrons in the conduction band) in the high-temperature regime.
Signals from bulk 181Ta(TiO2) γ−γ TDPAC spectroscopy (single crystal and polycrystalline) reveal only significant electric quadrupole interactions but not magnetic dipole interactions. Sufficient annealing allows the detection of γ−γ TDPAC signals corresponding to the presence of the EFGs of a single unique site (See Appendix A for more details). Thus, we expect 181Ta(TiO2) e−γ TDPAC spectroscopy to produce a signal like that of EFGs corresponding to a single unique site. The EFG magnitudes detected by 181Ta(TiO2) e−γ TDPAC spectroscopy may differ from that detected by the corresponding γ−γ TDPAC spectroscopy if the recombination time is on the order of the half-life t1/2 of the intermediate stage of 181Ta. Otherwise, we would expect the same EFG magnitudes from both e−γ and γ−γ TDPAC spectroscopy.
For 181Ta(TiO2) γ−γ TDPAC spectroscopy, the energy of the first (second) γ emission (γ1 and γ2 emission) has an energy of 133 keV (482 keV). The perturbation angular correlation function W θ , t that describes the time-dependent modification of the direction of the γ2 emission with respect to that of the γ1 emission may be expressed as:
W θ , t = k = 0 ,   even k max A k k G k k t   P k cos θ ,
where A k 1 k 2 is the γ1−γ2 anisotropy term defined as A k 1 k 2 = A k γ 1 A k γ 2 , with A k γ 1   and A k γ 2 called the orientation and correlation anisotropy coefficients [35], θ is the angle between the γ1 and γ2 emission, and G k k t is the time-dependent perturbation factor related to the internal dynamics of the 181Ta probe in the TiO2 environment and is not related to the external angle θ . It is given explicitly in Equation (4) reference [35]. Finally, P k x is the Legendre polynomial of order k .
We used a four/six-detector setup with planar geometry, implying that each detector forms a 90° angle to its adjacent neighbors. Therefore, the possible values of θ are 90° and 180°. In a coincidence search, we can express the coincidence count rate N θ , t as
N θ , t = N 0 exp t τ N W θ , t + C ,
where τ N = ln 2 / t 1 / 2 is the lifetime of the intermediate state, N 0 is the coincidence count rate at t = 0 , and C is a constant that describes a time-independent background count rate that arises from random coincidences and is subtracted.
Note that (1) A 0 γ 1 = A 0 γ 2 = 1   and   G 00 t = 1 and (2) the lower-order k terms contribute much more than the higher-order k terms. Setting the cutoff at k max = 2 gives the following terms:
N 90 ° , t N 0 exp t τ N 1 1 2 A 22 G 22 t ,  
180 ° , t N 0 exp t τ N 1 + A 22 G 22 t .
Thus, by combining Equations (3) and (4), we obtain the count rate ratio R(t) as
R t = 2 N 180 ° , t N 90 ° , t N 180 ° , t + 2 N 90 ° , t A 22 G 22 t .
One implicit assumption in the derivation of Equation (5) is that the terms N 90 ° , t and N 180 ° , t are the arithmetic mean of all the possible start-stop coincidences from the different possible combinations of the detectors from the entire detector setup. For example, in standard six-detector γ−γ TDPAC spectroscopy, one counts 24 unique 90 ° start-stop coincidences and six unique 180 ° start-stop coincidences. In the standard four-detector γ−γ TDPAC spectroscopy, one counts eight unique 90 ° start-stop coincidences and four unique 180 ° start-stop coincidences.
However, in four-detector e−γ TDPAC spectroscopy, the electron detector only detects conversion electrons and the γ ray detectors only detect γ rays. In addition, the detection of the conversion electrons serves as the start signal, and the detection of the relevant γ rays serves as the stop signal, so one counts only two unique 90 ° and 180 ° start-stop coincidences each. This reduces the statistics of the e−γ TDPAC spectroscopy with respect to its γ−γ cousin.
Given that the total angular momentum I of the intermediate state of the 181Ta probe is 5/2, a pure electric quadrupole interaction associated with the presence of non-zero EFGs causes the intermediate state E 0 to hyperfine split into three sub-energy levels denoted E 1 / 2 , E 3 / 2 , E 5 / 2 . Reference [35] gives
E 5 2 = E 0 2 r cos φ 3 ω Q ,
E 3 2 = E 0 + r cos φ 3 3 r sin φ 3 ω Q ,
E 1 2 = E 0 + r cos φ 3 + 3 r sin φ 3   ω Q .
φ and the quadrupole frequency ω Q are given by
cos φ = q r 3 ,
r = p ,
p = 28 1 + η 2 3 ,
q = 80 1 η 2 ,
ω Q = e Q V z z 40 ,
where Q is the quadrupole moment of the intermediate state of the 181Ta probe, which is 2.36 5   barns according to reference [51]. The EFGs of the local TiO2 environment that surrounds the 181Ta probe can be expressed by using two independent parameters: the largest magnitude of the EFGs, denoted V z z , and the asymmetry parameter η 0 , 1 , which is given as
η = V y y V x x V z z ;   V x x V y y V z z .
Thus, the perturbation function G 22 t is written as
G 22 t = s 0 η , θ , φ + i = 1 3 s i η , θ , φ exp δ ω i t cos ω i t .
All three precession frequencies ω 1 , ω 2 , ω 3 depend on V z z and η and are written as
ω 1 = E 3 / 2 E 1 / 2 / = 2 3 r sin φ 3 ω Q ,
ω 2 = E 5 / 2 E 3 / 2 / = 3 r cos φ 3 3 r sin φ 3 ω Q ,
ω 3 = E 5 / 2 E 1 / 2 / = 3 r cos φ 3 + 3 r sin φ 3   ω Q .
Also, s i η , θ , φ are the coefficients that, for the polycrystalline case, depend only on the asymmetry parameter η , and for the single crystal case, depend on both η and the orientation of the V z z with respect to the axes of the detector plane, and is represented (in our experimental fitting) by two independent parameters of the spherical coordinate system θ , φ [8,52]. s 0 η , θ , φ is often called the “hard-core value” in the literature. The values for s i η , θ , φ for a single crystal host material are derived in references [34,35].
In practice, we also define as follows the fundamental frequency ω 0 that frequently appears in the fitting parameters:
ω 0 = 6 ω Q .
Experimentally, the lattice of the host material is not perfect, and the local environment (and thus the EFGs) may differ slightly for different implanted probes. The degree of difference between the EFG of different probes is described by the Lorentzian damping factor δ , which causes the exponential damping of G 22 t . In an ensemble of 181Ta probes that contributes to G 22 t , each of the individual precession frequencies follow a Lorentzian distribution with the corresponding mean ω i . For a sufficiently annealed 181Ta(TiO2) sample, we expect most implantation damage to be repaired, and thus that δ will be small. This was demonstrated by Darriba et al. [8].
Therefore, the final equation of our experimental fit for 181Ta(TiO2) γ−γ TDPAC spectroscopy is
R t A 22 s 0 η , θ , φ + i = 1 3 s i η , θ , φ exp δ ω i t cos ω i t .
For 181Ta(TiO2) e−γ TDPAC spectroscopy, we must incorporate b k , the so-called particle parameter correction factor, into A k 1 k 2 defined in Equation (1) [53,54]. Thus, the equation used for our experimental fit is modified from Equation (20) into the following similar form:
R t A 22 s 0 η , θ , φ + i = 1 3 s i η , θ , φ exp δ ω i t cos ω i t ;   A 22 = b 2 A 22 .

3. Experimental Setup

3.1. Implantation of 181Hf Isotope at the Bonn Radioisotope Separator

The radioactive isotope 181Hf (half-life of 42.4 days) was produced by irradiating 1.5 mg of hafnium oxide (HfO2) powder for 6 days in a thermal-neutron flux of 10 15   n   cm 2   s 1 in the V4 beam tube of the high-flux reactor of Institut Laue-Langevin (ILL) in Grenoble, France. The 180Hf isotope in the hafnium oxide undergoes neutron capture [180Hf(n,γ)] to produce the desired 181Hf isotope.
Single crystal rutile TiO2 substrates measuring 10 × 10 × 1.0 mm3 were commercially purchased from Crystal GmbH in Germany [55] (See Figure 3 for a photograph of the crystal(s)). The samples were then brought to the Bonn Radioisotope Separator, where a long side of the sample was ion-implanted with 181Hf isotope at 80 keV and an incidence angle of 10° with respect to the normal of the sample. The beam-sweeping technique was employed, ensuring that the implanted face of the sample was homogeneously covered with the implanted 181Hf isotope.
Technical details of the implantation process and the Bonn Radioisotope Separator are available in references [13,56].
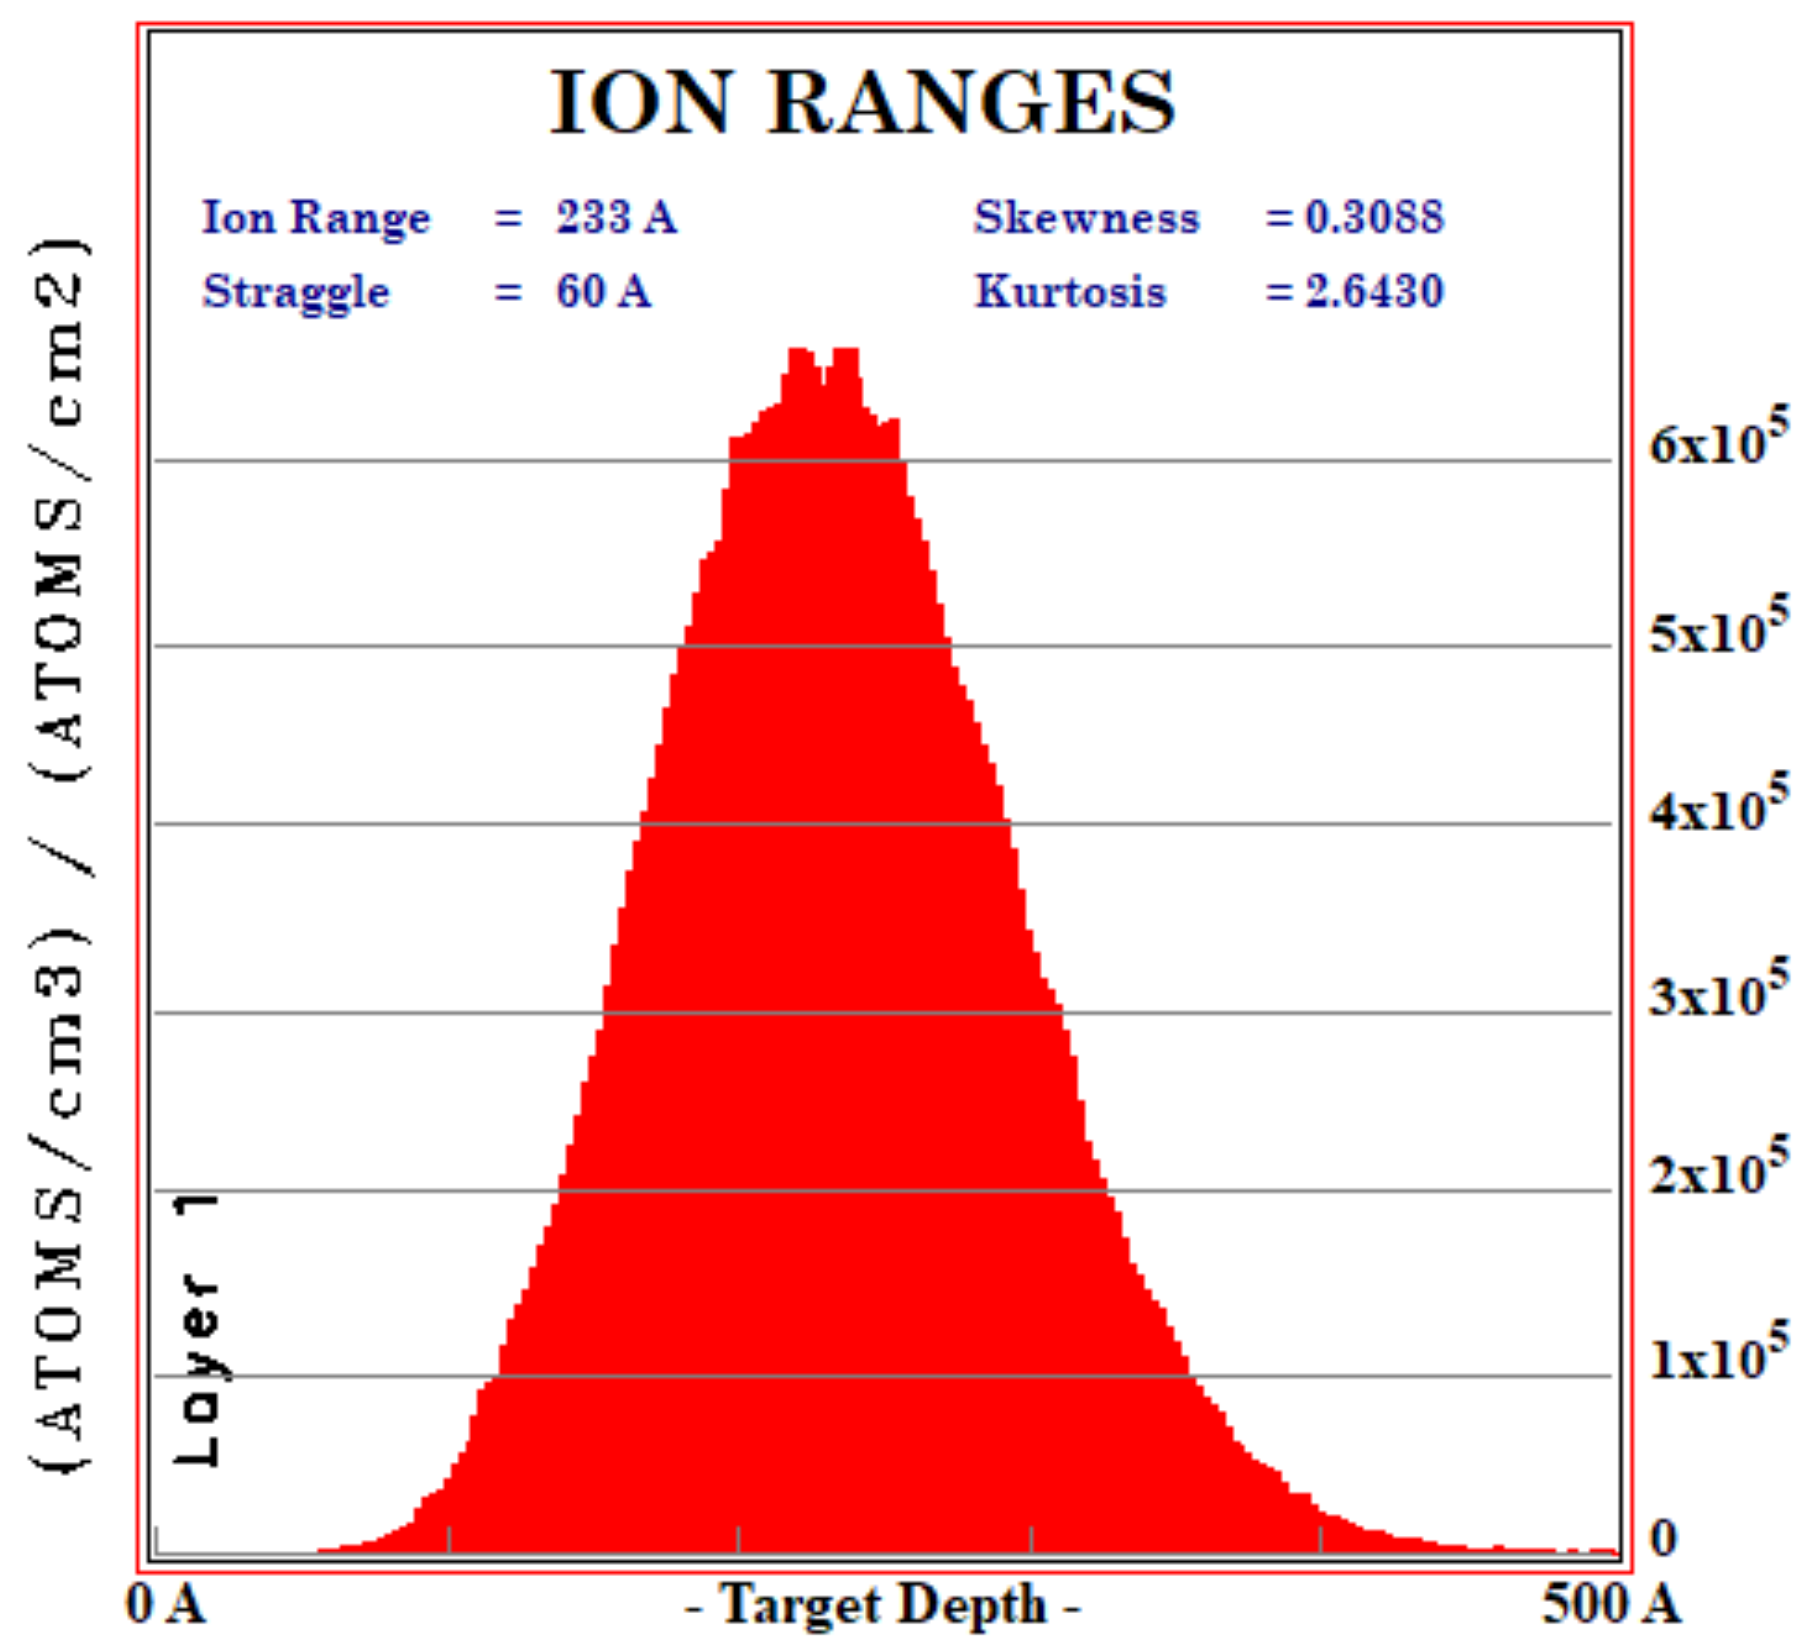
A quick and naive calculation of the stopping and range of ions in matter (SRIM) for the implantation of 181Hf in rutile TiO2 using the stoichiometric composition and with a density of 4.25 g/cm3 [57] reveals a peak of 233 Å with a standard deviation of 60 Å (Figure 4). This implies that the 181Hf isotope is deeply embedded in the bulk region of the rutile TiO2 substrate. Thus, short of thermal diffusion at sufficiently high temperatures, we would expect our resulting TDPAC signals of 181Ta to probe the bulk region of TiO2.

3.2. Data Accquisition of 181Ta(TiO2) γ−γ and e−γ TDPAC Spectroscopy

The resulting samples were then safely transported to the SSP lab at ISOLDE, CERN, where they were sufficiently annealed at a temperature of 873 K in a vacuum for 5.25 h to repair the damage and the distortion to the TiO2 lattice caused by 181Hf-ion implantation and to allow 181Hf to diffuse to a preferable site.
The samples were then analyzed by both γ−γ and e−γ TDPAC spectroscopies. For the γ−γ TDPAC spectroscopy, six CeBr3 scintillators in the standard geometry [58] were used in a coincidence setup of the 133−482 keV γ cascade of the 181Ta isotope (Figure 1a,b).
For the e−γ TDPAC spectroscopy, the coincidence setup consists of two electron detectors and two γ-ray detectors. The electron detectors consist of magnetic lenses of the Siegbahn type [43] that focus the 122 keV conversion electrons arising from the internal conversion onto fast plastic scintillator detectors (Figure 1a,c). In contrast, the corresponding γ-ray detectors consist of BaF2 scintillators that detect the 482 keV γ rays arising from the decay of the 5/2+ level (Figure 1a,b). Note that due to the magnetic dispersive elements, the electron detectors have a better energy resolution than the corresponding γ-ray detectors [43,44].
For e−γ TDPAC spectroscopy, we placed one such sample in the preferred Raghavan geometry configuration [59], where the long side of the 181Ta(TiO2) sample (the 10 × 10 mm2 side) makes a 45° angle with the detectors in the x-y plane of the detector setup. Another such sample was used for the γ−γ TDPAC spectroscopy. However, the sample could not be mounted in the Raghavan geometry due to vertical constraints. Hence the sample was additionally tilted at an angle with respect to the z-axis.
The corresponding raw TDPAC signals were then processed, first through InterludeTM [60] to extract out R(t) and then through Gfit19 TM, which is a modified version of the NNfit TM software package [61,62,63]. For the six-detector γ−γ TDPAC spectroscopy setup, we produce four R(t) graphs, three of which correspond to the four-detector setup in the x-y, x-z, and y-z plane, while the last R(t) graph corresponds to the full six-detector setup. With the four-detector e−γ TDPAC spectroscopy setup, we produce only a single R(t) graph. Given that the concept of angles is ill-defined for R(t) corresponding to the six-detector setup, we use the polycrystalline fit instead of the single crystal fit, unlike the other R(t) graphs. In addition, we verified with Nightmare TM that R(t) fits independently [64].
Based on private communication with Correia [53,54,65,66,67,68] and alongside the geometry of both our TDPAC setups, we use the following parameters for the effective Akk values for the γ−γ TDPAC spectroscopy:
A 22 = 0.2213 ,   A 24 = 0.0276 ,   A 42 = 0.1491 ,   A 44 = 0.0186   .
For our e−γ TPDAC spectroscopy, we use
A 22 = 0.3077 ,   A 24 = 0.0494 ,   A 42 = 0.0803 ,   A 44 = 0.0129 .
Finally, our time calibration is 0.101 ns/channel for our γ−γ TDPAC spectroscopy and 0.195 ns/channel for our e−γ TDPAC spectroscopy.

3.3. X-ray Diffraction of the 181Ta(TiO2) Sample after the γ−γ and e−γ TDPAC Spectroscopy

After the completion of both 181Ta(TiO2) γ−γ and e−γ TDPAC spectroscopies, both samples, as well as another fresh and commercially manufactured rutile TiO2 sample bought from Crystals GmbH [55] (for reference), were sent to the University of São Paulo, Brazil. X-ray diffraction (XRD) using the Empyrean diffractometer (Malvern Panalytical, [69]) was conducted on the samples to determine their global crystalline structure unambiguously. We have also compared our diffractogram(s) to the corresponding results produced in the paper of Guo et al. [70], in which the mentioned researchers fabricated their own single crystal rutile TiO2 from powdered anatase TiO2 using the floating zone method (See [71] for a detailed explanation of the floating zone method).
In the Empyrean diffractometer, the crystal is, with its long side (the 10 × 10 mm2 side), placed face up in the goniometer and was subjected to a beam of X-rays ( K α , K β lines) produced by the deceleration of the electrons in the copper plate target. The voltage and current of the electrons are 45 kV and 40 mA. The sample is then rotated through an angle of 5 to 80 degrees, with a step size of 0.013 degrees and a step time of 2 s. X-rays (both background and crystal-reflected) in the direction of the angle are hence captured by the detectors in the Empyrean diffractometer. To generate the diffractogram, we subtract the background intensity (measurements with the absence of the crystal) from the observed intensity, which is succinctly referred to as “Icalc” in the outputs of the Empyrean diffractometer. Considering the kinetic energy of the electrons, and that we are analyzing a commercially manufactured single crystal rutile TiO2, we expect our diffractogram to mainly reflect a single dominant peak in a specified crystalline direction.
The peaks of the diffractogram are fitted with the corresponding analysis software graciously provided onboard the Empyrean diffractometer, giving various information such as the full width at half maximum (FWHM), crystalline size, and micro strain. With this XRD analysis, we could investigate, in more detail, the effects of the implantation of the 181Hf isotopes and the subsequent annealing with respect to our single crystal rutile TiO2 sample.
As this discussion detracts us from the main TDPAC study, we would only mention and validate the results of the XRD diffraction in the main section of the paper. More details on the effects of ion implantation and thermal annealing are elaborated in Appendix A.

4. Results

4.1. γ−γ TDPAC Spectroscopy Setup

The left half of Figure 5 shows R(t) (blue data points) in different geometries after the corresponding raw TDPAC signal was processed with Interlude. The right half of Figure 5 shows the corresponding cosine fast Fourier transform (FFT), which displays the frequencies ω i , i 1 , 2 , 3 that drive R(t) (Equation (20)), the peak amplitudes [ A 22 s i η ,   i 1 , 2 , 3 ], and their spread (delta Lorentzian δ ).
Information on the hyperfine parameters contained in R(t), along with the corresponding FFT, are then extracted in the fitting process with Gfit19TM (red curves in Figure 5).
The peaks of the FFT were marked with magenta arrows, with the values of the hyperfine parameters and the relevant experimental information tabulated in Table 1.
V z z   is written in a different convention because the error from the quadrupole moment Q dominates the error for V z z in Equation (13) by several orders of magnitude.
To compare with the e−γ TDPAC spectroscopy setup, we use averaged values for the fundamental frequency ω 0 , the asymmetry parameter η , and the largest component of the electric-field gradient V z z arising from a set of single γ−γ TDPAC measurements in all four geometries. The quoted uncertainty for the averaged hyperfine parameters is the square root of the sum of squares of each of the measurement’s statistical uncertainty.

4.2. e−γ TDPAC Spectroscopy Setup

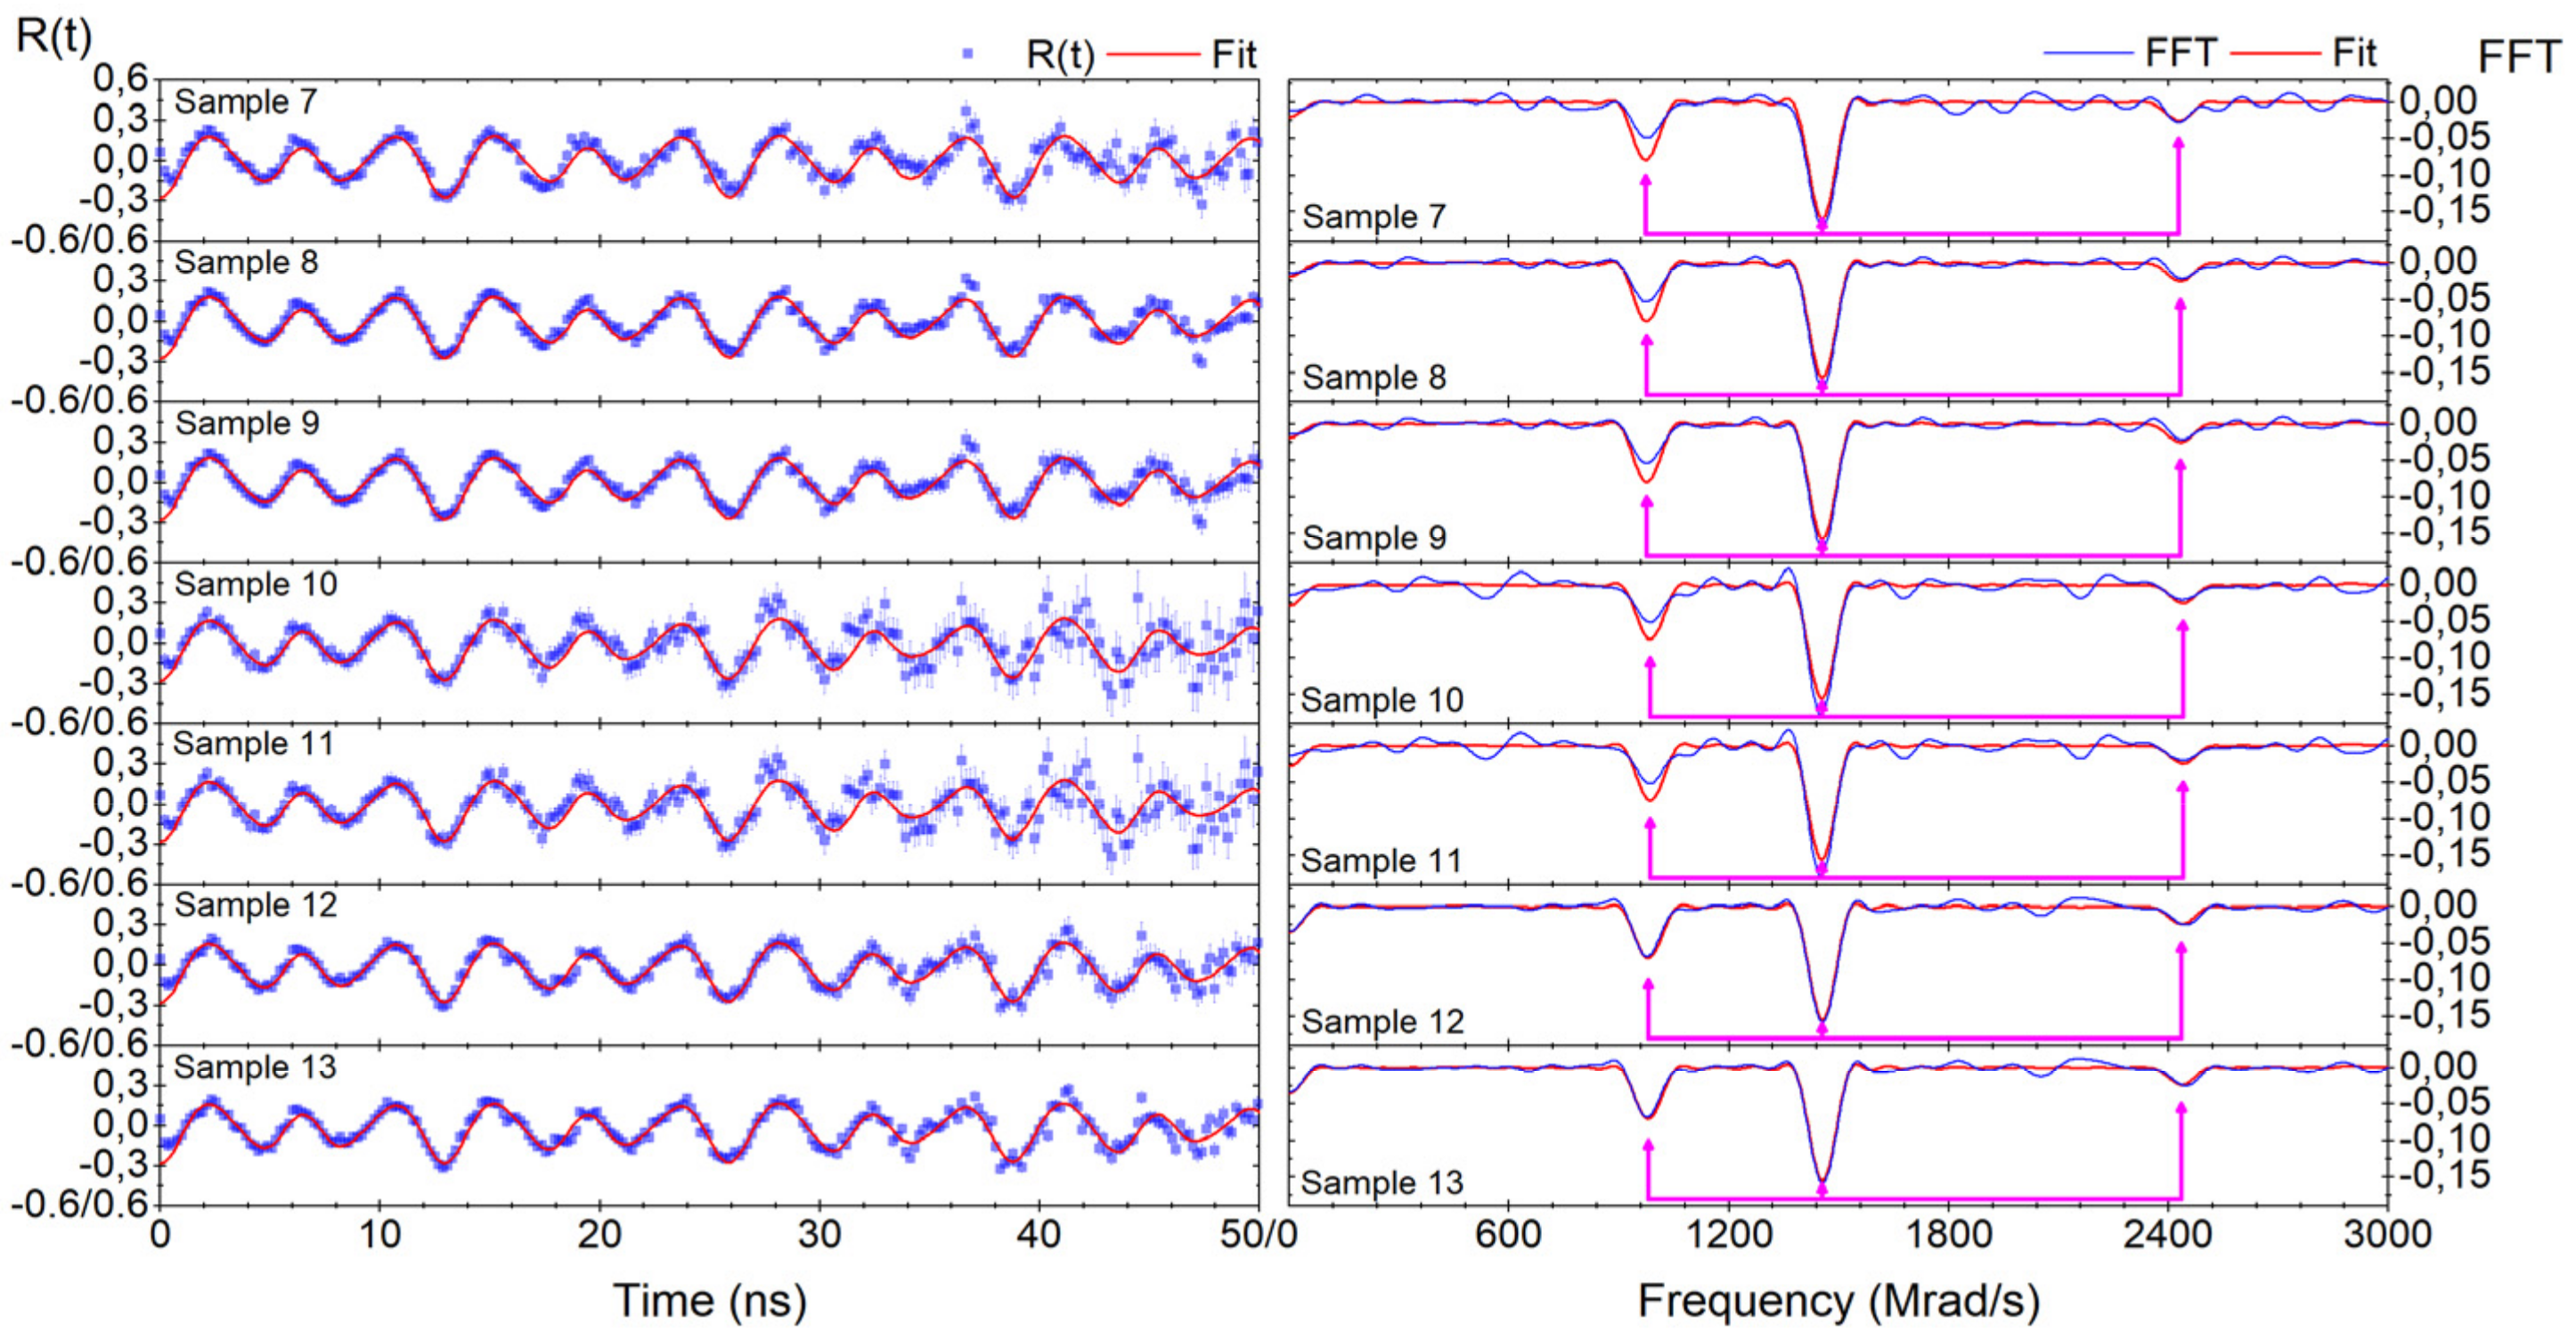
In fitting the R(t) spectrum from our e−γ TDPAC experiment, we realized that the multiplicative constant does not deviate significantly from unity. Thus, we fixed the multiplicative constant to unity. Since the R(t) signals are generated from the same sample in a unique sample holder, they are expected to have the same additive constant if the experimental setup is not altered or disturbed in any form. In the measurement process, we changed the sample holder once, so R(t) signals 1–6 include the fixed additive constant of 0.0187, while R(t) signals 7–13 include the fixed additive constant of 0.0085.
Note also that the angle θ is robust against fitting and does not deviate significantly from zero (with the error included). Thus, for all R(t) signals, we use θ = 0 ° .
Like Figure 5, the left halves of Figure 6 and Figure 7 show R(t) (in blue) for different geometries after the corresponding raw TDPAC signal was processed with Interlude. The right halves of Figure 6 and Figure 7 show the corresponding FFT, which displays the frequencies ω i , i 1 , 2 , 3 that drive R(t) [as seen in Equation (21)], as well as their peak amplitudes [ A 22 s i η ,   i 1 , 2 , 3 ] and their spread (delta Lorentzian δ ). Information on the hyperfine parameters contained in R(t) along with the corresponding FFT transform are then extracted in the fitting process with Gfit19 (see red curves in Figure 6 and Figure 7).
The peaks of the FFT were marked with magenta arrows, with the values of the hyperfine parameters and the relevant experimental information tabulated in Table 2.
We compute the average and the standard deviation of the hyperfine parameters of this set of e−γ TDPAC measurements, which are given in the final row of Table 2. The quoted uncertainty for the averaged hyperfine parameters is the square root of the sum of squares of each measurement’s statistical uncertainty.

4.3. X-ray Diffraction of the 181Ta(TiO2) Sample after the γ−γ and e−γ TDPAC Spectroscopy

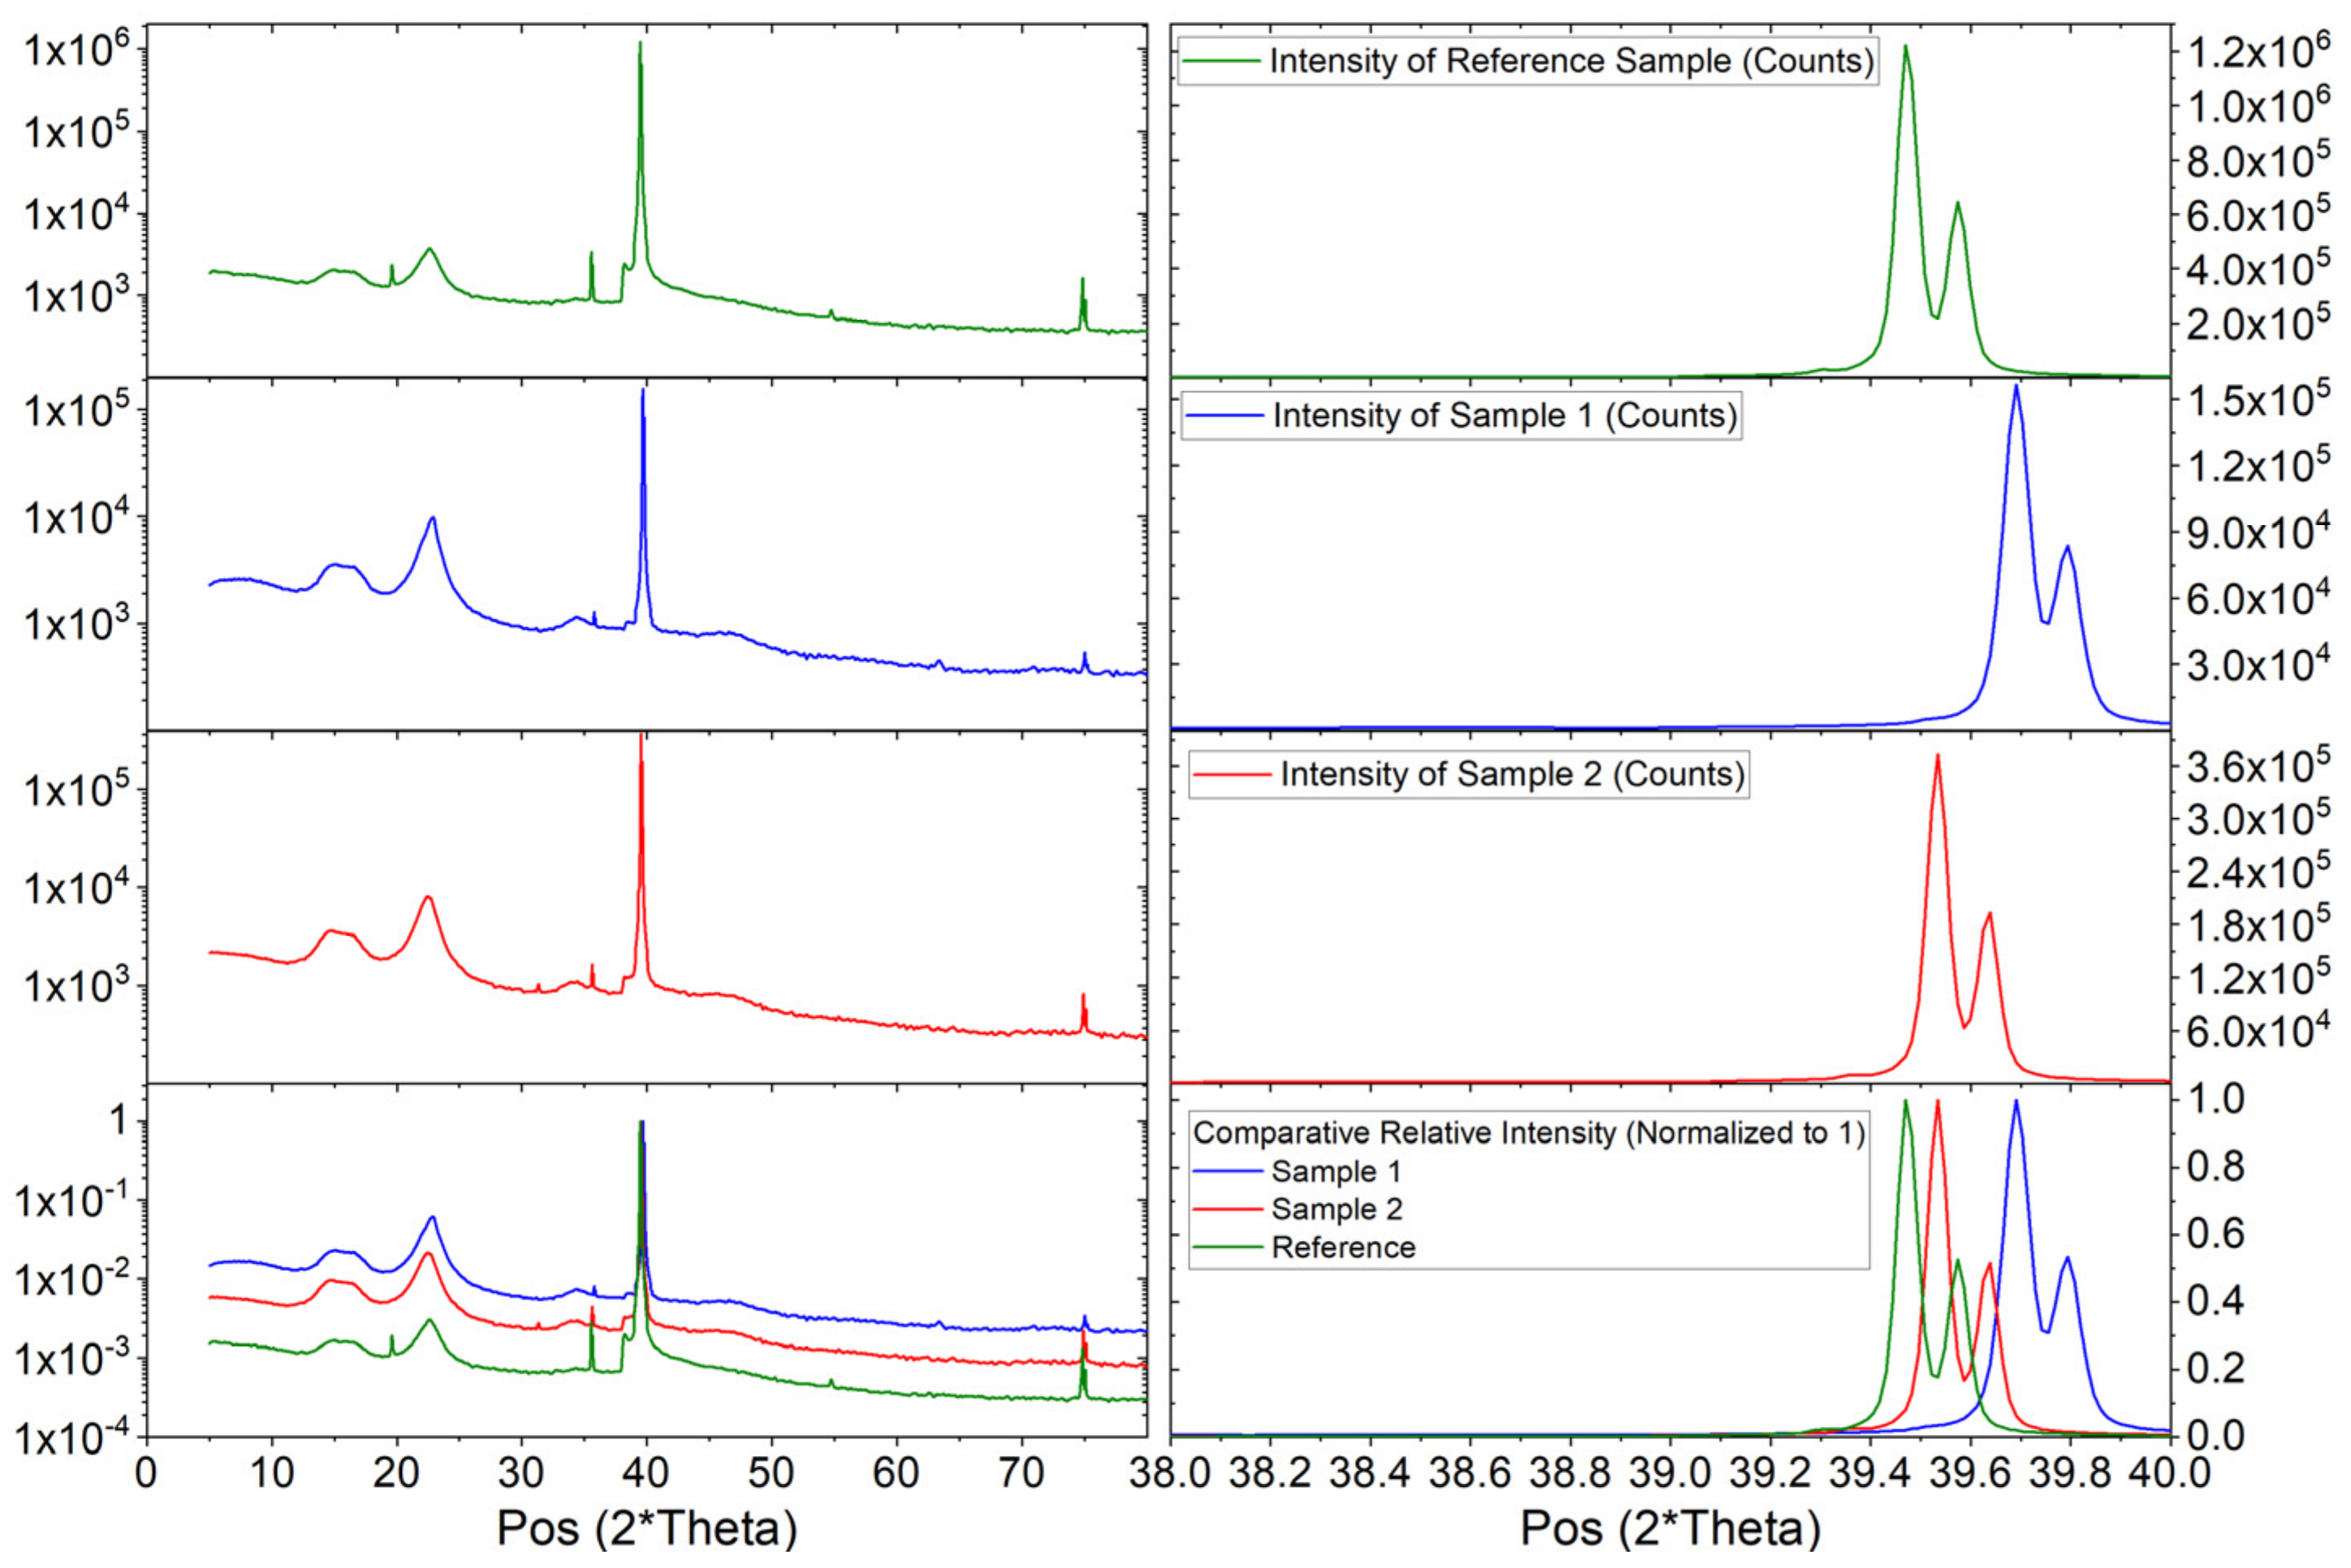
Figure 8 shows the XRD diffractogram of both our (80 keV ion-implanted 181Hf complimented with 5.25 h of thermal annealing) TiO2 samples alongside a corresponding reference sample (fresh sample from Crystals GmbH [55]) for comparison. Note that on the left side of the graphs, we show a log-10 plot of the intensity (“Icalc”) between 0–80°, and on the right-hand side, we show a linear plot of the intensity between 38–40°. We present the graphs in this way as (1) the peaks in the domain of 39–40° dominate all other peaks and (2) to allow for the visualization of the successful resolution of the two most dominant peaks as shown in the right-sided graphs contained in Figure 8.
For ease of comparison, at the bottom of Figure 8, we present 2 corresponding graphs in which all 3 diffractograms are normalized (with respect to the highest recorded intensity for each diffractogram) and plotted in the same window(s).
Table 3 shows the 2 most dominant peaks (right side of Figure 8) produced by the analysis software (that comes complimentary to the Empyrean diffractometer), alongside the corresponding information (d-spacing, full width at half maximum [FWHM], crystalline size, and micro-strain).
We note that up to a systematic shift of 0.22°, all 3 samples exhibit the same double peaks, and within the same sample, the split between the two peaks is in the order of 0.1°. The ratio of the intensity between the left peak and the right peak is 2.07 for the reference sample, 1.99 for our first sample, and 2.08 for our second sample.

5. Discussion

5.1. γ−γ TDPAC Spectroscopy Setup

Table 1 shows that the multiplicative constant for the y-z and x-z plane measurements of the four-detector γ−γ TDPAC spectroscopy is less than half of the multiplicative constant of the x-y plane. This suggests qualitatively that the effective anisotropy constant Akk of the y-z and x-z plane geometry is much less than that of the x-y plane. This may be attributed to the reduced solid angle of the detectors lying on the z axis, which in turn is because the distance between the sample and the z-axis detectors is greater than the distances between the sample and the x- and y-axis detectors.
This result implies that, in the analysis of the full six-detector R(t) spectra, the signal from the x-y plane is more pronounced than that of the x-z or y-z plane. This would invalidate the assumption of random distribution of the size and direction of the individual crystallites as per the definition of a polycrystalline solid. Thus, the high χ 2 of the six-detector is expected from the relative ill-fitting.
From geometric considerations of the three planes in the four-detector measurements, as elaborated in Appendix B, we note that
θ x y + θ x z = θ x y + θ y z = 90 ° , φ x y + φ x z = φ x y + φ y z = 90 ° .
Experimentally, we have
θ x y + θ x z = 93.0 9 ° , θ x y + θ x z = 93.9 9 ° , φ x y + φ x z = 92.9 4 ° , φ x y + φ y z = 93.4 5 ° .
In our derivation based on geometric considerations, we assume that the crystal is an infinitely thin sheet centered in the middle of the detector setup. The small offset of the angles from the expected values may be attributed to (1) the sample not being a perfect single crystal; (2) the crystal not being infinitesimally thin, so the average depth of the implantation may vary statistically; and (3) the 181Ta implantation being done only on one long side of the sample, as discussed in the experimental setup section of the paper.
Regardless, note that the effective anisotropy constant Akk and the angles θ   and   φ only affect the amplitude of the individual cosine components of R(t) but not the delta Lorentzian δ or the individual frequencies ω i , i 1 , 2 , 3 (Equations (20,21)). Consequently, Figure 5 shows that R(t) from the different geometrical setups exhibits roughly the same FFT peaks ω i , i 1 , 2 , 3 . Based on Equations (16–20), this implies that quantitatively, both the measured fundamental frequencies ω 0 and the largest-magnitude EFG V z z must be robust against the R(t) from the different geometrical setups.

5.2. e−γ TDPAC Spectroscopy Setup Compared with γ−γ TDPAC Spectroscopy Setup

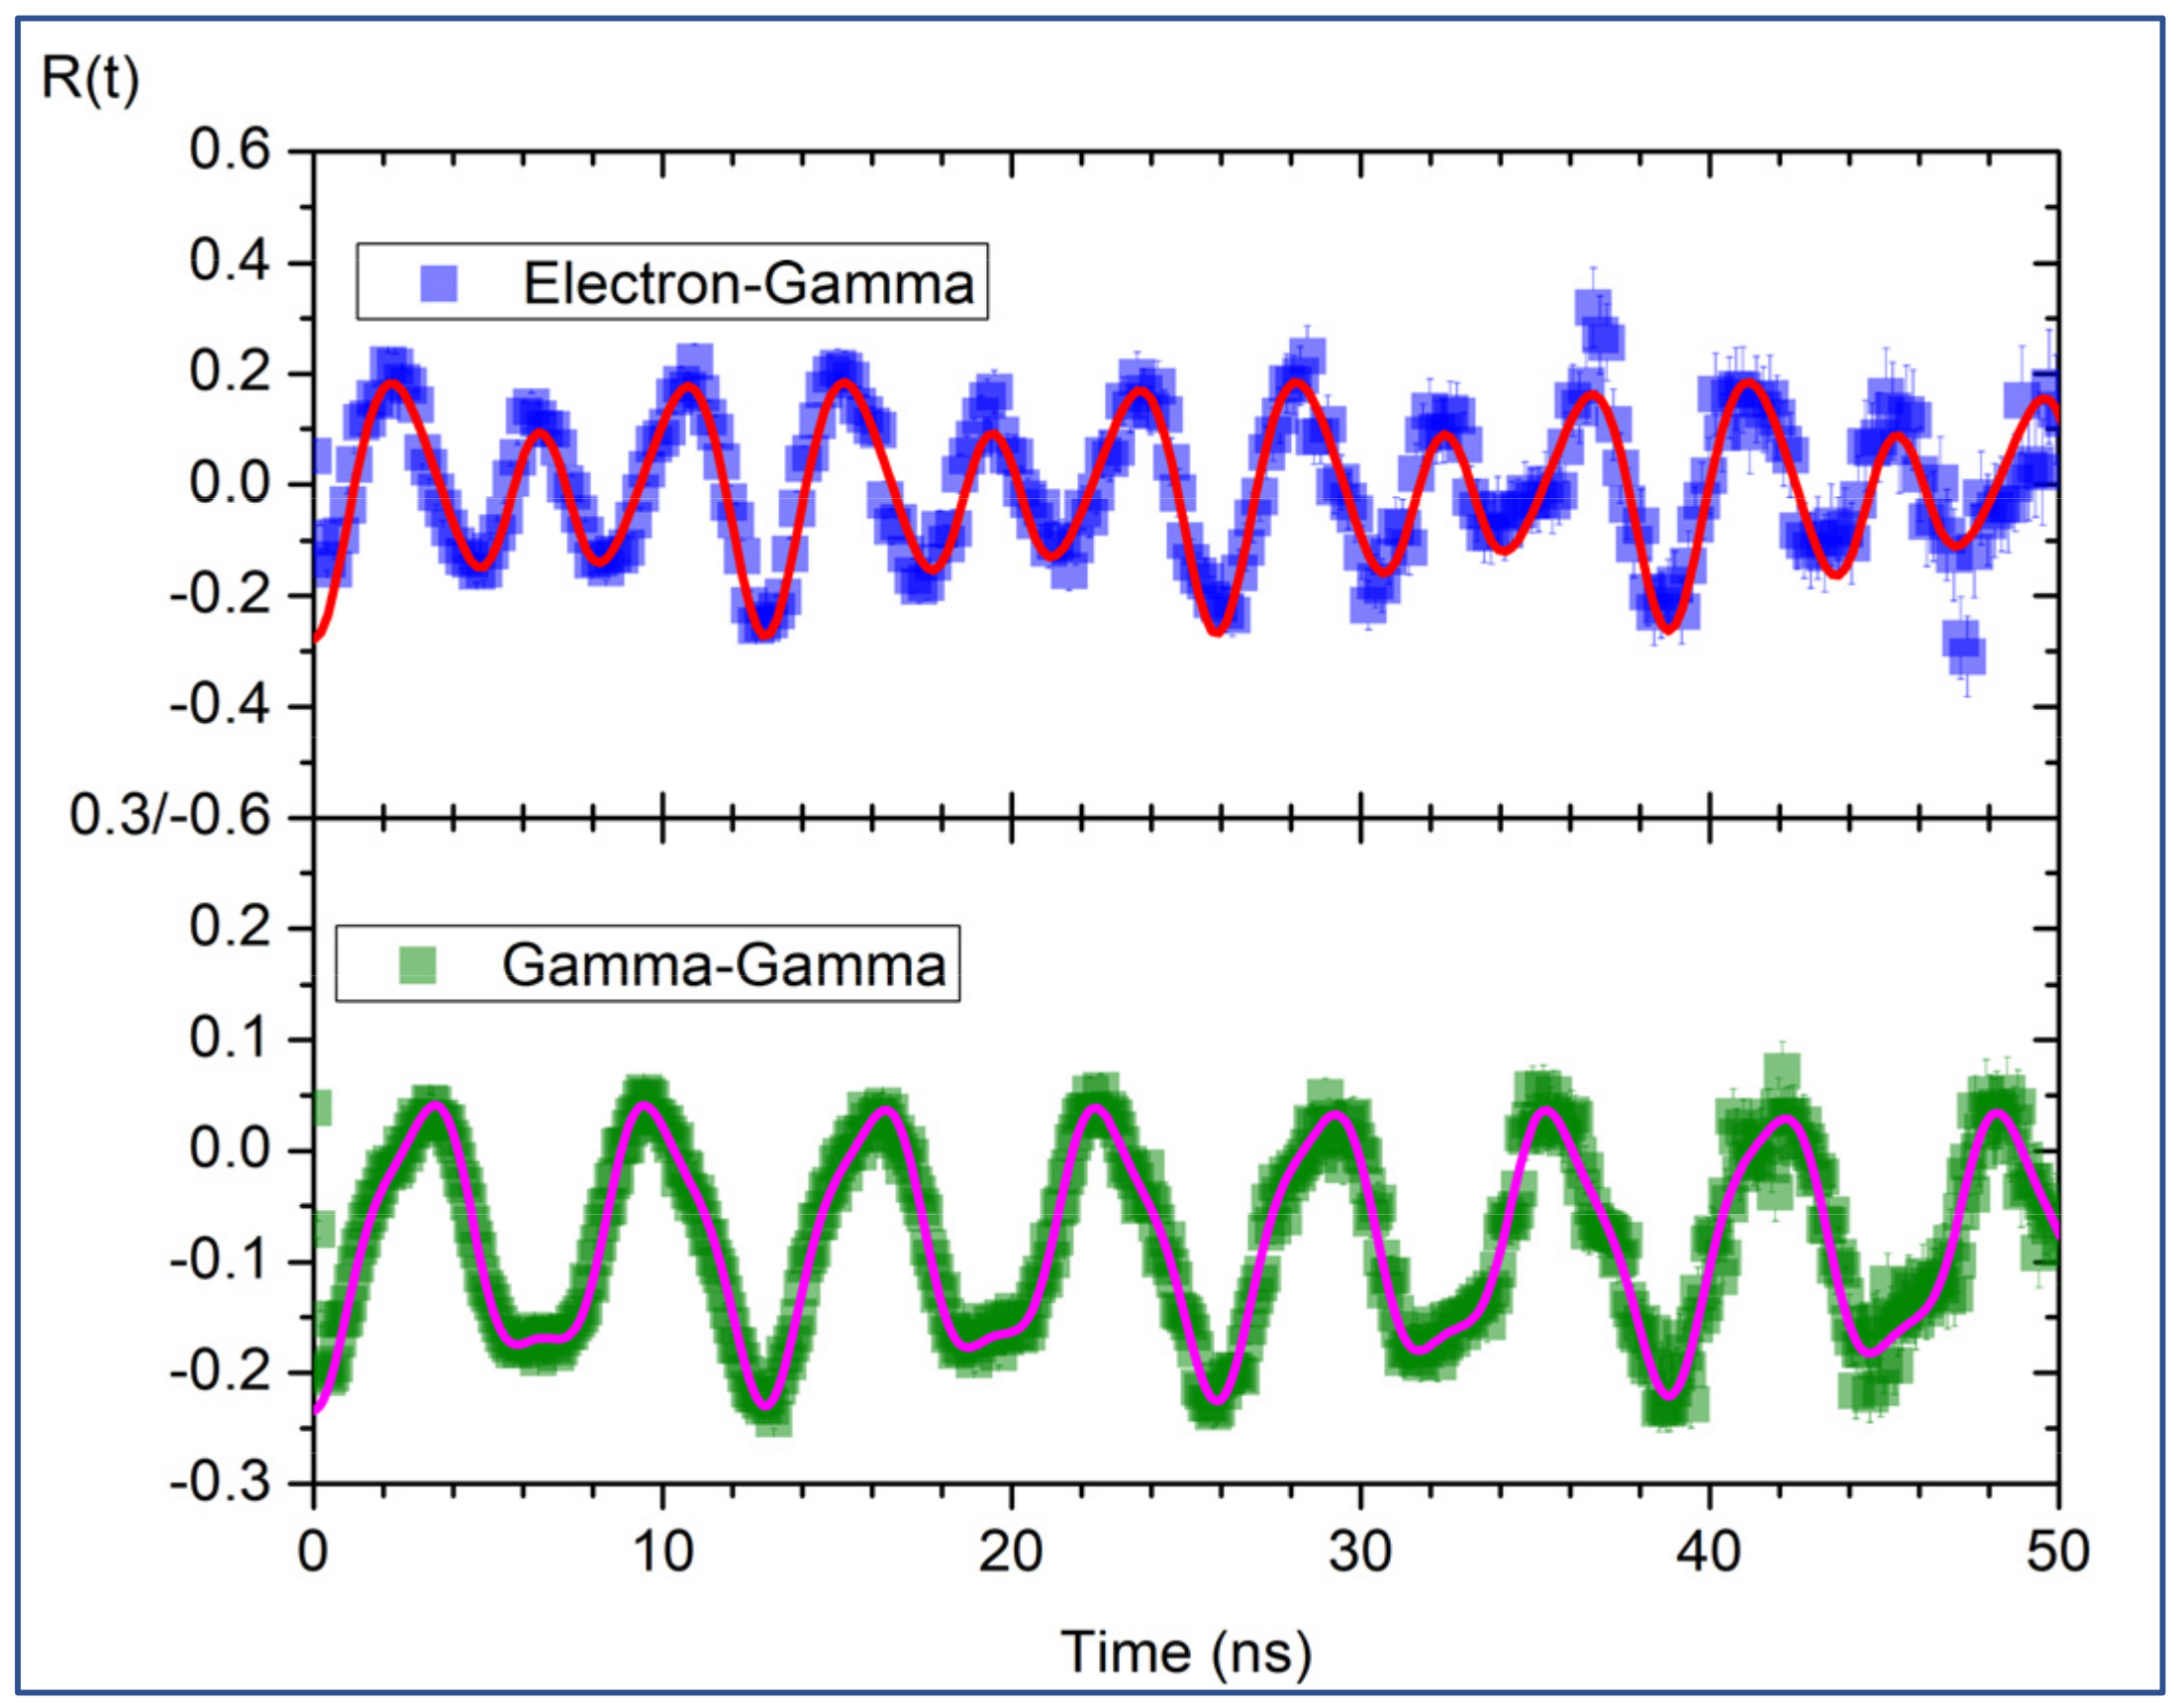
Comparing R(t) acquired by the γ−γ TDPAC spectroscopy setup (see Figure 5) with R(t) acquired by the e−γ TDPAC spectroscopy setup (Figure 6 and Figure 7) shows that the periodicity of the γ−γ R(t) signals are roughly twice that of the e−γ R(t) signals. This effect is qualitatively shown in Figure 9, which compares R(t) between the x-y plane of the γ−γ TDPAC spectroscopy setup with R(t) from sample 8 of the e−γ TDPAC spectroscopy setup.
This discrepancy is attributed to the difference in the time calibration (0.101 ns/channel for the γ−γ TDPAC spectroscopy and 0.195 ns/channel for the e−γ TDPAC spectroscopy). Given that the Gfit19TM fitting process considers the time calibration for each TDPAC spectroscopy setup as a parameter, we note that the average fundamental frequencies and the asymmetry parameters for the γ−γ TDPAC spectroscopy setup (762(1) Mrad/s, 0.543(3), [Table 1]) lie very close to those of the e−γ TDPAC spectroscopy setup (765(2) Mrad/s, 0.54(1), [Table 2]).
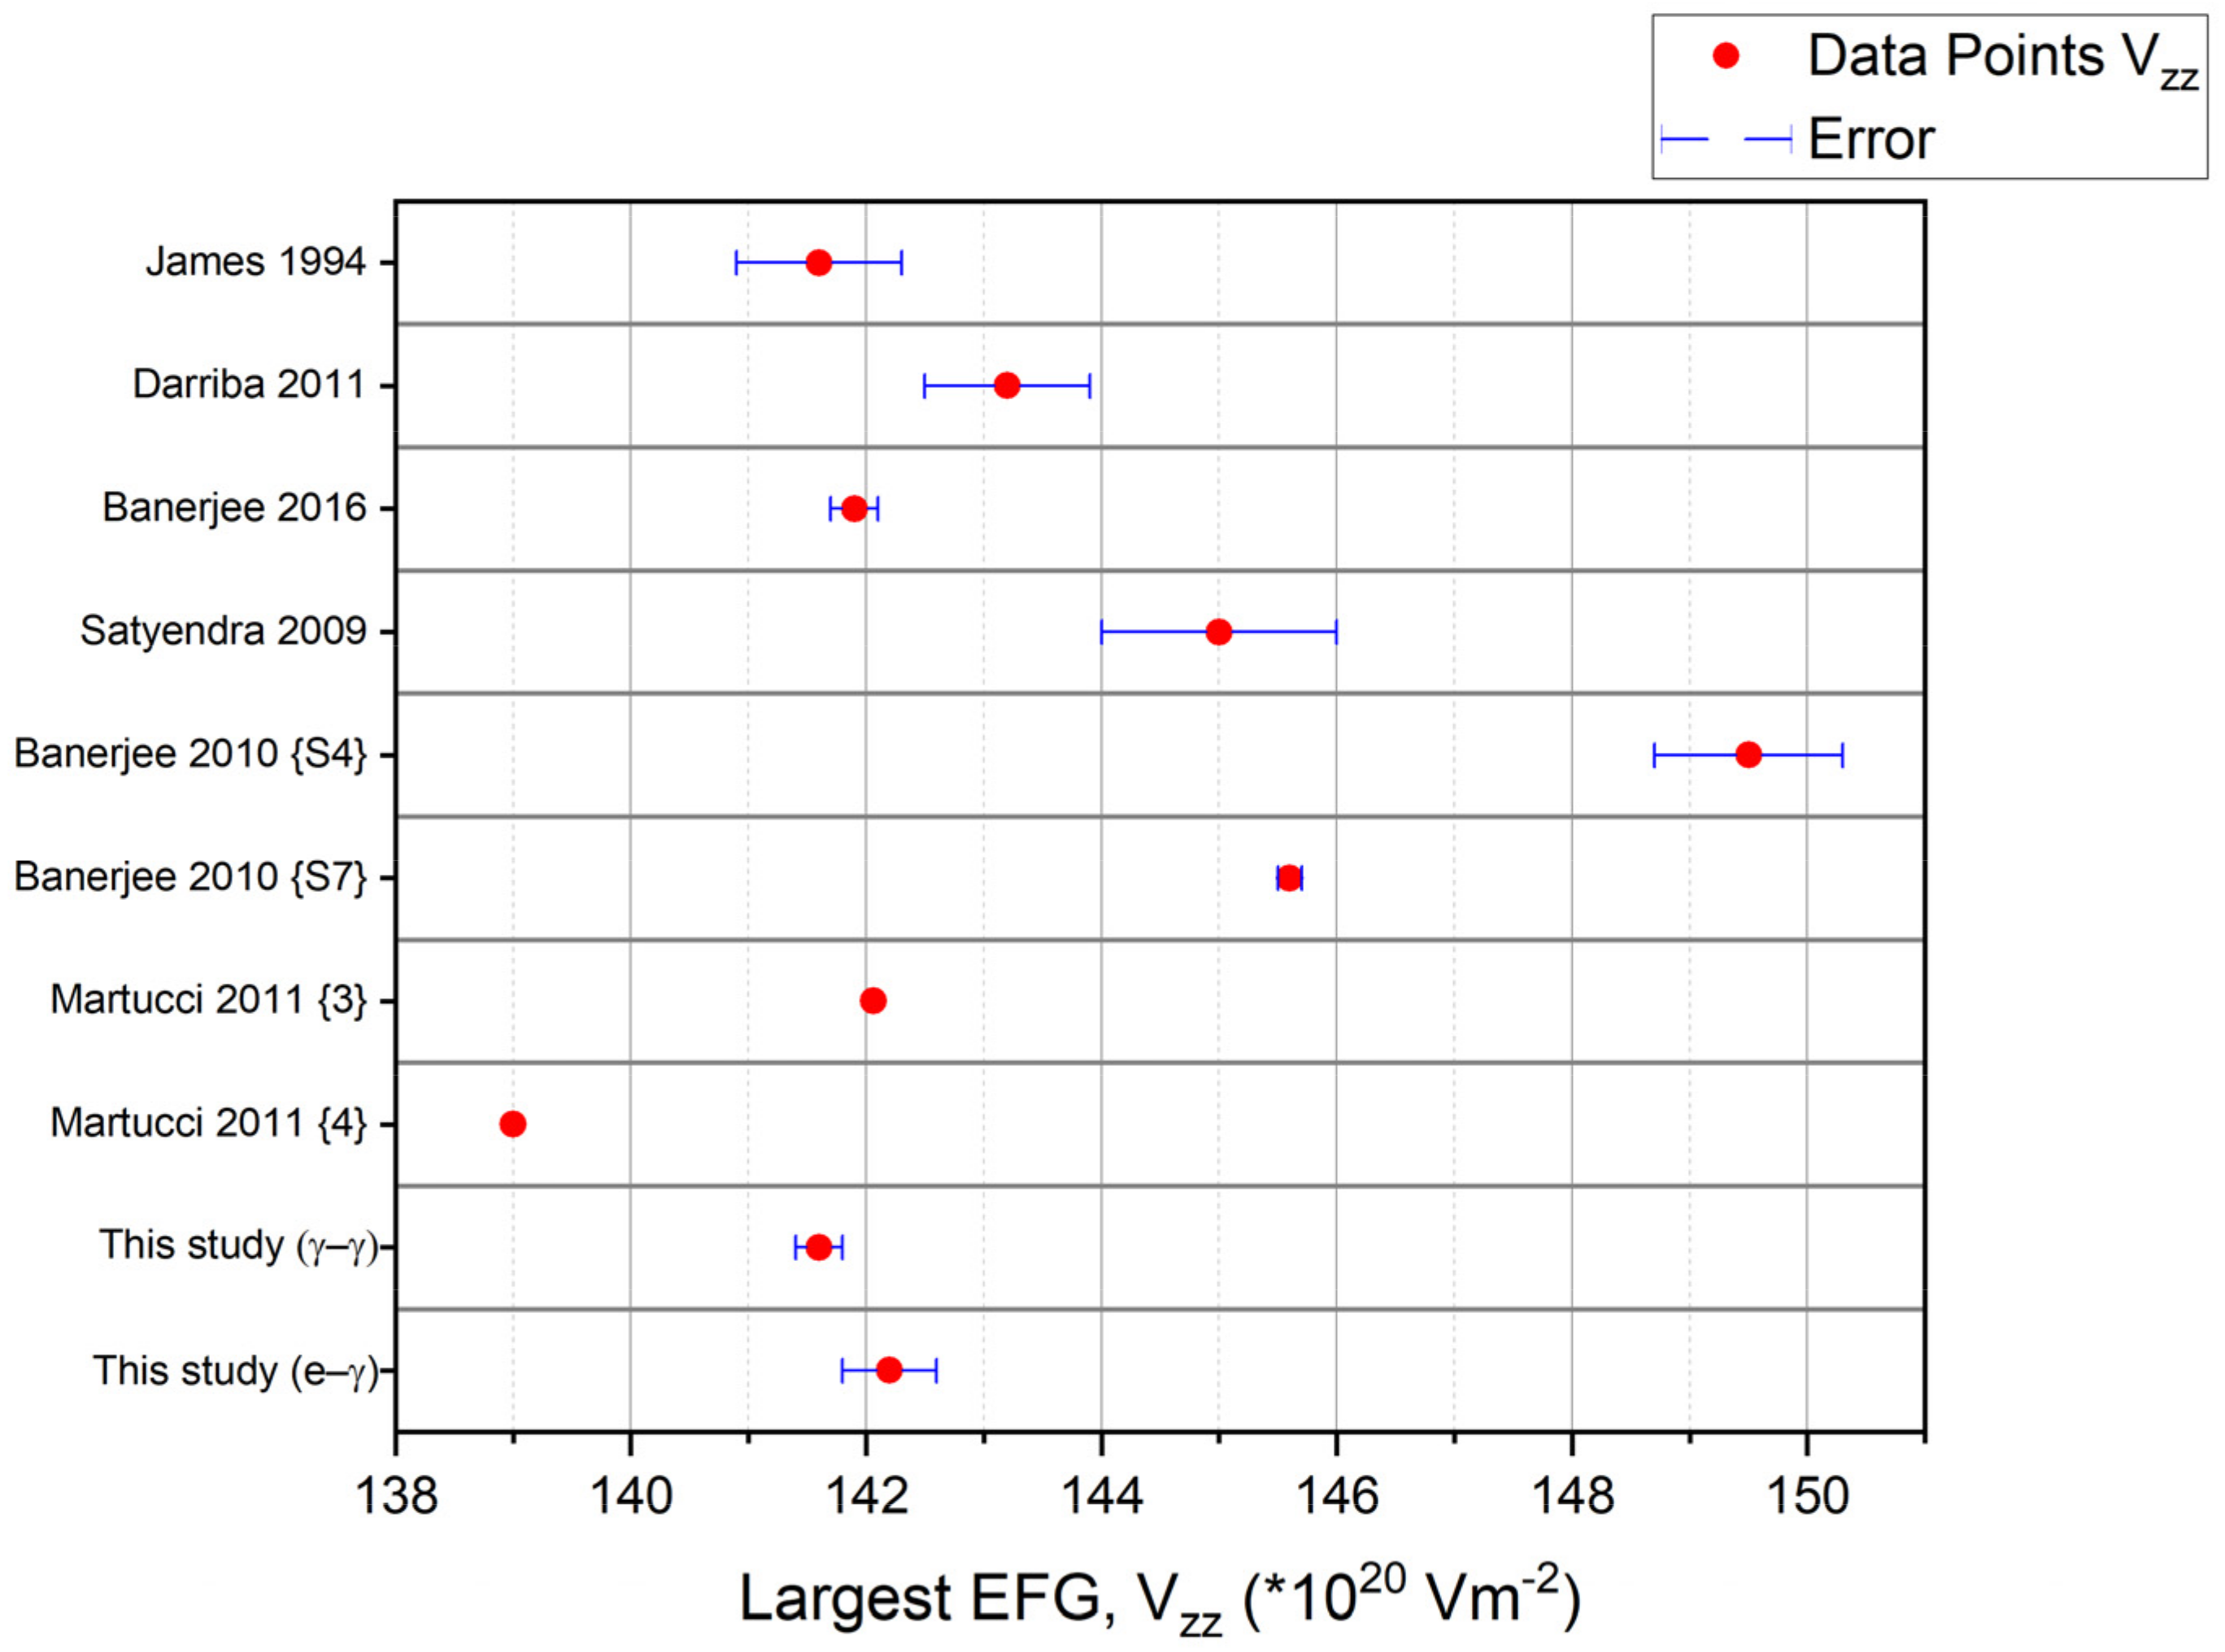
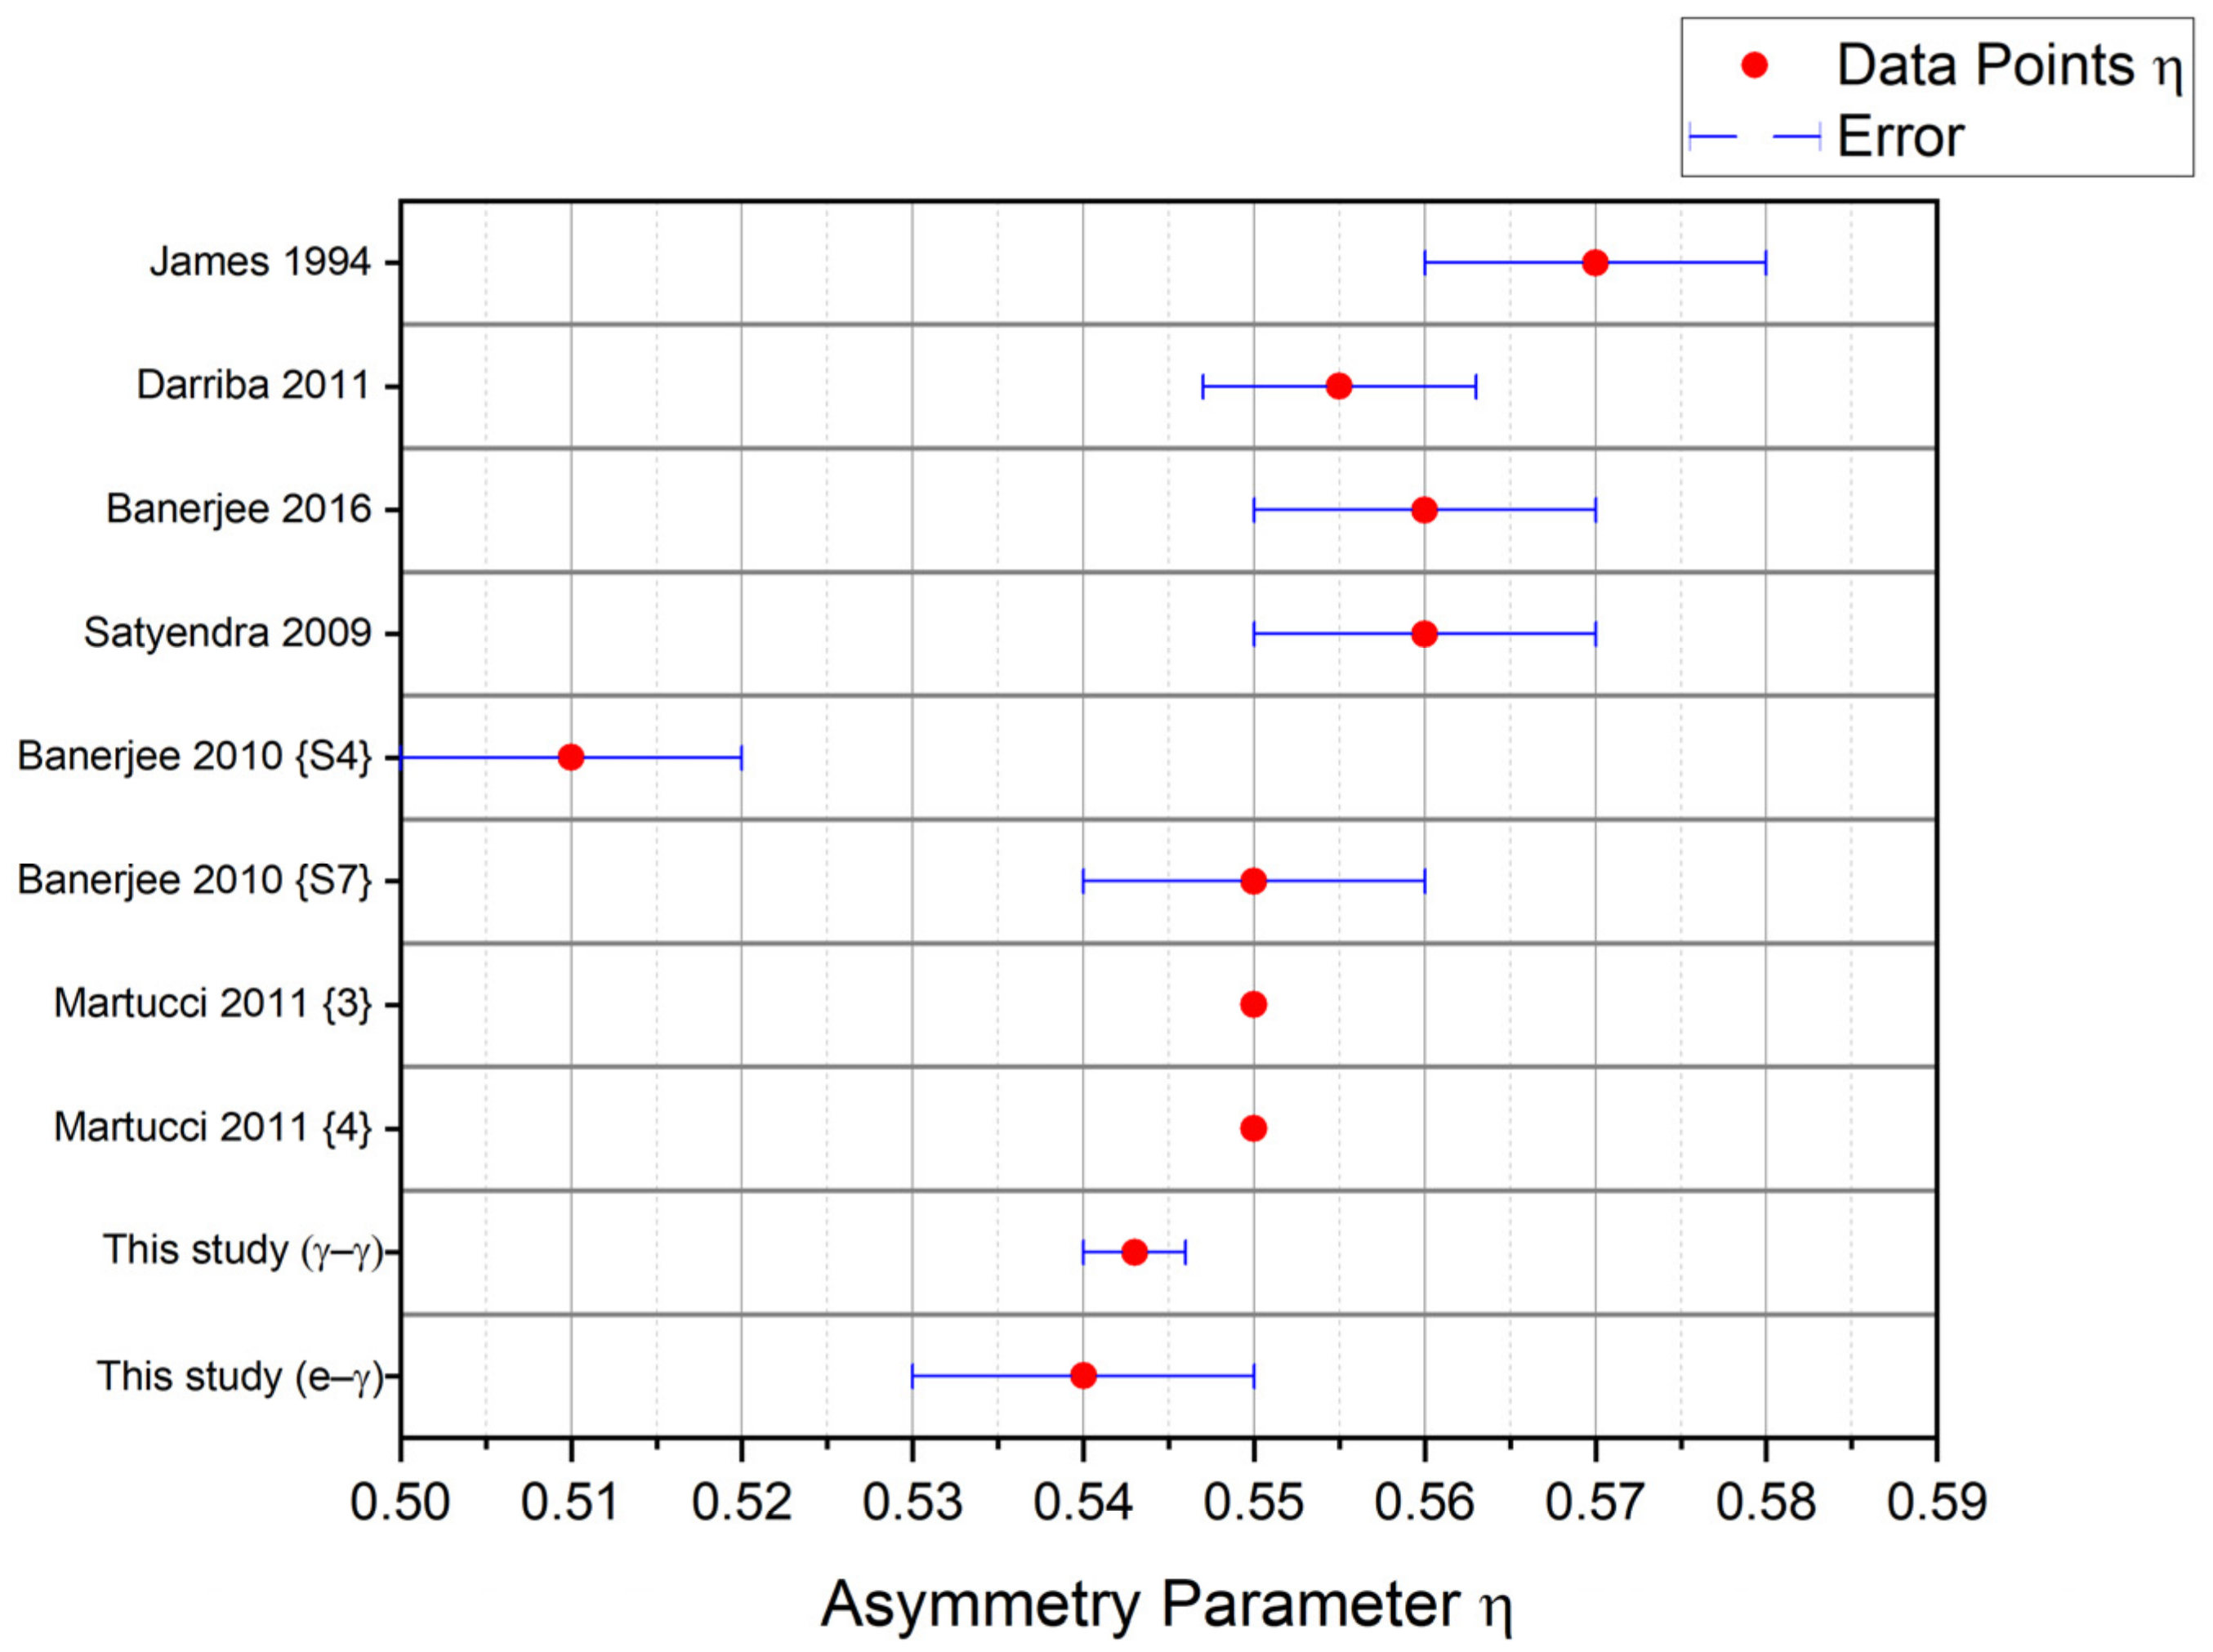
After correcting for the quadrupole moment of 181Ta according to reference [51], V z z (and ω 0 in extension) obtained from both our γ−γ and e−γ 181Ta(TiO2) TDPAC spectroscopies are consistent with published values up to an order of magnitude, and our asymmetry parameter η is consistent with the quoted values up to 0.05. This is shown in Table 4 in numerical details of the relevant hyperfine parameters and Figure 10 and Figure 11 for the corresponding graphical outputs for the values of V z z and η , respectively.
These results show that the hyperfine parameters determined from the 181Ta(TiO2) γ−γ and e−γ TDPAC experiments are consistent with the literature values for the corresponding 181Ta(TiO2) γ−γ TDPAC results.
Following the understanding of the electron-recombination process (see Figure 2 and Section 2), we conclude that the timescale of the electron-recombination process is at least one order of magnitude faster than nanoseconds, which is the timescale of the second-stage decay (10.8 ns) of the 181Hf→181Ta probe nucleus. This also implies that we cannot detect the recombination process with our present setup for 181Ta(TiO2) e−γ TDPAC spectroscopy.
This is consistent with the implications of the findings with regards to the Femtosecond Time Resolved Spectroscopy conducted by a group from the KAUST Solar Centre, in which an induced hole (as an electron trap) in the bulk rutile TiO2 will capture an electron in the order of picoseconds [22].

5.3. X-ray Diffraction of the 181Ta(TiO2) Sample after the γ−γ and e−γ TDPAC Spectroscopy

From the results in Table 3, we can see that up to a systematic shift of 0.22°, the corresponding peaks of our (80 keV 181Hf ion-implanted and complimented with sufficient thermal annealing) TiO2, as well as the reference sample, agree with each other. The cause of such a systematic shift could be due to the individual micro-stress of each sample. We also note that the X-rays produced from the Empyrean diffractometer are not monochromatic, which explains the double peaks observed on the right side of Figure 8. We especially note that the micro-strain of our samples, along with the reference, is about 0.0038%, which is very low. The micro-strain is a measure of the amorphization of a solid sample, and thus, both our TiO2 samples, as well as the reference, could be said to exhibit single crystal-like properties.
The presence of the other small peaks, as seen on the left side of Figure 8, could be attributed to the existence of the oxygen vacancies (see Section 1.2). We make no further attempts to characterize these peaks at the time of dissemination, as our main result is on the TDPAC study of (181Ta)TiO2. Our 181Ta probe (which sits on a well-defined Ti-substitutional site) does not explicitly detect such oxygen deficiencies.
The dominant peaks in our result correspond to the (200) Miller index direction of the rutile TiO2 (regarding the polycrystalline rutile TiO2 sample taken from the RRUFF™ Project website [72,73]).
In addition to our reference sample, we refer to a paper by Guo et al. [70], in which they have fabricated their own single crystal rutile TiO2, and their corresponding X-ray diffractograms have revealed a similar (single peak-like) behavior. The position of their peaks and sample preparation are elaborated in Table 5 below.
From the information obtained in the XRD diffraction of our TiO2 sample, we can conclude that the treatment of our parts per billion 181Hf ion-implanted TiO2 sample, complimented with 5 hr 15 min of thermal annealing at 873K, does not significantly alter its global structure, as the low value of the micro-strain shows in all 3 of our XRD diffractograms.

6. Conclusions and Future Works

We use 181Ta(TiO2) e−γ TDPAC spectroscopy in combination with 181Ta(TiO2) γ−γ TDPAC spectroscopy to obtain a wealth of information on TiO2, which is a prominent industrial compound. Although both spectroscopies appear the same at first glance, subtle differences appear in the first stage of the two-stage decay that highlights how e−γ TDPAC spectroscopy is complementary to γ−γ TDPAC spectroscopy. In particular, for γ−γ TDPAC spectroscopy, the starting 181Ta nucleus does not interact with its electron cloud, leading to a direct de-excitation. This contrasts with e−γ TDPAC spectroscopy, where the 181Ta nucleus interacts with some of its electron shells, leading to the ejection of the conversion electron. This subtle difference permits the dynamic observation of the recombination process, a multistep process where the electrons provided by the host material fill the hole left by the expelled conversion electron.
The hyperfine parameters obtained from 181Ta(TiO2) e−γ TDPAC spectroscopy are consistent with those obtained from γ−γ TDPAC spectroscopy, which suggests that the electron-recombination process is at least an order of magnitude less than 10 nanoseconds and thus could not be detected with our current setup. This compliments the recent results and implications of a group from the KAUST Solar Centre [22], in which an induced hole in bulk rutile will capture an electron in the order of picoseconds.
Upon reviewing the literature on 181Ta(TiO2) γ−γ TDPAC spectroscopy, we realized the dearth of information pertaining to the hyperfine parameters in the low-temperature regime (0–500 K). References [7,8] assume that V z z is linear in temperature, which we wish to test with our e−γ TDPAC spectroscopy setup.

Author Contributions

Supervision, J.S. and H.C.H.; Conceptualization, J.S.; 181Hf production and Implantation, U.K.; Implantation, C.N. and R.B.; XRD Diffraction and analysis, R.M.; Data Curation, J.S.; Formal Analysis and Investigation, I.C.J.Y.; Validation and discussion, T.T.D. and J.S.; writing—original draft preparation, I.C.J.Y.; writing—review and editing, J.S., U.K. and I.C.J.Y.; visualization, I.C.J.Y. All authors have read and agreed to the published version of the manuscript.

Funding

This research was funded by the German Federal Ministry of Education and Research (BMBF) through grant No. 05K16PGA and the Foundation for Science and Technology FCT, Portugal, via Grant No. CERN-FIS-PAR-0005-2017.

Institutional Review Board Statement

Not applicable.

Informed Consent Statement

Not applicable.

Data Availability Statement

Data and the programs used to preprocess and analyse the data is available in Zenodo, the public repository, via the DOI identifier https://doi.org/10.5281/zenodo.6789196. The data is also available upon reasonable request to I.C.J.Y. via [email protected]. Note that additional instructioins is still required and one should, in addition, consult J. G. M. Correia via [email protected] for further assistance.

Acknowledgments

We acknowledge the financial support received from our external funders, and J.G.M. Correia for technical assistance during the electron gamma experiments and pre-analysis of the data. We highly appreciate the criticism and comments posted by both anonymous reviewers, and they have a contribution towards the final version of the this published paper. I.C.J. Yap personally thanks J.G.M. Correia for his expert assistance with Gfit19 and Interlude and his indirect mentorship that complements that of J.S. Schell and H.C. Hofsäss.

Conflicts of Interest

The authors declare no conflict of interest.

Appendix A. A Discussion on Ion Implantation Damage to Our TiO2 Sample

Appendix A.1. Literature Review of Ion Implantation Damage to the Host Semiconductor

While this paper mainly centers on the comparison between the γ−γ and e−γ 181Ta(TiO2) TDPAC signal acquired from the well-defined substitutional site of 181Ta probes in the TiO2 matrix, some questions may arise pertaining to the effect of the ion implantation of the 80 keV 181Hf isotope on the lattice structure of the single crystal TiO2. In particular, readers might want to understand the extent of thermal annealing after the ion implantation, which is said to restore the lattice structure of TiO2 (now implanted with 181Hf→181Ta probe at parts per billion number density).
In the review paper “Ion implantation in Semiconductors, Part 1” by Gibbons [74], the contribution to the stopping range of the implanted ions comes from both the individual stopping power of the nuclei and the electron cloud of the atoms in the single crystal semiconductor such as silicon and in our case, TiO2. Models such as the LSS theory and the Lindhard model were elaborated on in detail, and comparisons between experiments and theory (particularly the range distribution of implanted ions in single crystal silicon) were also discussed. It was found that the Lindhard model qualitatively agrees with the stopping range of 32P implanted ions in single crystal silicon in the range of 400 to 1200 Å, with the direction of the incident ion beam parallel to the major crystal axis of single crystal silicon.
As discussed in Section 3 of this paper, we used SRIM 2013, which uses the Monte Carlo method [75] (effectively the assumption of binary collision approximation) with the random sampling (layer and type of atom/ion, respecting the stoichiometric ratio of the atoms/ions in the target material) of the impact parameters of the next atom/ion in the target material (layer and type, with the probability distribution respecting the stoichiometric ratio of the atoms/ions in the target material).
Four years later, in the subsequent review paper “Ion implantation in Semiconductors, Part 2” by Gibbons [76], efforts to understand the type of damage to the lattice structure of the semiconductor, and its rejuvenation by sufficient thermal annealing, were discussed. Using silicon as his choice semiconductor, he mentioned that if the energy (after a series of prior collisions) of the incoming implanted ion is higher than the displacement threshold energy (defined as the energy needed to break the bonds of a said native ion from its nearest neighbors in the lattice of the host material) of that said native ion, the native atom will be displaced from the lattice site. Furthermore, the mentioned displaced native ions could be considered a second projectile, which will cause more collisions with other native ions of the host material. This causes the formation of what are commonly termed “damage clusters”.
A library of the type of damage to the lattice structure of the host material is discussed, mainly (1) The Frankel defect (removing a native ion from its lattice site and placing it in a nearby interstitial position). (2) The location of the implanted ion in the host material, be it substitutional or interstitial. (3) Dislocation lines and loops, which are caused by the clustering of the point (Frankel) defects onto a lattice plane, were also discussed in detail. (4) Vacancy and interstitial platelets (caused by the agglomeration of the vacant lattice site and the interstitial ions, respectively) were also mentioned. It serves as a site for the adsorption of “wrongly-sized” implanted ions in the host material.
Furthermore, Gibbons separated cases of damage caused by heavy, intermediate, and light ions. Since 181Hf is a very heavy ion (its atomic weight is more than 3 times the corresponding native Ti ion in our single crystal TiO2), we would focus on the case of heavy ions.
Gibbons mentioned that heavy ions implanted into a non-channeling direction in single crystal silicon will produce heavily disordered damage clusters that contain both simple Frankel defects and sparse areas with their properties being more like a polycrystalline solid. Furthermore, if the dose of the implanted ion is large enough, then the single crystal silicon can be made polycrystalline.
Gibbons has also provided many experiments targeted at the understanding of the annealing process of the damaged silicon caused by the ion implantation process, over varying implantation energies, and the type of implanted ion. Of particular interest to this study is that if the silicon is made polycrystalline from the surface to a certain depth caused by the path of the implanted ion, then thermal annealing of 30 min with a temperature of 923 K in the air will make the silicon roughly single crystal again, though with micro twins and stacking faults. However, dislocation loops and lines will still exist unless the silicon is subjected to further annealing for several hours at a temperature of 1273 K in a vacuum. Vacancy platelets will degrade into dislocation loops under thermal annealing of 30 min at a temperature of 873 K.

Appendix A.2. Discussion Pertaining to the Degree of Annealing, with Relevant TDPAC Results Attached

From the literature, since our dose of implanted ions is low (part per billion number density) and our implanted ion is heavy, we would expect to see some damage clusters that behave like a polycrystalline solid, with a moderate amount of Frankel defects. It remains to see the statistical distribution of the sites (interstitial/substitutional) of our implanted 181Hf probes, along with the degree of damage to the local environment (caused by the implantation) around the different substitutional 181Hf probes.
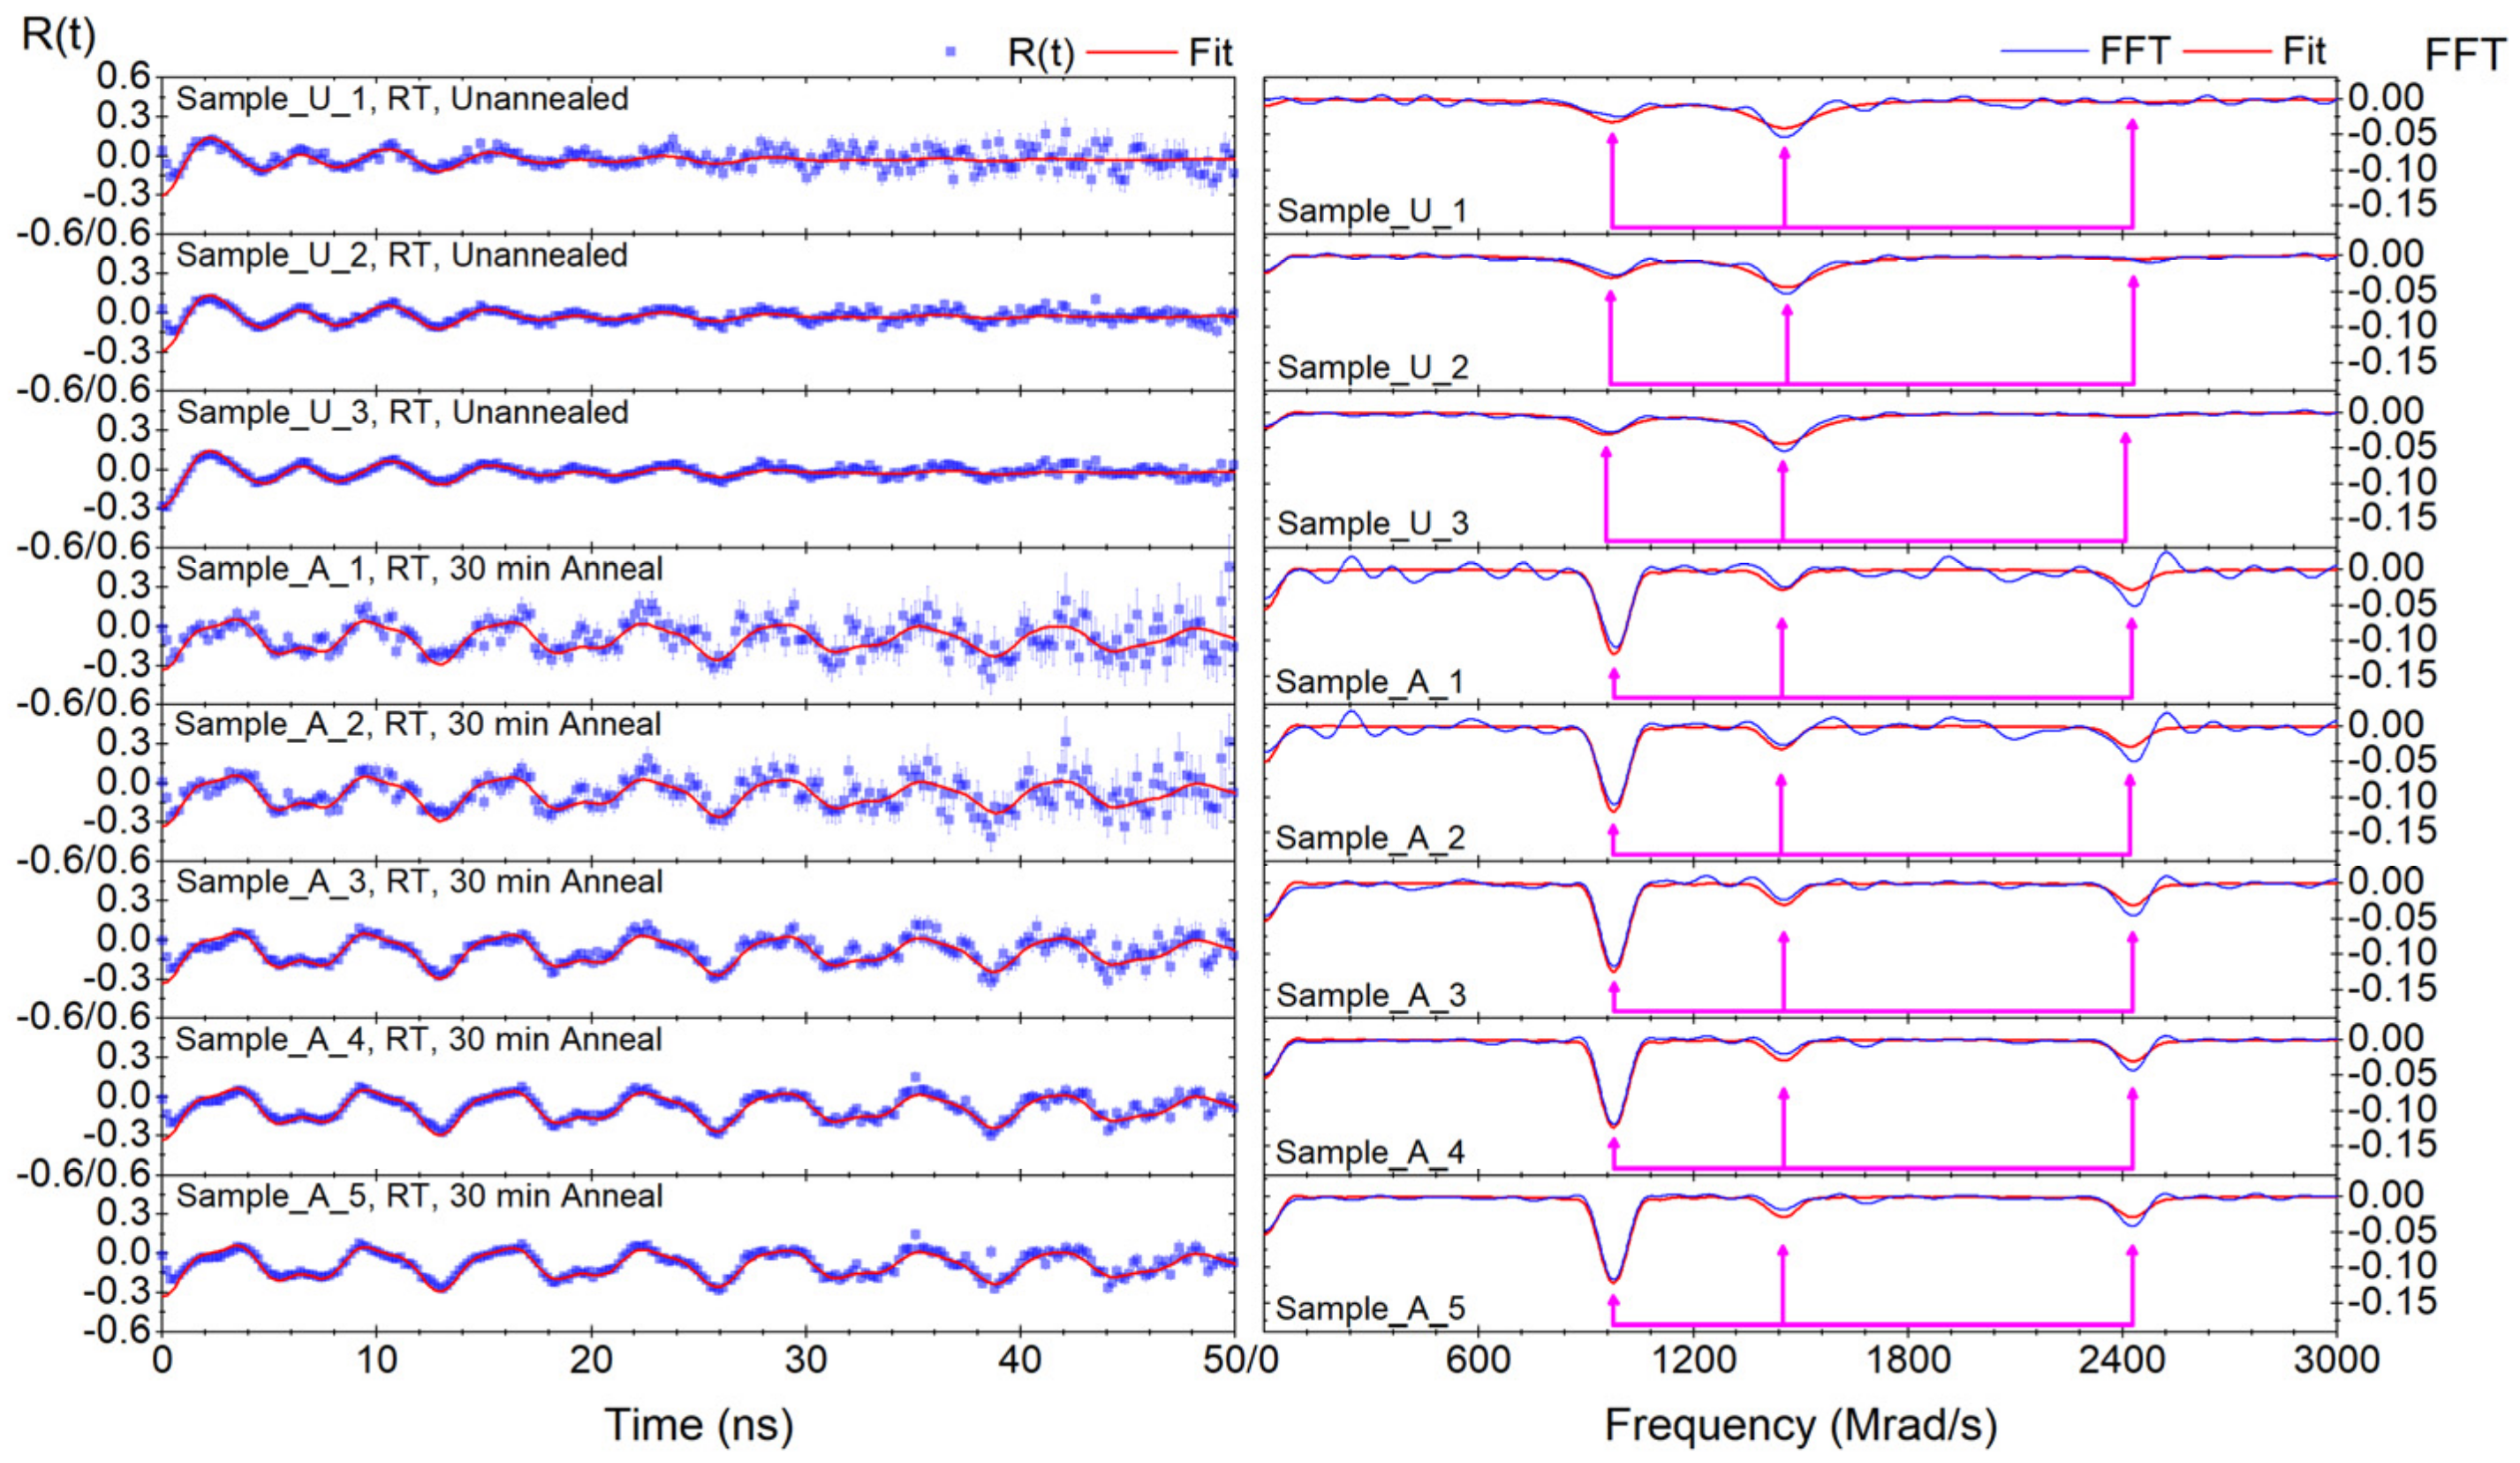
Unfortunately, we could not obtain the XRD results of our single crystal TiO2 right after implantation. However, throughout this study, we have acquired e−γ TDPAC signals corresponding to the unannealed case (termed “U_”) and the case where our 181Hf-implanted single crystal TiO2 was subjected to 30-min annealing at a temperature of 873 K in vacuum (termed “A_”). The values of the hyperfine parameters and the relevant experimental information are collected in Table A1 and Table A2 below, with the corresponding R(t) and FFT graphs visualized in Figure A1. As a reminder, our main result was the case where our 181Hf-implanted single crystal TiO2 was treated to 5.25-h annealing at a temperature of 873K in a vacuum.
We note that we performed the R(t) fit (Equation (21)) of our processed TDPAC signal corresponding to the single site Ti-substitutional occupation of the 181Ta probes and have made no attempt to identify the fraction of the 181Ta probes located on those highly preferred sites. This does not preclude the possibility of a certain fraction of 181Ta probes located at other (interstitial) sites.
Table A1. Table of fitted hyperfine and experimental parameters for this set of 3 different e−γ TDPAC measurements of 181Ta(TiO2), returned by the Gfit19TM program. It is noted that this set contains e−γ TDPAC signals corresponding to the unannealed case (Termed “U_”). For the individual values of V z z , the fit uncertainty is separated into (a) the statistical uncertainty caused by our instruments, and (b) the (dominant) systematic uncertainty of the quadrupole moment (±2.1%) as quoted in reference [51]. The multiplicative constant of this set of e−γ TDPAC measurements is fixed at 1. The averaged values of ω 0 , η , and V z z from this set of e−γ TDPAC measurements were calculated, with (in the case of V z z , (c)) the uncertainty assigned the square root of the sum of squares of their statistical uncertainty (in the case of V z z , (a)).
R(t) SignalFundamental Frequency ω 0 (Mrad/s)Asymmetry Parameter η V z z
(1020 V/m2)
Delta Lorentzian δ (%)Chi Squared χ 2 Theta θ (deg)Phi ϕ (deg)Additive Constant
U_1763 (4)0.53 (1)142.0 ± 0.7 a
± 3.0 b
6.6 (7)0.980 (6)37.8 (4)−0.018 (2)
U_2766.31 (7)0.525 (7)142.48 ± 0.01 a
± 3.02 b
6.0 (2)1.200.0 (4)37.9 (2)−0.005 (1)
U_3759.7 (1)0.519 (4)141.255 ± 0.002 a ± 2.993 b6.0 (2)1.400 (2)37.9 (2)−0.000 (1)
Average763 (4)0.53 (1)141.9 ± 0.7 c6.2 (8)N.A.N.A.N.A.N.A.
Table A2. Table of fitted hyperfine and experimental parameters for this set of 5 different e−γ TDPAC measurements of 181Ta(TiO2), returned by the Gfit19TM program. It is noted that this set contains e−γ TDPAC signals corresponding to the case where our 181Hf-implanted single crystal TiO2 was subjected to 30-min annealing at a temperature of 873 K in a vacuum (Termed “A_”). For the individual values of V z z , the fit uncertainty is separated into (a) the statistical uncertainty caused by our instruments, and (b) the (dominant) systematic uncertainty of the quadrupole moment (±2.1%) as quoted in reference [51]. The multiplicative constant and additive constant of this set of e−γ TDPAC measurements is fixed at 1 and −0.0398, respectively. The averaged values of ω 0 , η , and V z z from this set of e−γ TDPAC measurements were calculated, with (in the case of V z z , (c)) the uncertainty assigned the square root of the sum of squares of their statistical uncertainty (in the case of V z z , (a)).
R(t) SignalFundamental Frequency ω 0 (Mrad/s)Asymmetry Parameter η V z z
(1020 V/m2)
Delta Lorentzian δ (%)Chi Squared χ 2 Theta θ (Deg)Phi ϕ (Deg)Additive Constant (Fixed)
A_1762 (2)0.548 (4)141.6 ± 0.4 a
± 3.0 b
1.1 (3)0.8345 (3)58.8 (7)−0.0398
A_2760 (2)0.548 (4)142.3 ± 0.3 a
± 3.0 b
1.0 (2)0.8343 (3)57.9 (6)−0.0398
A_3763.0 (8)0.543 (2)141.9 ± 0.2 a
± 3.0 b
0.9 (1)0.9445 (1)58.5 (3)−0.0398
A_4762.9 (5)0.543 (1)141.85 ± 0.09 a
± 3.01 b
0.95 (7)1.3045.7 (8)58.5 (2)−0.0398
A_5762.4 (5)0.543 (1)141.75 ± 0.09 a
± 3.00 b
1.04 (7)1.3745.9 (8)58.4 (2)−0.0398
Average762 (3)0.545 (6)141.07 ± 0.5 c1.0 (4)N.A.N.A.N.A.N.A.
Figure A1. (left) R(t) graph and (right) corresponding FFT spectrum of 2 sets totaling 8 different e−γ TDPAC measurements of 181Ta(TiO2). The additive constant for set “U_” (Unannealed) varies for all 3 members. The additive constant for set “A_” (30 min annealing at 873K) is −0.0398. The TDPAC probe used is 181Hf→181Ta, with the raw TDPAC spectrum (from the coincidence searches on the detectors) processed and converted into R(t) observables [see blue curves in the R(t) and their corresponding FFT graphs] by InterludeTM [see Equations (2)–(5)]. The R(t) signals are then fit by using the Gfit19TM program [see red curves in R(t) and the corresponding FFT graphs]. For clarity, we show only the first 50 ns on the R(t) graph because shorter coincidence searches of e−γ rays are less noisy and thus more statistically significant than longer coincidence searches.
Crystals 12 00946 g0a1
We have collected all the averaged results of our experimental and hyperfine parameters relating to the time-length of the annealing process (temperature of 873K in vacuum) in Table A3 below:
Table A3. Collecting the averaged results of our experimental and hyperfine parameters tailored to the time length of the annealing process (temperature of 873 K in vacuum). We principally want to point out the rapidly decreasing Delta Lorentzian δ , as a measure of the restoration of the lattice structure (at least around the 181Ta probes located at the Ti-substitutional site with a D2h site symmetry) that was caused by the 80 keV 181Hf implanted ions. (a) The averaged δ is written in this form, as its uncertainty exceeds its value.
Annealing Time (mins)Fundamental Frequency ω 0 (Mrad/s)Asymmetry Parameter η V z z
(1020 V/m2)
Delta Lorentzian δ (%)
0 (3 samples)763 (4)0.53 (1)141.9 (7)6.2 (8)
30 (5 samples)762 (3)0.545 (6)141.7 (5)1.0 (4)
315 (13 samples)765 (2)0.54 (1)142.2 (4)0.05 ± 0.19 a
Our results suggest that under thermal annealing at a temperature of 873 K in a vacuum, the damage caused to the lattice structure (at least locally around the vicinity of the substitutional 181Ta probe with D2h site symmetry) is rapidly repaired, causing a decrease of the Delta Lorentzian spread from 6.2(8)% to 1.0(4)% within 30 min. More impressively, after 5.25 h, the Delta Lorentzian drops by several orders of magnitude to (0.05 ± 0.19)%, suggesting that the majority of the substitutional 181Ta probe sits at a well-defined site. This result is also consistent with our XRD results presented in Section 4 of our paper, which concludes our finding that our 181Hf(→181Ta) -implanted TiO2 (single crystal) sample displays single crystal behavior after the mentioned sample withstand 5.25-h thermal annealing at a temperature of 873 K in a vacuum.
To conclude this appendix section, our findings, coupled with the relevant literature review, suggest that 5.25-h thermal annealing at a temperature of 873 K in a vacuum applied to our single crystal TiO2 that was 181Hf ion-implanted at 80 keV repairs almost all implantation damage, and in particular, possibly the Frankel defects, the heavily disordered damage clusters that behave like a polycrystalline, and the dislocation loops and lines.

Appendix B. Geometry between the Different Detector Planes

This work leads us to ask, what is the relationship between the angles θ   and   ϕ that correspond to the different detector planes?
Note that, given a perfect sample and perfect detectors and considering the symmetry corresponding to the angles θ   and   ϕ of each detector plane, we obtain an equivalence of the angles, whereby the following equivalent angles of θ   and   ϕ generate the same R(t):
θ = θ   mod   90 ° , ϕ = ϕ   mod   45 ° .
We use the Euler rotations R i θ , which is the matrix associated with the rotation of an object anticlockwise around axis i ( i x , y , z ) by the angle θ . Explicitly, these matrices are
R x θ = 1 0 0 0 cos θ sin θ 0 sin θ cos θ , R y θ = cos θ 0 sin θ 0 1 0 sin θ 0 cos θ , R z θ = cos θ sin θ 0 sin θ cos θ 0 0 0 1 .
Now, assume that we have the angles θ 1 , ϕ 1 for the R t signal that corresponds to the x-y detector plane, θ 2 , ϕ 2 for the y-z plane, and θ 3 , ϕ 3 for the x-z plane. Since this proof may be applied between any combination of detector planes, we need only show the relationship between θ 1 , ϕ 1 and θ 2 , ϕ 2 (i.e., for the combination of x-y and y-z planes).
For the angles θ j , ϕ j ,   j 1 , 2 , 3 corresponding to the three different detector planes to make sense, we would need to have the “defining axis” corresponding to each θ j and ϕ j . A “defining axis” means that if the vector that is free to rotate by θ about a mutually perpendicular axis is aligned with said defining axis, then we set θ = 0 ° .
This means that the defining axes of θ 1 , θ 2 , θ 3 are the z, x, and y axes, respectively, and the defining axes of ϕ 1 , ϕ 2 , ϕ 3 are the x, y, and z axes, respectively. Note that, by freedom of choice, we can also equivalently set the defining axes of ϕ 1 , ϕ 2 , ϕ 3 to be the y, z, and x axes, respectively.
Note also that, in general, the Euler rotations of two angles (with possibly the same magnitude) about two different axes, say R i θ and R i ϕ , do not commute [i.e., R i θ R i ϕ R i ϕ   R i θ ]. To fix this issue, we introduce the order of rotations such that, for each detector plane with the angles θ , ϕ , we first do the Euler rotation corresponding to the angle ϕ , and then do the Euler rotation corresponding to the angle θ so that the latter does not affect the former. This may be shown by noting that if the normal of the sample n ^ i is perpendicular to the detector plane (i.e., θ = 0 ° ), then the rotation of the sample by an angle ϕ around axis i does not affect n ^ i :
R i φ n ^ i θ = 0 = n ^ i θ = 0 .
Note, however, that Euler rotations of two different angles about the same axis do commute: R i θ R i ϕ = R i θ + ϕ .
We now derive the explicit relationship between two pairs of angles θ 1 , ϕ 1 and θ 2 , ϕ 2 corresponding to the x-y and y-z detector planes for a sample with a fixed orientation.
We assume that the sample is an infinitely thin sheet of paper with 1-unit-thick square edges and positioned in such a way that the corners of the sample occupy the spot
± 1 0 0 , ± 0 1 0 .
This means that the normal n ^ 1 to the sample is
n ^ 1 θ i = 0 = 0 0 1 .
In the x-y detector plane, this would correspond to the angle θ 1 = 0 ° and ϕ 1 = 0 ° .
A sample rotating by the finite angle ϕ 1 means that sample must rotate anticlockwise ϕ 1 degrees about the z-axis. We keep track of the changes made to the orientation of the sample parallel to the detector plane by defining the initial value of two vectors a ^ 1 and b ^ 1 to be
a ^ 1 ϕ 1 = 0 ° = 1 0 0 ,   b ^ 1 ϕ 1 = 0 ° = 0 1 0 .
The rotation of the sample by a finite angle ϕ 1 about the z axis corresponds to the transformation of vectors a ^ 1 and b ^ 1 by the Euler rotation R z ϕ 1 :
a ^ 1 ϕ 1 = R z ϕ 1 a ^ 1 ϕ 1 = 0 ° = cos ϕ 1 sin ϕ 1 0 , b ^ 1 ϕ 1 = R z ϕ 1 b ^ 1 ϕ 1 = 0 ° = sin ϕ 1 cos ϕ 1 0 .
As mentioned above, R z ϕ 1 acting on n ^ 1 θ i = 0 does nothing:
R z ϕ 1 n ^ 1 θ 1 = 0 = n ^ 1 θ 1 = 0 .
Next, we rotate the sample by a finite angle θ 1 either about the x axis or the y axis. Note that, through Euler’s rotation theorem, the composition of two such Euler rotations R i θ j is also a rotation. This means that the Euler rotations form a group [specifically, the S O 3 group] and we can change the orientation of a sample just by applying three specific Euler rotations.
Nevertheless, given that we have established the symmetry corresponding to the angles θ , ϕ of each detector plane and the equivalence of the angles θ , ϕ , we can identify the common axis of the two detector planes (in our case, it is the y axis), and rotate the sample by the finite angle θ 1 about the abovementioned axis (i.e., the y axis) to dramatically simplify the problem at hand.
Therefore, rotation of the sample by the finite angle θ 1 about the y axis corresponds to the transformation of vectors a ^ 1 θ 1 = 0 ,   ϕ 1 , b ^ 1 θ 1 = 0 ,   ϕ 1 , and n ^ 1 θ 1 = 0 by the Euler rotation R y θ 1 :
a ^ 1 θ 1 ,   ϕ 1 = R y θ 1 a ^ 1 θ 1 = 0 ,   ϕ 1 = cos θ 1 cos ϕ 1 sin ϕ 1 sin θ 1 cos ϕ 1 , b ^ 1 θ 1 ,   ϕ 1 = R y θ 1 b ^ 1 θ 1 = 0 ,   ϕ 1 = cos θ 1 sin ϕ 1 cos ϕ 1 sin θ 1 sin ϕ 1 , n ^ 1 θ 1 = R y θ 1 n ^ 1 θ 1 = 0 = sin θ 1 0 cos θ 1 .
We now shift our perspective from the x-y detector plane to the y-z detector plane and define:
n ^ 2 θ 2 = 0 = 1 0 0 , a ^ 2 ϕ 1 = 0 ° = 0 1 0 ,   b ^ 2 ϕ 1 = 0 ° = 0 0 1 .
The rotation of the sample by a finite angle of ϕ 2 about the x axis corresponds to the transformation of vectors a ^ 2 and b ^ 2 by the Euler rotation R x ϕ 2 :
a ^ 2 ϕ 2 = R x ϕ 2 a ^ 2 ϕ 2 = 0 ° = 0 cos ϕ 2 sin ϕ 2 , b ^ 2 ϕ 2 = R x ϕ 2 b ^ 2 ϕ 2 = 0 ° = 0 sin ϕ 2 cos ϕ 2 .
Note that applying R x ϕ 2 to n ^ 2 θ 2 = 0 does nothing:
R x ϕ 2 n ^ 2 θ 2 = 0 = n ^ 2 θ 2 = 0 .
Next, we rotate the sample by a finite angle θ 2 about the y axis, which corresponds to the transformation of vectors a ^ 2 θ 2 = 0 ,   ϕ 1 , b ^ 2 θ 2 = 0 ,   ϕ 1 and n ^ 2 θ 2 = 0 by the Euler rotation R y θ 2 :
a ^ 2 θ 2 ,   ϕ 2 = R y θ 2 a ^ 2 θ 2 = 0 ,   ϕ 2 = sin θ 2 sin ϕ 2 cos ϕ 2 cos θ 2 sin ϕ 2 , b ^ 2 θ 2 ,   ϕ 2 = R y θ 2 b ^ 2 θ 2 = 0 ,   ϕ 2 = sin θ 2 cos ϕ 2 sin ϕ 2 cos θ 2 cos ϕ 2 , n ^ 2 θ 2 = R y θ 2 n ^ 2 θ 2 = 0 = cos θ 2 0 sin θ 2 .
What remains is to determine the relationship between θ 1 ,   ϕ 1 and θ 2 ,   ϕ 2 such that
a ^ 1 θ 1 ,   ϕ 1 = a ^ 2 θ 2 ,   ϕ 2 , b ^ 1 θ 1 ,   ϕ 1 = b ^ 2 θ 2 ,   ϕ 2 , n ^ 1 θ 1 = n ^ 2 θ 2 .
We can reduce this set of equations to
cos θ 2 = sin θ 1 , sin θ 2 = cos θ 1 , cos ϕ 2 = sin ϕ 1 , sin ϕ 2 = cos ϕ 1 .
By using certain trigonometric identities ( 0 α 90 ° ),
cos α = sin 90 ° α , sin α = cos 90 ° α , cos α = cos α , sin α = sin α ,
The solutions are
θ 2 = θ 1 90 ° = 90 ° θ 1 , ϕ 2 = ϕ 1 90 ° = 90 ° ϕ 1 .
In physical terms, rotating the sample by the angle ϕ 1 about the z axis and then by θ 1 about the y axis in the x-y plane (frame) of reference corresponds to rotating the sample by the angle of ϕ 1 90 ° about the x axis and then by θ 1 90 ° about the y axis in the y-z plane (frame) of reference.
To help visualize the transformation geometrically, the following sequences detail the transformation of the following pair of unit vectors from a ^ 1 , b ^ 1 , n ^ 1 to a ^ 2 , b ^ 2 , n ^ 2 by the following Euler rotations:
a ^ 1 = 1 0 0 R z ϕ 1 cos ϕ 1 sin ϕ 1 0 R y θ 1 cos θ 1 cos ϕ 1 sin ϕ 1 sin θ 1 cos ϕ 1 R y 90 ° θ 1 0 cos ϕ 2 sin ϕ 2 R x 90 ° ϕ 1 0 1 0 = a ^ 2 , b ^ 1 = 0 1 0 R z ϕ 1 sin ϕ 1 cos ϕ 1 0 R y θ 1 cos θ 1 sin ϕ 1 cos ϕ 1 sin θ 1 sin ϕ 1 R y 90 ° θ 1 0 sin ϕ 2 cos ϕ 2 R x 90 ° ϕ 1 0 0 1 = b ^ 2 , n ^ 1 = 0 0 1 R z ϕ 1 0 0 1 R y θ 1 sin θ 1 0 cos θ 1 R y 90 ° θ 1 1 0 0 R x 90 ° ϕ 1 1 0 0 = n ^ 2 .
The symmetry of our TDPAC design allows us only to detect the magnitude of θ j , ϕ j of each set of detector angles for the three planar configurations. In sum, the following relations must hold:
θ 1 + θ 2 = θ 1 + θ 3 = 90 ° , φ 1 + φ 2 = φ 1 + φ 3 = 90 ° .
In practice, the above conditions cannot be achieved because, for example, the crystal is not perfect or infinitesimally thin or the average depth of the implantation may vary statistically. Therefore, we allow our θ , ϕ   to be free for each detector plane, but we try to ensure that θ 1 + θ 2 , 3 and φ 1 + φ 2 , 3 remain as close as possible to 90 ° .

References

  1. Greenwood, N.N.; Earnshaw, A. Chapter 21: “Titanium, Zirconium and Hafnium”. In Chemistry of the Elements, 2nd ed.; Butterworth Heinemann: Oxford, UK, 1998; pp. 954–975. ISBN 0750633654. [Google Scholar]
  2. Hanaor, D.A.H.; Sorrell, C.C. Review of the anatase to rutile phase transformation. J. Mater. Sci. 2011, 46, 855–874. [Google Scholar] [CrossRef] [Green Version]
  3. Fujishima, A.; Honda, K. Electrochemical Photolysis of Water at a Semiconductor Electrode. Nature 1972, 238, 37–38. [Google Scholar] [CrossRef] [PubMed]
  4. Hanaor, D.A.H.; Sorrell, C.C. Sand Supported Mixed-Phase TiO2 Photocatalysts for Water Decontamination Application. Adv. Eng. Mater. 2014, 16, 248–254. [Google Scholar] [CrossRef] [Green Version]
  5. Dumbuya, H.; Grimes, P.E.; Lynch, S.; Ji, K.; Brahmachary, M.; Zheng, Q.; Bouez, C.; Wangari-Talbot, J. Impact of iron-oxide containing formulations against visible light-induced skin pigmentation in skin of color individuals. J. Drugs Dermatol. 2020, 19, 712–717. [Google Scholar] [CrossRef]
  6. Gázquez, M.J.; Moreno, S.M.P.; Bolívar, J.P. Chapter 9: “TiO2 as white pigment and valorization of the waste coming from its production”. In Metal Oxides Series: Titanium Dioxide (TiO2) and Its Applications, 1st ed.; Parrino, F., Palmisano, L., Eds.; Elsevier Academic Press: Amsterdam, The Netherlands, 2021; pp. 311–335. ISBN 9780128199602. [Google Scholar]
  7. Adams, J.M.; Catchen, G.L. Anomalous crystal chemistries of the 111In → 111Cd and 181Hf → 181Ta probes in rutile TiO2 studied using perturbed-angular-correlation spectroscopy. Phys. Rev. B 1994, 50, 1264. [Google Scholar] [CrossRef]
  8. Darriba, G.N.; Errico, L.A.; Eversheim, P.D.; Fabricus, G.; Rentería, M. First-principles and time-differential γ−γ perturbed-angular-correlation spectroscopy study of structural and electronic properties of Ta-doped TiO2 semiconductor. Phys. Rev. B 2009, 79, 115213, Erratum in Phys. Rev. B 2011, 84, 239903. https://doi.org/10.1103/PhysRevB.84.239903. [Google Scholar] [CrossRef]
  9. Das, S.K.; Thakare, S.V.; Butz, T. The nuclear quadrupole interaction at 111Cd and 181Ta sites in anatase and rutile TiO2: A TDPAC study. J. Phys. Chem. Solids 2009, 70, 778–781. [Google Scholar] [CrossRef] [Green Version]
  10. Banerjee, D.; Das, S.K.; Thakare, S.V.; Nabhiraj, P.Y.; Menon, R.; Bhandari, R.K.; Krishnan, K. Study of surface-bulk mass transport and phase transformation in nano-TiO2 using hyperfine interaction technique. J. Phys. Chem. Solids 2010, 71, 983–987. [Google Scholar] [CrossRef] [Green Version]
  11. Banerjee, D.; Das, S.K.; Thakare, S.V. Simultaneous measurement of electric field gradient both at 111Cd and 181Ta sites in a single perturbed γ−γ angular correlation measurement. J. Radioanal. Nucl. Chem. 2017, 313, 677–682. [Google Scholar] [CrossRef]
  12. Banerjee, D.; Guin, R.; Das, S.K.; Thakare, S.V. Effect of γ-dose on the crystal structure and leaching behavior of TiO2 matrix labeled with 181Hf/181Ta tracer. J. Radioanal. Nucl. Chem. 2011, 290, 119–121. [Google Scholar] [CrossRef]
  13. Schell, J.; Lupascu, D.C.; Carbonari, A.W.; Mansano, R.D.; Ribeiro Junior, I.S.; Dang, T.T.; Anusca, I.; Trivedi, H.; Johnston, K.; Vianden, R. Ion implantation in titanium dioxide thin films studied by perturbed angular correlations. Int. J. Appl. Phys. 2017, 121, 145302. [Google Scholar] [CrossRef]
  14. Schell, J. Investigation of Hyperfine Parameters in Pure and 3D Transition Metal Doped SnO2 and TiO2 by Means of Perturbed Gamma–Gamma Angular Correlation Spectroscopy. Ph.D. Thesis, São Paulo University, São Paulo, Brazil, 2015. [Google Scholar]
  15. Martucci, T.; Ramos, J.M.; Carbonari, A.W.; Silva, A.S.; Saxena, R.N. Investigation of electric quadrupole interaction in TiO2 by means of perturbed gamma-gamma angular correlation spectroscopy. In Proceedings of the 2011 International Nuclear Atlantic Conference, Belo Horizonte, Brazil, 24–28 October 2011; Available online: https://inis.iaea.org/collection/NCLCollectionStore/_Public/43/046/43046289.pdf (accessed on 7 March 2022).
  16. Dimesso, L. Pechini Processes: An Alternate Approach of the Sol–Gel Method, Preparation, Properties, and Applications. In Handbook of Sol-Gel Science and Technology, 1st ed.; Klein, L., Aparicio, M., Jitianu, A., Eds.; Springer: Cham, Switzerland, 2018; pp. 1–22. ISBN 9783319194547. [Google Scholar] [CrossRef]
  17. Ribeiroa, P.C.; Figueiredo de Melo da Costa, A.C.; Goldschmidt Aliaga Kiminami, R.H.; Sasaki, J.M.; Lira, H.L. Synthesis of TiO2 by the Pechini Method and Photocatalytic Degradation of Methyl Red. Mater. Res. 2013, 16, 468–472. [Google Scholar] [CrossRef]
  18. Schell, J.; Zyabkin, D.; Lupascu, D.C.; Hofsäss, H.C.; Karabasov, M.O.; Welker, A.; Schaaf, P. A hyperfine look at Titanium Dioxide. AIP Adv. 2019, 9, 085208. [Google Scholar] [CrossRef] [Green Version]
  19. Aroyo, M.I. (Ed.) Vol. A, Ch. 7.1: Space Group 136. In International Tables for Crystallography, Volume A, 6th Edition, Space-group Symmetry; Wiley: Chichester, UK, 2006; ISBN 978-0-470-97423-0. Available online: https://it.iucr.org/Ab/ch7o1v0001/sgtable7o1o136/ (accessed on 4 April 2022).
  20. Rutile (TiO2, C4) Structure: A2B_tP6_136_f_a. In Encyclopedia of Crystallographic Prototypes. Available online: http://aflowlib.org/prototype-encyclopedia/A2B_tP6_136_f_a.html (accessed on 4 April 2022).
  21. Titanium Dioxide (Rutile) TiO2, Shinkosha. Available online: https://www.shinkosha.com/english/product/epi_substrate/epi_substrate_03/ (accessed on 7 March 2022).
  22. Maity, P.; Mohammed, O.F.; Katsiev, K. Study of the Bulk Charge Carrier Dynamics in Anatase and Rutile TiO2 Single Crystals by Femtosecond Time Resolved Spectroscopy. J. Phys. Chem. C 2018, 122, 8925–8932. [Google Scholar] [CrossRef] [Green Version]
  23. Grundmann, M. Chapter 8: “Transport” and Chapter 10: “Recombination” In The Physics of Semiconductors: An Introduction Including Nanophysics and Applications, 3rd ed.; Springer International Publishing: Cham, Switzerland, 2016; pp. 278–281, 343–346. ISBN 978-3-319-23879-1. [Google Scholar]
  24. Gehring, A.; Selberherr, S. Chapter 9: “Tunnelling Models for Semiconductor Device Simulation”. In Handbook of Theoretical and Computational Nanotechnology; American Scientific Publishers: Valencia, CA, USA, 2006; Volume 10, Available online: https://www.iue.tuwien.ac.at/pdf/ib_2006/BC2006_Gehring_1.pdf (accessed on 7 March 2022).
  25. Woolcot, T.; Teobaldi, G.; Pang, C.L.; Beglitis, N.S.; Fisher, A.J.; Hofer, W.A.; Thornton, G. Scanning Tunneling Microscopy Contrast Mechanisms for TiO2. Phys. Rev. Lett. 2012, 109, 156105. [Google Scholar]
  26. Adachi, Y.; Brndiar, J.; Wen, H.F.; Zhang, Q.Z.; Miyazaki, M.; Thakur, S.; Sugawara, Y.; Sang, H.Q.; Li, Y.J.; Štich, I.; et al. Electron dynamics of tip-tunable oxygen species on TiO2 surface. Commun. Mater. 2021, 2, 71. [Google Scholar] [CrossRef]
  27. Thomas, A.G.; Flavell, W.R.; Mallick, A.K.; Kumarasinghe, A.R.; Tsoutsou, D.; Khan, N.; Chatwin, C.; Rayner, S.; Smith, G.C. Comparison of the electronic structure of anatase and rutile TiO2 single-crystal surfaces using resonant photoemission and X-ray absorption spectroscopy. Phys. Rev. B 2007, 75, 035105. [Google Scholar] [CrossRef]
  28. Zhu, H.X.; Zhou, P.X.; Li, X.; Liu, J.-M. Electronic structures and optical properties of rutile TiO2 with different point defects from DFT+U calculations. Phys. Lett. A 2014, 378, 2719–2724. [Google Scholar] [CrossRef]
  29. Perron, H.; Domain, C.; Roques, J.; Drot, R.; Simoni, E.; Catalette, H. Optimization of accurate rutile TiO2 (110), (100), (101) and (001) surface models from periodic DFT calculations. Theor. Chem. Acc. 2007, 117, 565–574. [Google Scholar] [CrossRef] [Green Version]
  30. Rühle, S.; Cahen, D. Electron Tunnelling at TiO2/Substrate Interface Can Determine Dye-Sensitized Solar Cell Performance. J. Phys. Chem. B 2004, 108, 17946–17951. [Google Scholar] [CrossRef]
  31. Barbosa, M.B.; Correia, J.G.; Lorenz, K.; Vianden, R.; Araújo, J.P. Studying electronic properties in GaN without using electrical contacts using γ−γ vs e−γ Perturbed Angular Correlations. Sci. Rep. 2019, 9, 15734. [Google Scholar] [CrossRef]
  32. Schell, J.; Lupascu, D.C.; Correia, J.G.; Carbonari, A.W.; Deicher, M.; Barbosa, M.B.; Mansano, R.D.; Johnston, K.; Ribeiro, I.S., Jr. ISOLDE collaboration “In and Cd as defect traps in titanium dioxide”. Hyperfine Interact. 2017, 238, 2. [Google Scholar] [CrossRef]
  33. Schatz, G.; Weidinger, A. Chapter 2: “Electromagnetic Properties and Nuclear Decay. Chapter 3: “Hyperfine Interactions. Chapter 5: “Perturbed γ−γ Angular Correlation (PAC). In Nuclear Condensed Matter Physics: Nuclear Methods and Applications; Wiley: Chichester, UK, 1996; pp. 3–32, 63–99. ISBN 0471954799. [Google Scholar]
  34. Steffen, R.M.; Alder, K. Chapter 13: “Extranuclear perturbations of angular distributions and correlations”. In The Electromagnetic Interaction in Nuclear Spectroscopy, 1st ed.; Hamilton, W.D., Ed.; North-Holland Publishing Company Ltd.: Oxford, UK, 1975; pp. 583–643. ISBN 0720402751. [Google Scholar]
  35. Butz, T. Analytic perturbation functions for static interactions in perturbed angular correlation of γ rays. Hyperfine Interact. 1989, 52, 189–228. [Google Scholar] [CrossRef]
  36. Johnston, K.; Schell, J.; Correia, J.G.; Deicher, M.; Gunnlaugsson, H.P.; Fenta, A.S.; David-Bosne, E.; Costa, A.R.G.; Lupascu, D.C. “The solid state physics programme at ISOLDE: Recent developments and perspectives. J. Phys. G Nucl. Part. Phys. 2017, 44, 104001. [Google Scholar] [CrossRef]
  37. Marschick, G.; Schell, J.; Stöger, B.; Gonçalves, J.N.; Karabasov, M.O.; Zyabkin, D.; Welker, A.; Escobar, C.M.; Gärtner, D.; Efe, I.; et al. Multiferroic bismuth ferrite: Perturbed angular correlation studies on its ferroic α−β phase transition. Phys. Rev. B 2020, 102, 224110. [Google Scholar] [CrossRef]
  38. Jancso, A.; Correia, J.G.; Gottberg, A.; Schell, J.; Stachura, M.; Szunyogh, D.; Pallada, S.; Lupascu, D.C.; Kowalska, M.; Hemmingsen, L. TDPAC and β-NMR applications in chemistry and biochemistry. J. Phys. G Nucl. Part. Phys. 2017, 44, 064003. [Google Scholar] [CrossRef]
  39. Balogh, R.K.; Gyurcsik, B.; Hunyadi-Gulyás, É.; Schell, J.; Thulstrup, P.W.; Hemmingsen, L.; Jancsó, A. C-terminal Cysteines of CueR Act as Auxiliary Metal Site Ligands upon Hg-II Binding—A Mechanism to Prevent Transcriptional Activation by Divalent Metal Ions? Chem. Eur. J. 2019, 25, 15030–15035. [Google Scholar] [CrossRef] [Green Version]
  40. Wu, S.-C. Nuclear Data Sheets for A = 181. Nucl. Data Sheets 2005, 106, 367–600. [Google Scholar] [CrossRef]
  41. Catherall, R.; Andreazza, W.; Breitenfeldt, M.; Dorsival, A.; Focker, G.J.; Gharsa, T.P.; Giles, T.J.; Grenard, J.-L.; Locci, F.; Martins, P. The ISOLDE facility. J. Phys. G: Nucl. Part. Phys. 2017, 44, 094002. [Google Scholar] [CrossRef] [Green Version]
  42. Schell, J.; Schaff, P.; Lupascu, D.C. Perturbed angular correlations at ISOLDE: A 40 years young technique. AIP Adv. 2017, 7, 105017. [Google Scholar] [CrossRef] [Green Version]
  43. Marques, J.G.; Correia, J.G.; Melo, A.A.; da Silva, M.F.; Soares, J.C. ISOLDE Collaboration (CERN). A four-detector spectrometer for eγ PAC on-line with the ISOLDE-CERN isotope separator. Nucl. Instrum. Methods Phys. Res. Sect. B 1995, 99, 645–648. [Google Scholar] [CrossRef] [Green Version]
  44. Kleinheinz, P.; Samuelsson, L.; Vukanović, R.; Siegbahn, K. A four-detector electron directional correlation spectrometer. Nucl. Instrum. Methods. 1965, 32, 1–27. [Google Scholar] [CrossRef]
  45. Nagl, M.A.; Barbosa, M.B.; Vetter, U.; Correia, J.G.; Hofsäss, H.C. A new tool for the search of nuclides with properties suitable for nuclear solid state physics based on the Evaluated Nuclear Structure Data Files. Nucl. Instrum. Methods Phys. Res. A 2013, 726, 17–30. [Google Scholar] [CrossRef]
  46. Lupascu, D.C.; Habenicht, S.; Lieb, K.-P.; Neubauer, M.; Uhrmacher, M.; Wenzel, T. Relaxation of electronic defects in pure and doped La2O3 observed by perturbed angular correlations. Phys. Rev. B 1996, 871, 871. [Google Scholar] [CrossRef]
  47. Forker, M.; Krien, K.; Reuschenbach, F. e−γ TDPAC measurements of the magnetic and electric hyperfine interaction of 181Ta implanted in terbium. Hyperfine Interact. 1981, 9, 255–259. [Google Scholar] [CrossRef]
  48. Krien, K.; Forker, M.; Reuschenbach, F.; Trzcinski, R. “The magnetic hyperfine field and the electric field gradient at 181Ta impurities in Gd metal. Hyperfine Interact. 1979, 7, 19–27. [Google Scholar] [CrossRef]
  49. Soares, J.C.; Krien, K.; Freitag, K. Magnetic hyperfine fields at Ta in Co and Fe hosts measured by the e−γ time-differential perturbed angular-correlation method. Hyperfine Interact. 1975, 1, 45–53. [Google Scholar] [CrossRef]
  50. Krien, K.; Bibiloni, A.G.; Freitag, K.; Soares, J.C.; Vianden, R. Measurements of the Magnetic Hyperfine Fields at Hg in Fe, Co, and Ni Hosts by the e−γ Time-Differential Perturbed-Angular-Correlation Method. Phys. Rev. B 1973, 8, 2248. [Google Scholar] [CrossRef]
  51. Butz, T.; Lerf, A. Comment on “Mössbauer studies of the 6.2 keV γ rays of 181Ta in Ta-dichalcogenides. Phys. Lett. A 1983, 97, 217–218. [Google Scholar] [CrossRef]
  52. Wegner, T. Calculated Perturbed Angular Correlations for 111In Doped Cubic Single Crystals. Hyperfine Interact. 1985, 23, 179–210. [Google Scholar] [CrossRef]
  53. Correia, J.G.; C2TN, DECN, Instituto Superior Técnico, Universidade de Lisboa, Lisboa, Portugal; European Organization for Nuclear Research (CERN), 1211 Geneva, Switzerland. Qk(e) anisotropy attenuation coefficients consider electron (back)scattering on sample and spectrometer geometry acceptance solid angle determined with the esP2P4 program that was built on purpose and integrates modified versions of Penelope and penEasy programs. Personal communication, 2019. [Google Scholar]
  54. Baró, J.; Sempau, J.; Fernández-Varea, J.M.; Salvat, F. PENELOPE: An algorithm for Monte Carlo simulation of the penetration and energy loss of electrons and positrons in matter. Nucl. Instrum. Methods Phys. Res. Sect. B 1995, 100, 31–46. [Google Scholar] [CrossRef]
  55. Crystals GmbH. Available online: https://crystal-gmbh.com/ (accessed on 18 January 2022).
  56. Freitag, K. A facility for ion implantation in samples colder than 0.5 K. Radiat. Eff. 1979, 44, 185. [Google Scholar] [CrossRef]
  57. Rutile Mineral Data. Available online: http://webmineral.com/data/Rutile.shtml#.YeYHc_7MIQ9 (accessed on 18 January 2022).
  58. Jäger, M.; Iwig, K.; Butz, T. A compact digital time differential perturbed angular correlation-spectrometer using field programmable gate arrays and various timestamp algorithms. Rev. Sci. Instrum. 2011, 82, 065105. [Google Scholar] [CrossRef]
  59. Raghavan, R.S.; Raghavan, P. A new method for differential perturbed angular correlation measurements. Nucl. Instrum. Methods 1971, 92, 435–437. [Google Scholar] [CrossRef]
  60. Horta, J.; Silva, D. Interlude, Copyright (2000–2002) from Leipzig University © JL; Leipzig University: Leipzig, Germany, 2002. [Google Scholar]
  61. Correia, J.G. Correia, for GFIT19 and N. P. Barradas for NNFIT Programs. In PAC MANual; Lisbon, Portugal, 1992. [Google Scholar]
  62. Barradas, N.P. NNFit the PAC MANual; Lisabon, Portugal, 1992. [Google Scholar]
  63. Barradas N., P.; Rots, M.; Melo, A.A.; Soares, J.C. Magnetic anisotropy and temperature dependence of the hyperfine fields of 111Cd in single-crystalline cobalt. Phys. Rev. B 1993, 47, 8763. [Google Scholar] [CrossRef]
  64. Nightmare (MDI). Version RC 3 (1.2.0.247): Copyright (2005–2010) from the Group Reiner Vianden and (2008-2010) Ronan Nédélec; Bonn University: Bonn, Germany, 2010. [Google Scholar]
  65. Correia, J.G.; C2TN, DECN, Instituto Superior Técnico, Universidade de Lisboa, Lisboa, Portugal; European Organization for Nuclear Research (CERN), 1211 Geneva, Switzerland. Details for γ Akk coefficients. Obtained with program multiAkk (J.G. Correia and J.G. Marques) that generates angular correlation coefficients (bk)Akk’(bk’). Multiple gamma—gamma and electron-gamma nuclear cascades. The program further includes gamma finite size (gamma) attenuations coefficients Qkk’ which were analytically calculated. Personal communication, 2019. [Google Scholar]
  66. Hager, R.S.; Seltzer, E.C. Internal conversion tables, part II: Directional and polarization particle parameters for Z = 30 to Z = 103. Nucl. Data Sheets A 1968, 4, 397–641. [Google Scholar] [CrossRef]
  67. Hager, R.S.; Seltzer, E.C. Internal conversion tables, part I: K-, L-, M- Shell conversion coefficients for Z = 30 to Z = 103. Nucl. Data Sheets A 1968, 4, 1–235. [Google Scholar] [CrossRef]
  68. Rose, M.E. The Analysis of Angular Correlation and Angular Distribution Data. Phys. Rev. 1953, 91, 610. [Google Scholar] [CrossRef]
  69. Empyrean, the Intelligent Diffractometer by Malvern Panalytical. Available online: https://www.malvernpanalytical.com/en/products/product-range/empyrean-range/empyrean (accessed on 17 June 2022).
  70. Guo, X.Y.; Xu, D.P.; Ding, Z.H.; Su, W.H. Preparation and Raman Spectrum of Rutile Single Crystals using Floating Zone Method. Chin. Phys. Lett. 2006, 23, 1645. [Google Scholar] [CrossRef]
  71. Müller, G.; Friedrich, J. Crystal Growth, Bulk: Methods. In Encyclopedia of Condensed Matter Physics, 1st ed.; Bassani, F., Liedl, G.L., Wyder, P., Eds.; Elsevier Academic Press: Amsterdam, The Netherlands, 2007; pp. 269–270. ISBN 978-0-12-369401-0. [Google Scholar]
  72. Power Diffraction Data of Rutile. Available online: https://rruff.info/Rutile/R060745 (accessed on 18 June 2022).
  73. RRUFF™ Project. Available online: https://rruff.info/about/about_general.php (accessed on 18 June 2022).
  74. Gibbons, J.F. Ion implantation in semiconductors—Part I: Range distribution theory and experiments. Proc. IEEE 1972, 56, 259–319. [Google Scholar] [CrossRef]
  75. Metropolis, N. The Beginning of the Monte Carlo Method; Volume is a Special Issue Dedicated to Stanislaw Ulam; LANL Publications: Los Alamos County, NM, USA, 1987; Volume 15, pp. 124–130. Available online: https://library.lanl.gov/la-pubs/00326866.pdf (accessed on 11 April 2022).
  76. Gibbons, J.F. Ion implantation in semiconductors—Part II: Damage production and annealing. Proc. IEEE 1972, 60, 1062–1096. [Google Scholar] [CrossRef]
Figure 1. (a) The relevant decay paths of 181Hf(181Ta), with the fractions representing the quantum number of the total angular momentum I of the particular state. More details could be found in reference [40]. (b) Emission spectrum of γ rays, with γ1 at 133 keV and γ2 at 482 keV. (c) Emission spectrum of electrons, in which we take the <L> shell with an average energy of 122 keV (133 keV–11 keV) for e−γ TDPAC spectroscopy. Adapted with permission from Ref. [31] under the Creative Commons Attribution 4.0 International License. Copyright 2019, Barbosa, M.B. et al.
Crystals 12 00946 g001
Figure 2. Schematic representation of electron cascade after ejection of conversion electron from nuclear decay. Electrons from higher shells de-excite to fill the vacant lower-energy shells, emitting either characteristic X-rays or Auger electrons or both. This process occurs on a time scale on the order of picoseconds, which is three orders of magnitude faster than the nanosecond time resolution of (181Hf→181Ta) TDPAC spectroscopy. The electron cascade ends once the vacancy induced by the ejection of the conversion electron reaches the valence shell and is filled by recombination electrons provided by the host material. If the electron recombination process occurs on a timescale greater than nanoseconds, then the dynamic e−γ TDPAC signal differs from the γ−γ TDPAC signal. Reprinted with permission from Ref. [31] under the Creative Commons Attribution 4.0 International License. Copyright 2019, Barbosa, M.B. et al.
Crystals 12 00946 g002
Figure 3. A photograph of both TiO2 samples after completion of the TDPAC spectroscopies, commercially fabricated and purchased by Crystal GmbH [55]. Both samples are ion-implanted with 181Hf isotope at 80 keV and were sufficiently annealed at a temperature of 873K in a vacuum for 5.25 h.
Crystals 12 00946 g003
Figure 4. Simulation of distribution of stopping range of implanted 181Hf isotope in rutile TiO2 using SRIM 2013. We assume that rutile TiO2 has a density of 4.25 g/cm3 [57].
Crystals 12 00946 g004
Figure 5. (left) R(t) graph and (right) corresponding FFT spectrum of the single γ−γ TDPAC measurement of 181Ta(TiO2) with four possible geometries. The TDPAC probe used is 181Hf→181Ta, with the raw TDPAC spectrum (from the coincidence searches on the detectors) processed and converted into R(t) observables (see blue curves in R(t) and corresponding FFT graphs) by InterludeTM (Equations (2)–(5)). The R(t) signals are then fit using the Gfit19TM program (see red curves in R(t) and the corresponding FFT graphs). For clarity, we show only the first 50 ns on the R(t) graph because shorter coincidence searches of γ−γ rays are less noisy and thus more statistically significant than longer coincidence searches.
Crystals 12 00946 g005
Figure 6. (left) R(t) graph and (right) corresponding FFT spectrum of the first six of the 13 different e−γ TDPAC measurements of 181Ta(TiO2). The additive constant is 0.0187. The TDPAC probe used is 181Hf→181Ta, with the raw TDPAC spectrum (from the coincidence searches on the detectors) processed and converted into R(t) observables [blue curves in the R(t) and the corresponding FFT graphs] by InterludeTM [see Equations (2)–(5)]. The R(t) signals are then fit by using the Gfit19TM program [see red curves in R(t) and the corresponding FFT graphs]. For clarity, we show only the first 50 ns on the R(t) graph because shorter coincidence searches of e−γ rays are less noisy and thus more statistically significant than longer coincidence searches.
Crystals 12 00946 g006
Figure 7. (left) R(t) graph and (right) corresponding FFT spectrum of the latter seven of the set of 13 different e−γ TDPAC measurements of 181Ta(TiO2). The additive constant is 0.0085. The TDPAC probe used is 181Hf→181Ta, with the raw TDPAC spectrum (from the coincidence searches on the detectors) processed and converted into R(t) observables [see blue curves in the R(t) and their corresponding FFT graphs] by InterludeTM [see Equations (2)–(5)]. The R(t) signals are then fit by using the Gfit19TM program [see red curves in R(t) and the corresponding FFT graphs]. For clarity, we show only the first 50 ns on the R(t) graph because shorter coincidence searches of e−γ rays are less noisy and thus more statistically significant than longer coincidence searches.
Crystals 12 00946 g007
Figure 8. Top graph: The XRD diffractogram of a freshly fabricated TiO2 sample from Crystal GmbH [55]. Next two graphs: The XRD diffractogram of our (80 keV ion-implanted 181Hf complimented with sufficient thermal annealing) TiO2 sample, measured after our TDPAC measurements. Bottom graph: the combined XRD diffractogram of the 3 abovementioned samples, with each corresponding intensity normalized concerning their individual highest recorded intensity. The left side of the graphs is presented as the log-10 plot of the measured intensity (counts) against the diffraction angle from 0–80°. For the top 3 graphs on the left side, the intensity starts from 1 × 10⁻², while for the bottom graph (on the left side), it starts from 1 × 10⁻⁴. The right side of the graphs is presented as the linear plot of the measured intensity (counts) against the restricted domain of the diffraction angle from 38–40°. In all the right-sided graphs, the intensity starts from 0. We present the results of our XRD diffractions in this manner as: (a) the peaks in the domain of 39–40° dominate all other peaks and (b) to allow for the visualization of the successful resolution of the two most dominant peaks.
Crystals 12 00946 g008
Figure 9. R(t) (with the same scale) between the x-y plane of γ−γ TDPAC spectroscopy setup (lower panel, data points are green dots, and fit is the magenta line) compared with R(t) from sample 8 of e−γ TDPAC spectroscopy setup (upper panel, data points are blue dots and fit is red line). Due to the difference in time calibration (0.101 ns/channel for γ−γ TDPAC spectroscopy and 0.195 ns/channel for e−γ TDPAC spectroscopy), the periodicity of the γ−γ R(t) is roughly twice that of the e−γ R(t). Nevertheless, from the Gfit19TM fitting process, the average fundamental frequencies and the asymmetry parameters for the γ−γ TDPAC spectroscopy setup [762(1) Mrad/s, 0.543(3)] are close to those of the e−γ TDPAC spectroscopy setup [765(2) Mrad/s, 0.54(1)].
Crystals 12 00946 g009
Figure 10. The values of V z z obtained from our γ−γ and e−γ experiments are visually compared with accepted literature values from Table 4.
Crystals 12 00946 g010
Figure 11. The values of η obtained from our γ−γ and e−γ experiments are visually compared with accepted literature values from Table 4.
Crystals 12 00946 g011
Table 1. Table of fitted hyperfine and experimental parameters for the single γ−γ TDPAC measurement of 181Ta(TiO2) with four possible geometries, as given by the Gfit19TM program. For the individual values of V z z , the fit uncertainty is separated into (a) the statistical uncertainty caused by our instruments, and (b) the (dominant) systematic uncertainty of the quadrupole moment (±2.1%) as quoted in reference [51]. Note (1) the large χ 2 value of the six-detector measurement and (2) the large multiplicative constant of the four-detector in the x-y plane TDPAC measurement vis-à-vis the two other four-detector TDPAC measurements. The averaged values of ω 0 , η , and V z z from the four different geometries were calculated, with (in the case of V z z , (c)) the uncertainty assigned the square root of the sum of squares of their statistical uncertainty (in the case of V z z , (a)).
GeometryFundamental Frequency ω 0 (Mrad/s)Asymmetry Parameter η V z z (1020 V/m2)Delta Lorentzian δ (%)Chi Squared χ 2 Theta θ (Deg)Phi ϕ (Deg)Multiplicative ConstantAdditive Constant
Six-detectors762.0 (4)0.540 (1)141.68
± 0.07 a
± 3.00 b
0.94 (5)3.5N.A.N.A.0.692 (5)−0.1111 (4)
Four-detector x-y plane761.8 (2)0.542 (1)141.64
± 0.04 a
± 3.00 b
0.17 (3)0.7764.4 (5)47.1 (3)0.719 (5)−0.0817 (5)
Four-detector x-z plane761.9 (7)0.545 (2)141.7
± 0.1 a
± 3.0 b
0.49 (9)0.7928.6 (8)45.8 (3)0.314 (7)−0.1795 (5)
Four-detector y-z plane761.5 (6)0.544 (2)141.6
± 0.1 a
± 3.0 b
0.46 (8)0.9629.5 (7)46.3 (4)0.300 (6)−0.1843 (4)
Average762 (1)0.543 (3)141.6
± 0.2 c
N.A.N.A.N.A.N.A.N.A.N.A.
Table 2. Table of fitted hyperfine and experimental parameters for the set of 13 different e−γ TDPAC measurements of 181Ta(TiO2), returned by the Gfit19TM program. For the individual values of V z z , the fit uncertainty is separated into (a) the statistical uncertainty caused by our instruments, and (b) the (dominant) systematic uncertainty of the quadrupole moment (±2.1%) as quoted in reference [51]. Compared with the single γ−γ TDPAC measurement of 181Ta(TiO2) with four different geometries (Table 1), the multiplicative constant and additive constant of this set of e−γ TDPAC measurements is fixed at 1 and 0.0187 or 0.0085, respectively. The averaged values of ω 0 , η , and V z z from this set of e−γ TDPAC measurements were calculated, with (in the case of V z z , (c)) the uncertainty assigned the square root of the sum of squares of their statistical uncertainty (in the case of V z z , (a)). (d) The averaged δ is written in this form, as its uncertainty exceeds its value.
R(t) SignalFundamental Frequency ω 0 (Mrad/s)Asymmetry Parameter η V z z (1020 V/m2)Delta Lorentzian δ (%)Chi Squared χ 2 Phi ϕ (Deg)Additive Constant (Fixed)
1765.0 (5)0.549 (3)142.23 ± 0.09 a
± 3.01 b
0.03 (6)0.7237.8 (4)0.0187
2765.6 (3)0.546 (2)142.35 ± 0.06 a
± 3.02 b
0.04 (6)0.9937.9 (2)0.0187
3765.6 (3)0.546 (2)142.35 ± 0.06 a
± 3.02 b
0.04 (6)0.9937.9 (2)0.0187
4764.4 (3)0.543 (2)142.12 ± 0.06 a
± 3.01 b
0.02 (2)0.8937.5 (2)0.0187
5764.4 (3)0.543 (2)142.12 ± 0.06 a
± 3.01 b
0.02 (2)0.8937.5 (2)0.0187
6764.4 (3)0.543 (2)142.12 ± 0.06 a
± 3.01 b
0.02 (2)0.8937.5 (2)0.0187
7763.8 (7)0.536 (4)142.0 ± 0.1 a
± 3.0 b
0.04 (9)0.7338.6 (5)0.0085
8764.6 (4)0.539 (2)142.17 ± 0.08 a
± 3.01 b
0.09 (6)0.8538.8 (3)0.0085
9764.6 (4)0.539 (2)142.17 ± 0.08 a
± 3.01 b
0.09 (6)0.8538.8 (3)0.0085
10765 (1)0.552 (5)142.2 ± 0.2 a
± 3.0 b
0.07 (1)0.6037.2 (7)0.0085
11765 (1)0.552 (5)142.2 ± 0.2 a
± 3.0 b
0.07 (1)0.6037.2 (7)0.0085
12765.1 (5)0.544 (3)142.3 ± 0.1 a
± 3.0 b
0.06 (7)0.7136.3 (3)0.0085
13765.1 (5)0.544 (3)142.3 ± 0.1 a
± 3.0 b
0.06 (7)0.7136.3 (3)0.0085
Average765 (2)0.54 (1)142.2 ± 0.4 c0.05 ± 0.19 dN.A.38 (1)0.0085
Table 3. The relevant parameters of the fit produced by Empyrean diffractometer’s complimentary analysis software. We note here that the splitting between the two peaks in the same sample is on the order of 0.1°, and there is a systematic shift of the two most dominant peaks across all 3 samples, within a small range of 0.22°. This shift could be attributed to the individual micro-stress of each sample.
Sample and Peak NumberAngle 2 θ
(2 × Deg)
d-Spacing (Angstrom)Observed Intensity (Counts) F W H M (2 × Deg)Background Intensity (Counts)Crystallite Size (Angstrom)Micro-Strain (%)
Reference Sample, Peak 139.47312.281041,264,6630.04684616.4029,6520.003846
Reference Sample, Peak 239.57602.28100612,1500.04684647.9329,7350.003846
Sample 1, Peak 139.69122.26901152,1330.06241421.8629,6720.003823
Sample 1, Peak 239.79432.2690076,4430.04681427.0129,7560.003813
Sample 2, Peak 139.53322.27771378,8070.04682202.7229,6580.003840
Sample 2, Peak 239.63592.27769182,4280.04682227.2129,7410.003829
Table 4. Published literature values (after correcting for the quadrupole moment of 181Ta according to reference [51]) of the relevant hyperfine parameters for the 181Ta(TiO2) γ−γ TDPAC spectroscopy compared with the hyperfine parameters obtained from our γ−γ and e−γ experiments. We note that across all the papers mentioned below, they did not consider the dominant systematic uncertainty of the quadrupole moment as quoted in reference [51]. Hence, for our values, we only consider the statistical uncertainty caused by our instruments. Note that (a) Martucci et al. did not include the uncertainty in their report, (b) they mentioned that their asymmetry parameters agree with the reference [10], (c) they also mentioned that discrepancy of V z z of their sample 4 concerning the literature values is due to the presence of the fluorine atoms (A byproduct caused by their preparation method) near the 181Ta probe, and (d) the averaged δ is written in this form, as its uncertainty exceeds its value.
Paper V z z (1020 V/m2)Asymmetry Parameter η Delta Lorentzian δ (%)Crystal TypeSample PreparationReference
James 1994141.6 (7)0.57 (1)≈0.01PolycrystalThermal Annealing at 1570 K for several hrs[7]
Darriba 2011143.2 (7)0.555 (8)0.4 (2)Single CrystalThermal Annealing at 1073 K for 6 h[8]
Banerjee 2016141.9 (2)0.56 (1)0.6 (1)PolycrystalThermal Annealing at 1273 K for 10 h[11]
Satyendra 2009145 (1)0.56 (1)UnknownPolycrystalThermal Annealing at 1273 K for 10 h[9]
Banerjee 2010 {S4}149.5 (8)0.51 (1)5.2 (5)PolycrystalThermal Annealing at 1123 K for 4 h[10]
Banerjee 2010 {S7}145.6 (1)0.55 (1)1.0 (1)PolycrystalThermal Annealing Anatase TiO2 at 1223 K for 8 h
(Convert to Rutile TiO2)
[10]
Martucci 2011 {3}142.06 a0.55 a,bUnknownPolycrystalThermal Annealing Anatase TiO2 at 973 K for 10 h under Nitrogen
(Convert to Rutile TiO2)
[15]
Martucci 2011 {4}139.00 c0.55 a,bUnknownPolycrystalThermal Annealing Anatase TiO2 at 1223 K for 10 h under Nitrogen
(Convert to Rutile TiO2)
[15]
This study (γ–γ)141.6 (2)0.543 (3)N.A.Single CrystalThermal Annealing at 873 K for 5.25 hN.A.
This study (e–γ)142.2 (4)0.54 (1)0.05 ± 0.19 dSingle CrystalThermal Annealing at 873 K for 5.25 hN.A.
Table 5. An XRD comparison of the 2 dominant peaks of our single crystal rutile TiO2 samples to the (1) reference sample produced by Crystal GmbH [55] and (2) the samples produced via the floating zone method as described in the paper of Guo et al. [70]. We note that in their corresponding XRD diffractogram (Figure 2 of [70]), regardless of the direction of the cut, we could see multiple small peaks that are too fine to be distinguished with their domain of 20–50°, like our case as seen in Figure 8, in which we must restrict our domain from 0–80° to 38–40° to allow for sufficient resolution. (a) The peak identification of the Miller indices for our samples (and the reference sample) concerns reference [72]. For samples from paper [70], the peaks are already identified in the corresponding paper and cross-verified with reference [72].
Sample and Peak NumberAngle 2 θ
(2 × Deg)
Peak Identity (Miller Indices) aSample Preparation
Sample from [70], cut along an arbitrary direction.62.6(002)Sample is produced in the laboratory setting via the floating zone method. The resulting sample is then cut into 5 × 2 mm2 thin slices alongside an arbitrary direction and the direction of the crystal growth, respectively.
Sample from [70], cut perpendicular to the c-axis.27.5(110)
Reference Sample, Peak 1.39.5(200)Sample (10 × 10 × 1.0 mm3) is commercially manufactured by Crystal GmbH [55]. XRD measurement is conducted face-(10 × 1.0 mm2) side up.
Reference Sample, Peak 2.39.6
Sample 1, Peak 1, This study.39.7(200)Sample (10 × 10 × 1.0 mm3) is commercially manufactured by Crystal GmbH [55], then 80 keV 181Hf ion-implanted and thermally annealed at 873 K for 5.25 h. XRD measurement is conducted face-(10 × 1.0 mm2) side up.
Sample 1, Peak 2, This study.39.8
Sample 2, Peak 1, This study.39.5
Sample 2, Peak 2, This study.39.6
Publisher’s Note: MDPI stays neutral with regard to jurisdictional claims in published maps and institutional affiliations.