Article

Influence of Physical Vapor Deposition on High-Cycle Fatigue Performance of Additively Manufactured Ti-6Al-7Nb Alloy

1
Chair of Materials Science (LWK), Paderborn University, Warburger Str. 100, 33098 Paderborn, Germany
2
DMRC—Direct Manufacturing Research Center, Paderborn University, Mersinweg 3, 33100 Paderborn, Germany
Crystals 2022, 12(9), 1190; https://doi.org/10.3390/cryst12091190
Submission received: 21 July 2022 / Revised: 15 August 2022 / Accepted: 17 August 2022 / Published: 24 August 2022
(This article belongs to the Special Issue New Materials and Concepts for Additive Manufacturing with Metals)

Abstract

:
Load-bearing permanent implants, such as hip or knee joint replacements, are permanently loaded in the human body and must withstand considerable high loading cycles. The characteristic properties of additively manufactured Ti-6Al-7Nb, manufactured by laser powder bed fusion (LPBF), such as a rough surface and high residual stresses, have a detrimental effect on the fatigue behavior of such components. Functional physical vapor deposition (PVD) coatings and heat treatments offer the possibility to influence these properties. For this reason, the effects of stress-relief heat treatment (SR; 600 °C/4 h) and three PVD coatings (titanium nitride (TiN), titanium carbonitride (TiCN), and silver-containing amorphous carbon (a-C:Ag)) on the mechanical properties, in terms of high-cycle fatigue, are identified. Wöhler curves are determined and the staircase procedure ascertains the fatigue strengths. The fatigue strengths increase compared to the as-built condition by 105.4% (SR), 44.2% (TiN), 31.1% (TiCN), and 2.6% (a-C:Ag). Fracture surfaces are analyzed by scanning electron microscopy and show LPBF characteristic defects such as pores. The surfaces are partially divided into forced and fatigue fracture, the latter characterized by fatigue striations. Overall, PVD coatings, and especially SR, lead to an improved high-cycle fatigue behavior.

1. Introduction

Additive manufacturing (AM) encompasses various near-net-shape manufacturing techniques, including binder jetting, direct energy deposition, and laser powder bed fusion (LPBF). In these techniques, complex geometries and structures are formed layer by layer [1]. Thereof, LPBF is the most established method for AM of metals [2,3,4]. With it, it is possible to fabricate cost-effective and economic near-net-shape parts that are normally quite challenging to fabricate via conventional methods [5,6]. Accordingly, this technique has many applications in different sectors, such as aerospace, automobile, and biomedical. In the latter, LPBF has especially great potential in arthroplasty to produce patient-specific prostheses, such as hip or knee implants [7,8]. These load-bearing implants use various metallic materials, such as stainless steel alloys, cobalt-chromium alloys, or titanium alloys [9,10,11]. Compared to other biomaterials, titanium and its alloys have excellent mechanical properties—high specific strength, favorable lower elastic modulus, and excellent biocompatibility [12,13,14,15,16]. Despite the variety of used alloys, there is still room for enhancement. For instance, replacing alloying elements can further enhance biocompatibility [17,18,19]. Comparing Ti-6Al-4V vs. Ti-6Al-7Nb, in the former alloy, replacing the cytotoxic vanadium with niobium further enhances the local biocompatibility, increases corrosion resistance, and at the same time, preserves the mechanical properties, such as tensile strength [20,21,22]. This makes the Ti-6Al-7Nb alloy the optimal candidate as a biomaterial. However, like other additively manufactured alloys, achieving optimal mechanical properties of Ti-6Al-7Nb requires further optimization. Various research focused on the mechanical performance of additively manufactured alloys, such as steels (316L, 17-4 PH) or titanium alloys (Ti-6Al-4V, Ti-6Al-7Nb, Ti-24Nb-4Zr-8Sn) [23,24,25,26,27]. Some of those studies focus on fatigue properties in terms of low-cycle fatigue (LCF) and high-cycle fatigue (HCF), as well as crack growth analysis of additively manufactured specimens of steels [28,29,30,31,32,33] and titanium alloys [34,35,36,37,38,39,40], with no further processing steps. One of these processing steps is applying functional physical vapor deposition (PVD) thin coatings. This technique is very beneficial since it improves strength, wear, tribological properties, corrosion resistance, and biocompatibility [41,42,43,44]. Different layer types are appropriate for biomedical applications, including nitride-based coatings, such as titanium nitride (TiN) or titanium carbonitride (TiCN), and amorphous carbon (a-C) [45,46]. In the latter, antibacterial activity and cell proliferation can be tailored by adding silver particles and adjusting the chemical composition of the silver-containing amorphous carbon coating (a-C:Ag) [44]. Although these improve wear properties, PVD coatings may reduce fatigue life by creating crack-initiating sites. Subsequently, instead of three stages for failure to occur, just two are required: propagation and saturation [47]. However, PVD coatings may also introduce compressive residual stresses. These compressive stresses enhance fatigue performance and they, therefore, can potentially increase fatigue life [48]. Therefore, PVD coatings were successfully applied on different base materials to increase the fatigue performance. For example, Puchi-Cabrera et al. deposited a-C (diamond-like carbon; DLC) and TiN on 1.4404 stainless steel. Compared to base steel, these coatings increased both fatigue life and limit. This increase was due to compressive residual stresses and good adhesion to the substrate, which delayed crack initiation [49,50]. Fatigue properties were also improved in other base steel alloys. For example, Jácome et al. deposited TiCN, boron carbonitride (BCN), and chromium aluminum nitride (CrAlN) on 1.1191 steel [51]. As stated before, deposition does not necessarily improve fatigue life at all times, depending on the layer chemical composition, substrate, layer thickness, and fatigue stress amplitude (low vs. high). In some cases, fatigue properties deteriorate. For example, Ferreira et al. deposited tungsten (W), tungsten nitride (WN), tungsten titanium (WTi), and tungsten titanium nitride (WTiN) on 1.7225 steel to enhance mechanical properties. In these trials, while only the WTi coating increased fatigue life at low amplitudes, all coatings decreased fatigue life at high amplitudes [52]. Therefore, it can be deduced that the interaction between the deposited layer and the substrate could affect the resulting properties. Consequently, to study the influence of substrate material on fatigue properties, Baragetti et al. deposited chromium nitride (CrN) on 1.4462 duplex stainless steel, 1.2343 tool steel, and EN AW-6082 aluminum alloy. In this work, while CrN increased the fatigue limit of the coated steel specimens, no enhancement in the coated aluminum specimens was detectable [48]. This increase in the former can be attributed to the increase in the critical crack length resulting from the coating adhering well to the substrate [53]. This does not necessarily mean that other types of layers could adhere well to steel. Another coating seems to affect its fatigue life negatively. DLC coating, for example, decreases the fatigue properties. The use of these coatings could, nonetheless, improve other properties, such as corrosion resistance and corrosion fatigue [54]. Therefore, optimizing a certain alloy requires careful selection and finetuning of the deposited layer. The encouraging results and versatility of PVD coatings led it being employed for other alloys. For example, it can improve titanium alloys’ performance and properties. Compared to the base materials, Gopkalo et al. showed that coatings with TiN, chromium (Cr), (Cr+TiN), (TiC)N, (TiAl)N on Ti-6Al-4V, Ti-10V-2Fe-3Al, Ti-5Al-2.5Sn, and 1.4541 steel alloy could increase fatigue life [55]. Nonetheless, depending on the titanium alloys, other coatings can, however, have adverse effects. For example, Costa et al. showed that TiN, CrN, and DLC coatings deposited on a Ti-6Al-4V substrate could decrease fatigue performance [56,57]. This seems to be consistent with Bai et al. [58]. They showed TiN or CrAlN decreases the fatigue limit of Ti-6Al-4V by approximately 38%. In all these tests, the integrity of the deposited layer is essential to enhance fatigue properties. The resulting defects in the coating can act as crack-initiation locations.
Despite all the benefits and versatility of PVD to biomedical applications, there is a lack of research on the effects of PVD coatings on additively manufactured materials. Accordingly, this research aims to bridge this knowledge gap, particularly for the biomedical Ti-6Al-7Nb titanium alloy. In this research, the effects of various deposited PVD coatings—TiN, TiCN, and a-C:Ag—on the mechanical behavior in terms of HCF are investigated.

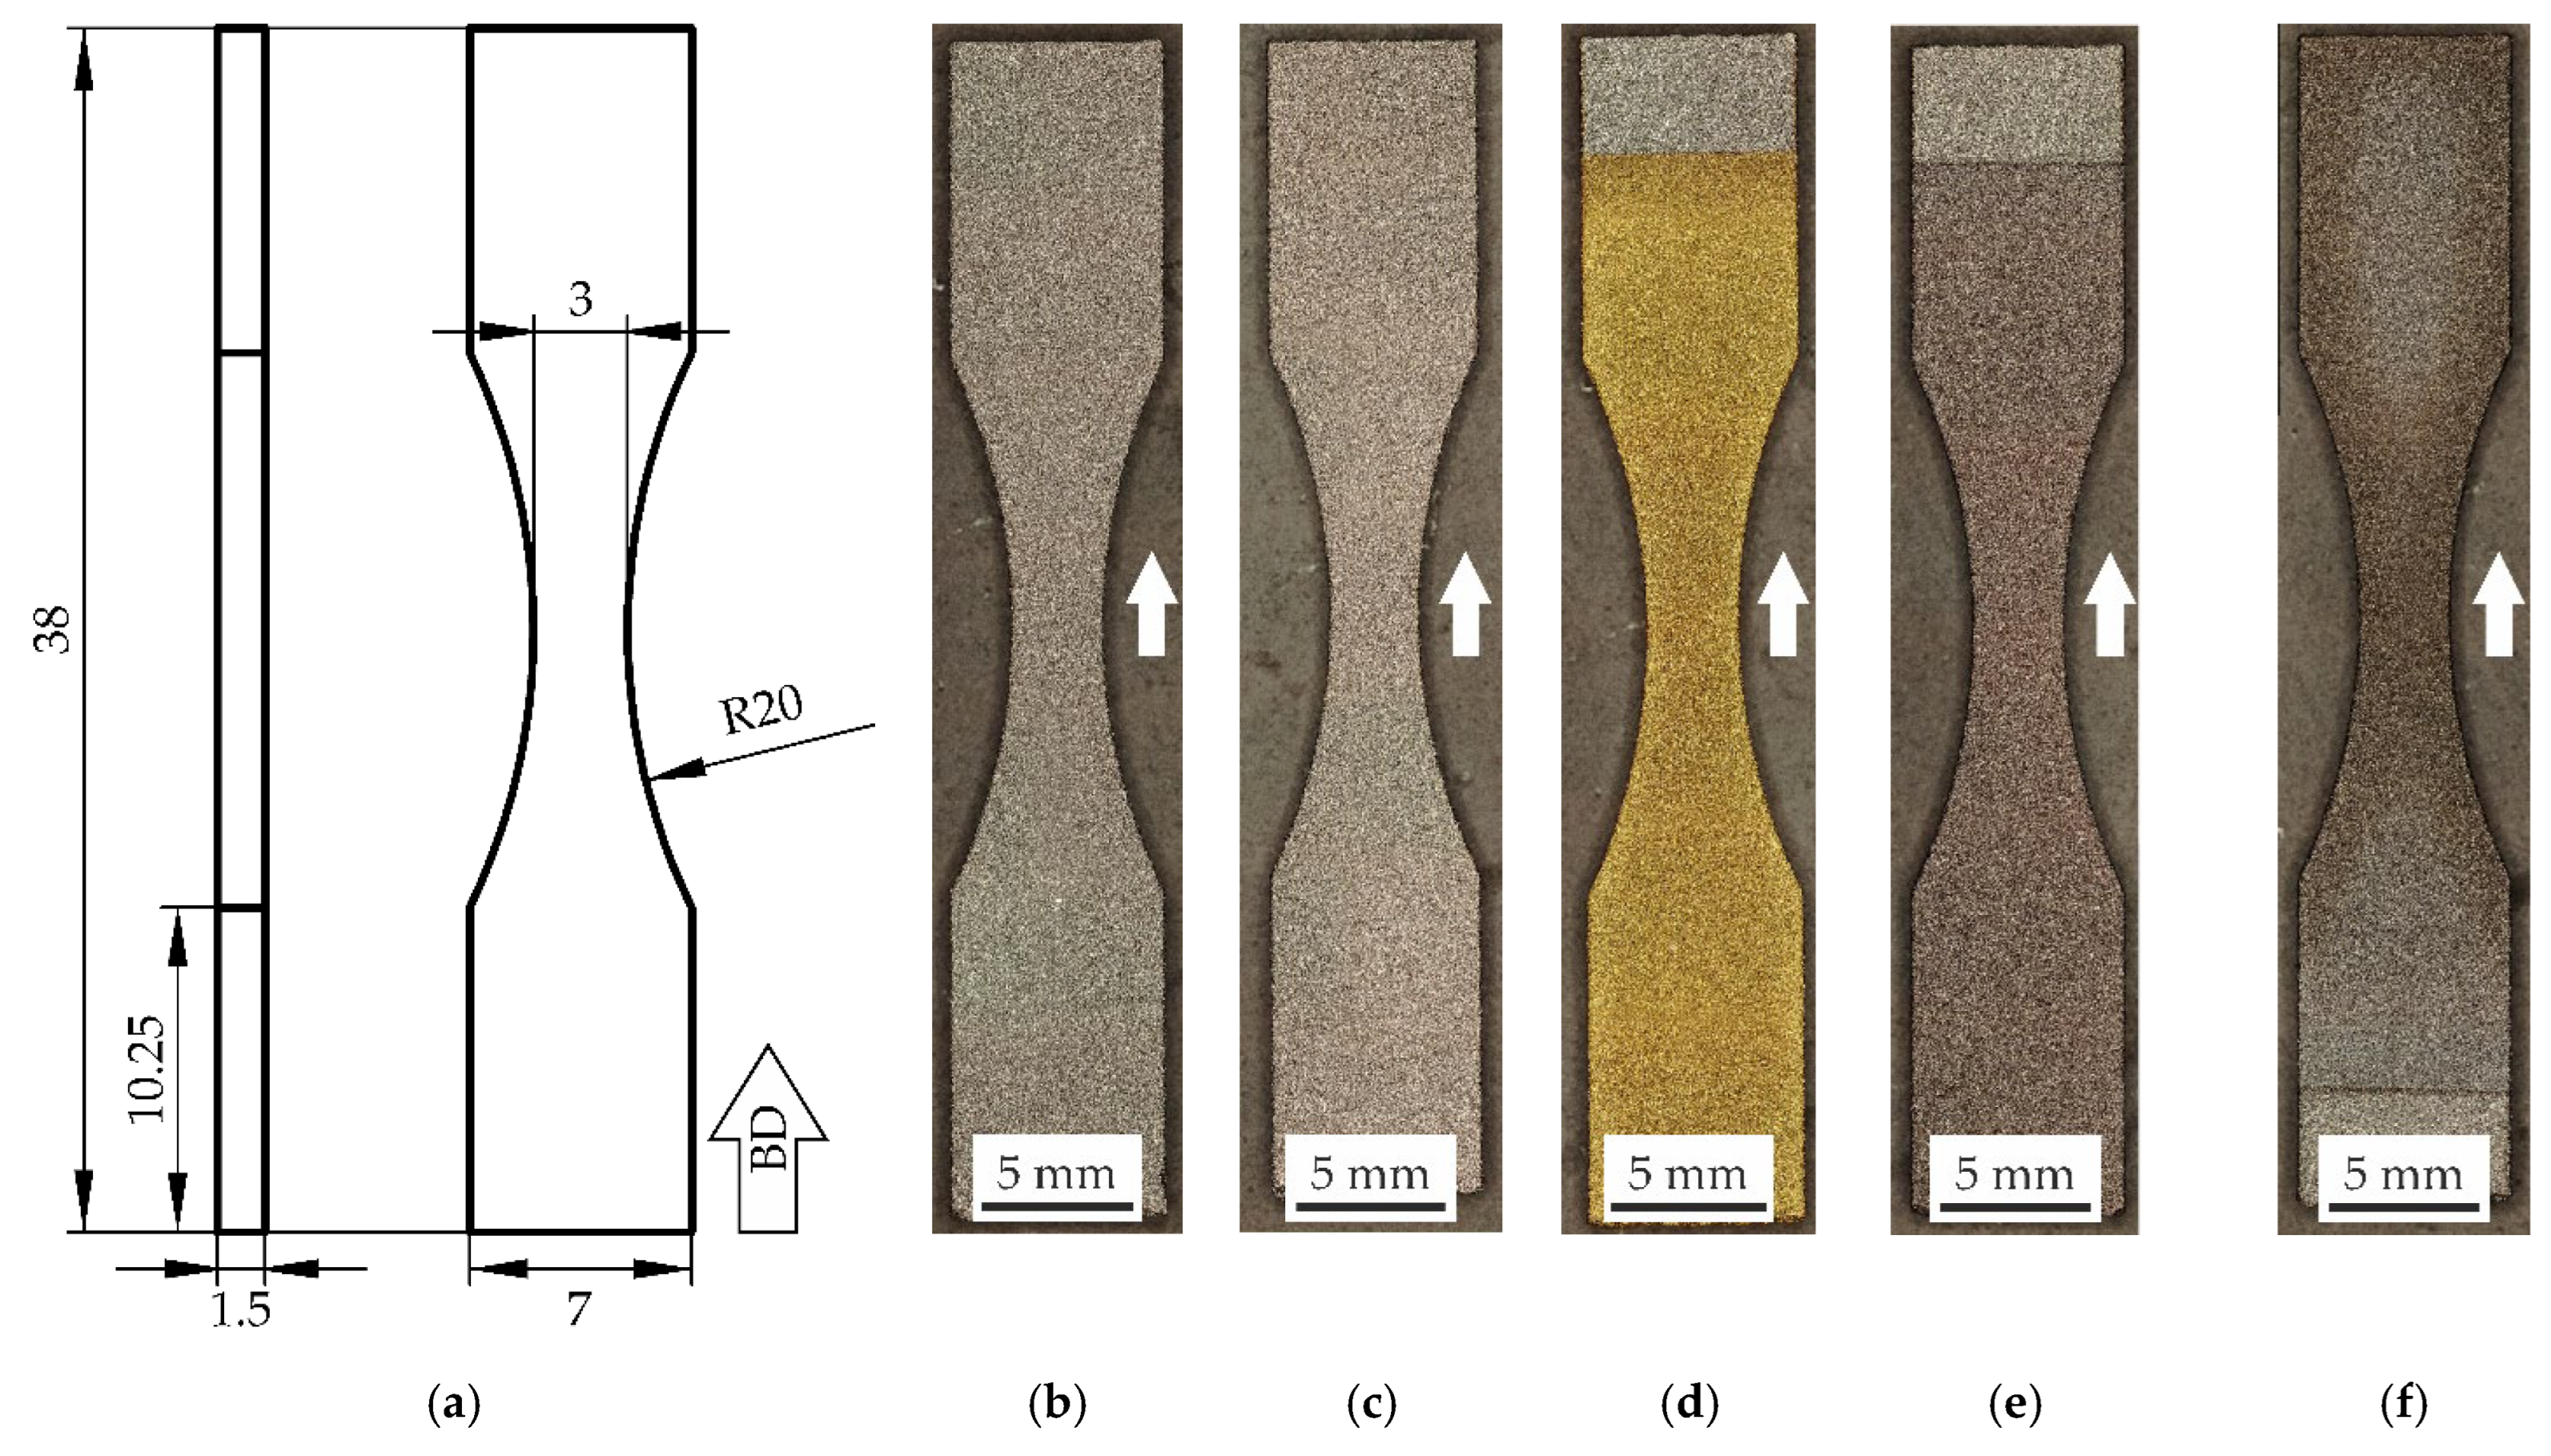
2. Materials and Methods

Gas-atomized pre-alloyed powder of (α + β)-phase Ti-6Al-7Nb was used to study the effects of PVD on the fatigue performance of samples manufactured using LPBF. ECKART TLS GmbH (ECKART TLS GmbH, Bitterfeld, Germany) provided this powder. A previous publication studied and reported its morphology and chemical composition [25]. Before fabricating the samples, different steps were employed. First, a pre-processing drying step was used to reduce residual humidity. The resulting powder relative humidity was below 5%. Following this step, Materialise Magics software (V 21.1, Materialise GmbH, Munich, Germany) was utilized for data and building job preparations. These build jobs were performed in LT12 SLM machine (DMG MORI AG, Bielefeld, Germany). It is equipped with a 1067 nm Nd:YAG laser source with power up to 400 W and a 35 µm spot diameter. This machine uses an inert argon atmosphere with an oxygen content between 0.08 and 0.13% to prevent undesired oxidation and contamination of the melt pool. Depending on the region, contour, or hatch, two constant parameter sets were used to obtain the fatigue samples’ high relative densities, see Table 1. The hatch was exposed with 5 mm stripes, rotated layer by layer by 67°. During this process, the building platform temperature was kept at 200 °C.
The dimensions and geometry of the fatigue specimens were fabricated according to Niendorf [59], see Figure 1a. Simulation showed that stress distribution in the notch root is homogenous and without any significant stress gradients. The specimens, therefore, can be considered notch free and are applied for HCF tests [59]. As described by Hein et al., shot peening with Al2O3 may be beneficial in terms of antibacterial effects and low-cycle fatigue performance [60]. Therefore, all specimens were blasted with high-grade Al2O3. For that, an SMG 25 DUO (MHG Strahlanlagen GmbH, Düsseldorf, Germany) machine was used. The utilized Al2O3 particle sizes ranged from 70 to 250 µm. These particles were blasted on the surface with an air pressure of 4 bar. The as-built specimen is depicted in Figure 1b. Additionally, stress-relief heat treatment (SR) was employed. SR was implemented under vacuum at 600 °C for 4 h to reduce residual stresses, characteristic of the LPBF process, and decomposition of α′ to α phase [61,62]. The SR specimen is shown in Figure 1c. This treatment is implemented for one condition to determine the effect of SR on the HCF behavior as it is beneficial for quasi-static and low-cycle fatigue performance [60].
The PVD coatings were deposited on the substrate via magnetron sputtering using a CC800/9 Custom (CemeCon AG, Würselen, Germany). The TiN and TiCN coatings were deposited with Ti targets and bipolarly pulsed with a cathode power of 4 kW at a mid-frequency of 50 kHz. For TiN, an interlayer of Ti was applied by sputtering Ti targets in a reactive-free atmosphere, following the introduction of reactive N2 to the deposition chamber. The TiCN coating was deposited with a bilayered Ti/TiN interlayer. The surface layer of TiCN was sputtered in a reactive atmosphere by keeping the N2 flow constant and injecting acetylene (C2H2) into the chamber. During the deposition of the TiN and TiCN coatings, the bias voltage was set to −70 V, the base pressure was 5 mPa, and the working pressure was Ar controlled and kept constant at 450 mPa. The chamber was heated with a heating power of 5 kW, which equals about 400 °C. The a-C:Ag coating was deposited with a chemically graded titanium carbide (TiXCY) interlayer, deposited by simultaneously sputtering Ti and graphite targets. A detailed explanation of the deposition process is provided in [63]. The a-C:Ag coating was deposited with two graphite targets with Ag pellets, bipolarly pulsed at a mid-frequency of 20 kHz, with an average cathode power of 2 kW and a bias voltage of −100 V. The base pressure was 5 mPa and the working pressure was Ar controlled and set to 300 mPa. The chamber was not actively heated during the deposition of a-C:Ag, but the chamber temperature was about 120 °C due to the plasma. A detailed description of the a-C:Ag deposition process is given in [44]. Tillmann et al. summarized the properties of the three deposited coatings [43]. The different conditions are depicted in Figure 1—as built (Figure 1b), stress relieved (Figure 1c), TiN (Figure 1d), TiCN (Figure 1e), and a 7.5 at.% silver-containing a-C coating (a-C:Ag, Figure 1f).
The surface roughness of the specimens was measured using the tactile profile method. In it, the diamond tip is equipped with a profilometer Hommel Etamic T8000 (Jenoptic AG, Jena, Germany). According to DIN EN ISO 4288, five roughness measurements were performed per specimen [64]. Ten specimens per condition were evaluated to determine the average roughness depth, Rz, and the arithmetical mean roughness, Ra.
Regarding the HCF, two kinds of testing could be used: stress-controlled loading and strain-controlled fatigue testing. As healthy bones usually respond to different types of loading by elastic stress and strain [65], stress-controlled testing is a good way to test prostheses. Accordingly, ambient temperature HCF tests were performed with sinusoidal loading on a high-frequency testing machine ElectroForce3550 (Bose Corporation ElectroForce Systems Group, Eden Prairie, MN, USA) according to DIN 50100 [66]. The stress-controlled testing was conducted using a 25 kN load cell 647.02B (MTS Systems Corporation, Eden Prairie, MN, USA). The test was controlled via winTest Analysis software (Version 4.1, The Testometric Company Ltd.; Rochdale, UK). These performed stress-controlled fatigue tests had a stress ratio of R = −1 (completely reversed cycling) and a test frequency of 100 Hz using hydraulic wedge grips. The specimens were axially loaded parallel to the build direction (BD) with a sinusoidal loading. In these tests, a maximum number of cycles NG was set at 107 cycles. The fatigue behavior was determined based on the Wöhler curve by testing different stress amplitudes between finite life and long-life strength range. To describe the finite life strength range, the following equation is used:
N =   C · ( σ a ) k
where k is the Wöhler line slope and C is the location parameter, which is the theoretical tolerable number of cycles at a stress amplitude of σa = 1 MPa. The curve was determined by decreasing the stress amplitude step by step. For each stress state, three specimens were tested. Using a statistical approach, the probability of survival, PS, or the probability of failure, PF, was ascertained. A scatter band can be obtained by performing several tests at the same stress amplitude. This scatter band is an extension of the Wöhler curve with the failure probability of 10% (PF10%), 50% (PF50%), and 90% (PF90%). The Wöhler curve transforms into a horizontal line, which describes the long-life fatigue strength, σF. The fatigue strength was determined by the staircase test procedure (SC). The SC, according to Hück, is a fast and robust method to determine the average endurance limit/fatigue strength [67].
Fracture surfaces and surface analyses allow conclusions to be drawn about the failure of specimens. Features are detectable, which can provide information about the failure causes. The fracture surfaces of the HCF specimens were investigated using a scanning electron microscope (SEM) Zeiss Ultra Plus (Carl Zeiss AG, Oberkochen, Germany). The SEM images were created by the use of secondary electrons (SE) and an in-lens detector. The fracture surfaces were classified into forced and fatigue fractures. The interface between the PVD coatings and the substrate was also inspected to obtain information on delamination or crack origins in or near the coatings.

3. Results and Discussion

3.1. Roughness

As described by Nakatani et al., the surface roughness significantly affects the fatigue performance in terms of fatigue strength [68], particularly HCF behavior. The surface roughness was measured to study the effect of PVD coatings on the roughness and determine the influence of the roughness on the overall fatigue performance. While in the as-built condition, the mean roughness depth, Rz, is 33.12 ± 3.76 µm, and the arithmetic average roughness, Ra, is 4.64 ± 0.45 µm; for the SR condition, Rz is 30.77 ± 0.87 µm, and Ra is of 4.52 ± 0.24 µm. For the nitride-based PVD coatings, Rz is 33.74 ± 1.98 µm, and Ra is 4.80 ± 0.23 µm for TiN, and 32.11 ± 1.78 µm as well as 4.63 ± 0.22 µm for TiCN, respectively. The a-C:Ag PVD coating possesses an Rz of 32.73 ± 2.70 µm and an Ra of 4.65 ± 0.35 µm. The results indicate that PVD coatings have little to no effect on the Ra and Rz values. As a near-net-shape coating procedure, the PVD coating does not alter the surface roughness; therefore, the fatigue properties in terms of roughness variations will not change [69]. Nonetheless, the SR heat treatment slightly reduces the roughness and may enhance the fatigue performance [68,70,71]. In general, the roughness is comparable to former research and may be beneficial and preferred for biomedical applications in terms of cell growth [60]. As the roughness values of all conditions are in a certain range (Rz = 30.77 μm–33.12 μm; Ra = 4.52 μm–4.80 μm), it can be assumed that the different roughness values do not cause the significant differences in fatigue behavior.

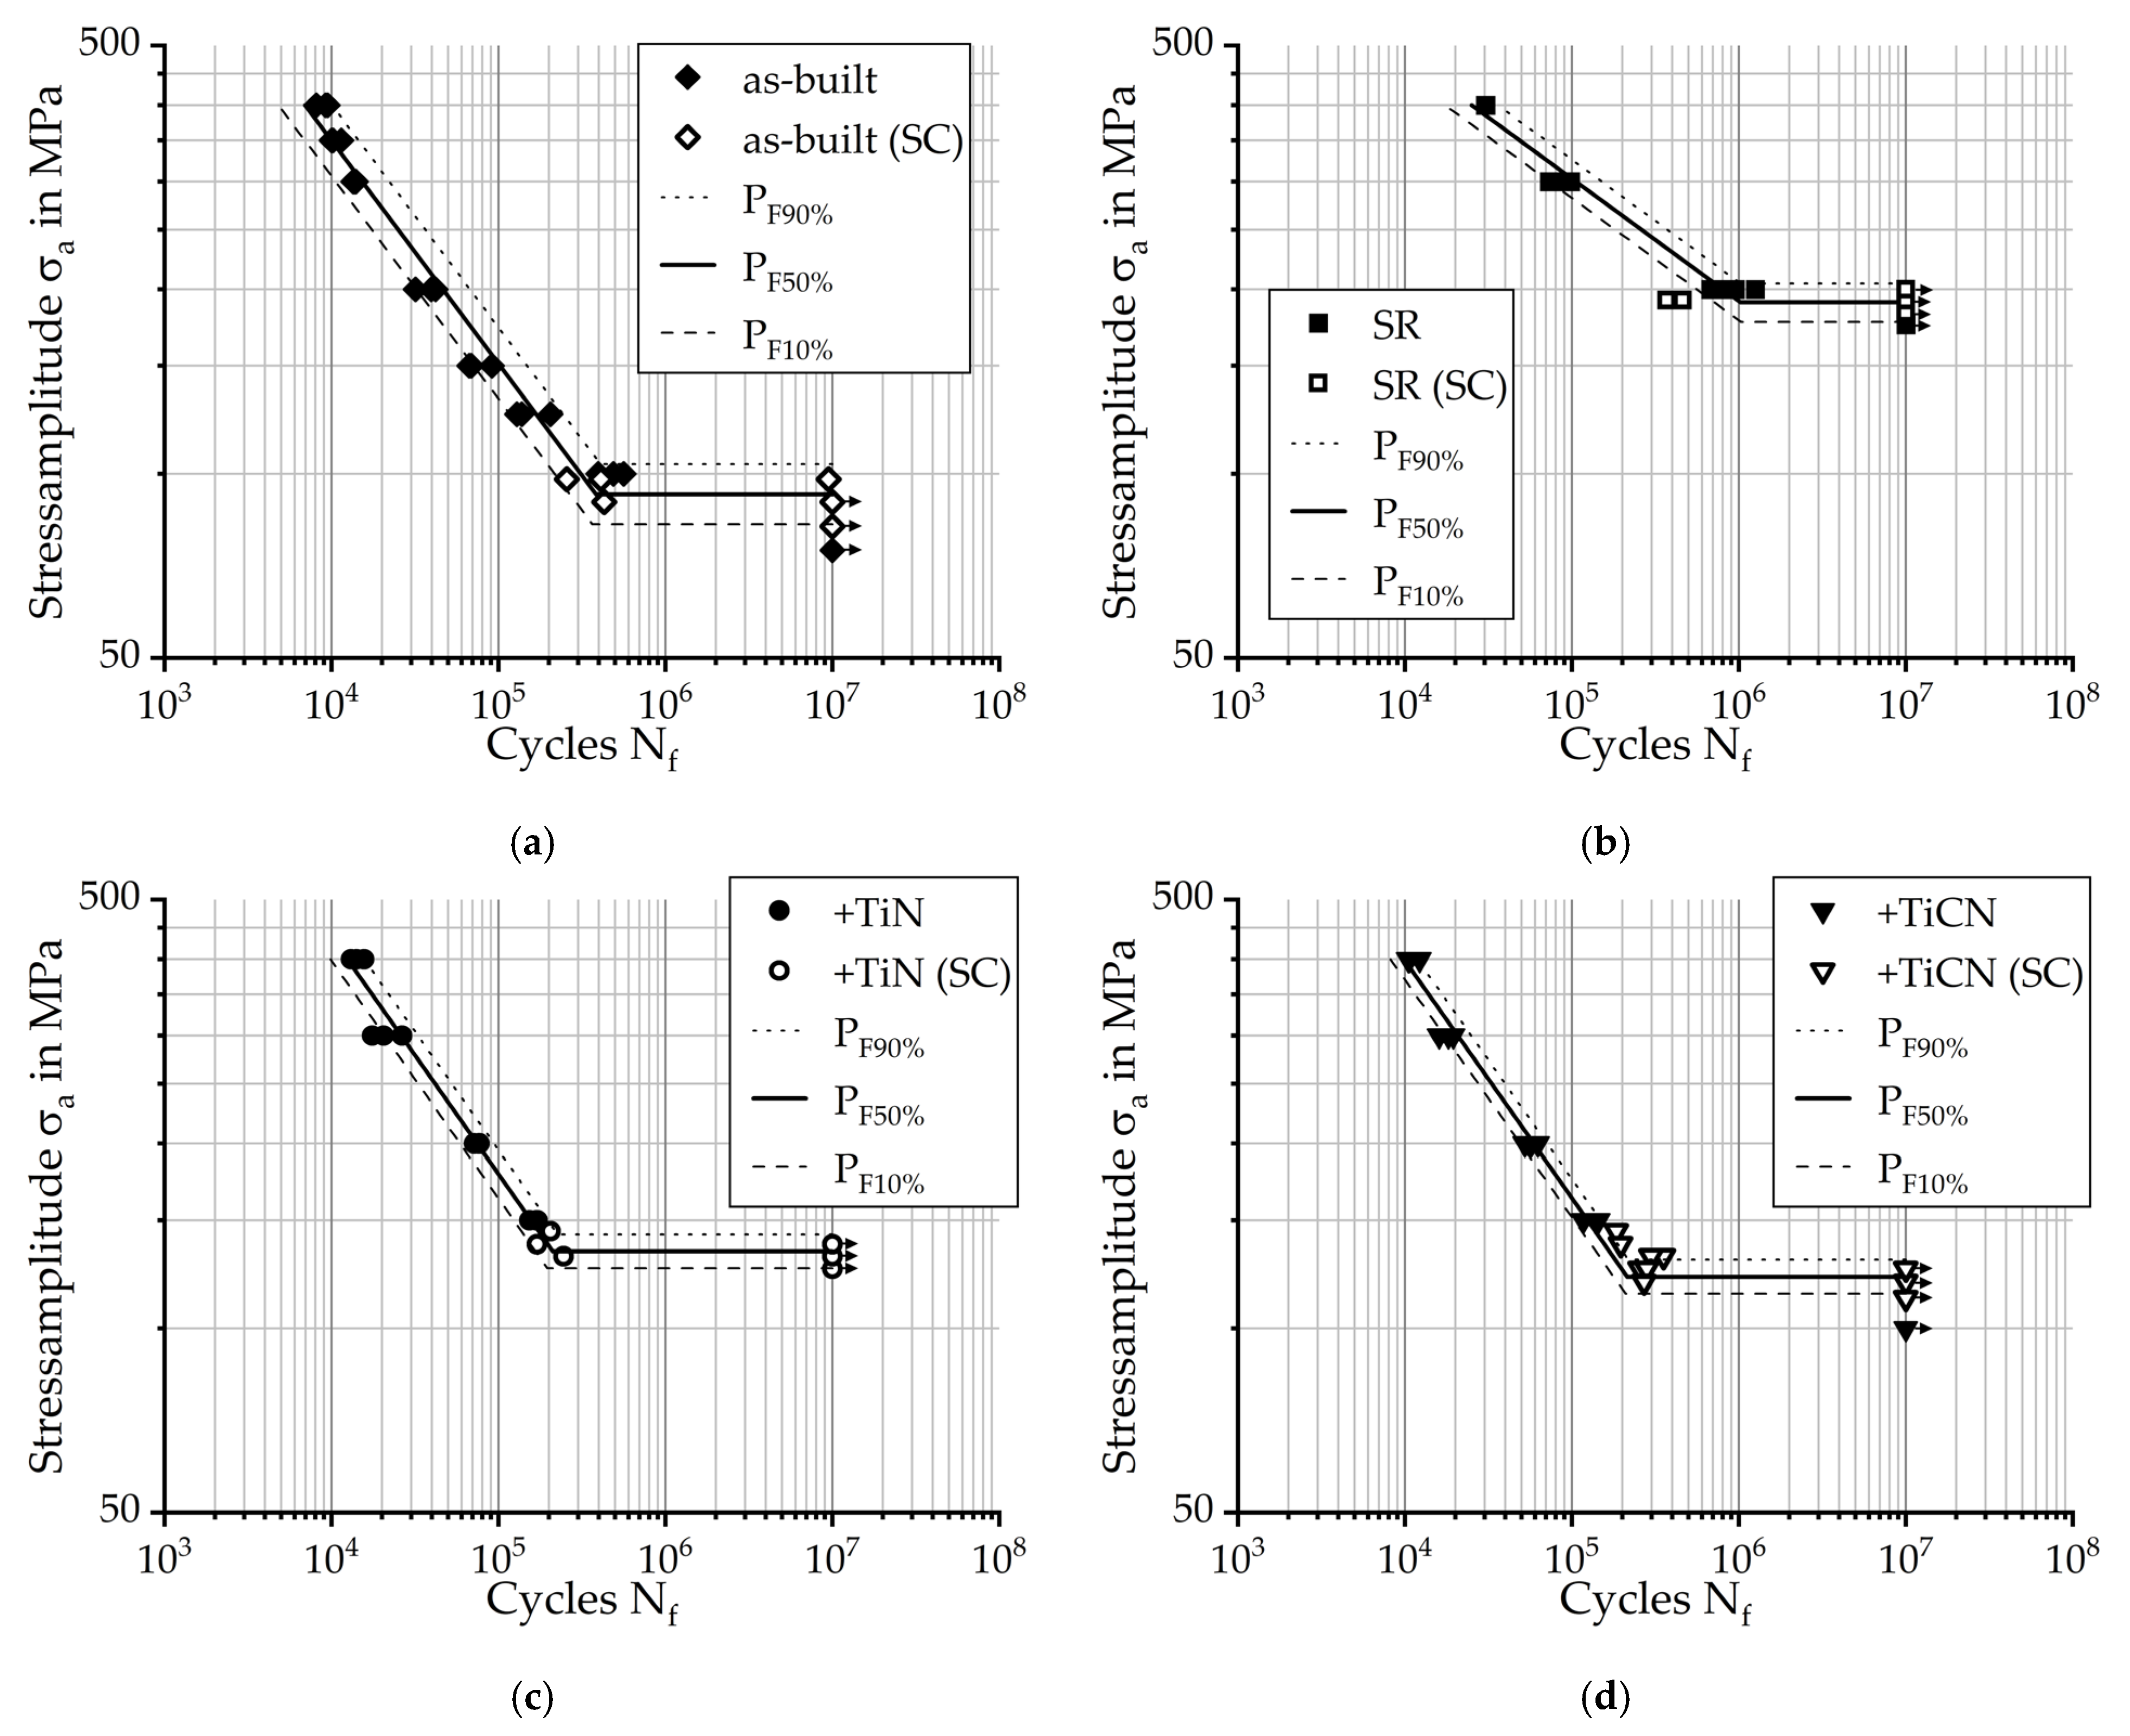
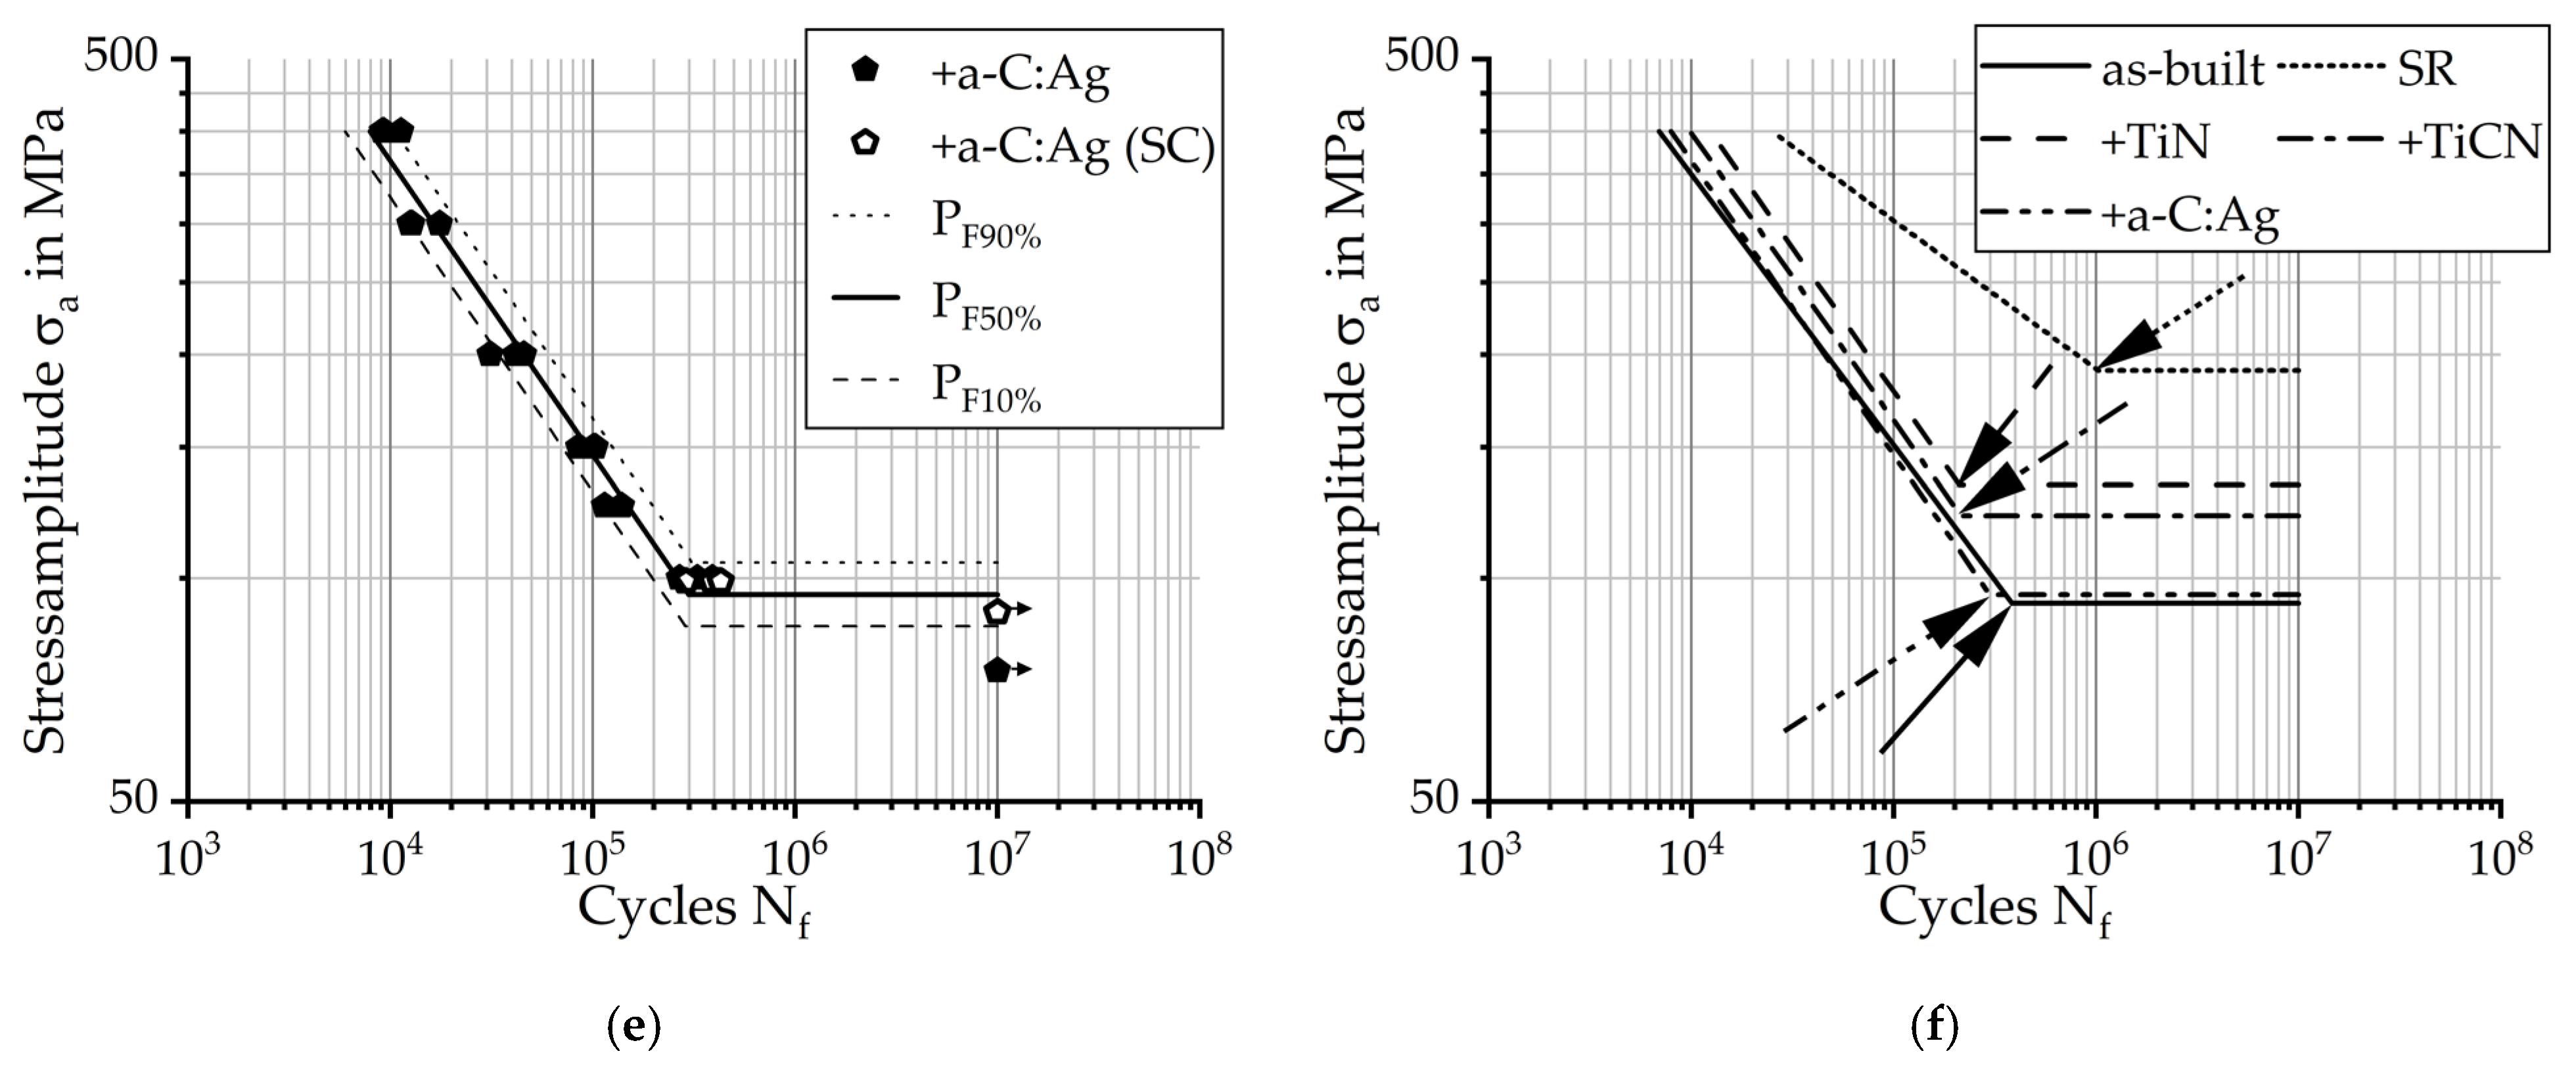
3.2. High-Cycle Fatigue

To obtain information on the effect of the different conditions and coatings on the fatigue behavior, in terms of fatigue strength and long-term fatigue strength, HCF tests were performed for several cycles from 104 to 107. The HCF test results are tabulated in Table 2.
The HCF test results are summarized in Figure 2. Figure 2 shows double-logarithmic stress-life plots (stress amplitude over cycles to failure). The test points for the Wöhler curves (solid points) and the staircase test procedure (SC, open points) are illustrated. Specimens that withstand the loading over 107 cycles are classified as run outs. Run outs are indicated by black, horizontal arrows. In addition, failure bands described by the failure probability curves PF10%, PF50%, and PF90% are plotted. The diagrams present the different conditions (Figure 2 (a) as built, (b) SR, (c) TiN, (d) TiCN, and (e) a-C:Ag) as well as the overview of the PF50% curves for all conditions (Figure 2f). The curves of the as-built and a-C:Ag-coated conditions are similar in terms of the fatigue strength, indicated by the horizontal solid and dash-dot-dot lines in Figure 2f. TiCN (dash-dot horizontal line) and, in particular, TiN (dashed horizontal line) coatings improve the fatigue performance, resulting in higher fatigue strength, compared to the uncoated, as-built condition (solid horizontal line), demonstrated in Figure 2f. SR heat treatment significantly improves the fatigue strength (dotted horizontal line) compared to all other conditions, see Figure 2f. The Wöhler line slope k describes the slope in the fatigue strength range. The slopes are similar for the as-built and the coated specimens; they range between 2.5 and 2.7 and only the fatigue strength is higher for the coated samples. For the SR condition (Figure 2b), the slope is at 5. Therefore, the curve is less steep and the fatigue strength is significantly higher than all other conditions.
The fatigue strength σF of the as-built condition (Figure 2a) is similar to the a-C:Ag condition (Figure 2e) with 92.6 MPa and 95.0 MPa, respectively. The fatigue strength σF of the TiCN-coated state (Figure 2d) is 121.4 MPa and above the as-built and a-C:Ag-coated conditions. The TiN-coated condition (Figure 2c) has the highest fatigue strength σF of 133.5 MPa. For the SR condition, the fatigue strength σF is 190.2 MPa and more than two-times higher than for the initial, as-built condition. SR treatment results in a 42% increase in fatigue strength compared to the highest fatigue strength of the PVD-coated samples. The cycles at the knee point of the 50% failure probability curve are slightly lower for the a-C:Ag coating (298,870 cycles) compared to the as-built condition (385,153 cycles), see solid and dash-dot-dot arrows in Figure 2f, respectively. Although the TiN-coated condition has the highest fatigue strength among the coatings, the knee point cycles are lower (210,470 cycles), see dashed arrow in Figure 2f. The knee point of the TiCN-coated condition is at 214,018 cycles, see dash-dot arrow in Figure 2f. For the SR condition, the cycles at the knee point are at 1,025,238 cycles (see dotted arrow in Figure 2f) and the k value is about two-times higher than for all conditions. The higher the Wöhler line slope, in general, the better the fatigue strength characteristics. The results of the fatigue tests are summarized in Table 3.

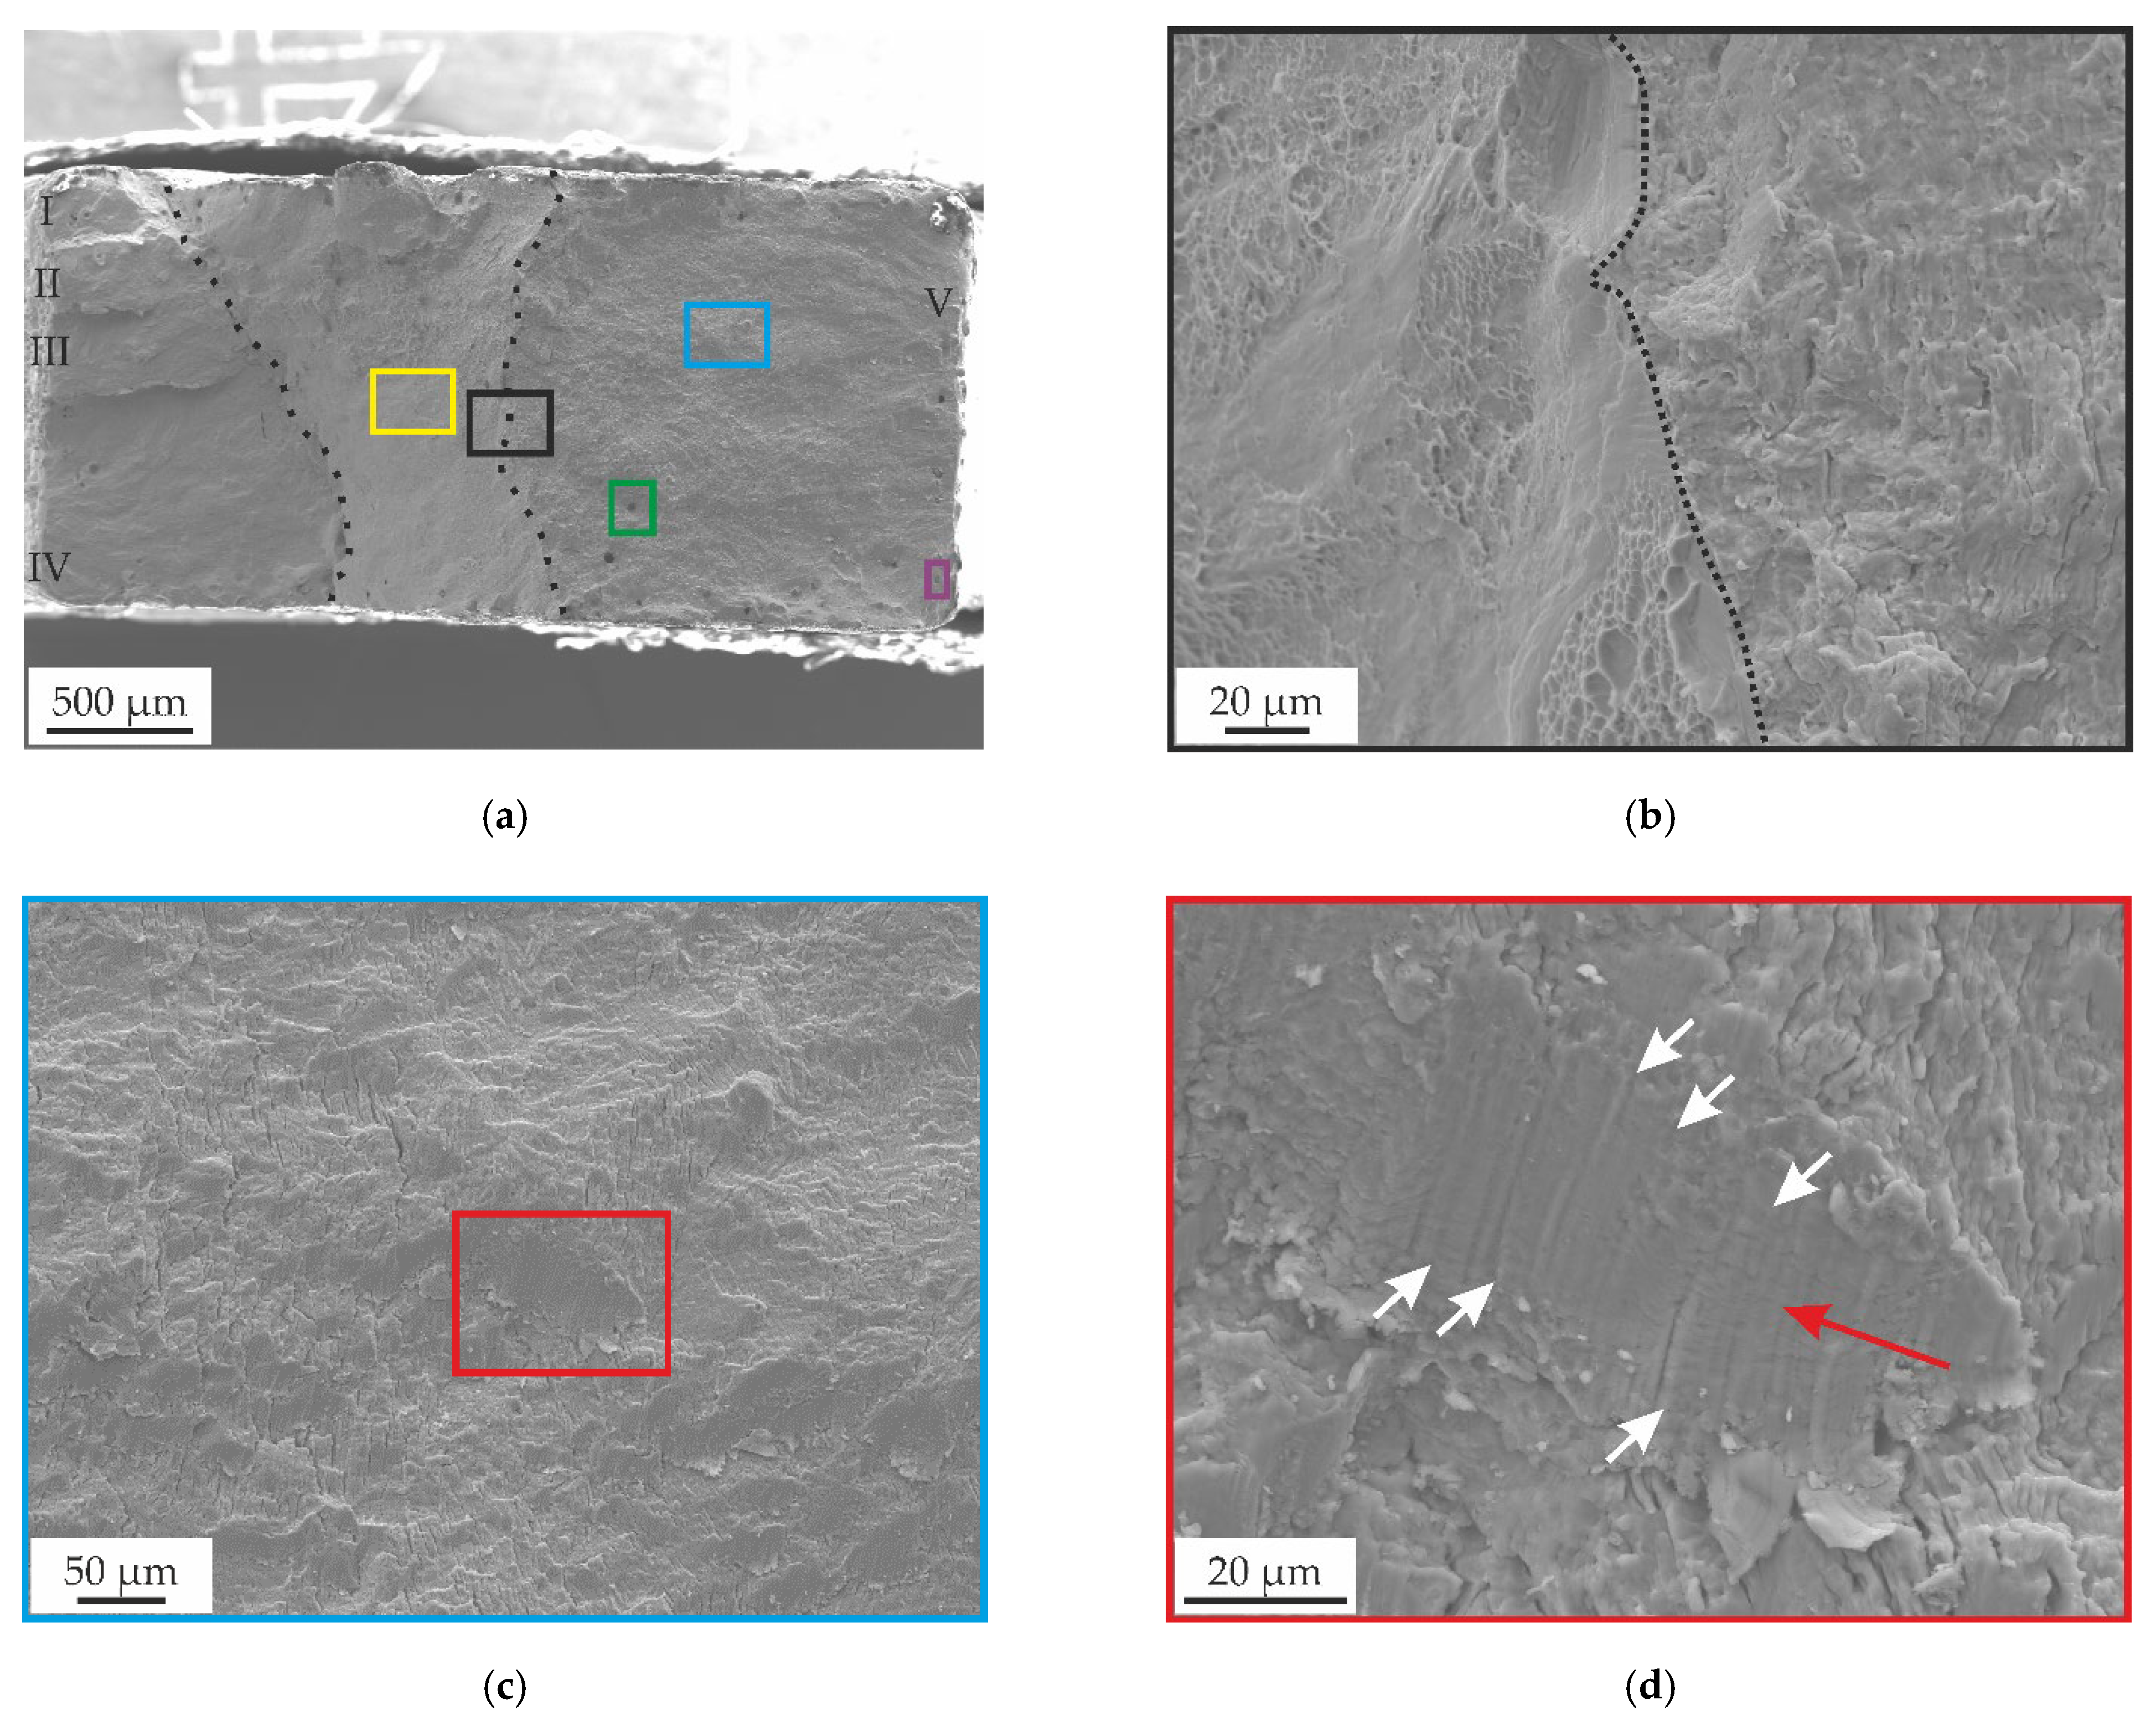
3.3. Fracture Analysis

The fracture analysis is performed for the different conditions after fatigue testing. The analysis is used to determine the failure causes and mechanisms. Concerning the various coatings, the characteristics of the coatings and the crack initiation points are of special interest. Fatigue fracture surfaces often have typical observable characteristics, such as crack origins and fatigue striations. The fatigue fracture surface of an as-built specimen is shown in Figure 3a. The fracture surface is divisible into three areas, separated by dotted lines in Figure 3a. The area between both lines depicts the final, forced fracture area. The fatigue crack seems to be nucleated on both sides of the final fracture. The Roman numerals (I–V) indicate multiple possible crack nucleation sites where the crack initiation likely begins. As the fatigue test progresses, the multiple cracks may grow together to form one critical crack. The divided fracture surface—fatigue fracture (right) and a residual forced fracture (left)—is depicted in Figure 3b. Typically, the higher the stress amplitude, the larger the forced fracture area. The fatigue fracture surface is shown in Figure 3c. Fatigue striations are observable on the fatigue fracture surface (right side in Figure 3b,d, white arrows) and are perpendicular to the crack propagation direction (indicated with a red arrow). Distinct fatigue striations are observable for all conditions and stress amplitudes. The residual fracture surface typically shows areas with forced transgranular facets associated with brittle fracture mechanisms and ductile fracture with dimples (Figure 3e, black arrows). Defects, characteristic of the LPBF process, are often perpendicular to the build direction and pulled apart by loading. Typical defects are, for example, pores and unmelted powder particles, which are depicted in Figure 3f,g, respectively. These defects are detrimental when it comes to fatigue performance of additively manufactured specimens, as they are probable fatigue crack initiation points [40,72,73,74].
Figure 4a shows the fracture surface of a TiN-coated specimen. The fracture surface is divided into the fatigue fracture (left side) and the forced fracture area surrounded by the dashed line. Crack nucleation sites are probably on the left side of the fracture surface, marked with red circles in Figure 4a. The crack can originate at different spots and propagate to a single fatigue crack. The crack propagation direction is marked with a red arrow in Figure 4a,b. Figure 4b shows the magnified area within the black rectangle in Figure 4a. Fatigue striations are visible, which are perpendicular to the crack propagation direction, see white arrows in Figure 4b. Figure 4c depicts a coated powder particle on the surface of the specimens. PVD coatings are known to be near-net shaped, which reproduce the underlying surface topography and roughness [69]. The particle is probably partially melted on the back side. The PVD coating of undercuts, such as the back side of the particle, is challenging [75]. As a result, the surface gets inhomogeneous from right to left (substrate on the right), probably due to a thinner coating on the undercut side of the coating direction (left to right). The TiN coating shows a smooth fracture surface, see Figure 4d,e. In Figure 4d, the TiN coating is highlighted by the dashed, yellow lines, whereby the visual appearance of the fractured coating differs from the fatigue fracture surface of the substrate on the left side. After a fracture, occasional artifacts, such as cracks through the coating, are observable, see Figure 4e. The thickness of the coating is around 3 µm, but the Ti interlayer described by Tillmann et al. is not observable [43]. Figure 4f shows the morphology of the TiN coating, which consists of angular and edgy, pyramid-like structures [76].
Figure 5 shows the SEM images of the TiCN coating, including fracture surfaces. Figure 5a shows that the fracture surface may be divided into the fatigue fracture (left side) and the forced fracture area (dashed line). The red circles indicate the probable crack nucleation sites (Figure 5a). The crack may originate from different spots, typically from defects, such as pores or cracks, and propagate to a single fatigue crack. A red arrow marks the possible crack propagation direction in Figure 5a,b. Figure 5b shows the magnified area within a black rectangle in Figure 5a. In Figure 5b (white arrows), several fatigue striations are visible, which are usually perpendicular to the crack propagation direction. The fracture surface of the Ti-6Al-7Nb, subsequently coated with TiCN, shows, similar to the other conditions, characteristic fatigue fracture features, such as fatigue striations, see white arrows in Figure 5b,c. The TiCN coating is highlighted with black arrows in Figure 5c and dashed, yellow lines in Figure 5d. The fracture surface is in the bottom area of Figure 5d. A closeup of the TiCN coating shows the multilayer layout of the TiCN coating, consisting of the Ti interlayer (Ti-IL), the TiN interlayer (TiN-IL), and the TiCN surface layer (TiCN-SL) in Figure 5e. At this position, the coating is around 1.74 µm thick. The TiCN coating has a hemispherical structure, also described as a cauliflower-like appearance, see Figure 5f [77,78].
The fracture surface of a specimen with diamond-like carbon a-C:Ag coating, including LPBF characteristic defects, such as pores (Figure 6a, black arrows) and characteristic fatigue striations (Figure 6b, white arrows), is depicted in Figure 6. Fatigue striations (white arrows) are visible on the fracture surface, see Figure 6b–d. The areas marked with the Roman numerals (I–III) could be crack nucleation sites. The area (white circle) in Figure 6c indicates a conspicuous spot for the crack origin. Crack initiation likely begins at different points and, as the test progresses, the individual cracks grow together to form one crack. The probable crack propagation direction is marked with a red arrow in Figure 6a,b. Figure 6d shows the around 2 µm thick a-C:Ag coating, see yellow arrows. The a-C:Ag coating exhibits a cluster-like structure, commonly observed for a-C films [79]. Nano-sized particles (green arrows) are noted coating the surface, especially in the undercut region of the powder particle. As reported by previous studies, these particles are assumed to be Ag nanocrystallites dispersed on the surface of the coating [44,80,81].
Fracture surfaces were analyzed to identify crack-initiation spots and to determine whether the cracks started in the substrate or the coating. Unfortunately, the identification of crack-initiation points is quite challenging and was not successful, probably due to the specimen geometry (flat, rectangular) and size (miniature size) [70,82]. As the crack-initiation points are challenging to determine, it was impossible to distinguish whether the crack originated in the substrate or at the surface (coating). Nonetheless, where it starts is dictated by different factors. For example, if the crack originates from the substrate, then it is assumed to happen at defects close to the surface [83,84,85]. The different coatings did not flake on the specimen surfaces. Only local delamination that occurred near the fatigue crack was observable. As described by Tillmann et al., this confirms the assumption that the adhesion between substrate and coating is strong, especially for the TiN and TiCN coating [43].

4. Conclusions

This study addresses the effects of PVD coating on the mechanical properties of additively manufactured Ti-6Al-7Nb biomedical alloy. The change in fatigue strength properties is determined for specimens with different substrate conditions (as-built and SR heat-treated) and PVD-coated states (TiN, TiCN, and a-C:Ag). The results indicate PVD coatings can improve fatigue behavior and SR heat treatment results in a more significant improvement in fatigue performance. The findings can be summarized as follows:
  • The deposition of the PVD coatings improves fatigue strength. The PVD coatings improve the fatigue strength for all conditions by 44.2% (TiN), 31.1% (TiCN), and 2.6% (a-C:Ag) compared to the uncoated substrate material. SR heat treatment leads to a significant fatigue strength improvement of 105.4%.
  • The Wöhler curve knee points of the PVD-coated specimens are lower than the as-built condition and the Wöhler line slopes are similar but less steep. Therefore, the Wöhler curves of the PVD-coated specimens are shifted parallel to the as-built Wöhler curves to higher fatigue strengths. An exception is the SR-heat-treated condition, which has a higher knee point (166.2% more cycles) and two-times higher Wöhler line slope. In combination with a higher fatigue strength, this results in a significant change in position and angle of the SR Wöhler curve.
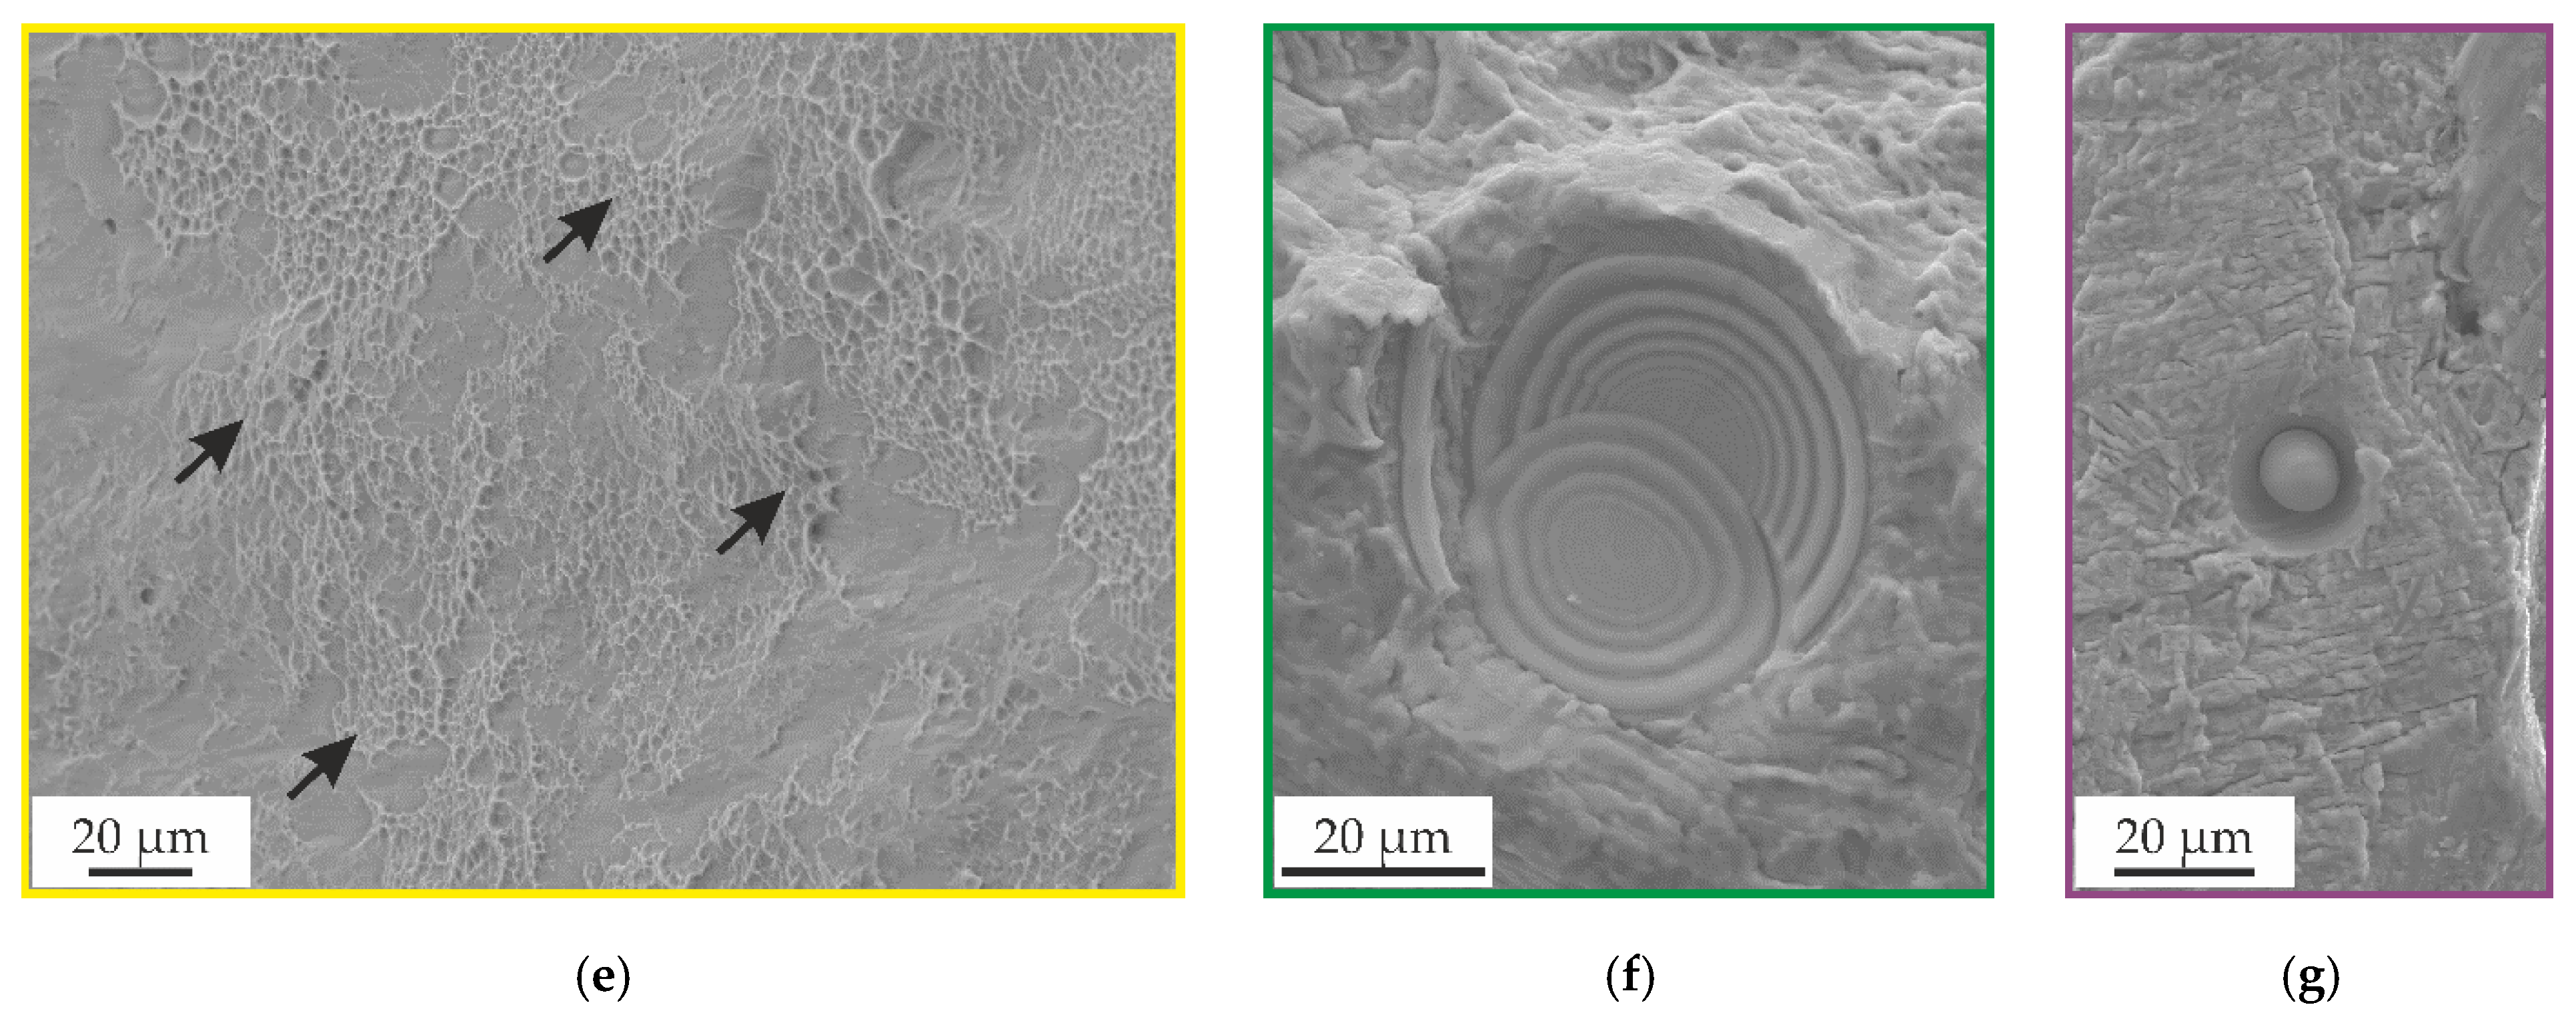
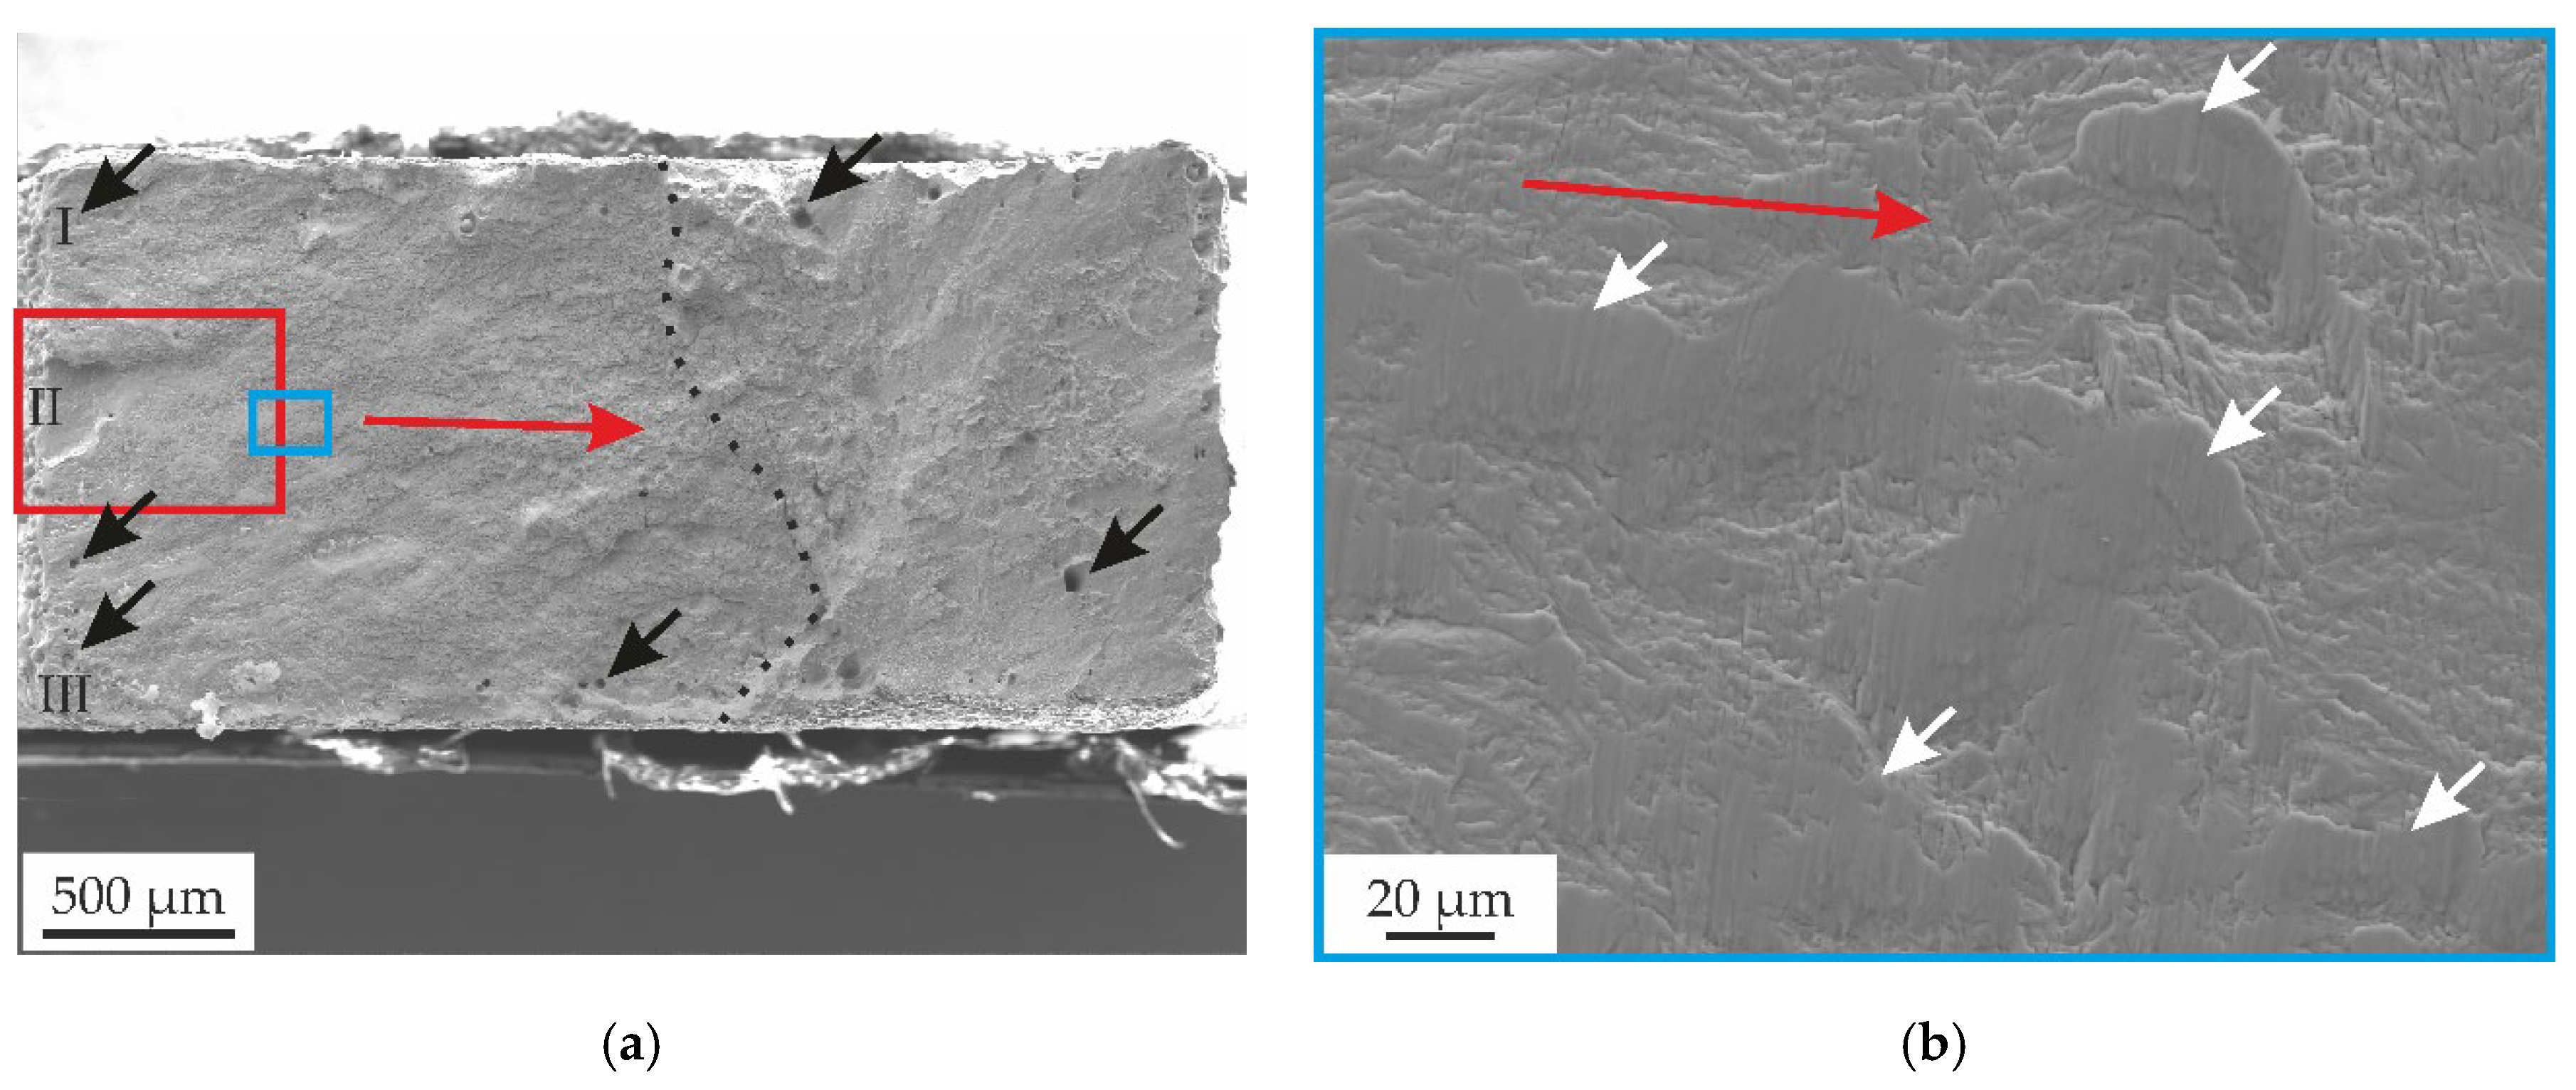
  • The fracture surfaces can be divided into fatigue fracture and forced fracture, whereby the fatigue-forced-fracture ratio depends on the applied stress amplitude. The forced fracture surfaces of the different conditions are characterized by transgranular facets. Brittle and ductile fracture features, such as dimples are present on the fracture surface.
  • The fatigue fracture surfaces are characterized by fatigue striations perpendicular to the crack propagation direction.
  • LPBF-characteristic defects (e.g., pores, unmelted powder) are visible for all conditions and have a high impact on fatigue performance. Defects often can act as crack origins but could not be identified. Delamination or flaking of the TiN, TiCN, and C:Ag coatings was not observable, assuming a high adhesion of the various coatings on the Ti-6Al-7Nb substrate.
In conclusion, this work illustrates the significant improvement in SR heat treatment and PVD coatings on the HCF performance of additively manufactured Ti-6Al-7Nb. Therefore, PVD coatings can be advantageous in the design of load-bearing implants. Further research should focus on the deposition of PVD coatings on SR specimens to combine the significant improvement in the heat treatment of the substrate with the surface improvement in the PVD coatings in terms of hardness, wear resistance, and tailoring of biocompatibility features.

Funding

This research was funded by the Deutsche Forschungsgemeinschaft (DFG), grant numbers SCHA 1484/45-1.

Data Availability Statement

The data that support the findings of this study are available from the corresponding author upon reasonable request.

Acknowledgments

The author gratefully acknowledges the German Research Foundation (DFG) for the financial support and the Institute of Materials Engineering (TU Dortmund University, Dortmund, Germany) for providing the coated samples. The research was performed with the equipment and base of the LWK and DMRC research infrastructure. The authors are grateful for the support of the LWK and DMRC staff members, especially thankful to Kay-Peter Hoyer and Mirko Schaper for the project acquisition, support, and supervision, as well as to Mostafa Jamel and Tobias Schulz for the valuable discussions.

Conflicts of Interest

The author declares no conflict of interest. The funders had no role in the design of the study; in the collection, analyses, or interpretation of data; in the writing of the manuscript, or in the decision to publish the results.

References

  1. Gross, B.C.; Erkal, J.L.; Lockwood, S.Y.; Chen, C.; Spence, D.M. Evaluation of 3D printing and its potential impact on biotechnology and the chemical sciences. Anal. Chem. 2014, 86, 3240–3253. [Google Scholar] [CrossRef] [PubMed]
  2. Schmidt, M.; Merklein, M.; Bourell, D.; Dimitrov, D.; Hausotte, T.; Wegener, K.; Overmeyer, L.; Vollertsen, F.; Levy, G.N. Laser based additive manufacturing in industry and academia. CIRP Ann. 2017, 66, 561–583. [Google Scholar] [CrossRef]
  3. Bourell, D.; Kruth, J.P.; Leu, M.C.; Levy, G.N.; Rosen, D.; Beese, A.M.; Clare, A. Materials for additive manufacturing. CIRP Ann. 2017, 66, 659–681. [Google Scholar] [CrossRef]
  4. Wohlers, T.T.; Campbell, I.; Diegel, O.; Kowen, J. Wohlers Report 2018. 3D Printing and Additive Manufacturing State of the Industry: Annual Worldwide Progress Report; Wohlers Associates, Inc.: Fort Collins, CL, USA, 2018; ISBN 0991333241. [Google Scholar]
  5. Gibson, I.; Rosen, D.; Stucker, B. Additive Manufacturing Technologies. 3D Printing, Rapid Prototyping and Direct Digital Manufacturing, 2nd ed.; Springer: Berlin/Heidelberg, Germany, 2015; ISBN 978-1493921126. [Google Scholar]
  6. Dutta, B.; Froes, F.H. Additive Manufacturing of Titanium Alloys. State of the Art, Challenges, and Opportunities; Butterworth-Heinemann is an Imprint of Elsevier: Amsterdam, The Netherlands, 2016; ISBN 9780128047835. [Google Scholar]
  7. Kumar, R.; Kumar, M.; Chohan, J.S. The role of additive manufacturing for biomedical applications: A critical review. J. Manuf. Process. 2021, 64, 828–850. [Google Scholar] [CrossRef]
  8. Javaid, M.; Haleem, A. Additive manufacturing applications in medical cases: A literature based review. Alex. J. Med. 2018, 54, 411–422. [Google Scholar] [CrossRef]
  9. Fazel-Rezai, R. Biomedical Engineering—From Theory to Applications; IntechOpen: London, UK, 2011; ISBN 9789533076379. [Google Scholar]
  10. Zaman, H.A.; Sharif, S.; Idris, M.H.; Kamarudin, A. Metallic Biomaterials for Medical Implant Applications: A Review. Appl. Mech. Mater. 2015, 735, 19–25. [Google Scholar] [CrossRef]
  11. Festas, A.J.; Ramos, A.; Davim, J.P. Medical devices biomaterials—A review. Proc. Inst. Mech. Eng. Part L J. Mater. Des. Appl. 2020, 234, 218–228. [Google Scholar] [CrossRef]
  12. Vandenbroucke, B.; Kruth, J.P. Selective laser melting of biocompatible metals for rapid manufacturing of medical parts. Rapid Prototyp. J. 2007, 13, 196–203. [Google Scholar] [CrossRef]
  13. Iijima, D. Wear properties of Ti and Ti–6Al–7Nb castings for dental prostheses. Biomaterials 2003, 24, 1519–1524. [Google Scholar] [CrossRef]
  14. Niinomi, M. Mechanical biocompatibilities of titanium alloys for biomedical applications. J. Mech. Behav. Biomed. Mater. 2008, 1, 30–42. [Google Scholar] [CrossRef]
  15. Hollander, D.A.; von Walter, M.; Wirtz, T.; Sellei, R.; Schmidt-Rohlfing, B.; Paar, O.; Erli, H.-J. Structural, mechanical and in vitro characterization of individually structured Ti-6Al-4V produced by direct laser forming. Biomaterials 2006, 27, 955–963. [Google Scholar] [CrossRef] [PubMed]
  16. Murr, L.E.; Quinones, S.A.; Gaytan, S.M.; Lopez, M.I.; Rodela, A.; Martinez, E.Y.; Hernandez, D.H.; Martinez, E.; Medina, F.; Wicker, R.B. Microstructure and mechanical behavior of Ti-6Al-4V produced by rapid-layer manufacturing, for biomedical applications. J. Mech. Behav. Biomed. Mater. 2009, 2, 20–32. [Google Scholar] [CrossRef] [PubMed]
  17. Khrunyk, Y.Y.; Ehnert, S.; Grib, S.V.; Illarionov, A.G.; Stepanov, S.I.; Popov, A.A.; Ryzhkov, M.A.; Belikov, S.V.; Xu, Z.; Rupp, F.; et al. Synthesis and Characterization of a Novel Biocompatible Alloy, Ti-Nb-Zr-Ta-Sn. Int. J. Mol. Sci. 2021, 22, 10611. [Google Scholar] [CrossRef]
  18. Surmeneva, M.; Grubova, I.; Glukhova, N.; Khrapov, D.; Koptyug, A.; Volkova, A.; Ivanov, Y.; Cotrut, C.M.; Vladescu, A.; Teresov, A.; et al. New Ti–35Nb–7Zr–5Ta Alloy Manufacturing by Electron Beam Melting for Medical Application Followed by High Current Pulsed Electron Beam Treatment. Metals 2021, 11, 1066. [Google Scholar] [CrossRef]
  19. Surmeneva, M.A.; Koptyug, A.; Khrapov, D.; Ivanov, Y.F.; Mishurova, T.; Evsevleev, S.; Prymak, O.; Loza, K.; Epple, M.; Bruno, G.; et al. In situ synthesis of a binary Ti–10at% Nb alloy by electron beam melting using a mixture of elemental niobium and titanium powders. J. Mater. Process. Technol. 2020, 282, 116646. [Google Scholar] [CrossRef]
  20. Tamilselvi, S.; Raman, V.; Rajendran, N. Corrosion behaviour of Ti–6Al–7Nb and Ti–6Al–4V ELI alloys in the simulated body fluid solution by electrochemical impedance spectroscopy. Electrochim. Acta 2006, 52, 839–846. [Google Scholar] [CrossRef]
  21. Metikoš-Huković, M.; Kwokal, A.; Piljac, J. The influence of niobium and vanadium on passivity of titanium-based implants in physiological solution. Biomaterials 2003, 24, 3765–3775. [Google Scholar] [CrossRef]
  22. López, M.; Gutiérrez, A.; Jiménez, J. In vitro corrosion behaviour of titanium alloys without vanadium. Electrochim. Acta 2002, 47, 1359–1364. [Google Scholar] [CrossRef]
  23. Lewandowski, J.J.; Seifi, M. Metal Additive Manufacturing: A Review of Mechanical Properties. Annu. Rev. Mater. Res. 2016, 46, 151–186. [Google Scholar] [CrossRef]
  24. Yap, C.Y.; Chua, C.K.; Dong, Z.L.; Liu, Z.H.; Zhang, D.Q.; Loh, L.E.; Sing, S.L. Review of selective laser melting: Materials and applications. Appl. Phys. Rev. 2015, 2, 41101. [Google Scholar] [CrossRef]
  25. Hein, M.; Hoyer, K.-P.; Schaper, M. Additively processed TiAl6Nb7 alloy for biomedical applications. Mater. Und Werkst. 2021, 52, 703–716. [Google Scholar] [CrossRef]
  26. Hein, M.; Lopes Dias, N.F.; Pramanik, S.; Stangier, D.; Hoyer, K.-P.; Tillmann, W.; Schaper, M. Heat Treatments of Metastable β Titanium Alloy Ti-24Nb-4Zr-8Sn Processed by Laser Powder Bed Fusion. Materials 2022, 15, 3774. [Google Scholar] [CrossRef] [PubMed]
  27. Leuders, S.; Thöne, M.; Riemer, A.; Niendorf, T.; Tröster, T.; Richard, H.A.; Maier, H.J. On the mechanical behaviour of titanium alloy TiAl6V4 manufactured by selective laser melting: Fatigue resistance and crack growth performance. Int. J. Fatigue 2013, 48, 300–307. [Google Scholar] [CrossRef]
  28. Tolosa, I.; Garciandía, F.; Zubiri, F.; Zapirain, F.; Esnaola, A. Study of mechanical properties of AISI 316 stainless steel processed by “selective laser melting”, following different manufacturing strategies. Int. J. Adv. Manuf. Technol. 2010, 51, 639–647. [Google Scholar] [CrossRef]
  29. Nezhadfar, P.D.; Burford, E.; Anderson-Wedge, K.; Zhang, B.; Shao, S.; Daniewicz, S.R.; Shamsaei, N. Fatigue crack growth behavior of additively manufactured 17-4 PH stainless steel: Effects of build orientation and microstructure. Int. J. Fatigue 2019, 123, 168–179. [Google Scholar] [CrossRef]
  30. Kluczyński, J.; Śnieżek, L.; Grzelak, K.; Torzewski, J.; Szachogłuchowicz, I.; Wachowski, M.; Łuszczek, J. Crack Growth Behavior of Additively Manufactured 316L Steel-Influence of Build Orientation and Heat Treatment. Materials 2020, 13, 3259. [Google Scholar] [CrossRef] [PubMed]
  31. Zhang, M.; Sun, C.-N.; Zhang, X.; Wei, J.; Hardacre, D.; Li, H. High cycle fatigue and ratcheting interaction of laser powder bed fusion stainless steel 316L: Fracture behaviour and stress-based modelling. Int. J. Fatigue 2019, 121, 252–264. [Google Scholar] [CrossRef]
  32. Jerrard, P.G.E.; Hao, L.; Evans, K.E. Experimental investigation into selective laser melting of austenitic and martensitic stainless steel powder mixtures. Proc. Inst. Mech. Eng. B J. Eng. Manuf. 2009, 223, 1409–1416. [Google Scholar] [CrossRef]
  33. Riemer, A.; Leuders, S.; Thöne, M.; Richard, H.A.; Tröster, T.; Niendorf, T. On the fatigue crack growth behavior in 316L stainless steel manufactured by selective laser melting. Eng. Fract. Mech. 2014, 120, 15–25. [Google Scholar] [CrossRef]
  34. Baufeld, B.; Brandl, E.; van der Biest, O. Wire based additive layer manufacturing: Comparison of microstructure and mechanical properties of Ti–6Al–4V components fabricated by laser-beam deposition and shaped metal deposition. J. Mater. Process. Technol. 2011, 211, 1146–1158. [Google Scholar] [CrossRef]
  35. Brandl, E. Microstructural and Mechanical Properties of Additive Manufactured Titanium (Ti-6Al-4V) Using Wire. Evaluation with Respect to Additive Processes Using Powder and Aerospace Material Specifications; Zugl.: Cottbus, Germany; Shaker: Aachen, Germany, 2010; ISBN 978-3-8322-9530-1. [Google Scholar]
  36. Khorasani, A.; Gibson, I.; Goldberg, M.; Littlefair, G. On the role of different annealing heat treatments on mechanical properties and microstructure of selective laser melted and conventional wrought Ti-6Al-4V. Rapid Prototyp. J. 2017, 23, 295–304. [Google Scholar] [CrossRef]
  37. Liu, S.; Shin, Y.C. Additive manufacturing of Ti6Al4V alloy: A review. Mater. Des. 2019, 164, 107552. [Google Scholar] [CrossRef]
  38. Riemer, A.; Richard, H.A. Crack Propagation in Additive Manufactured Materials and Structures. Procedia Struct. Integ. 2016, 2, 1229–1236. [Google Scholar] [CrossRef]
  39. Leuders, S.; Lieneke, T.; Lammers, S.; Tröster, T.; Niendorf, T. On the fatigue properties of metals manufactured by selective laser melting—The role of ductility. J. Mater. Res. 2014, 29, 1911–1919. [Google Scholar] [CrossRef]
  40. Popov, V.V.; Katz-Demyanetz, A.; Garkun, A.; Bamberger, M. The effect of powder recycling on the mechanical properties and microstructure of electron beam melted Ti-6Al-4 V specimens. Addit. Manuf. 2018, 22, 834–843. [Google Scholar] [CrossRef]
  41. Wood, M.I. The mechanical properties of coatings and coated systems. Mater. Sci. Eng. A Struct. Mater. 1989, 120-121, 633–643. [Google Scholar] [CrossRef]
  42. Mehran, Q.M.; Fazal, M.A.; Bushroa, A.R.; Rubaiee, S. A Critical Review on Physical Vapor Deposition Coatings Applied on Different Engine Components. Crit. Rev. Solid State Mater. Sci. 2018, 43, 158–175. [Google Scholar] [CrossRef]
  43. Tillmann, W.; Lopes Dias, N.F.; Kokalj, D.; Stangier, D.; Hein, M.; Hoyer, K.-P.; Schaper, M.; Gödecke, D.; Oltmanns, H.; Meißner, J. Tribo-functional PVD thin films deposited onto additively manufactured Ti6Al7Nb for biomedical applications. Mater. Lett. 2022, 132384. [Google Scholar] [CrossRef]
  44. Tillmann, W.; Lopes Dias, N.F.; Franke, C.; Kokalj, D.; Stangier, D.; Filor, V.; Mateus-Vargas, R.H.; Oltmanns, H.; Kietzmann, M.; Meißner, J.; et al. Tribo-mechanical properties and biocompatibility of Ag-containing amorphous carbon films deposited onto Ti6Al4V. Surf. Coat. Technol. 2021, 421, 127384. [Google Scholar] [CrossRef]
  45. Liu, X.; Chu, P.; Ding, C. Surface modification of titanium, titanium alloys, and related materials for biomedical applications. Mater. Sci. Eng. R Rep. 2004, 47, 49–121. [Google Scholar] [CrossRef] [Green Version]
  46. Fuentes, E.; Alves, S.; López-Ortega, A.; Mendizabal, L.; Sáenz de Viteri, V. Advanced Surface Treatments on Titanium and Titanium Alloys Focused on Electrochemical and Physical Technologies for Biomedical Applications. In Biomaterial-Supported Tissue Reconstruction or Regeneration; Barbeck, M., Jung, O., Smeets, R., Koržinskas, T., Eds.; IntechOpen: London, UK, 2019; ISBN 978-1-83880-377-3. [Google Scholar]
  47. Nascimento, M. Effects of surface treatments on the fatigue strength of AISI 4340 aeronautical steel. Int. J. Fatigue 2001, 23, 607–618. [Google Scholar] [CrossRef]
  48. Baragetti, S.; Lavecchia, G.; Terranova, A. Variables affecting the fatigue resistance of PVD-coated components. Int. J. Fatigue 2005, 27, 1541–1550. [Google Scholar] [CrossRef]
  49. Puchi-Cabrera, E.S.; Matínez, F.; Herrera, I.; Berríos, J.; Dixit, S.; Bhat, D. On the fatigue behavior of an AISI 316L stainless steel coated with a PVD TiN deposit. Surf. Coat. Technol. 2004, 182, 276–286. [Google Scholar] [CrossRef]
  50. Puchi-Cabrera, E.S.; Staia, M.H.; Ochoa-Pérez, E.A.; Teer, D.G.; Santana-Méndez, Y.Y.; La Barbera-Sosa, J.G.; Chicot, D.; Lesage, J. Fatigue behavior of a 316L stainless steel coated with a DLC film deposited by PVD magnetron sputter ion plating. Mater. Sci. Eng. A Struct. Mater. 2010, 527, 498–508. [Google Scholar] [CrossRef]
  51. Correa Jácome, J.F.; Caicedo Angulo, J.C.; Castro, Y.A. PVD coatings influence (TiCN, BCN, and CrAlN) on the fatigue life behavior of AISI 1045 steel for automotive applications. Int. J. Adv. Manuf. Technol. 2022, 119, 3995–4009. [Google Scholar] [CrossRef]
  52. Ferreira, J.; Costa, J.; Lapa, V. Fatigue behaviour of 42Cr Mo4 steel with PVD coatings. Int. J. Fatigue 1997, 19, 293–299. [Google Scholar] [CrossRef]
  53. Baragetti, S. Fatigue resistance of steel and titanium PVD coated spur gears. Int. J. Fatigue 2007, 29, 1893–1903. [Google Scholar] [CrossRef]
  54. Baragetti, S.; Borzini, E.; Božic, Ž.; Arcieri, E.V. On the fatigue strength of uncoated and DLC coated 7075-T6 aluminum alloy. Eng. Fail. Anal. 2019, 102, 219–225. [Google Scholar] [CrossRef]
  55. Gopkalo, A.P.; Rutkovskyy, A.V. The effect of PVD coatings on the tensile strength and low-cycle fatigue resistance of stainless steel and titanium alloys. Fatigue Fract. Eng. Mater. Struct. 2011, 34, 1012–1020. [Google Scholar] [CrossRef]
  56. Costa, M.Y.P.; Cioffi, M.O.H.; Venditti, M.L.R.; Voorwald, H.J.C. Fatigue fracture behavior of Ti-6Al-4V PVD coated. Procedia Eng. 2010, 2, 1859–1864. [Google Scholar] [CrossRef]
  57. Costa, M.; Venditti, M.; Cioffi, M.; Voorwald, H.; Guimarães, V.A.; Ruas, R. Fatigue behavior of PVD coated Ti–6Al–4V alloy. Int. J. Fatigue 2011, 33, 759–765. [Google Scholar] [CrossRef]
  58. Bai, Y.; Xi, Y.; Gao, K.; Yang, H.; Pang, X.; Yang, X.; Volinsky, A.A. Brittle coating effects on fatigue cracks behavior in Ti alloys. Int. J. Fatigue 2019, 125, 432–439. [Google Scholar] [CrossRef]
  59. Niendorf, T. Ermüdungseigenschaften Ultrafeinkörniger Kubisch Raumzentrierter Werkstoffe. Ph.D. Thesis, Paderborn Univercity, Paderborn, Germany, 2010. [Google Scholar]
  60. Hein, M.; Kokalj, D.; Lopes Dias, N.F.; Stangier, D.; Oltmanns, H.; Pramanik, S.; Kietzmann, M.; Hoyer, K.-P.; Meißner, J.; Tillmann, W.; et al. Low Cycle Fatigue Performance of Additively Processed and Heat-Treated Ti-6Al-7Nb Alloy for Biomedical Applications. Metals 2022, 12, 122. [Google Scholar] [CrossRef]
  61. Donachie, M.J. Titanium. A technical Guide, 2nd ed.; ASM International: Materials Park, OH, USA, 2000; ISBN 9780871706867. [Google Scholar]
  62. Liang, Z.; Sun, Z.; Zhang, W.; Wu, S.; Chang, H. The effect of heat treatment on microstructure evolution and tensile properties of selective laser melted Ti6Al4V alloy. J. Alloys Compd. 2019, 782, 1041–1048. [Google Scholar] [CrossRef]
  63. Tillmann, W.; Lopes Dias, N.F.; Franke, C.; Kokalj, D.; Stangier, D.; Thomann, C.A.; Debus, J. Mechanical properties and adhesion behavior of amorphous carbon films with bias voltage controlled TixCy interlayers on Ti6Al4V. Diam. Relat. Mater. 2021, 115, 108361. [Google Scholar] [CrossRef]
  64. DIN EN ISO 4288:1998-04; Geometrische Produktspezifikation (GPS)_-Oberflächenbeschaffenheit: Tastschnittverfahren_-Regeln und Verfahren für die Beurteilung der Oberflächenbeschaffenheit (ISO_4288:1996); Deutsche Fassung EN_ISO_4288:1997. Beuth Verlag GmbH: Berlin, Germany, 1998. [CrossRef]
  65. Lin, C.-Y.; Kang, J.-H. Mechanical Properties of Compact Bone Defined by the Stress-Strain Curve Measured Using Uniaxial Tensile Test: A Concise Review and Practical Guide. Materials 2021, 14, 4224. [Google Scholar] [CrossRef]
  66. DIN 50100:2016-12; DIN Deutsches Institut für Normung e. V. Schwingfestigkeitsversuch—Durchführung und Auswertung von zyklischen Versuchen mit konstanter Lastamplitude für metallische Werkstoffproben und Bauteile. DIN 50100: 2016-12. Beuth Verlag GmbH: Berlin, Germany, 2016. [CrossRef]
  67. Hück, M. Ein verbessertes Verfahren für die Auswertung von Treppenstufenversuchen. Mat. Werkstofftech. 1983, 14, 406–417. [Google Scholar] [CrossRef]
  68. Nakatani, M.; Masuo, H.; Tanaka, Y.; Murakami, Y. Effect of Surface Roughness on Fatigue Strength of Ti-6Al-4V Alloy Manufactured by Additive Manufacturing. Procedia Struct. Integr. 2019, 19, 294–301. [Google Scholar] [CrossRef]
  69. Korhonen, A.S. Corrosion of thin hard PVD coatings. Vacuum 1994, 45, 1031–1034. [Google Scholar] [CrossRef]
  70. Mertová, K.; Džugan, J.; Roudnická, M.; Daniel, M.; Vojtěch, D.; Seifi, M.; Lewandowski, J.J. Build Size and Orientation Influence on Mechanical Properties of Powder Bed Fusion Deposited Titanium Parts. Metals 2020, 10, 1340. [Google Scholar] [CrossRef]
  71. Kasperovich, G.; Hausmann, J. Improvement of fatigue resistance and ductility of TiAl6V4 processed by selective laser melting. J. Mater. Processing Technol. 2015, 220, 202–214. [Google Scholar] [CrossRef]
  72. Liu, Q.C.; Elambasseril, J.; Sun, S.J.; Leary, M.; Brandt, M.; Sharp, P.K. The Effect of Manufacturing Defects on the Fatigue Behaviour of Ti-6Al-4V Specimens Fabricated Using Selective Laser Melting. Adv. Mat. Res. 2014, 891–892, 1519–1524. [Google Scholar] [CrossRef]
  73. Murakami, Y. Metal Fatigue. Effects of Small Defects and Nonmetallic Inclusions, 2nd ed.; Academic Press: Amsterdam, The Netherlands, 2019; ISBN 9780128138779. [Google Scholar]
  74. Sercombe, T.; Jones, N.; Day, R.; Kop, A. Heat treatment of Ti-6Al-7Nb components produced by selective laser melting. Rapid Prototyp. J. 2008, 14, 300–304. [Google Scholar] [CrossRef]
  75. Von Niessen, K.; Gindrat, M.; Refke, A. Vapor Phase Deposition Using Plasma Spray-PVD™. J. Therm. Spray Tech. 2010, 19, 502–509. [Google Scholar] [CrossRef]
  76. Cheng, Z.; Yang, J.; Shao, F.; Zhong, X.; Zhao, H.; Zhuang, Y.; Sheng, J.; Ni, J.; Tao, S. Thermal Stability of PS-PVD YSZ Coatings with Typical Dense Layered and Columnar Structures. Crystals 2020, 10, 826. [Google Scholar] [CrossRef]
  77. Deng, Z.-Q.; Mao, J.; Liu, M.; Deng, C.-M.; Ma, J.-T. Regional characteristic of 7YSZ coatings prepared by plasma spray-physical vapor deposition technique. Rare Met. 2021, 40, 3308–3315. [Google Scholar] [CrossRef]
  78. Zhao, H.; Zhang, X.; Deng, C.; Deng, Z.; Chen, X. Performance Evaluation and Thermal Shock Behavior of PS-PVD (Gd0.9Yb0.1)2Zr2O7/YSZ Thermal Barrier Coatings. Coatings 2022, 12, 323. [Google Scholar] [CrossRef]
  79. Tillmann, W.; Lopes Dias, N.F.; Stangier, D.; Nienhaus, A.; Thomann, C.A.; Wittrock, A.; Moldenhauer, H.; Debus, J. Effect of the bias voltage on the structural and tribo-mechanical properties of Ag-containing amorphous carbon films. Diam. Relat. Mater. 2020, 105, 107803. [Google Scholar] [CrossRef]
  80. Baba, K.; Hatada, R.; Flege, S.; Ensinger, W. Preparation and Properties of Ag-Containing Diamond-Like Carbon Films by Magnetron Plasma Source Ion Implantation. Adv. Mater. Sci. Eng. 2012, 2012, 1–5. [Google Scholar] [CrossRef]
  81. Bociaga, D.; Komorowski, P.; Batory, D.; Szymanski, W.; Olejnik, A.; Jastrzebski, K.; Jakubowski, W. Silver-doped nanocomposite carbon coatings (Ag-DLC) for biomedical applications—Physiochemical and biological evaluation. Appl. Surf. Sci. 2015, 355, 388–397. [Google Scholar] [CrossRef]
  82. Kumar, K.; Pooleery, A.; Madhusoodanan, K.; Singh, R.N.; Chakravartty, J.K.; Dutta, B.K.; Sinha, R.K. Use of Miniature Tensile Specimen for Measurement of Mechanical Properties. Procedia Eng. 2014, 86, 899–909. [Google Scholar] [CrossRef] [Green Version]
  83. Paik, J.K.; Melchers, R.E. Condition Assessment of Aged Structures; CRC Press: Boca Raton, FL, USA, 2008; ISBN 978-1-84569-334-3. [Google Scholar]
  84. Lumley, R. Fundamentals of Aluminium Metallurgy. Production, Processing and Applications; Elsevier Science & Technology: Cambridge, UK, 2011; ISBN 978-1-84569-654-2. [Google Scholar]
  85. Pfeifer, M. Degradation and Reliability of Materials. Materials Enabled Designs; Elsevier: Amsterdam, The Netherlands, 2009; pp. 161–187. ISBN 9780750682879. [Google Scholar]
Figure 1. (a) Geometry and build direction (BD) of the fatigue specimens; overview of specimens in different conditions (b) as built; (c) stress relieved (SR); (d) titanium nitride (TiN); (e) titanium carbonitride (TiCN); (f) silver-containing amorphous carbon (a-C:Ag).
Crystals 12 01190 g001
Figure 2. Experimental stress-life curves of the different conditions showing the results of the Wöhler tests (filled symbols) and staircase tests (SC, hollow symbols); failure bands described by the failure probability curves PF10%, PF50%, and PF90%; horizontal arrows indicate the run-out specimens (after 107 cycles); (a) as-built condition; (b) SR condition; (c) PVD coated with TiN; (d) PVD coated with TiCN; (e) PVD coated with a-C:Ag; (f) comparison of the failure probability curves PF50% of the different conditions.
Crystals 12 01190 g002aCrystals 12 01190 g002b
Figure 3. SEM images of a fatigue fracture surface on an as-built Ti-6Al-7Nb fatigue specimen; (a) overview image of the fracture surface, forced fracture occurs between the dashed, black lines; (b) fracture surface from the black square in (a), divided by the dashed line into fatigue fracture (right of the dashed line) and residual forced fracture (left of the dashed line); (c) fatigue fracture surface from the blue square in (a); (d) detailed view of the red square in (c) of the fatigue striations (white arrows) and the probable crack propagation direction (red arrow); (e) detailed view on the residual forced fracture surface with shallow dimples (black arrows) resulting from ductile material behavior; (f) laser powder bed fusion (LPBF) characteristic gas pore; (g) LPBF characteristic lack of fusion defect with unmelted powder particle.
Crystals 12 01190 g003aCrystals 12 01190 g003b
Figure 4. SEM images of the fracture surface of a TiN-coated specimen; (a) overview SE image of the fracture surface, forced fracture surface indicated with the dashed line, possible crack nucleation sites within the red circles, where the red arrow indicates crack propagation direction; (b) SE image of fracture surface from the black square in (a), with crack propagation direction (red arrow) and fatigue striations (white arrows); (c) SE image of coated powder particle on the surface of the specimen; (d) SE image of TiN coating (dashed, yellow lines) in the boundary region of the fatigue fracture surface of the substrate (left area); (e) in-lens image of TiN surface layer (TiN-SL) at the edge of a fractured surface (right area) after fatigue testing, showing emerged cracks in the coating; (f) in-lens image of the TiN surface with edgy and angular, pyramid-like growth structure.
Crystals 12 01190 g004
Figure 5. SEM images of the fracture surface of a TiCN-coated specimen; (a) overview SE image of the fracture surface, forced fracture surface indicated with the dashed line, possible crack nucleation sites within the red circles, the red arrow indicates crack propagation direction; (b) fracture surface from the black square in (a), with crack propagation direction (red arrow) and fatigue striations (white arrows); (c) TiCN coating (black arrows) on the substrate material (right area) and fatigue striations on the fracture surface (white arrows); (d) in-lens image of the TiCN coating (yellow dashed lines) in the edge region of the fatigue fracture surface of the substrate (bottom area); (e) in-lens image of TiCN surface layer (TiCN-SL), TiN interlayer (TiN-IL), and Ti interlayer (Ti-IL) at the edge of a fractured surface (bottom area) after fatigue testing; (f) TiCN surface with cauliflower-like structure.
Crystals 12 01190 g005aCrystals 12 01190 g005b
Figure 6. SEM images of the fracture surface of an a-C:Ag-coated specimen; (a) overview SE image of the fracture surface, dashed line separating fatigue (left) and forced fracture (right), Roman numerals indicating the possible crack nucleation sites, black arrows marking pores; (b) detailed view of the blue rectangle in (a), showing the fatigue characteristic striations (white arrows) and the crack propagation direction (red arrow); (c) overview of the fatigue fracture surface with fatigue striations (white arrows) and LPBF characteristic defects such as pores (black arrow); (d) detailed in-lens image of the black square in (c) showing the a-C:Ag coating on the surface (yellow arrows) and the fatigue fracture surface (right area) with fatigue striations (white arrows), a coated powder particle on the surface of the specimen with Ag particles (green arrows).
Crystals 12 01190 g006aCrystals 12 01190 g006b
Table 1. LPBF parameters for the hatch and contour of Ti-6Al-7Nb; 5 mm stripe exposure, rotated layer by layer by 67°; constant building platform temperature at 200 °C.
Parameter SetsLayer Thickness t in µmLaser Power P in WScanning Speed in m s−1Hatch Distance h in mm
Hatch501851.6750.077
Contour501230.512-
Table 2. Overview of the fatigue test results of the as-built, SR, TiN-coated, TiCN-coated, and a-C:Ag-coated conditions, with different stress amplitudes, σa, and cycles to failure, N, for different test procedures, Wöhler curve and staircase test procedure (SC), 107 = run-outs.
ConditionAs-BuiltSR+TiN+TiCN+a-C:Ag
TestσaNσaNσaNσaNσaN
Wöhler1400924340030,57640014,14140012,24440011,259
2400945640030,29240013,12140010,4834009294
3400812340030,20140015,66340010,6244009131
435011,46230097,77930026,42830016,02930017,525
5350997930073,04830020,53030018,13230012,786
635010,21130086,04030017,52530019,38630012,477
730013,97930074,28120076,52520062,67120041,585
830013,4622001,250,87620071,20420051,99620045,665
930013,782200764,14820077,22220057,18020031,088
1020039,514200945,842150152,991150137,68215085,630
1120042,166200675,594150171,897150144,485150100,463
1220031,930175107150168,327150117,362150102,704
13100486,130175107125107125107125139,143
14100396,010175107125107125306,679125114,243
15100560,428--125107125107125138,871
1615069,036----125107100268,655
1715091,714------100390,224
1815066,932------100328,678
19125205,157------75107
20125137,410------75107
21125128,867------75107
2275107--------
2375107--------
2475107--------
SC198257,290192369,262131107144184,07499417,474
290107183107137169,586137196,35990107
398411,817192460,000131245,437131354,12599390,952
490429,664192107125107125256,33490107
58210720010713110711910799430,847
690107--13710712510790107
7989,519,363--144205,177131298,42599289,494
8------125281,170--
9------119270,714--
Table 3. Overview of the fatigue properties of the as-built, SR, TiN-coated, TiCN-coated, and a-C:Ag-coated conditions; fatigue strength, σF, cycles at the knee point, NK of the failure probability curves, PF50%, Wöhler line slope, k.
ConditionAs-BuiltSR+TiN+TiCN+a-C:Ag
σF in MPa92.6190.2133.5121.495.0
NK385,1531,025,238210,470214,018298,870
k2.75.02.62.62.5
Publisher’s Note: MDPI stays neutral with regard to jurisdictional claims in published maps and institutional affiliations.

