Abstract
In this study, the design, additive manufacturing and experimental as well as simulation investigation of mechanical and thermal properties of cellular solids are addressed. For this, two cellular solids having nested and non-nested structures are designed and additively manufactured via laser powder bed fusion. The primary objective is to design cellular solids which absorb a significant amount of energy upon impact loading without transmitting a high amount of stress into the cellular solids. Therefore, compression testing of the two cellular solids is performed. The nested and non-nested cellular solids show similar energy absorption properties; however, the nested cellular solid transmits a lower amount of stress in the cellular structure compared to the non-nested cellular solid. The experimentally measured strain (by DIC) in the interior region of the nested cellular solid is lower despite a higher value of externally imposed compressive strain. The second objective of this study is to determine the thermal insulation properties of cellular solids. For measuring the thermal insulation properties, the samples are placed on a hot plate; and the surface temperature distribution is measured by an infrared camera. The thermal insulating performance of both cellular types is sufficient for temperatures exceeding 100 °C. However, the thermal insulating performance of a non-nested cellular solid is slightly better than that of the nested cellular solid. Additional thermal simulations predict a relatively higher temperature distribution on the cellular solid surfaces compared to experimental results. The simulated residual stress shows a similar distribution for both types, but the magnitude of residual stress is different for the cellular solids upon cooling from different temperatures of the hot plate.
1. Introduction
Cellular solids can be naturally occurring or manmade porous materials having cells with different shapes and sizes. They can be used in different engineering applications such as weight reduction, energy absorption, heat exchangers, sandwich cores, strain isolation, thermal insulation, vibration control, catalysis, bone integration, etc. [1]. This investigation addresses two important engineering applications of cellular solids for energy absorption and thermal insulation. Cellular solids can be broadly classified as prismatic or volumetric structures [2,3]. In prismatic cellular solids, the third direction is the extrusion of the surface feature created in the other two dimensions. So, from a design viewpoint, prismatic cellular solids are two-dimensional as the design of the cells is only conducted in two dimensions. Volumetric cellular solids have a distinct design in three dimensions. For example, metallic lattices [4] are volumetric cellular solids, whereas hexagonal honeycombs are prismatic cellular solids. This investigation focuses on prismatic cellular solids. A profound question in the design of cellular solids is the type of cell and distribution of cell sizes. A detailed discussion on the selection criteria of the cell is reported in Ref. [5]. In brief, (1) analytical methods borrowed from beam theory, (2) empirical data and scaling laws, and (3) biomimicry are three common methods for choosing the desired cell type when designing a cellular solid.
The distribution of the cell sizes within a cellular solid can be performed by different approaches: (1) by targeting a relative density with a predefined range, (2) by gradual variation of cell sizes via a mathematical function, (3) by biomimicry, and (4) by mathematical concepts [5]. Here, we only consider the mathematical approach. The first method is to apply symmetry to distribute cells of different sizes for effective energy absorption [6]. Here, asymmetric honeycombs containing negative space are exploited to optimize the energy absorbed and maximum load transmitted. Two prominent findings reported in the previous study (1) are the use of connected negative spaces (e.g., a spiral) to reduce the failure stress and accommodate deformation at relatively low stress, and (2) a high amount of energy absorbed for low maximum stress can be obtained by the removal of struts in a staggered way (forming a connected negative space) resulting in the collapse of the structure in a non-collinear manner [6]. The other two mathematical concepts applied to select the distribution of cell sizes are the use of self-similarity (fractal geometry) and nesting geometry.
There are few studies on the thermal performance behaviour of additively manufactured structures with complex geometries [7,8,9,10,11]. In those studies, the objective is to create structures with a high surface area per unit volume to produce structures with high thermal conductivity. The large surface area is to enable higher convection rates resulting in faster heat dissipation. In this regard, it is possible to manufacture thermal insulating structures possessing complex geometries (having higher surface area per unit volume) of materials having low thermal conductivity which results in superior thermal insulation properties.
There are many processing techniques for the manufacture of cellular solids (e.g., foaming, casting, extrusion, vapour deposition, expansion and corrugation) [1,12]. Additive manufacturing via laser powder bed fusion (LPBF) is an efficient way to manufacture metallic cellular solids as complex non-stochastic shapes can be produced comparatively easily within a short period. Moreover, local structure modification of the cellular solid is possible by LPBF which is not possible for other cellular solid processing techniques.
In this study, the use of the nesting design principle to distribute the cell sizes within the cellular solid for effective stress distribution with suitable applications for impact absorption (e.g., helmet) is investigated. The main objective is to manufacture cellular solids which absorb a high amount of energy without transmitting a higher amount of stress within the cellular solid (i.e., strains in the interior regions of the cellular solid are minimized). An additional aim is to build and test these prismatic cellular solids under compression to experimentally determine the force transmitted and the strain distribution. As a comprehensive study of thermal insulators with complex structures is missing in the literature, the third aspect of this investigation is to determine the thermal insulation property of the cellular solids and to compare the experimentally measured thermal insulation properties of the cellular solids with the finite element method (FEM) simulations. Here, an experimental setup is designed to measure the thermal conductivity of the cellular solids for evaluating the insulating performance. FEM simulations are performed to predict the temperature distribution in the cellular solid exposed to a wide range of temperatures and to determine the residual stress within the cellular solid upon cooling from the high temperatures.
2. Materials and Methods
2.1. Design and Processing of Cellular Solids
The design of the nested cellular solids and non-nested cellular solids, both joined to two clamping structures, are prepared in SOLIDWORKS 2017. The nested structure solid consists of alternating square and circular structures. Here, the nested structure manifests three square and three circular structures with thin walls of 0.3 mm thickness. The size of the outermost square is 10 mm (length), 10 mm (width) and 5 mm (depth). The non-nested structure solid consists of triangular cells of varying sizes. The cell wall thickness of the triangular cells is 0.3 mm. All struts are placed inside a rectangular volume of 10 mm (length), 10 mm (width) and 5 mm (depth). The computer-aided design (CAD) models of the samples are exported for additive manufacturing as stereolithography (.STL) files and FEM analysis using ABAQUS CAE 2017 as STP files.
The samples are prepared by LPBF using the DMG LT12 system (DMG MORI Additive GmbH, Germany) with spherical Ti6Al7Nb powder (TLS Technik GmbH & Co. Spezialpulver KG, Germany), prepared by gas atomization. The powder particles are imaged using a Phenom scanning electron microscope for morphological investigation. The size distribution of the powder particles is measured by laser diffraction (Mastersizer 2000). The optimized processing parameters applied for manufacturing the samples are 305 W laser power, 1.65 mm/s laser scanning speed, 0.01 mm hatch distance, 0.05 mm layer thickness and 0.09 mm diameter laser spot. All samples are prepared in the horizontal build position inside an argon atmosphere with an oxygen content of 0.08—0.13%. After processing, the cellular solids are cleaned (to remove loose, trapped and unmelted powder particles) by air blasting followed by ultrasonic cleaning in acetone for 15 min.
2.2. Compression Testing and Optical Microscopy
For performing compression tests, an MTS Landmark tensile testing machine is used at a crosshead speed of 0.6 mm/min (0.001 s−1). The images of the sample during compression testing are captured with a DSLR Nikon D3200 camera. All captured images are used as input for digital image correlation (DIC) for strain measurement on the sample surface by GOM CORRELATE 2019. Images of the sample before and after compression testing are obtained by digital confocal microscopy (Keyence VHX5000). Image analysis is performed via ImageJ software for the calculation of the relative porosity of the samples. For measuring the relative density, the Archimedes principle is not used as the open cavities are impregnated by water leading to inaccurate density values. The images of the cellular solids are taken by digital confocal microscopy for assessing the geometrical accuracies of the manufactured lattices in comparison to CAD models.
2.3. Compression Test Simulations
The imported CAD models (STP files) are analyzed in ABAQUS CAE 2017. In-house developed PYTHON script files are used for calculating the porosity, surface area and volumes of cellular solids from the CAD files in ABAQUS CAE 2017. The CAD models are assigned the material properties (density, elastic modulus and stress-strain response) of Ti6Al7Nb alloy. As imposed boundary conditions during the simulation, the upper clamping structure is fixed, and the lower clamping structure is moved by 5 mm in the upward direction. The nested and non-nested regions of the cellular solids are appropriately partitioned to enable smooth meshing. Variable mesh size is applied to mesh the nested/non-nested and the clamping structures. The nested and non-nested structures have meshed with a 0.2 mm seed size. The clamping structures have meshed with a 2 mm seed size. A total of 9710 hexahedral elements (C3D8R: 8 nodes linear 3D stress) containing 13,321 nodes are used to mesh the cellular solids. A meshing bias is performed from the nested structure to the clamping structures resulting in smooth mesh transitions. Simulations are performed in parallel computing mode with 16 processors.
2.4. Thermal Insulation Properties of Cellular Solids
For testing the effective thermal insulation properties of the cellular solids, the samples are placed on a hotplate (IKA C-MAG HS7) heated to 323 K (50 °C), 348 K (75 °C), 373 K (100 °C), 398 K (125 °C), 423 K (150 °C) and 473 K (200 °C). A thermocouple placed on the hotplate measures the hotplate temperature and is used as internal feedback for regulating the temperature. Additionally, a handheld thermocouple is used to cross-check the hot plate temperature. The temperature distribution on the faces of the cellular solids is measured by an infrared (IR) camera (VarioCAM HD 900) placed 15 cm from the hotplate. The IR camera has a high resolution for temperature measurement (1.5 K). Before starting the temperature data collection, the IR camera lens is focused on the sample surface. In the next step, the cellular solids are exposed to predefined temperatures for 600 s before measuring the temperature. The analysis of the IR camera data is performed with the software IRBIS 3.1. The primary heat transfer mechanism during the experiment is heat conduction and natural convection as the experiment is performed in a room environment where the air was still (i.e., natural convection).
2.5. Temperature and Residual Stress Simulations
Decoupled thermal displacement simulations upon heating and subsequent cooling of the samples (without the clamping structures) are conducted in ABAQUS CAE 2017 using the imported CAD models (STP files). The simulations are performed to determine the temperature distribution during heating and residual stress upon cooling in the cellular solids (without the clamping structures). For this, the simulation is performed in two stages: (1) the temperature distribution in the cellular solids upon heating to the predefined temperature for 600 s is performed in the first stage, and (2) the residual stress distribution in the sample upon cooling to room temperature is simulated by using the temperature distribution profile from the previous heating stage. Here, the temperature-dependent material properties (thermal conductivity, density, elastic modulus, thermal expansion coefficient, stress-strain curve, and specific heat) of the Ti6Al7Nb alloy are assigned to the cellular solids. The initial boundary conditions imposed on the cellular solids are (1) the cellular solid’s surface touching the hotplate is fixed and maintained at the predefined temperature, and (2) all other surfaces of the cellular solid (except the surface touching the hot plate) are maintained at room temperature (298 K). Moreover, a convective heat transfer model is imposed with natural air convective coefficient of 1 W/m2 K, and an ambient air temperature of 298 K is assigned to the surfaces not touching the hot plate. A mesh seed size of 0.2 mm is used to mesh the cellular solids. Then 34,475 DC3D8 hexahedral elements (8 nodes linear heat transfer) containing 49,712 nodes are used for meshing the cellular solids in the heating stage (1st stage), and hexahedral elements (C3D8R: 8 nodes linear 3D stress) are used for meshing the cellular solid in the cooling stage (2nd stage). Job parallelization is performed during the simulation using 16 processors.
3. Results
3.1. Powder Particle Investigation
Figure 1a presents the scanning electron microscopy (SEM) image of the Ti6Al7Nb powder particles. The powder particles are spherical with a varying size distribution. Only some smaller powder particles are attached to bigger powder particles. The particle size distribution (fitted with log-normal distribution) is presented in Figure 1b. As can be seen, the size of the powder particles varies between 10 μm–90 μm. The average size of the Ti6Al7Nb powder particles is 43 μm.
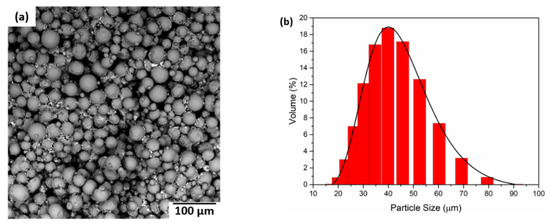
Figure 1.
SEM micrograph of the Ti6Al7Nb powder particles (a); and (b) powder particle size distribution of the Ti6Al7Nb particles.
3.2. Optical Microscopy and Metrology
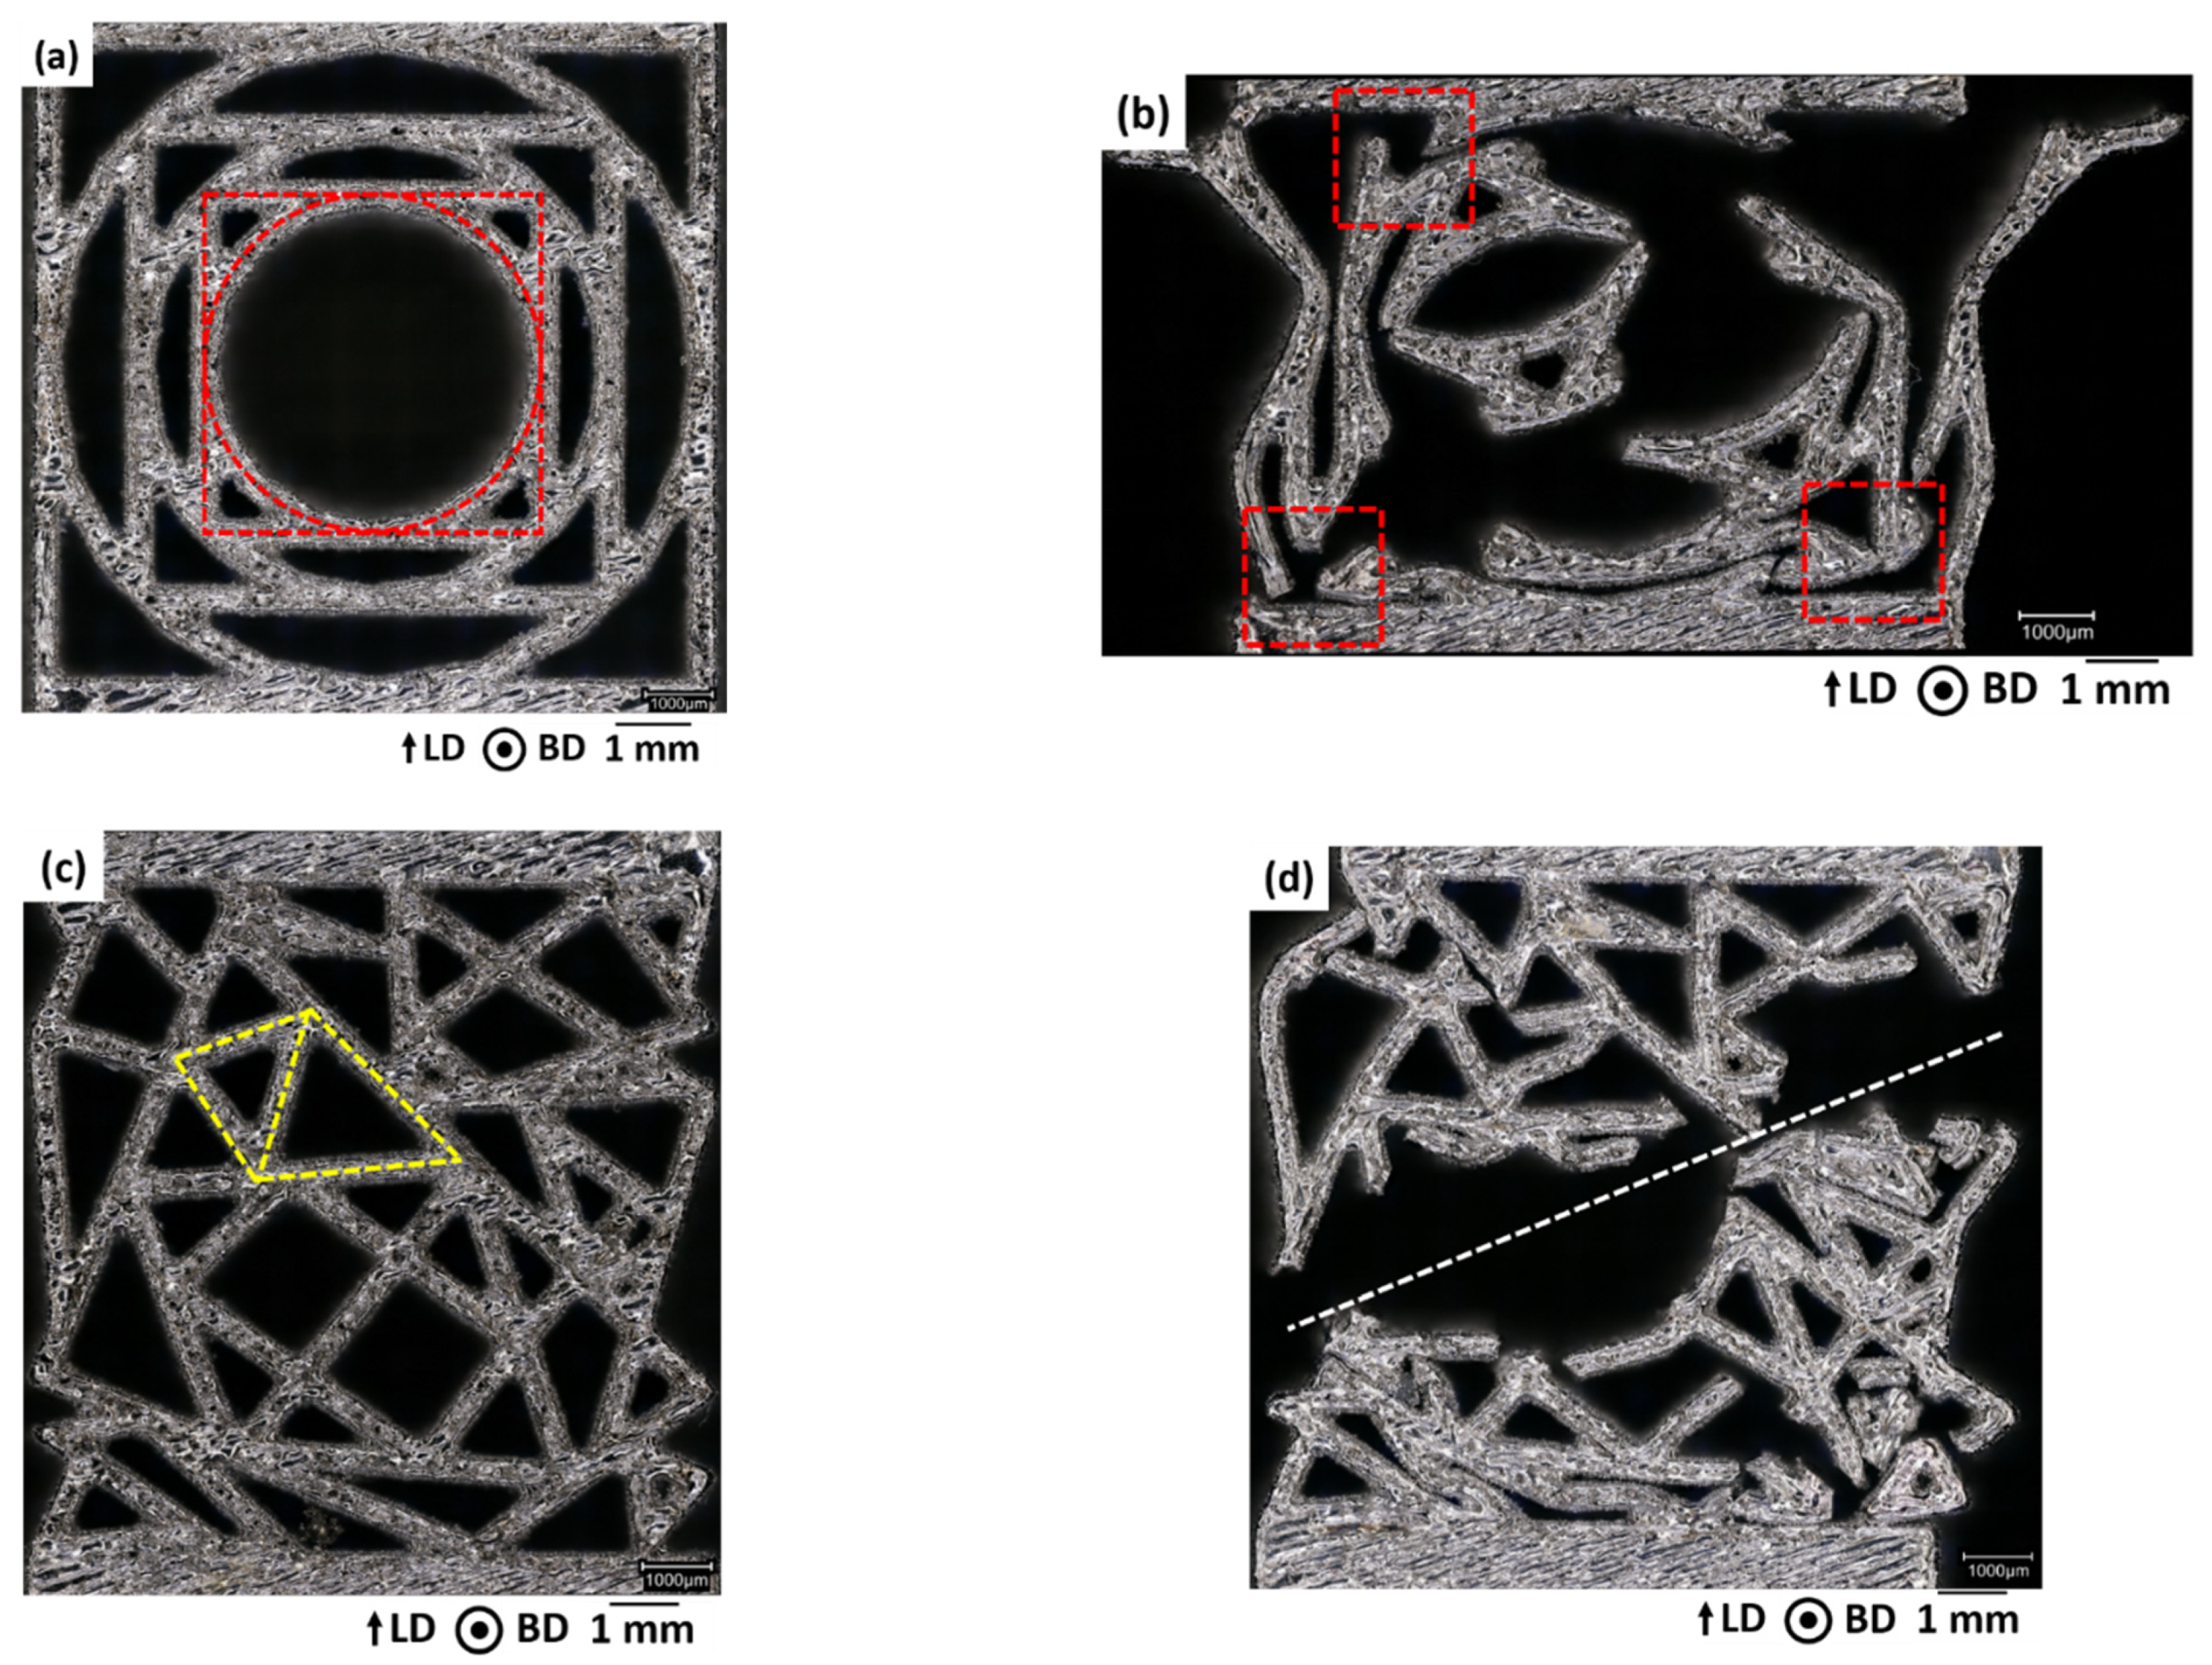
Figure 2 presents the optical micrographs of the cellular solids before and after compression testing. The primary unit cells of the nested cellular solid are made of thin-walled circular and square structures (marked by red lines, Figure 2a). The optical micrograph of the sample after fracture is presented in Figure 2b. In the primary unit cells, the nodes collapse, which can be referred to as the main fracture mechanism (highlighted by red rectangles, Figure 2b). Figure 2c presents the optical micrograph of a non-nested cellular solid before compression testing. Here, the primary unit cells consist of triangles of different sizes which are marked by yellow lines (Figure 2c). Upon compression testing, the fracture surface shows a shear plane of fracture (white line, Figure 2d). The bending of the struts and the fracture of the nodes occur near the shear fracture plane.

Figure 2.
Optical micrographs of the (a,c) nested cellular solid; (b,d) non-nested cellular solid; (a,b) before; and (c,d) after 50% strain. BD is the build direction and LD is the loading direction. Red and yellow lines mark the unit cell of the nested and non-nested cellular solid, respectively. The loading direction along the vertical direction. The build direction is perpendicular to the surface plane in Figure 2. The white line represents the shear fracture plane in Figure 2d.
Table 1 summarizes the struts thickness of the CAD models and the as-built samples. In the as-built samples, the strut thickness increases by 0.14 mm compared to the CAD model. This is due to the sticking of the unmelted powder particles to the struts during solidification and the larger size of the melt pool compared to the laser spot size.

Table 1.
Comparison of strut thickness for the CAD model and as-built samples.
The qualitative variation of the surface topography is presented in Figure 3. Both cell types show little variation in their surface topographies for the as-built condition.
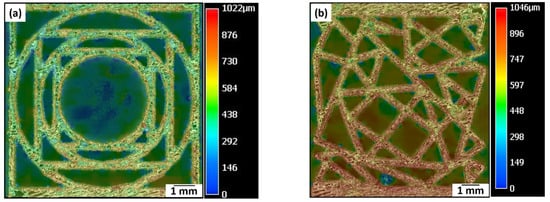
Figure 3.
Variation of surface topographies of the (a) nested cellular solid; and (b) non-nested cellular solid before compression testing in the as-built condition.
3.3. Compression Testing
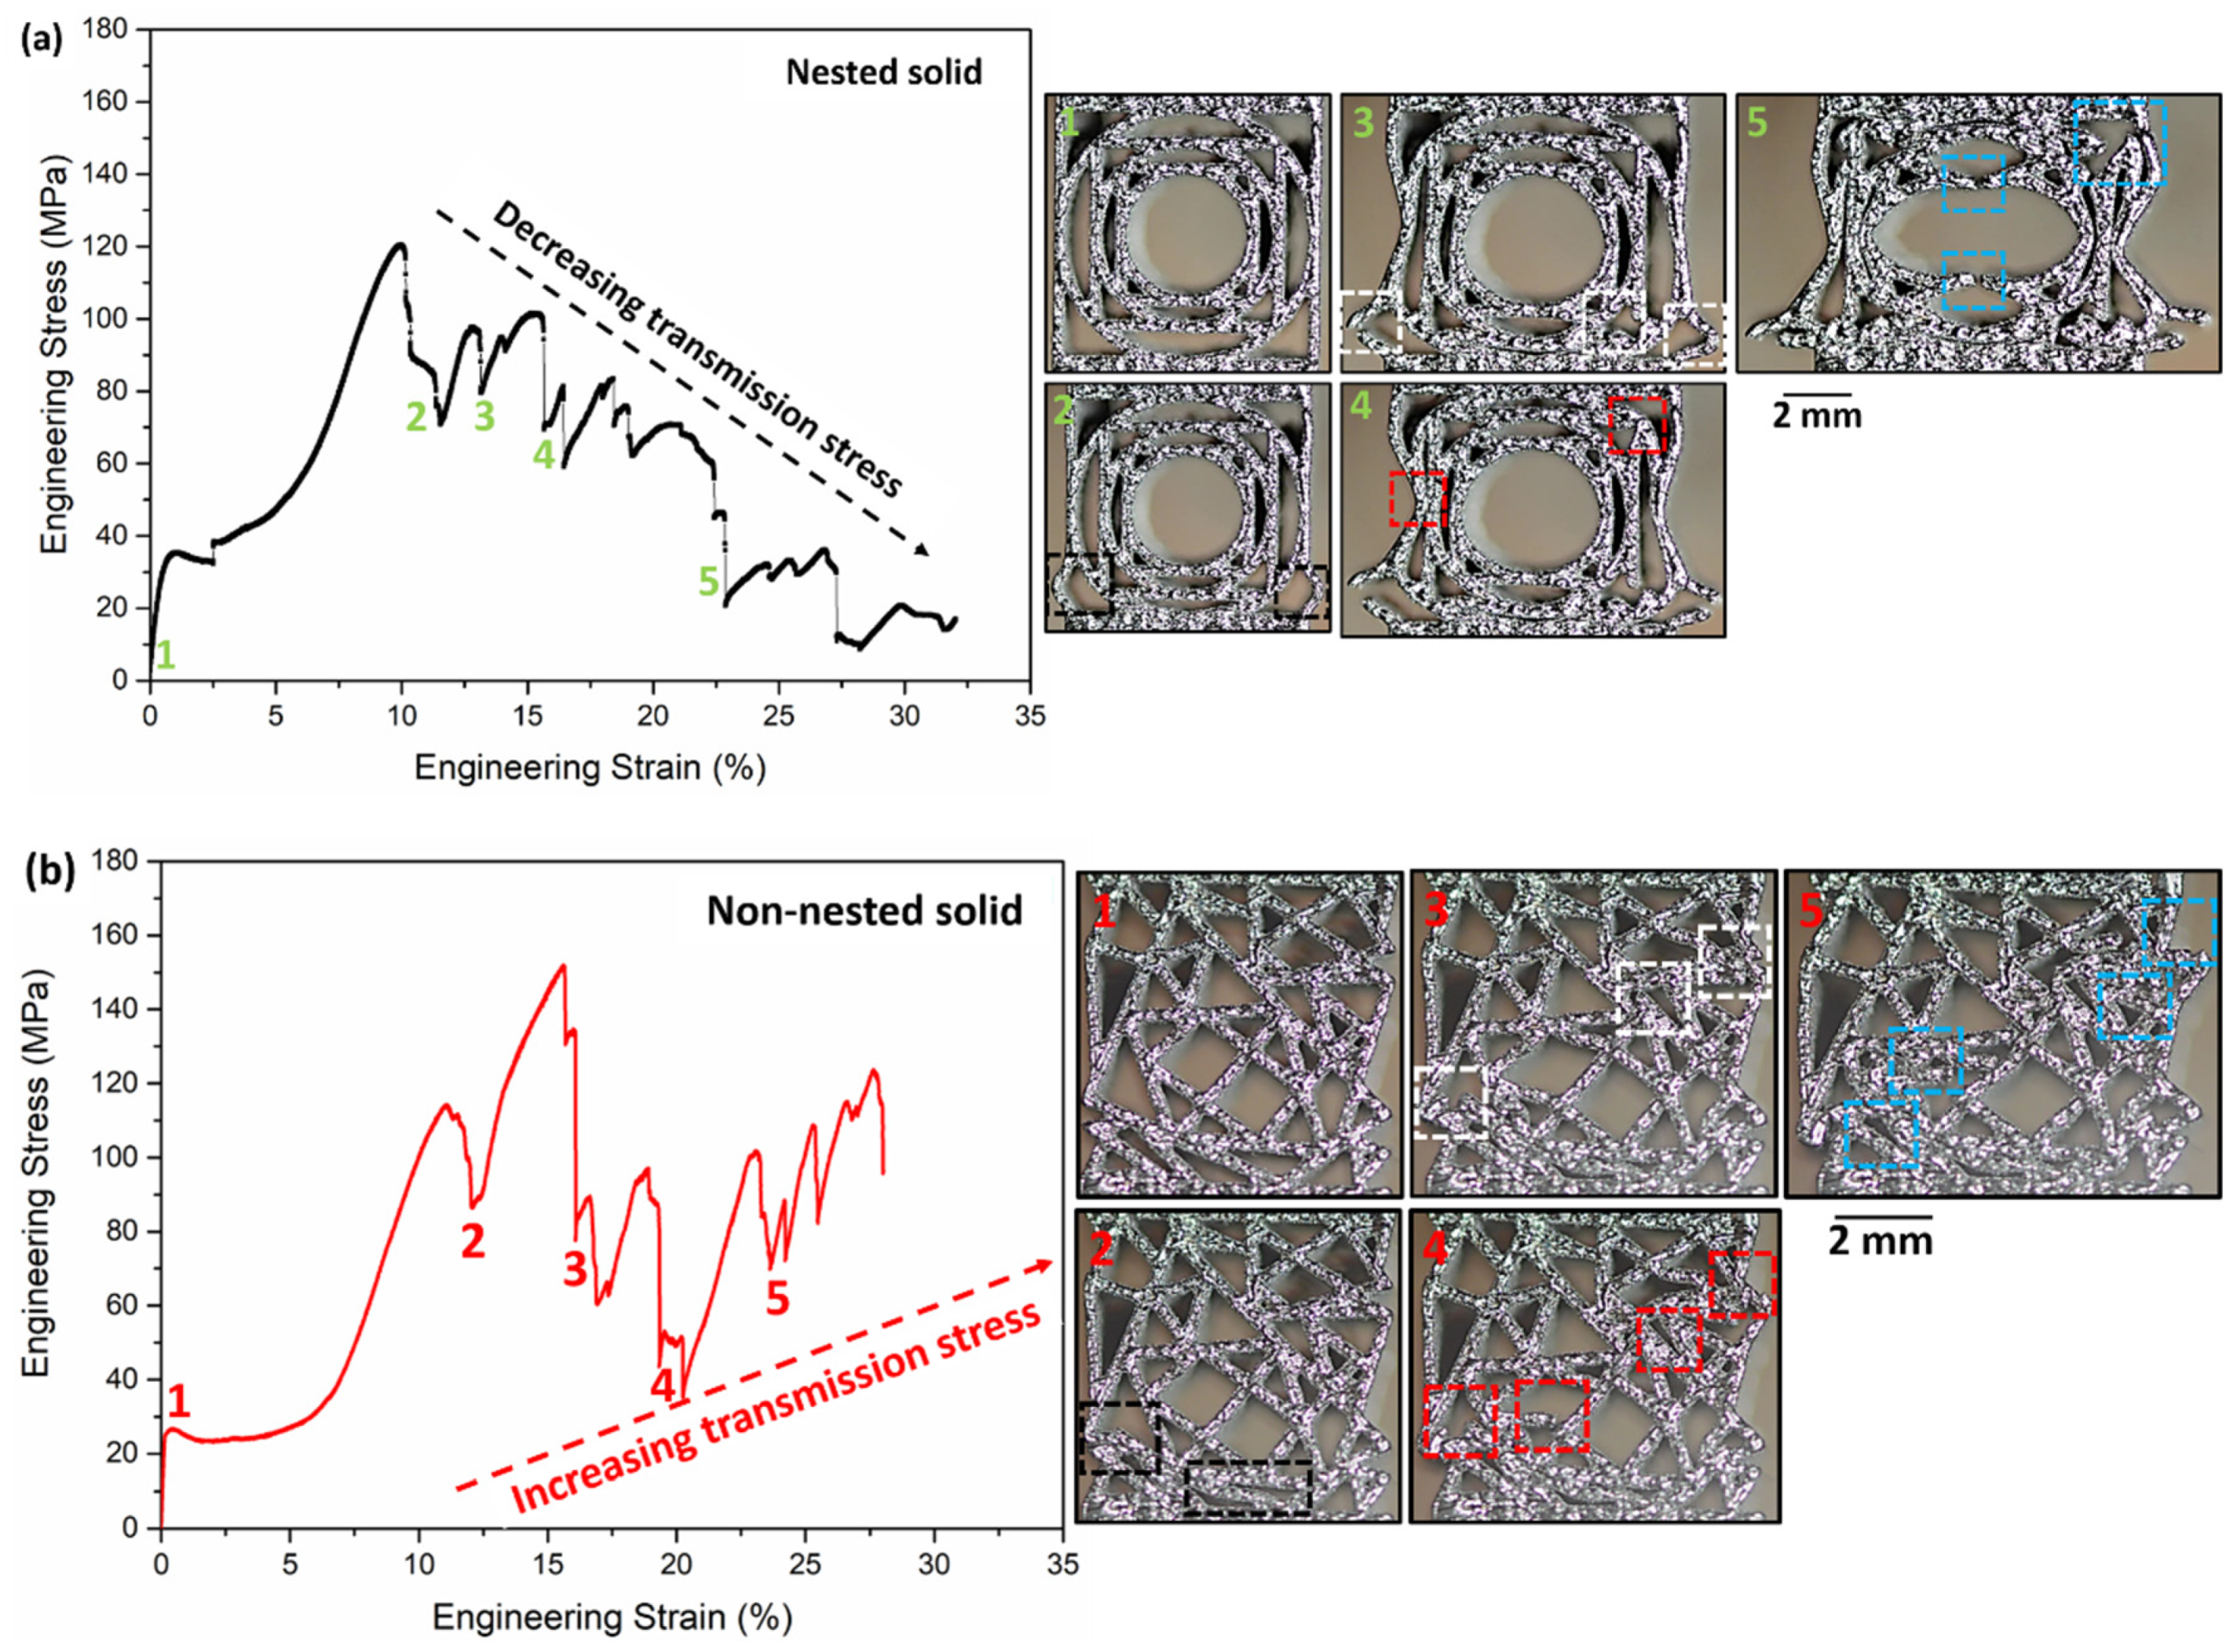
Figure 4a presents the engineering stress-strain curve of the nested cellular solid. The images on the right side of Figure 4a highlight the deformation of the nested cellular solid at different engineering strains (marked by green points). Here, green point 1 represents the nested cellular solid at 0% engineering strain. The peak stress of the nested cellular solid is achieved at 120 MPa corresponding to ≈10% engineering strain. The peak stress is due to the stiffness of the nested cellular solid upon compression. After achieving the peak stress, the engineering stress decreases. This is attributed to the bending of the outer vertical struts (highlighted by black squares) in the lower sections of the nested cellular solid as represented by green point 2 at 12% engineering strain. In the following, the engineering stress increases due to the bending of the struts. At green point 3, the decrease of the engineering stress is due to the failure of the struts (highlighted by white squares). After the failure of the outer vertical struts, the stress increases due to load-bearing by other vertical struts. Now, due to the failure of the nodes in the nested cellular solid (highlighted by red squares), the stress value decreases (green point 4, engineering strain ≈15.6%). At 23% (green point 5), the engineering strain depicts the failures of nodes marked by blue squares. The node failure occurs in the centre and at the corner of the nested cellular solid.
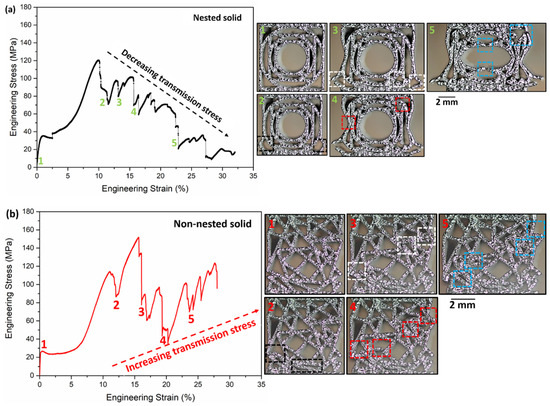
Figure 4.
Compression stress-strain curves for (a) nested cellular solid; and (b) non-nested cellular solids. The pictures in (a,b) present the bending and fracture of struts in the samples at different engineering strains (marked by points 1, 2, 3, 4 and 5).
Figure 4b depicts the stress-strain curve of the non-nested cellular solid along with images of the deformation of the non-nested cellular solid during compression. Here, the images are shown for the corresponding red points on the engineering stress-strain curve. For red point 1, there appears to be no change in the structure of the non-nested cellular solid. After increasing stress up to 110 MPa, a decrease in stress (red point 2) due to the bending of the bottom struts (highlighted by black rectangles) occurs. The stress further increases followed by a decrease (red point 3) due to the collapsing of struts (highlighted by white rectangles) in the outer regions of the structure. The stress increases further for a short period but falls at red point 4 due to the collapse of the struts in the region marked by red rectangles. In the following, the stress further increases again followed by a decrease at red point 5 due to the failure of struts in the blue rectangular region. It is noticed that the red rectangles at red point 3 are near the white rectangles at red point 4 and blue rectangles at red point 5. These rectangles are along the shear plane oriented at approximately ≈45° to the compression axis. Thus, the non-nested cellular solid fail by shear.
The various properties of the nested and non-nested cellular solids are calculated in Table 2. The theoretical surface area, theoretical volume and theoretical porosity are calculated from the corresponding CAD models. Here, the nominal surface area is the ratio of the surface area to the volume of the bounding box of the cellular solid. Both the theoretical volume and the theoretical porosity of the nested and non-nested cellular solids are similar. Thus, both cell types are good choices for space-filling during topology optimisation. The experimental porosity of both the cell types is slightly lower than the theoretical porosity due to the increase in strut thickness of the as-built sample. The compressive yield stress is similar as well, but the maximum compressive stress of the non-nested cellular solid is higher than for the nested cellular solid. The fracture strain and the total energy absorbed per unit weight of both cellular solids are similar. However, the non-nested cellular solid is stiffer than the nested cellular solids.
Table 2.
Properties of the nested and non-nested cellular solids.
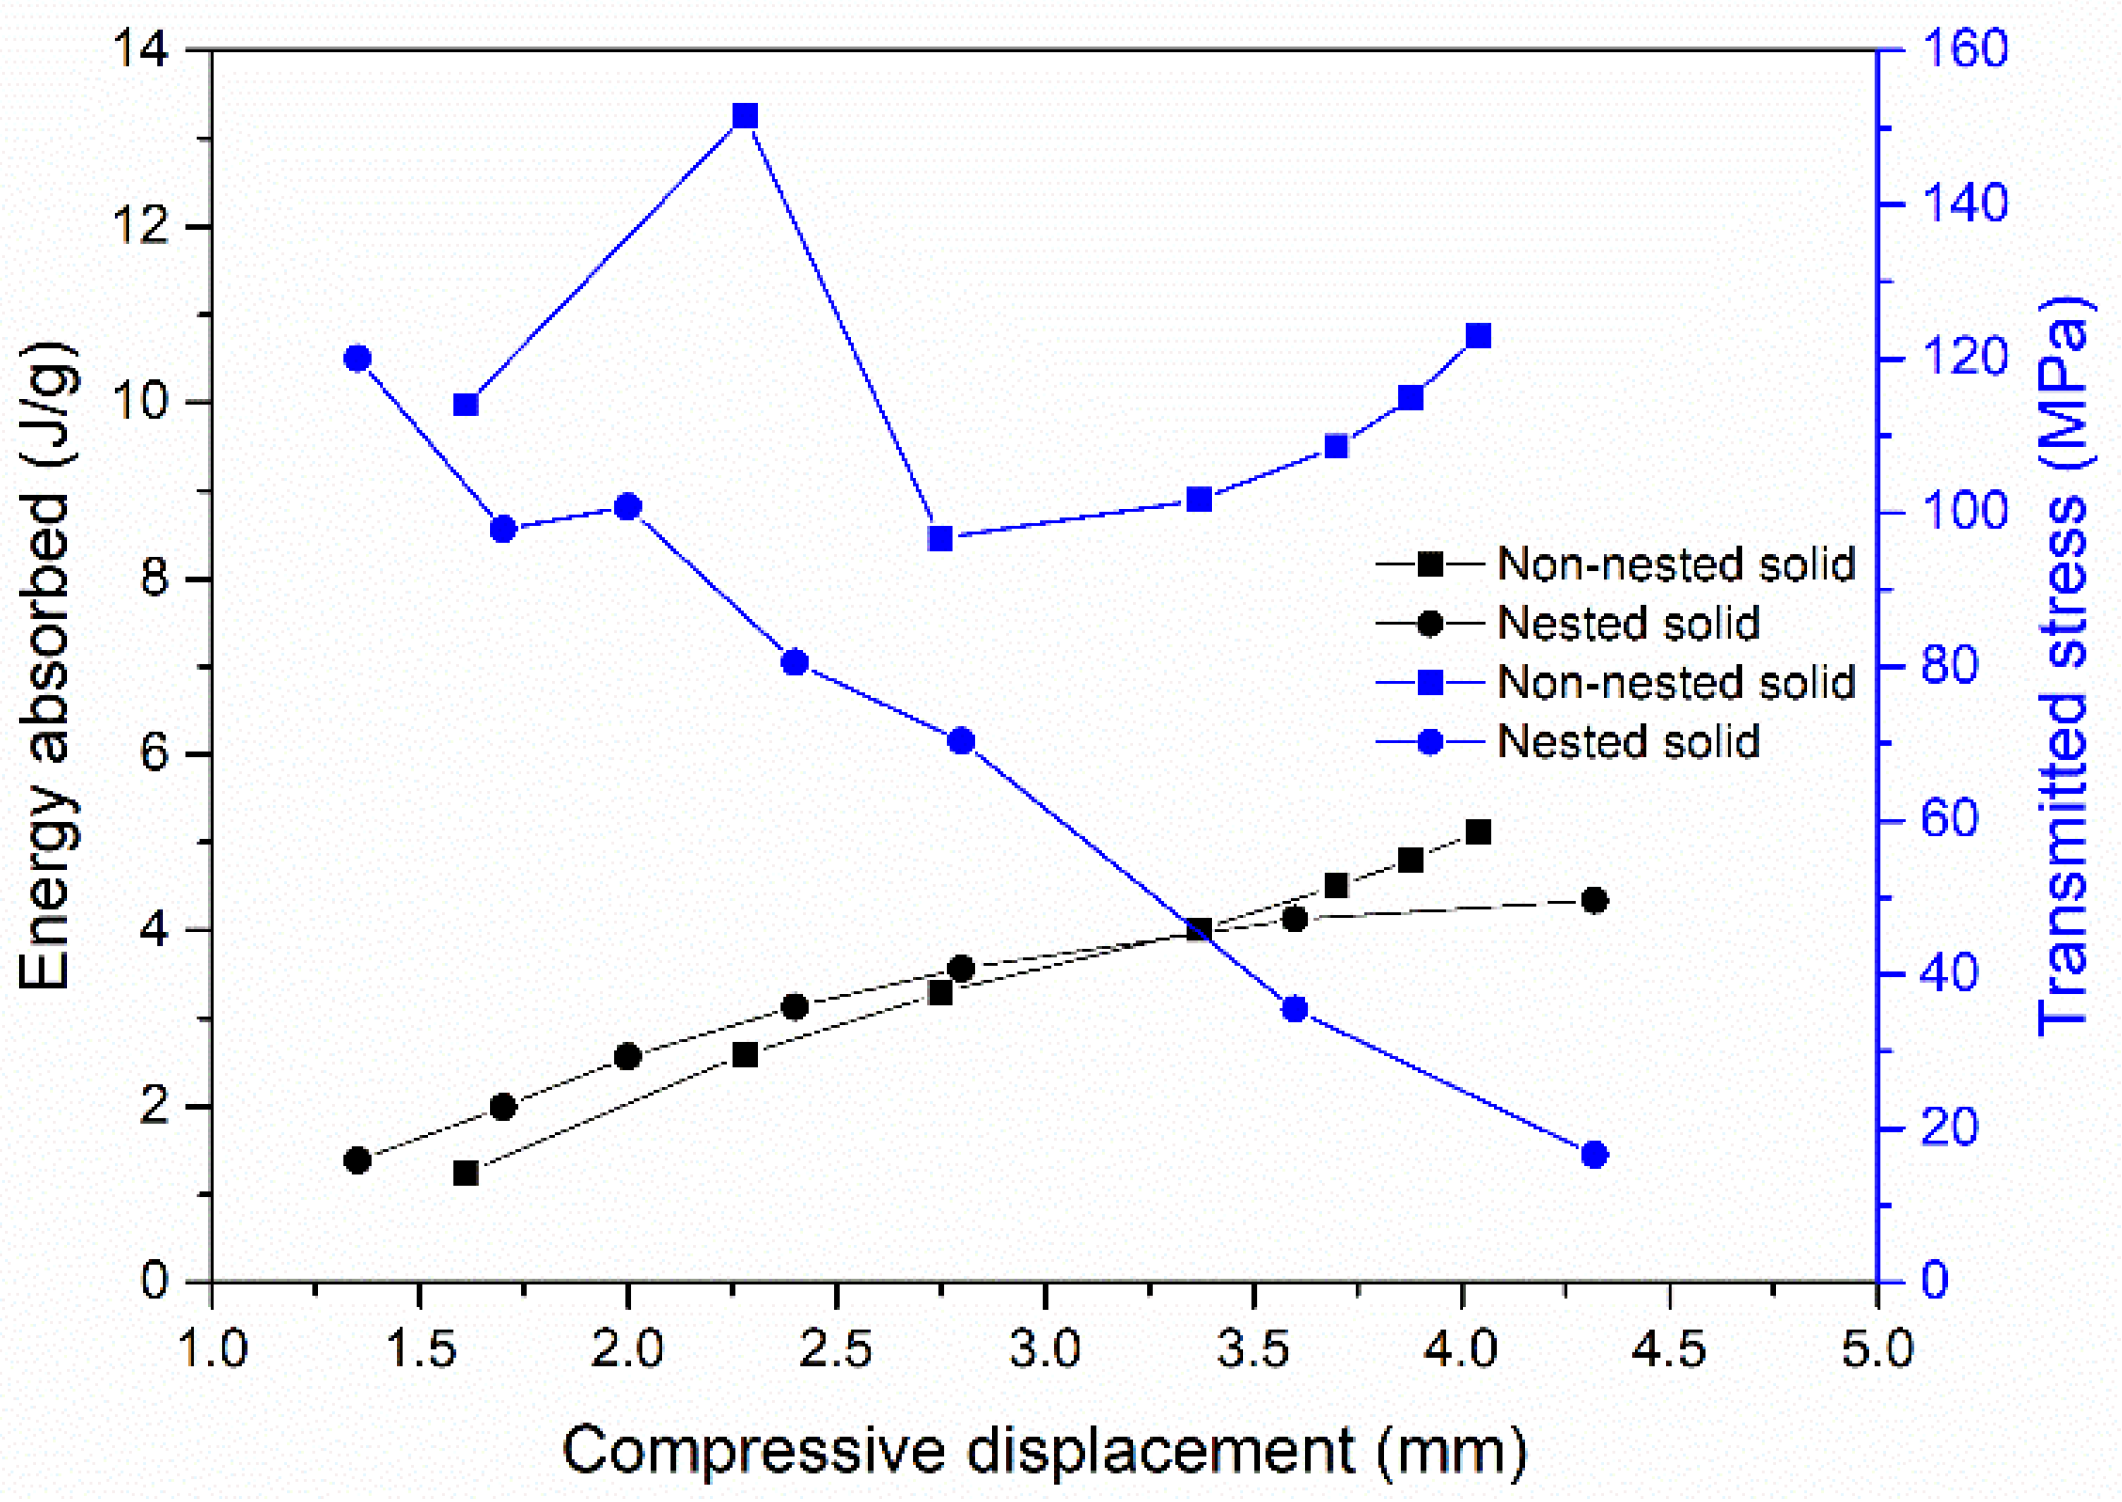
An interesting observation from the engineering stress-strain curve in Figure 4 is the variation of the transmitted stress after reaching the maximum compressive stress. To understand this, a variation of energy absorbed, and stress transmitted during compression testing is plotted for both cell types (Figure 5). For the nested cellular solid, the transmitted stress decreases with increased compressive displacement, whereas the transmitted stress increases with compressive displacement for the non-nested cellular solid. Initially, the energy absorbed by both solids increases with increasing compressive displacement. Up to 3.8 mm compressive displacement, the energy absorbed by the nested cellular solid is higher than the non-nested cellular solid. From 3.8 mm to 5 mm compressive displacement, the energy absorbed by the nested solid is lower than the non-nested cellular solid. This is due to the increasing transmitted stress with displacement for the non-nested cellular solid. Thus, for a similar amount of energy absorbed, the nested cellular solids transmit lower stress compared to the non-nested cellular solids. This behaviour can be used in the successful design of helmets as they have to absorb energy due to impact loads but transmit a lower amount of force.

Figure 5.
Variation of energy absorbed (J/g) and transmitted stress (MPa) with compressive displacement during the compression of nested cellular solid; and non-nested cellular solid.
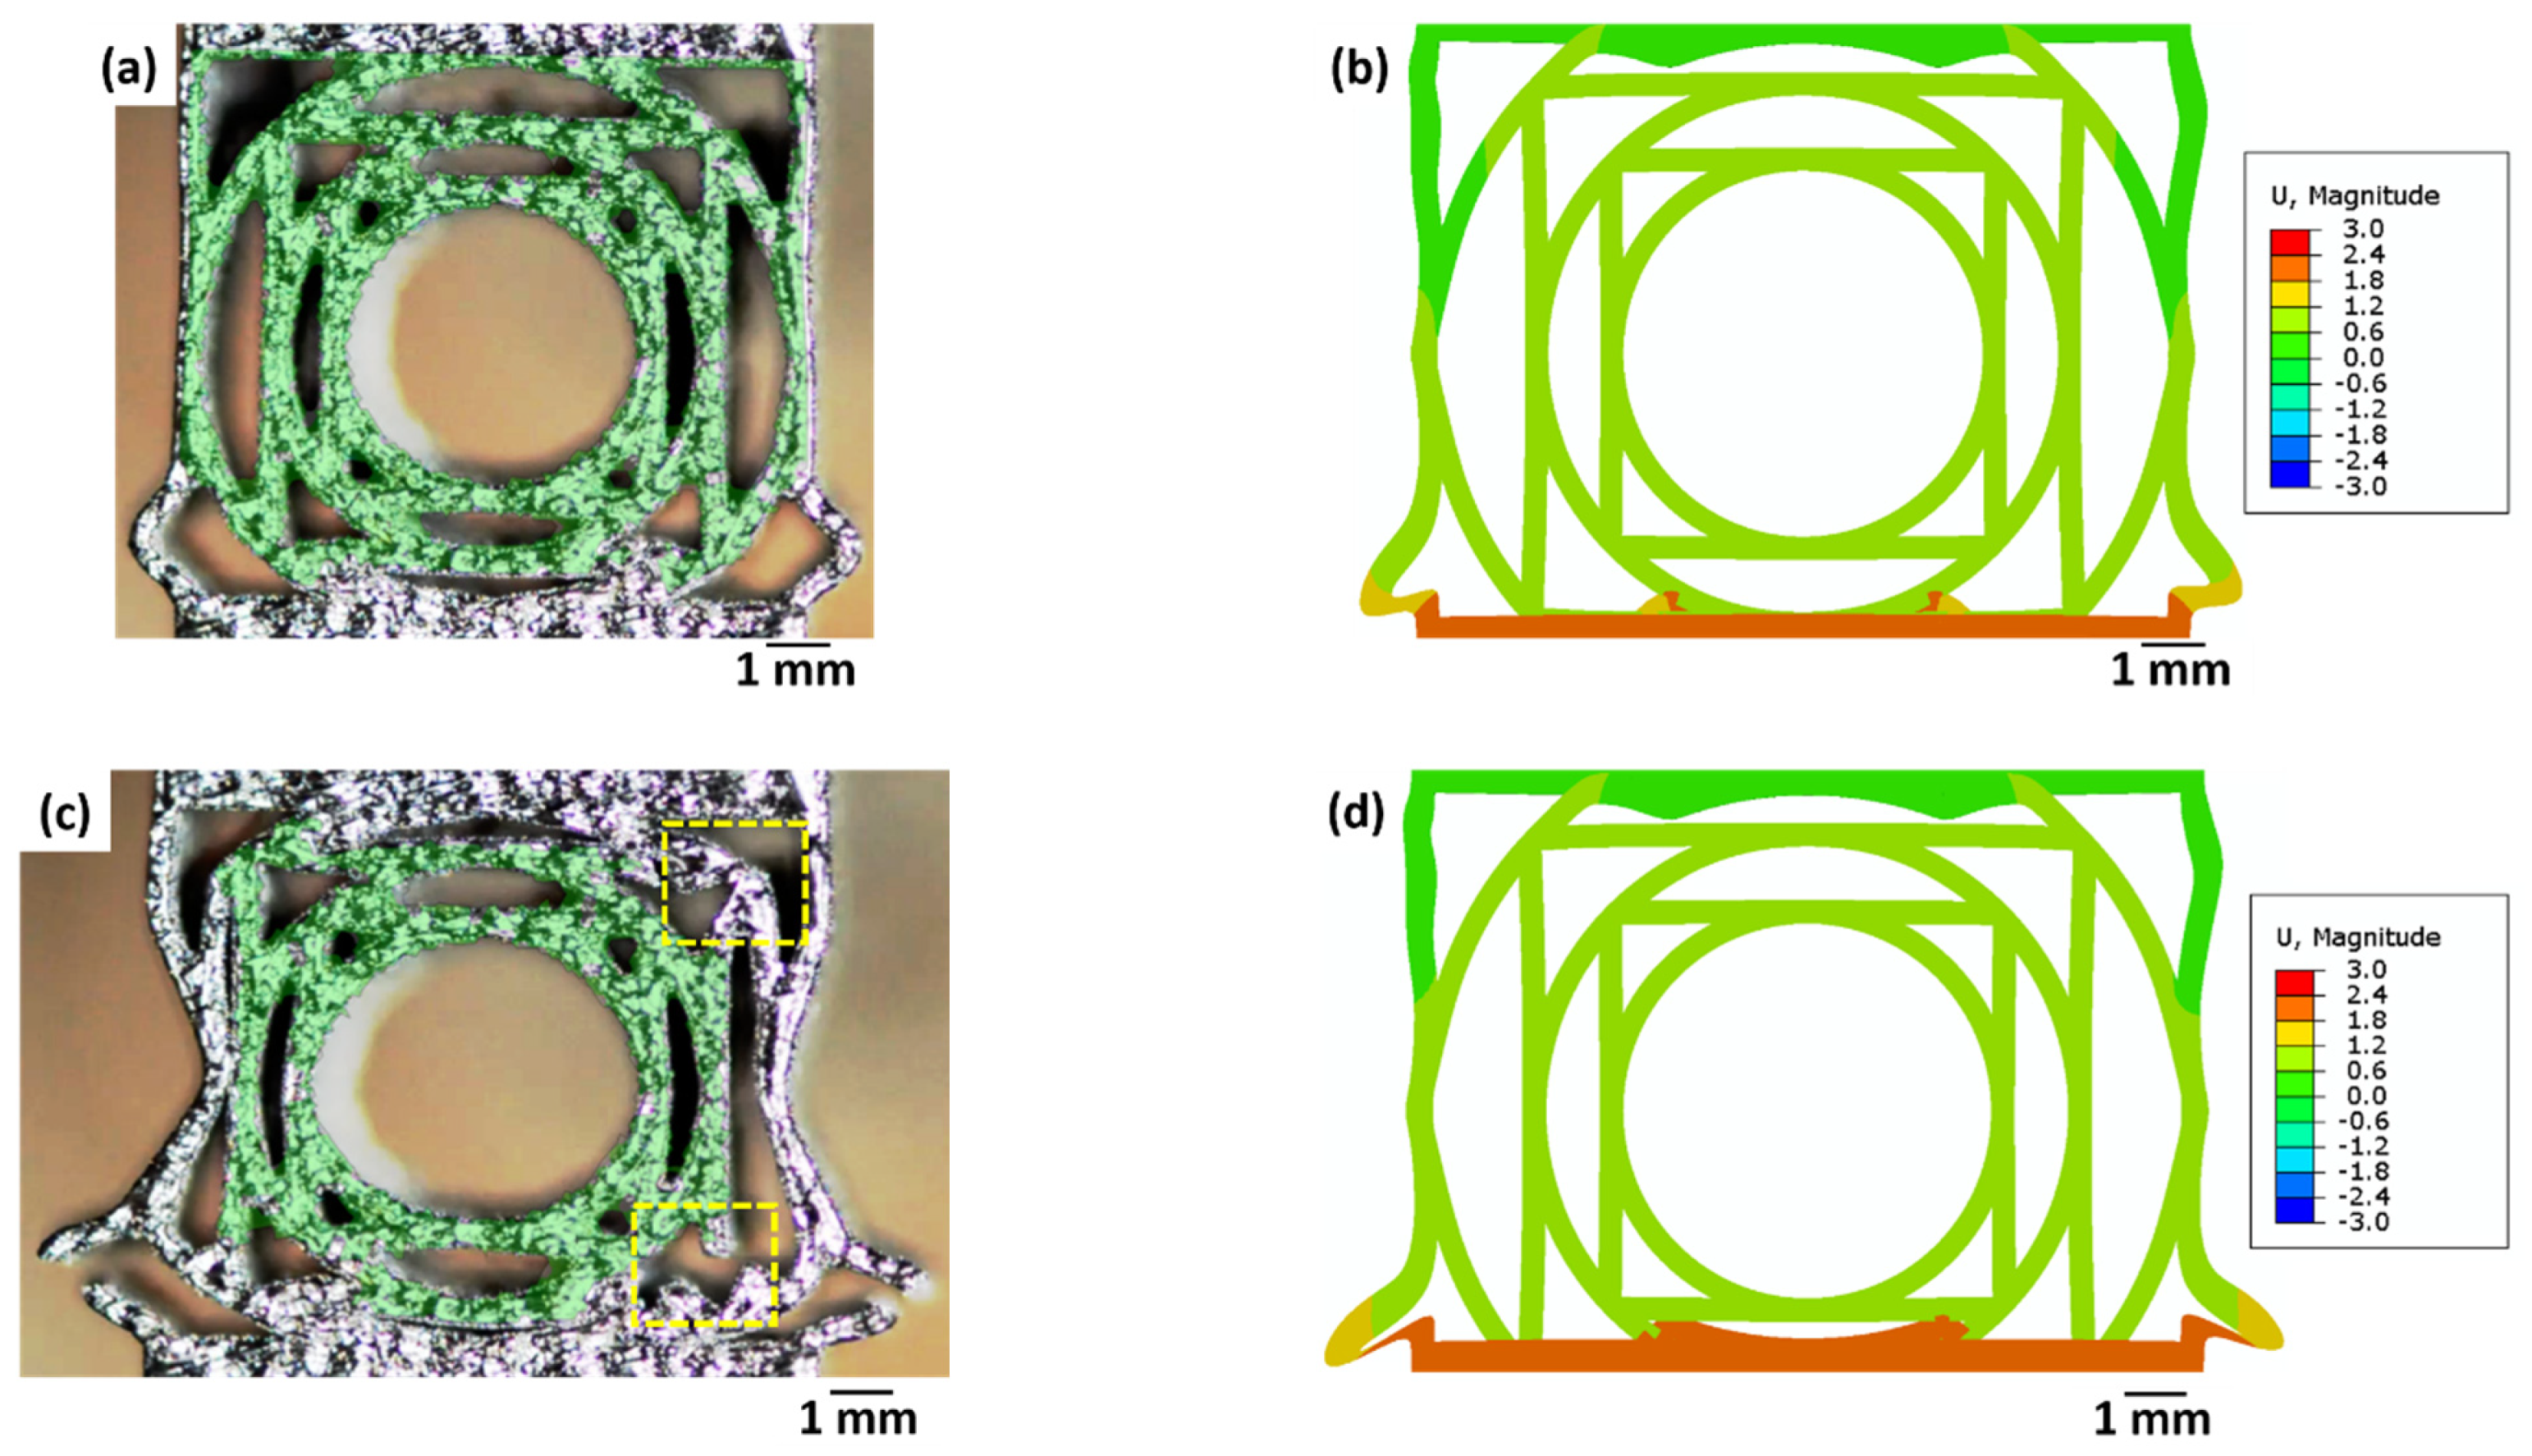
Figure 6 presents strain distribution on the surface of the nested and non-nested solids determined by experiments and simulations at 12% strain (green point 2, Figure 4a) and 16% strain (green point 4, Figure 4a). In Figure 6a, at green point 2 (12% strain) the buckling of the outermost struts is visible. The strain in the inner regions of the nested cellular solid is significantly low (0.6%). The experimentally measured strain distribution (Figure 6a) is supported by FEM simulations at 12% strain (Figure 6b). There is a consistent match between the experimentally measured DIC strain and FEM computed strain values. This indicates that the material model used during the simulation matches is consistent with the experimental material behaviour. During the simulations, a ductile damage model in ABAQUS CAE 2017 is used which predicts the material behaviour accurately. At 16% strain, for green point 4 (16% strain) the fracture of the outermost struts and nodes (highlighted by yellow rectangles) is observed experimentally (Figure 6c). For this load case, a slight distortion of the inner regions is noticed (Figure 6c). The FEM simulations (Figure 6d) prove that the strain in the inner regions is lower despite the high applied external strain of 16%. Thus, the nested cellular solids perform stress shielding (preventing the transmission of stress to the internal region of the structure). Again, this principle can be effectively used for the design of helmets where shielding of the interior regions from external stress is required.
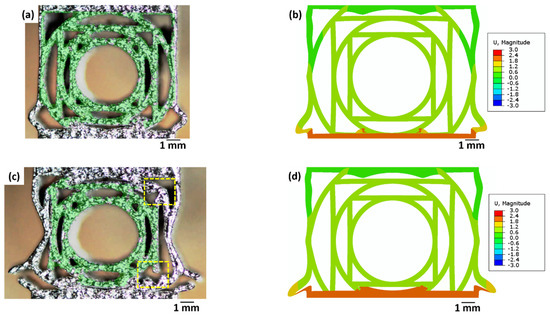
Figure 6.
Strain distribution in the nested cellular solid was measured by (a,c) DIC; and (b,d) FEM simulation. The strain distribution in (a,b) is plotted at 12% strain (green point 2, Figure 4a), and the strain distribution in (c,d) is plotted at 16% strain (green point 4, Figure 4a). Yellow rectangles in (c) highlight the failure of nodes; FEM simulations predict only strain magnitudes.
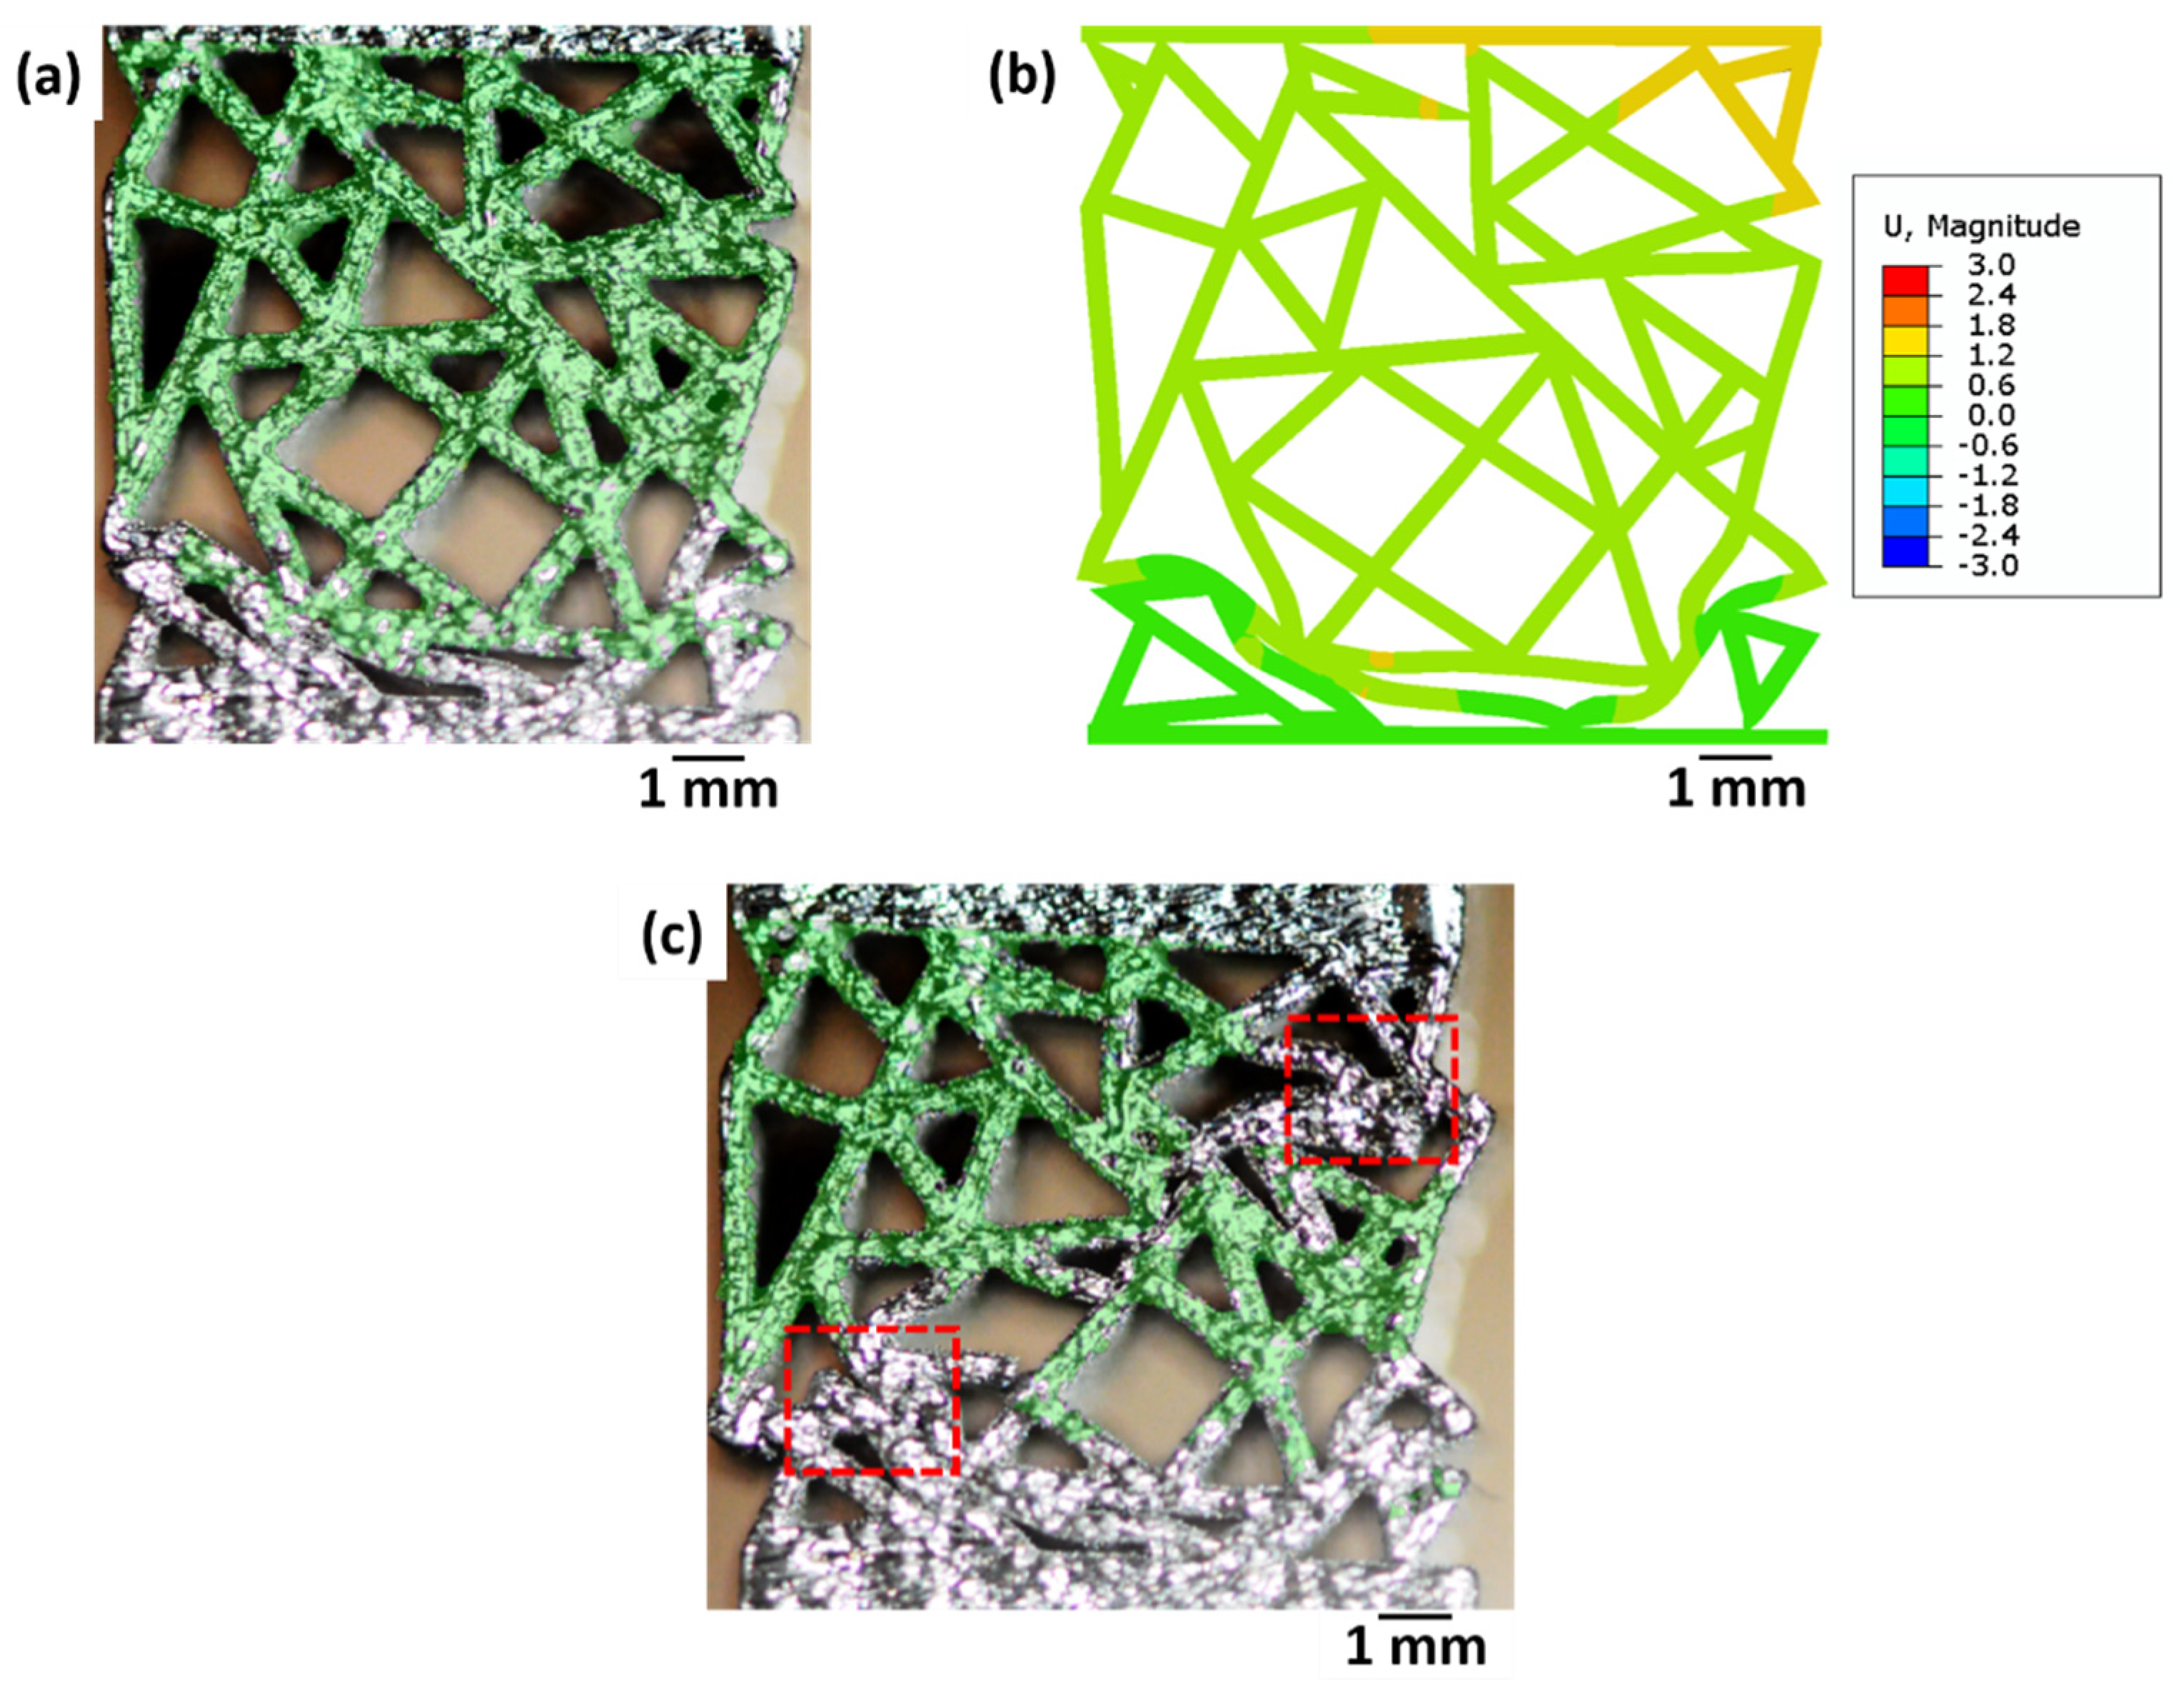
The surface strain distribution of the non-nested cellular solid obtained by experimentation and simulation at 12% strain (red point 2, Figure 4b) and 20% strain (red point 4, Figure 4b) is summarized in Figure 7. Bending of the nodes at 12% strain is noticed experimentally (Figure 7a). On the entire sample surface, the strain distribution appears uniform. FEM simulations show the surface strain distribution to be ≈1% in the non-nested cellular solid (Figure 7b). Upon 20% strain, the fractures of the nodes (highlighted by the red rectangle) in the interior regions of the non-nested cellular solid (Figure 7c) are obtained. The strain distribution on the sample surface is uniform; however, stress has propagated to the interior regions of the sample resulting in the failure of nodes in the interior regions. So, the non-nested cellular solid is not suitable for the design of safety helmets due to stress propagation to the internal regions of the structures.
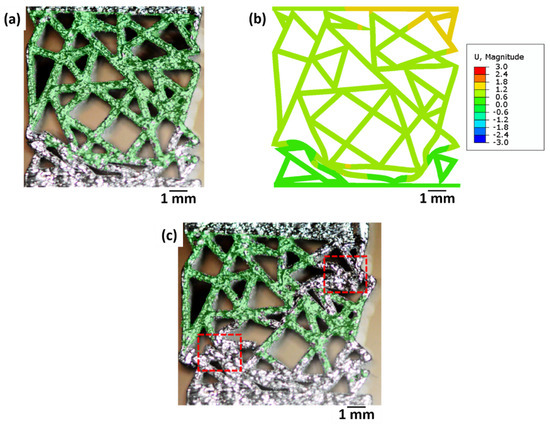
Figure 7.
Strain distribution in the non-nested cellular solid sample was measured by (a,c) DIC; and (b) FEM simulation. The strain distribution in (a,b) is plotted at 12% strain (red point 2, Figure 4b), and the strain distribution in (c) is plotted at 20% strain (red point 4, Figure 4b). Red rectangles in (c) show the failure of nodes; FEM simulations predict only the strain magnitudes.
3.4. Application of the Cellular Solids as Thermal Insulators under Natural Convection Conditions
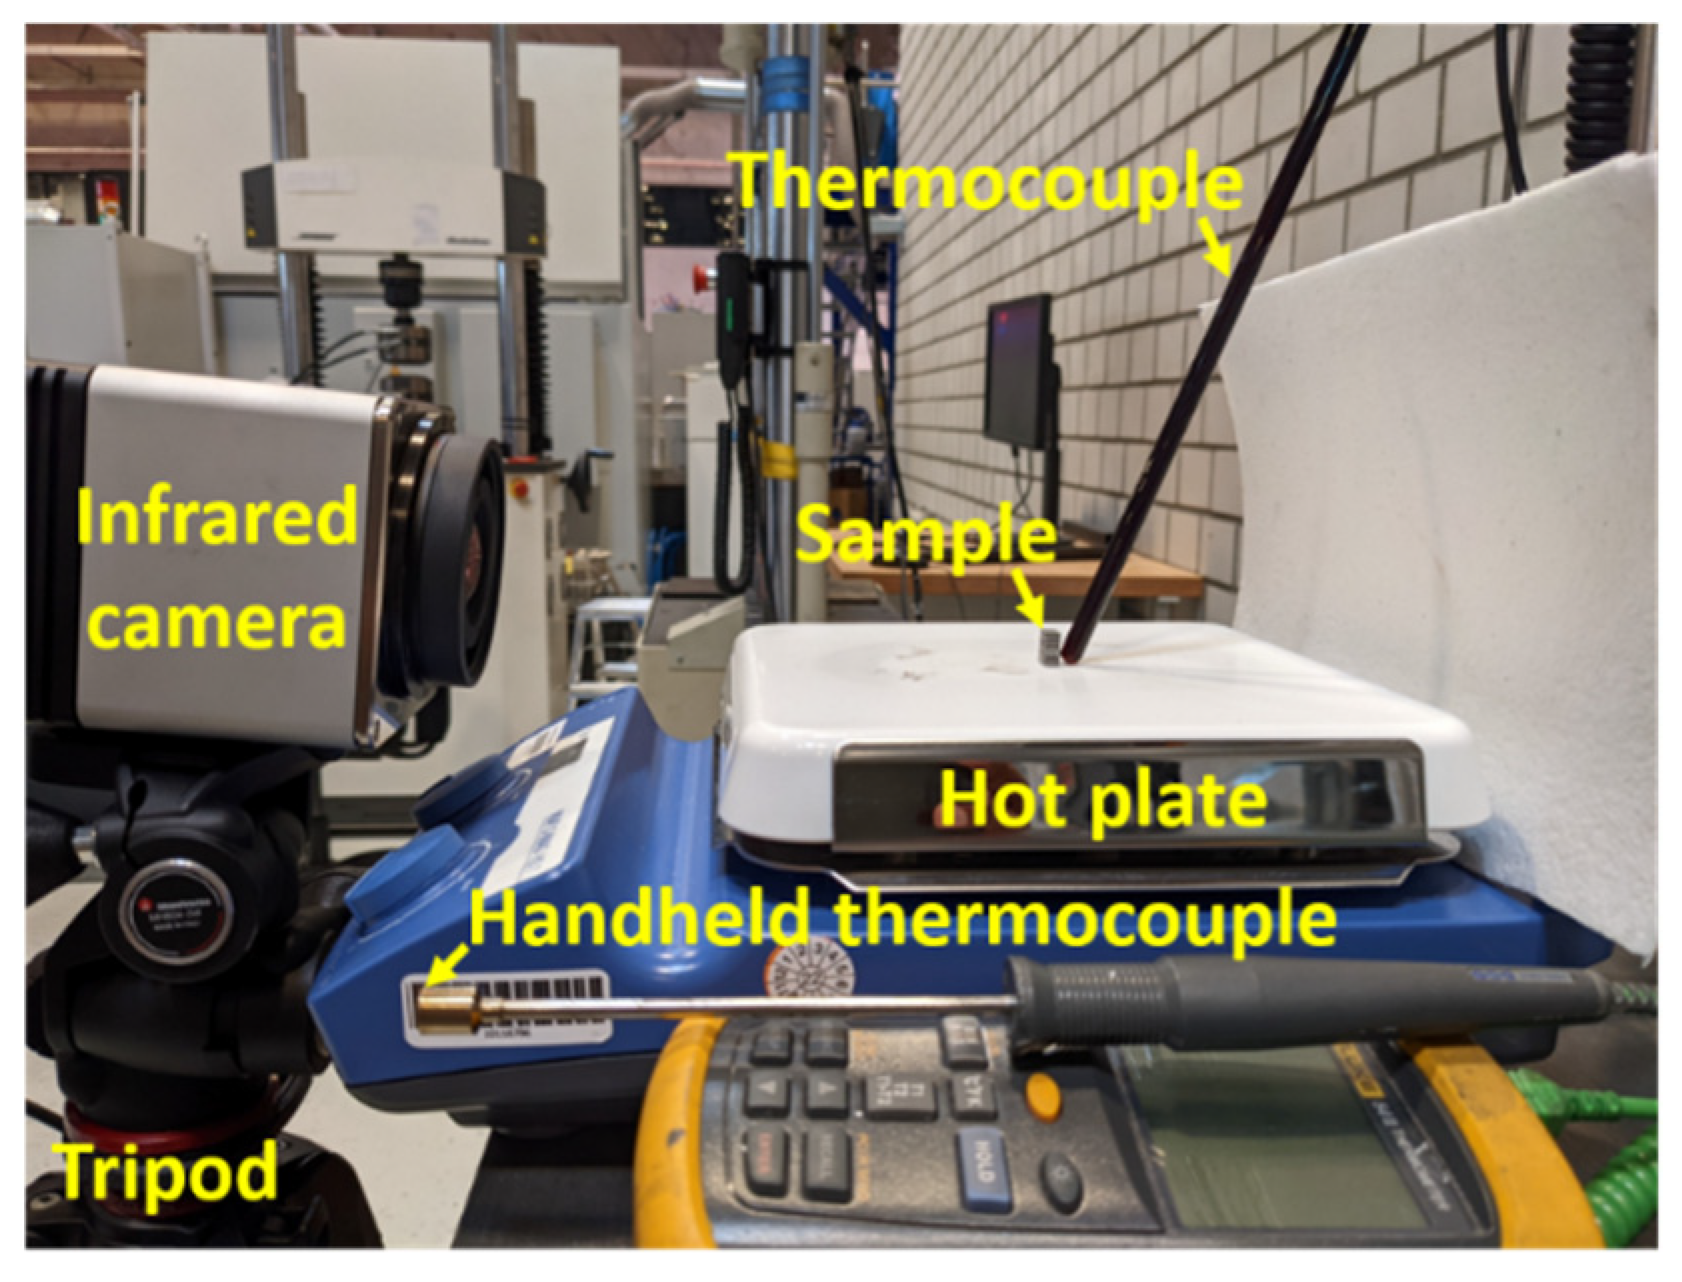
In Figure 8, the experimental setup to study the thermal insulation properties of nested and non-nested cellular solids is shown. The setup consists of a hotplate for heating the sample, an infrared camera for measuring the temperature distribution in the sample, a thermocouple on the hotplate to regulate the temperature and a handheld thermocouple to verify the hotplate temperature; a tripod stands to mount and focus the infrared camera.
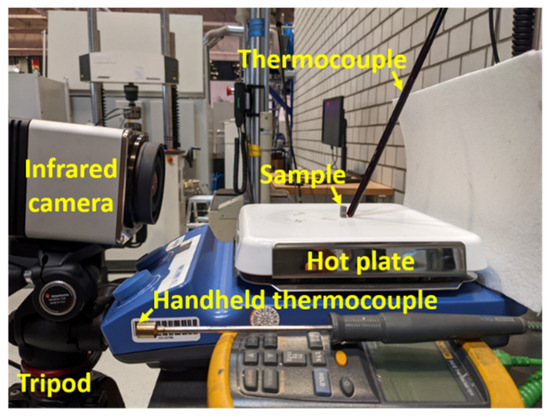
Figure 8.
Experimental setup to measure the thermal insulation properties of nested and non-nested cellular solids.
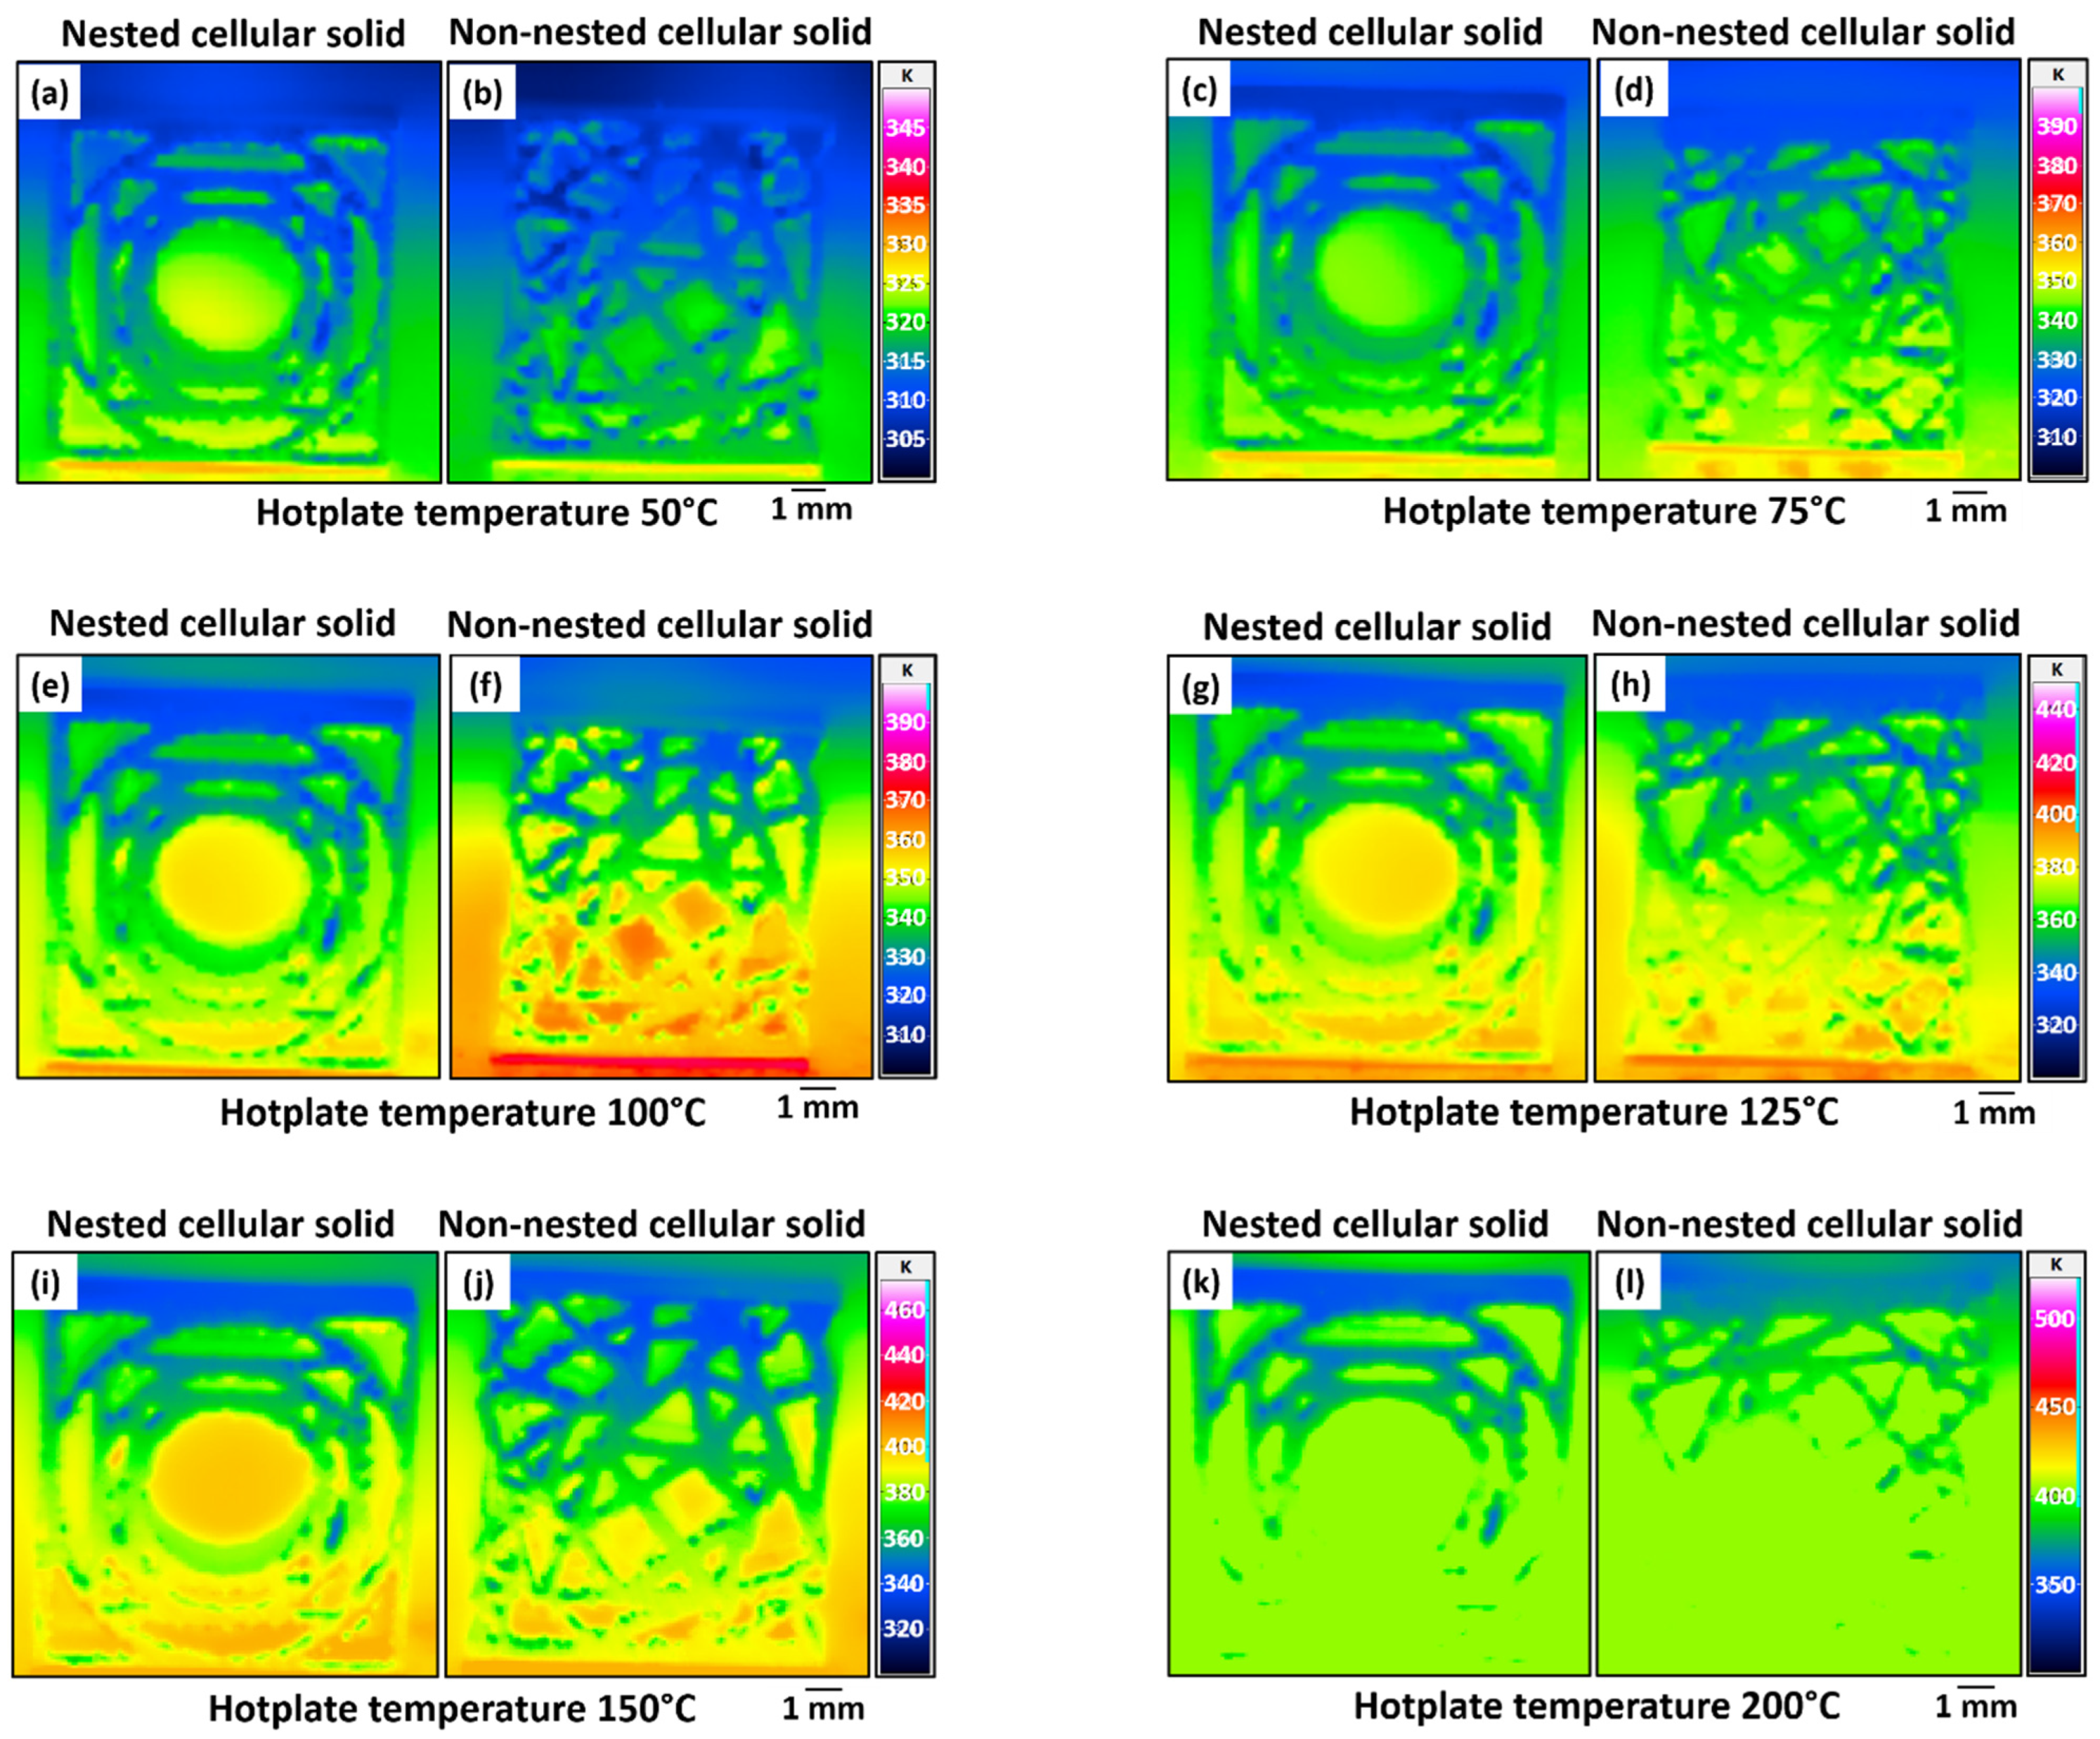
The temperature distribution profile on the surfaces of the cellular solids after exposure to the hotplate at different temperatures is presented in Figure 9. Intuitively, the bottom surface of the cellular solid in contact with the hotplate is at a high temperature compared to the top surface of the cellular solid. For the nested cellular solid, the vertical struts transfer heat more efficiently than the horizontal struts. For temperatures higher than 150 °C (Figure 9k,l), the temperature distribution could not be determined accurately due to the higher emissivity of the hotplate compared to the cellular solids. For a quantitative comparison of the thermal insulation performance of the cellular solids, the average temperature of the top and bottom surfaces is determined from the IR camera images and plotted in Figure 10.
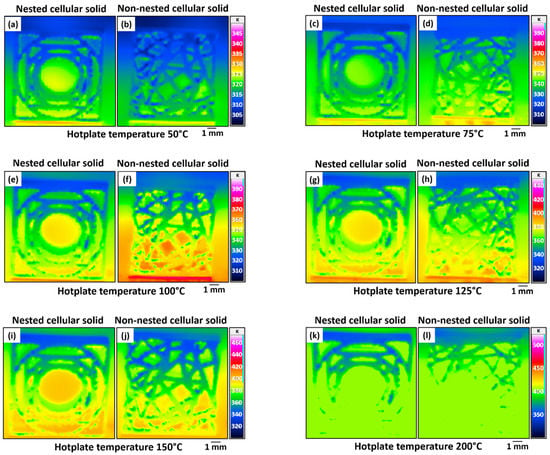
Figure 9.
Experimentally measured surface temperature distribution of the (a,c,e,g,i,k) nested and (b,d,f,h,j,l) non-nested cellular solids for hotplate temperature (a,b) 50 °C; (c,d) 75 °C; (e,f) 100 °C; (g,h) 125 °C; (i,j) 150 °C; and (k,l) 200 °C. The legend in Figure 9 shows the temperature in Kelvin.
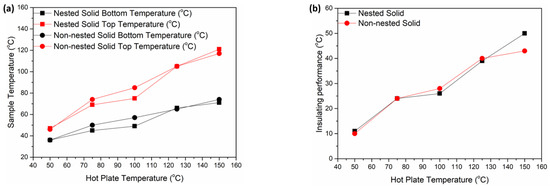
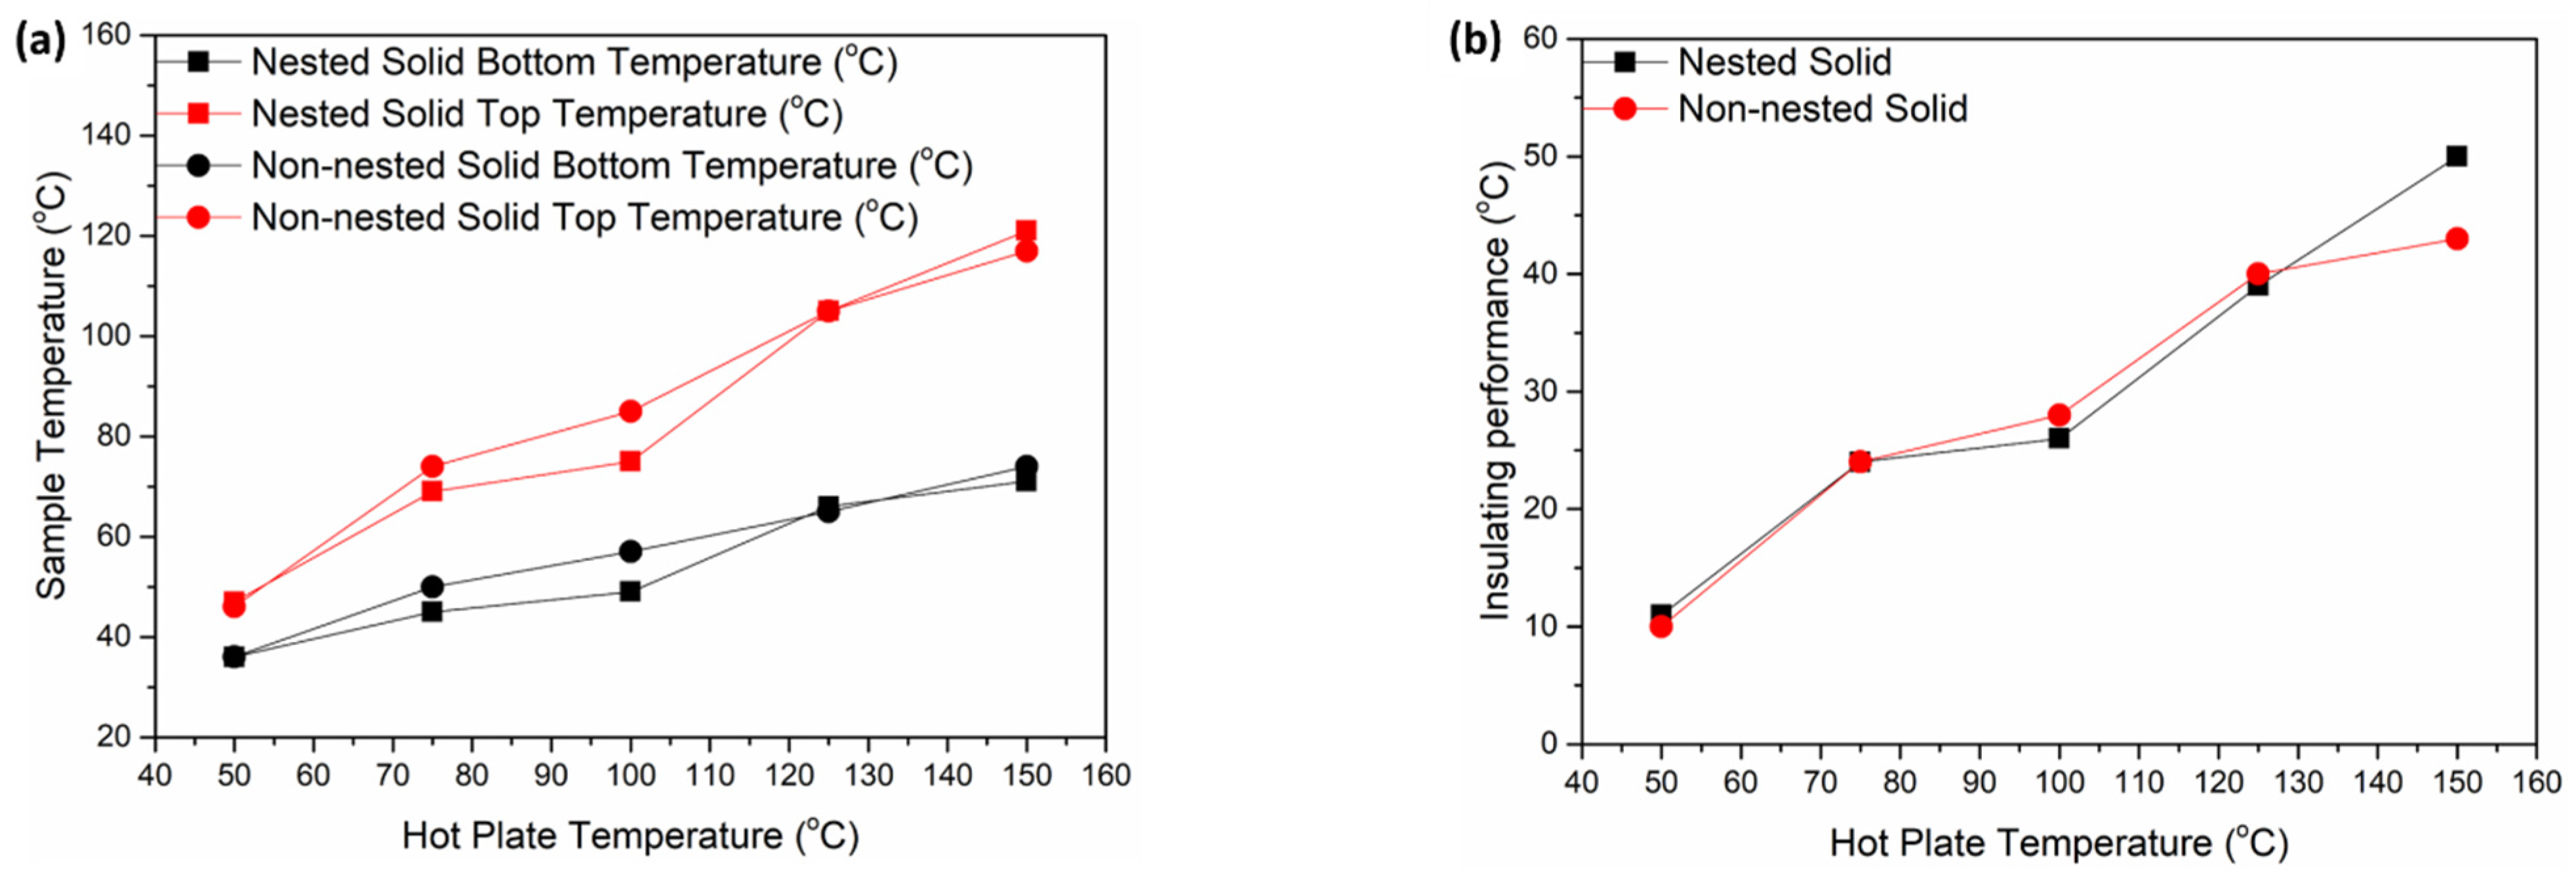
Figure 10.
(a) Variation of top and bottom surface temperatures of the cellular solids with hotplate temperature; and (b) insulating performance of the cellular solids with hotplate temperature.
Figure 10a gives an overview of the variation regarding the temperature between the bottom and top surfaces of the cellular solids upon being placed on the hotplate after 600 s. The temperature of the top and bottom surfaces increases with increasing hotplate temperature. Due to the higher emissivity of the hotplate, the surface temperatures of the cellular solids could not be measured accurately for a hotplate temperature of more than 200 °C. It is important to note that the bottom surface temperature of both the cellular solids is less than the hotplate temperature due to the lower thermal conductivity of the titanium alloy. The thermal insulating performance (temperature difference between the top and bottom surfaces) of both cell types is presented in Figure 10b. The thermal insulating performance increases from 10 °C to 50 °C with increasing temperature of the hotplate from 50 °C to 150 °C. In particular, the temperature difference between the top and bottom surfaces increases with hotplate temperature, so the cellular solids act as good thermal insulators at relatively higher temperatures (more than 100 °C). The non-nested cellular solid with the random arrangement of struts act as a slightly better thermal insulator compared to the nested cellular solid due to a slightly larger nominal surface area (refer to Table 2).
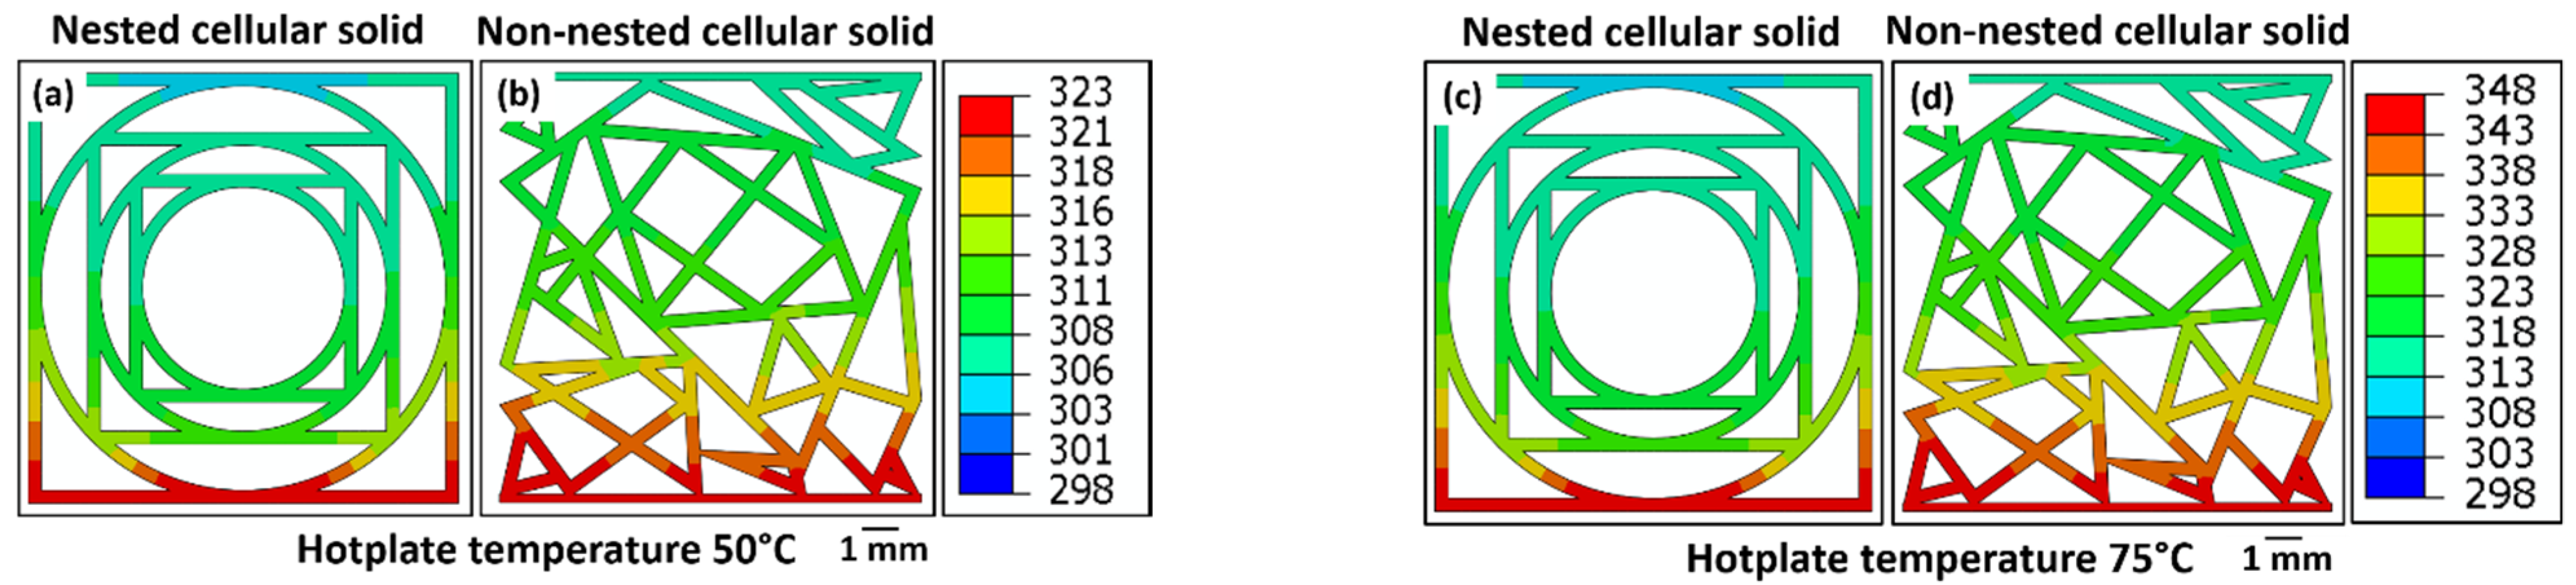
The simulated temperature distribution on the surface of cellular solids after exposure to a hotplate at different temperatures is not uniform on the sample surface, and a temperature distribution gradient is observed on the sample surface (Figure 11). On the sample surface, a higher value is predicted by the simulation compared to the experimentally investigated temperature distribution. This can be attributed to a lower bottom surface temperature obtained experimentally compared to the simulation where the bottom surface is assumed at the hotplate temperature. Due to the FEM boundary condition, the bottom surface temperature of the cellular solid is fixed at the hotplate temperature. Thus, the simulated bottom surface temperatures of the cellular solids are higher than the experimentally investigated temperature distribution shows.

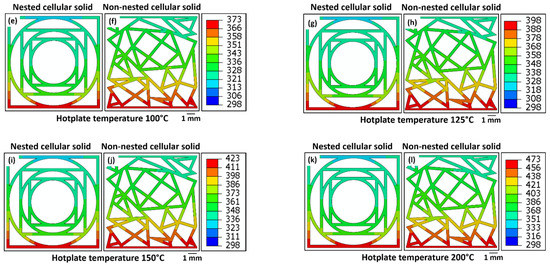
Figure 11.
Simulated temperature distribution of the (a,c,e,g,i,k) nested and (b,d,f,h,j,l) non-nested cellular solids for hotplate temperature (a,b) 50 °C; (c,d) 75 °C; (e,f) 100 °C; (g,h) 125 °C; (i,j) 150 °C; and (k,l) 200 °C. The legend in Figure 11 shows the temperature in Kelvin.
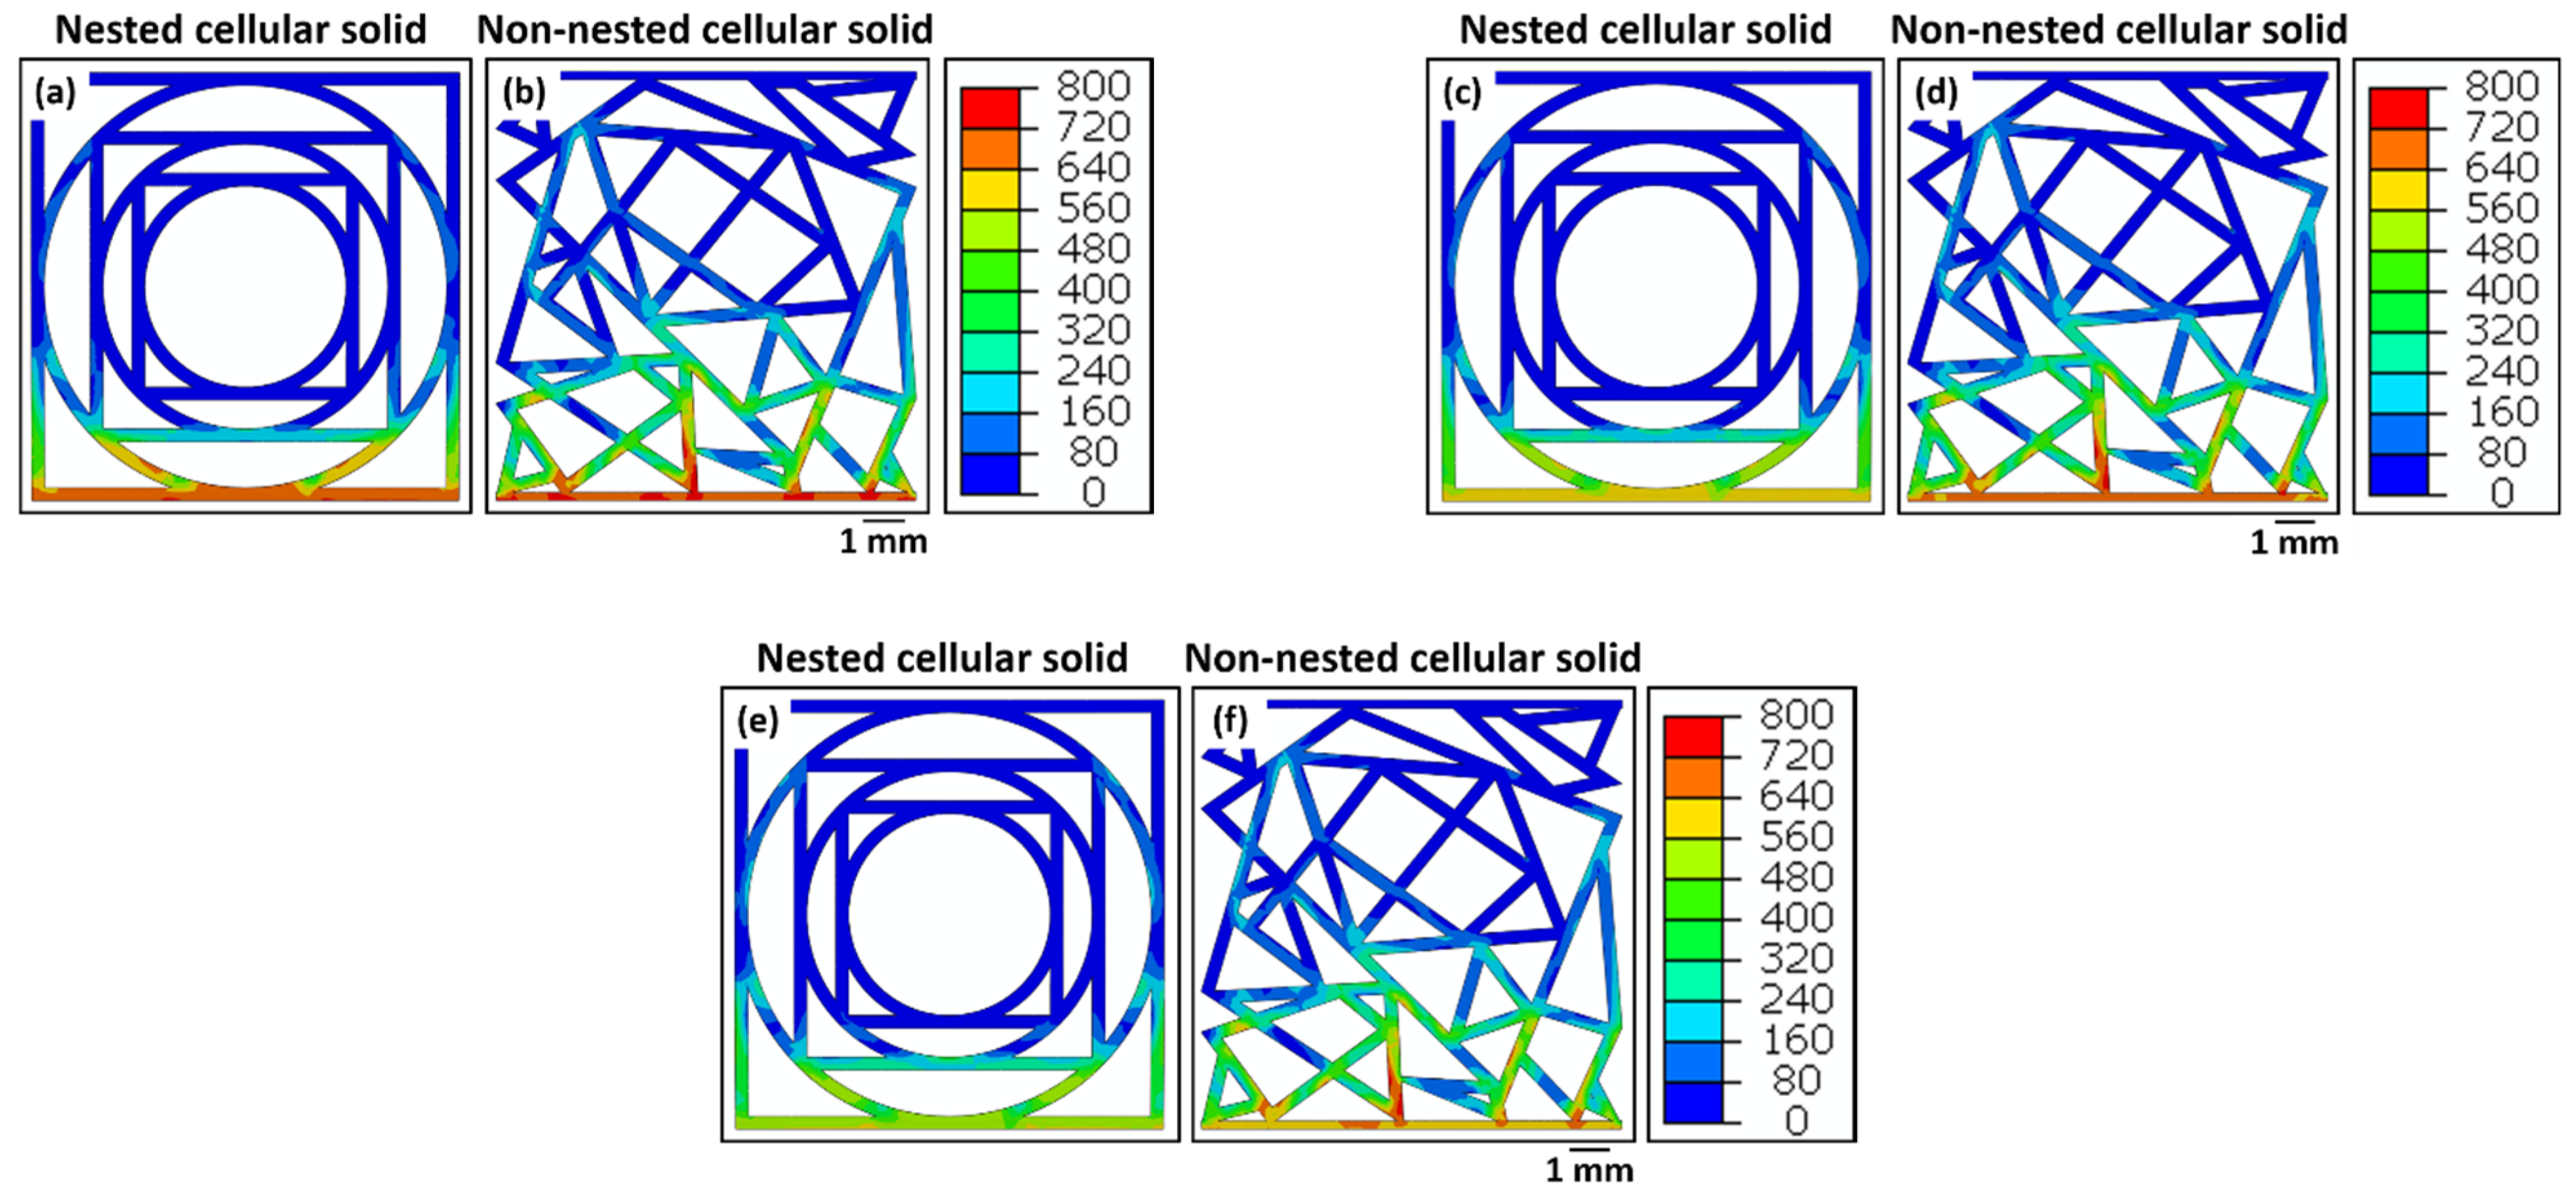
The residual stress generated after cooling from three different hotplate temperatures (50 °C, 125 °C and 200 °C) is plotted in Figure 12. The highest residual stress is obtained at the bottom surface of cellular solids in contact with the hotplate. For both cellular solids, the lowest residual stress is observed at the top surface farthest from the hotplate. The magnitude of residual stress on the nested cellular solid surface changes after cooling from the three different hotplate temperatures, but the residual stress distribution remains similar. Only the residual stress in the bottom surface of the nested cellular solid is different for varying hotplate temperatures. The non-nested cellular solid presents similar residual stress distribution for the three hotplate temperatures, but the magnitude of residual stress changes with varying hotplate temperatures.
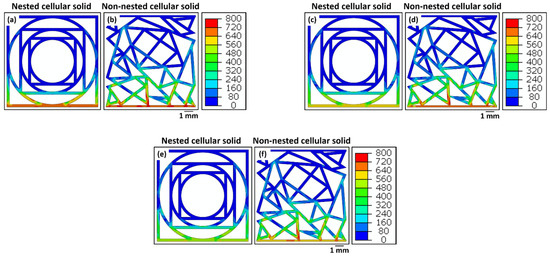
Figure 12.
Simulated residual stress distribution on the cellular solid surfaces after cooling from the hotplate temperatures (a,b) 50 °C; (c,d) 125 °C; and (e,f) 200 °C. The legend in Figure 12 shows the residual stress in MPa.
4. Conclusions
This study evaluates the effective load distribution abilities of two cellular solids having different cellular structures. Here, the effective thermal insulation behaviour of the two cellular solids is compared.
The nested cellular solid has a similar energy absorption capacity compared with the non-nested cellular solid, but the transmitted stress within the nested cellular solid is lower than the non-nested cellular solid. For the nested cellular solid, the experimental and DIC investigation determines a low surface strain value in the interior regions of the solid despite a high external strain. Thus, nested cellular solids can be used for the design of helmets as the external stress is not propagated to the interior regions of the structure.
In addition, both cellular solids can be successfully used for thermal insulation applications. The thermal insulation properties of the cellular solids are effective at temperatures higher than 100 °C. The thermal insulation performance of the non-nested cellular solid is slightly better than the nested cellular solid.
For the compression tests, the experimental and simulation results match each other. The simulated strain distribution predicts a lower strain in the cellular solid which is comparable to the DIC results. However, for thermal insulation, the simulated temperature distribution is higher than the experimentally investigated distribution. Due to the low thermal conductivity of titanium, the temperature on the bottom surface is lower than the hotplate temperature. The thermal insulating performance of the non-nested cellular solid is slightly better than the nested cellular solid. Moreover, the thermal insulating performance of both cellular solids is higher at temperatures above 100 °C. The residual stress distribution is similar on the surfaces of both solids, but the magnitude after cooling from different hotplate temperatures is different. Thus, the nested cellular solid can be used in helmets for shock absorption.
Author Contributions
Conceptualization, S.P., K.-P.H. and M.S.; methodology, S.P., D.M., K.-P.H. and M.S.; software, S.P. and D.M.; validation, S.P., K.-P.H. and M.S.; formal analysis, S.P.; investigation, S.P. and D.M.; resources, S.P., D.M., K.-P.H. and M.S.; data curation, S.P. and D.M.; writing—original draft preparation, S.P. and D.M.; writing—review and editing, S.P., D.M., K.-P.H. and M.S.; visualization, S.P. and D.M.; supervision, S.P., K.-P.H. and M.S.; project administration, K.-P.H. and M.S.; funding acquisition, M.S. All authors have read and agreed to the published version of the manuscript.
Funding
The research is not supported by any funding.
Data Availability Statement
The data presented in this study are available on request from the corresponding author. The data is not publicly available as it forms part of an ongoing study.
Acknowledgment
The authors would like to acknowledge the help received from Dietrich Voswinkel and Marcel Braun for performing the compression testing and thermal insulation experiments, respectively.
Conflicts of Interest
The authors declare no conflict of interest.
References
- Ashby, M.F.; Evans, T.; Fleck, N.A.; Hutchinson, J.W.; Wadley, H.N.G.; Gibson, L.J. Metal Foams: A Design Guide; Elsevier Science: Amsterdam, The Netherlands, 2000. [Google Scholar]
- Bhate, D. Four Questions in Cellular Material Design. Materials 2019, 12, 1060. [Google Scholar] [CrossRef] [PubMed]
- Bhate, D. Lattice Design Optimization: Crowdsourcing Ideas in the Classroom. In Proceedings of the Solid Freeform Fabrication Symposium, Austin, TX, USA, 13–15 August 2018. [Google Scholar]
- Zok, F.W.; Latture, R.M.; Begley, M.R. Periodic truss structures. J. Mech. Phys. Solids 2016, 96, 184–203. [Google Scholar] [CrossRef]
- Bhate, D. TRX Webinar: AM of Cellular Materials—An Overview of Considerations 20180906. Available online: https://www.youtube.com/watch?v=65M-pp7mS-c&t=2854s (accessed on 18 May 2022).
- Casanova, L.; Anitha, V.V.; Kadway, N.; Gandhi, A.; Le, T.; Lee, C.; Bhate, D. On the Mechanical Behavior of Additively Manufactured Asymmetric Honeycombs. In Proceedings of the International Solid Freeform Fabrication Symposium, Austin, TX, USA, 13–15 August 2018. [Google Scholar]
- Constantin, L.; Wu, Z.; Li, N.; Fan, L.; Silvain, J.F.; Lu, Y.F. Laser 3D printing of complex copper structures. Addit. Manuf. 2020, 35, 101268. [Google Scholar] [CrossRef]
- Sciacca, G.; Sinico, M.; Cogo, G.; Bigolaro, D.; Pepato, A.; Esposito, J. Experimental and numerical characterization of pure copper heat sinks produced by laser powder bed fusion. Mater. Des. 2022, 214, 110415. [Google Scholar] [CrossRef]
- Constantin, L.; Kraiem, N.; Wu, Z.; Cui, B.; Battaglia, J.L.; Garnier, C.; Silvain, J.F.; Lu, Y.F. Manufacturing of complex diamond-based composite structures via laser powder-bed fusion. Addit. Manuf. 2021, 40, 101927. [Google Scholar] [CrossRef]
- Constantin, L.; Fan, L.; Pontoreau, M.; Wang, F.; Cui, B.; Battaglia, J.L.; Silvain, J.F.; Lu, Y.F. Additive manufacturing of copper/diamond composites for thermal management applications. Manuf. Lett. 2020, 24, 61–66. [Google Scholar] [CrossRef]
- Yaple, J.M. Design and Additive Manufacturing of Copper Heat Sinks for Microelectronics Cooling. MSc Thesis, Arizona State University, Tempe, AZ, USA, 2021. [Google Scholar]
- Gibson, L.J.; Ashby, M.F. Cellular Solids: Structure and Properties, Second Edition; Cambridge University Press: Cambridge, UK, 1997; ISBN 9781139878326. [Google Scholar]


Publisher’s Note: MDPI stays neutral with regard to jurisdictional claims in published maps and institutional affiliations. |
© 2022 by the authors. Licensee MDPI, Basel, Switzerland. This article is an open access article distributed under the terms and conditions of the Creative Commons Attribution (CC BY) license (https://creativecommons.org/licenses/by/4.0/).