Article

Comparison of Brillouin Light Scattering and Density of States in a Supported Layer: Analytical and Experimental Study

by
Ossama El Abouti
1,
John Cuffe
2,3,
El Houssaine El Boudouti
4,*,
Clivia M. Sotomayor Torres
2,5,
Emigdio Chavez-Angel
2,
Bahram Djafari-Rouhani
6 and
Francesc Alzina
2
1
Faculté des Sciences et Techniques, Al Hoceima, Université Abdelmalek Essadi, Tétouan 93000, Morocco
2
Catalan Institute of Nanoscience and Nanotechnology (ICN2), CSIC and BIST, Campus UAB, Bellaterra, 08193 Barcelona, Spain
3
Department of Physics, University College Cork, College Road, T12 K8AF Cork, Ireland
4
LPMR, Département de Physique, Faculté des Sciences, Université Mohammed I, Oujda 60000, Morocco
5
ICREA, Pg. Lluis Companys 23, 08010 Barcelona, Spain
6
Département de Physique, IEMN, Université de Lille, 59655 Lille, France
*
Author to whom correspondence should be addressed.
Crystals 2022, 12(9), 1212; https://doi.org/10.3390/cryst12091212
Submission received: 31 July 2022 / Revised: 23 August 2022 / Accepted: 26 August 2022 / Published: 28 August 2022
(This article belongs to the Special Issue Advances in Phononic Crystals and Elastic Metamaterials)

Abstract

:
We provide a detailed analytical calculation of the Brillouin light scattering (BLS) intensity of a layer on a substrate, taking into account both photoelastic and moving boundary (ripple effect) mechanisms, and give a comparison between BLS intensity and density of states (DOS) to determine the dispersion curves of longitudinal guided modes in the supported layer. In particular, in the case where the mismatch between the elastic parameters of the substrate and the adsorbed layer is high, such as in a PMMA layer on a Si substrate, we derive closed-form expressions of BLS and DOS and demonstrate a simple relationship between these two quantities. A very good agreement between experimental and theoretical BLS spectra was found and compared to theoretical DOS spectra. In particular, we show that while the peaks in the DOS present a uniform behavior, the BLS spectra follows a sine cardinal (sinc) function shape around a given frequency fixed by the chosen laser wavelength. The theoretical calculation is performed within the framework of the Green’s function approach.

1. Introduction

Physical properties of thin supported layers are of specific interest, as they are often different from those of bulk materials, mainly the transport properties [1]. These properties are of fundamental importance for the development of high-performance devices. The propagation of surface acoustic waves in supported layers has been extensively studied [1,2,3,4,5,6,7,8,9,10,11,12,13]. On the other hand, the so-called longitudinal guided modes have also attracted significant attention [14,15,16,17,18,19]. Experimental evidence of the existence of these modes has been obtained for one supported layer deposited on a substrate such as Mo/Si [6], Si (amorphous)/Si(crystalline) [7], SiO2/GaAs [8], ZnSe/GaAs [14], WC/Si [10] and recently in heterostructure semiconductor/topological insulator Si/Bi2Te3 [13]. Generation of modes in more complicated structures such as interconnected Al stripes and pillars deposited on a Si substrate has been reported [20].
In this regard, polymer layers are attractive model systems to investigate phonon confinement due to their elasticity, transparency and inexpensive fabrication in contrast to rigid layers. The acoustic properties of supported polymer layers are of key importance in advancing Nanoimprint Lithography and other polymer-coating-based technologies [21]. As well as being a convenient system for the study of phonon confinement, the acoustic properties of nanoscale layers of polymers are important for the fabrication of nanostructures, for a range of applications including micro/nano-electronics, nanophotonics and nanofluidics. An example of a study on the acoustic properties of polymer layers, ranging in thickness from 40 nm to 3 µm, was performed by Gomopoulos et al. [22,23]. By employing BLS, they measured the longitudinal modulus in supported thin polymer films in the direction normal to the film surface.
Furthermore, the manipulation of elastic wave propagation given by combining materials of significantly different acoustic impedance in a periodic structure has been investigated both experimentally and theoretically [24,25,26,27,28,29,30]. Potential applications of these periodic structures include the enhancement of interaction between acoustic and visible light waves, which can enable coherent phonon generation [31,32,33,34], concurrent modulation of light and sound [35,36,37], acoustic diodes [38] and sensors [39,40]. Recently, the study of hybrid superlattices consisting of alternating silica and poly(methylmethacrylate) (SiO2-PMMA) studied by non-destructive BLS has advanced our knowledge of phononic wave propagation [41,42,43]. The large mismatch between the physical properties of polymer layers is the key parameter in determining the phononic properties of these periodic nanocomposites, as the width of the phonon band gaps depends on the difference between the acoustic impedances of the constituents. More recently, the direction-dependent elastic and electromagnetic wave propagation has been studied by some of us experimentally and theoretically in supported films of PMMA-TiO2 [44] and PMMA-BaTiO3 [45] multilayers with a periodicity of about 100–140 nm. In these studies, full theoretical description of the phononic density of states (DOS) recorded by BLS was derived.
Another method that enables revealing the surface acoustic waves’ existence in multilayers is the so-called picosecond ultrasonics based on the ultrafast pump–probe technique [46]. Recently, this method has been used to generate and detect surface acoustic waves on a structure consisting of nanoscale Al lines on a SiO2 layer deposited on Si substrate [47] and to probe the mechanical properties of single vegetal cells [48].
Among different mathematical approaches, the Green’s function formalism [1,28] is particularly convenient for studying the spectral properties of these types of excitations; in particular, it enables the calculation of the total or local DOS in which the resonant (leaky) modes appear as well-defined peaks. Let us recall that the vibrational DOS is often used for the integrated function over the phonon wavevector q in condensed matter physics such as the heat capacity and thermal conductivity [49]. Several works have reported the extraction of the DOS from measurable quantities such as: the nuclear resonant scattering to derive the phonon DOS [50], the differential conductance in scanning tunneling spectroscopy to obtain electron charge density [51] and the conductivity correction in semiconductors to deduce the Fermi energy [52]. Additionally, several works have used the DOS spectra to analyze the different modes obtained from the experimental BLS measurements in layered media [10,14,43,53,54,55]. In the case of oblique incidence (in-plane propagation) and for an opaque layer, the scattering occurs at the free surface of the layer and it was shown that the BLS spectra is proportional to the local DOS evaluated at the surface [10,28]. For a normal incidence (out-of-plane propagation), it was shown that the experimental BLS spectra follows a sine cardinal (sinc) function [14,22,23,55,56]. However, to our knowledge, there is no analytical comparison between the total DOS and the BLS spectra in the latter case.
In this work we give an analytical and experimental demonstration of the comparison between BLS and DOS to determine the dispersion curves of pure longitudinal acoustic modes propagating perpendicular to a thin layer deposited on the substrate. In the case where the mismatch between the elastic parameters of the substrate and the adsorbed layer is high such as PMMA layer on Si substrate, we obtain closed-form expressions of BLS and DOS and demonstrate a simple relationship between these two quantities. A very good agreement between experimental and theoretical BLS spectra is found and compared to theoretical DOS spectra. In particular, we show that while the peaks in the DOS present a uniform behavior, the BLS spectra follow a sinc function shape around a given frequency fixed by the chosen laser wavelength. Another result of the paper is an exact relationship between DOS and the delay time of the reflection coefficient which can be measured in an acoustic experiment.
This paper is organized as follows: in Section 2 we present the analytical calculations of the BLS intensity and DOS. These calculations are obtained using the Green’s function method [28]. Section 3 presents the experimental and numerical results concerning the BLS and DOS spectra of PMMA layer deposited on Si substrate. Section 4 summarizes the principal results of this work.

2. Analytical Results

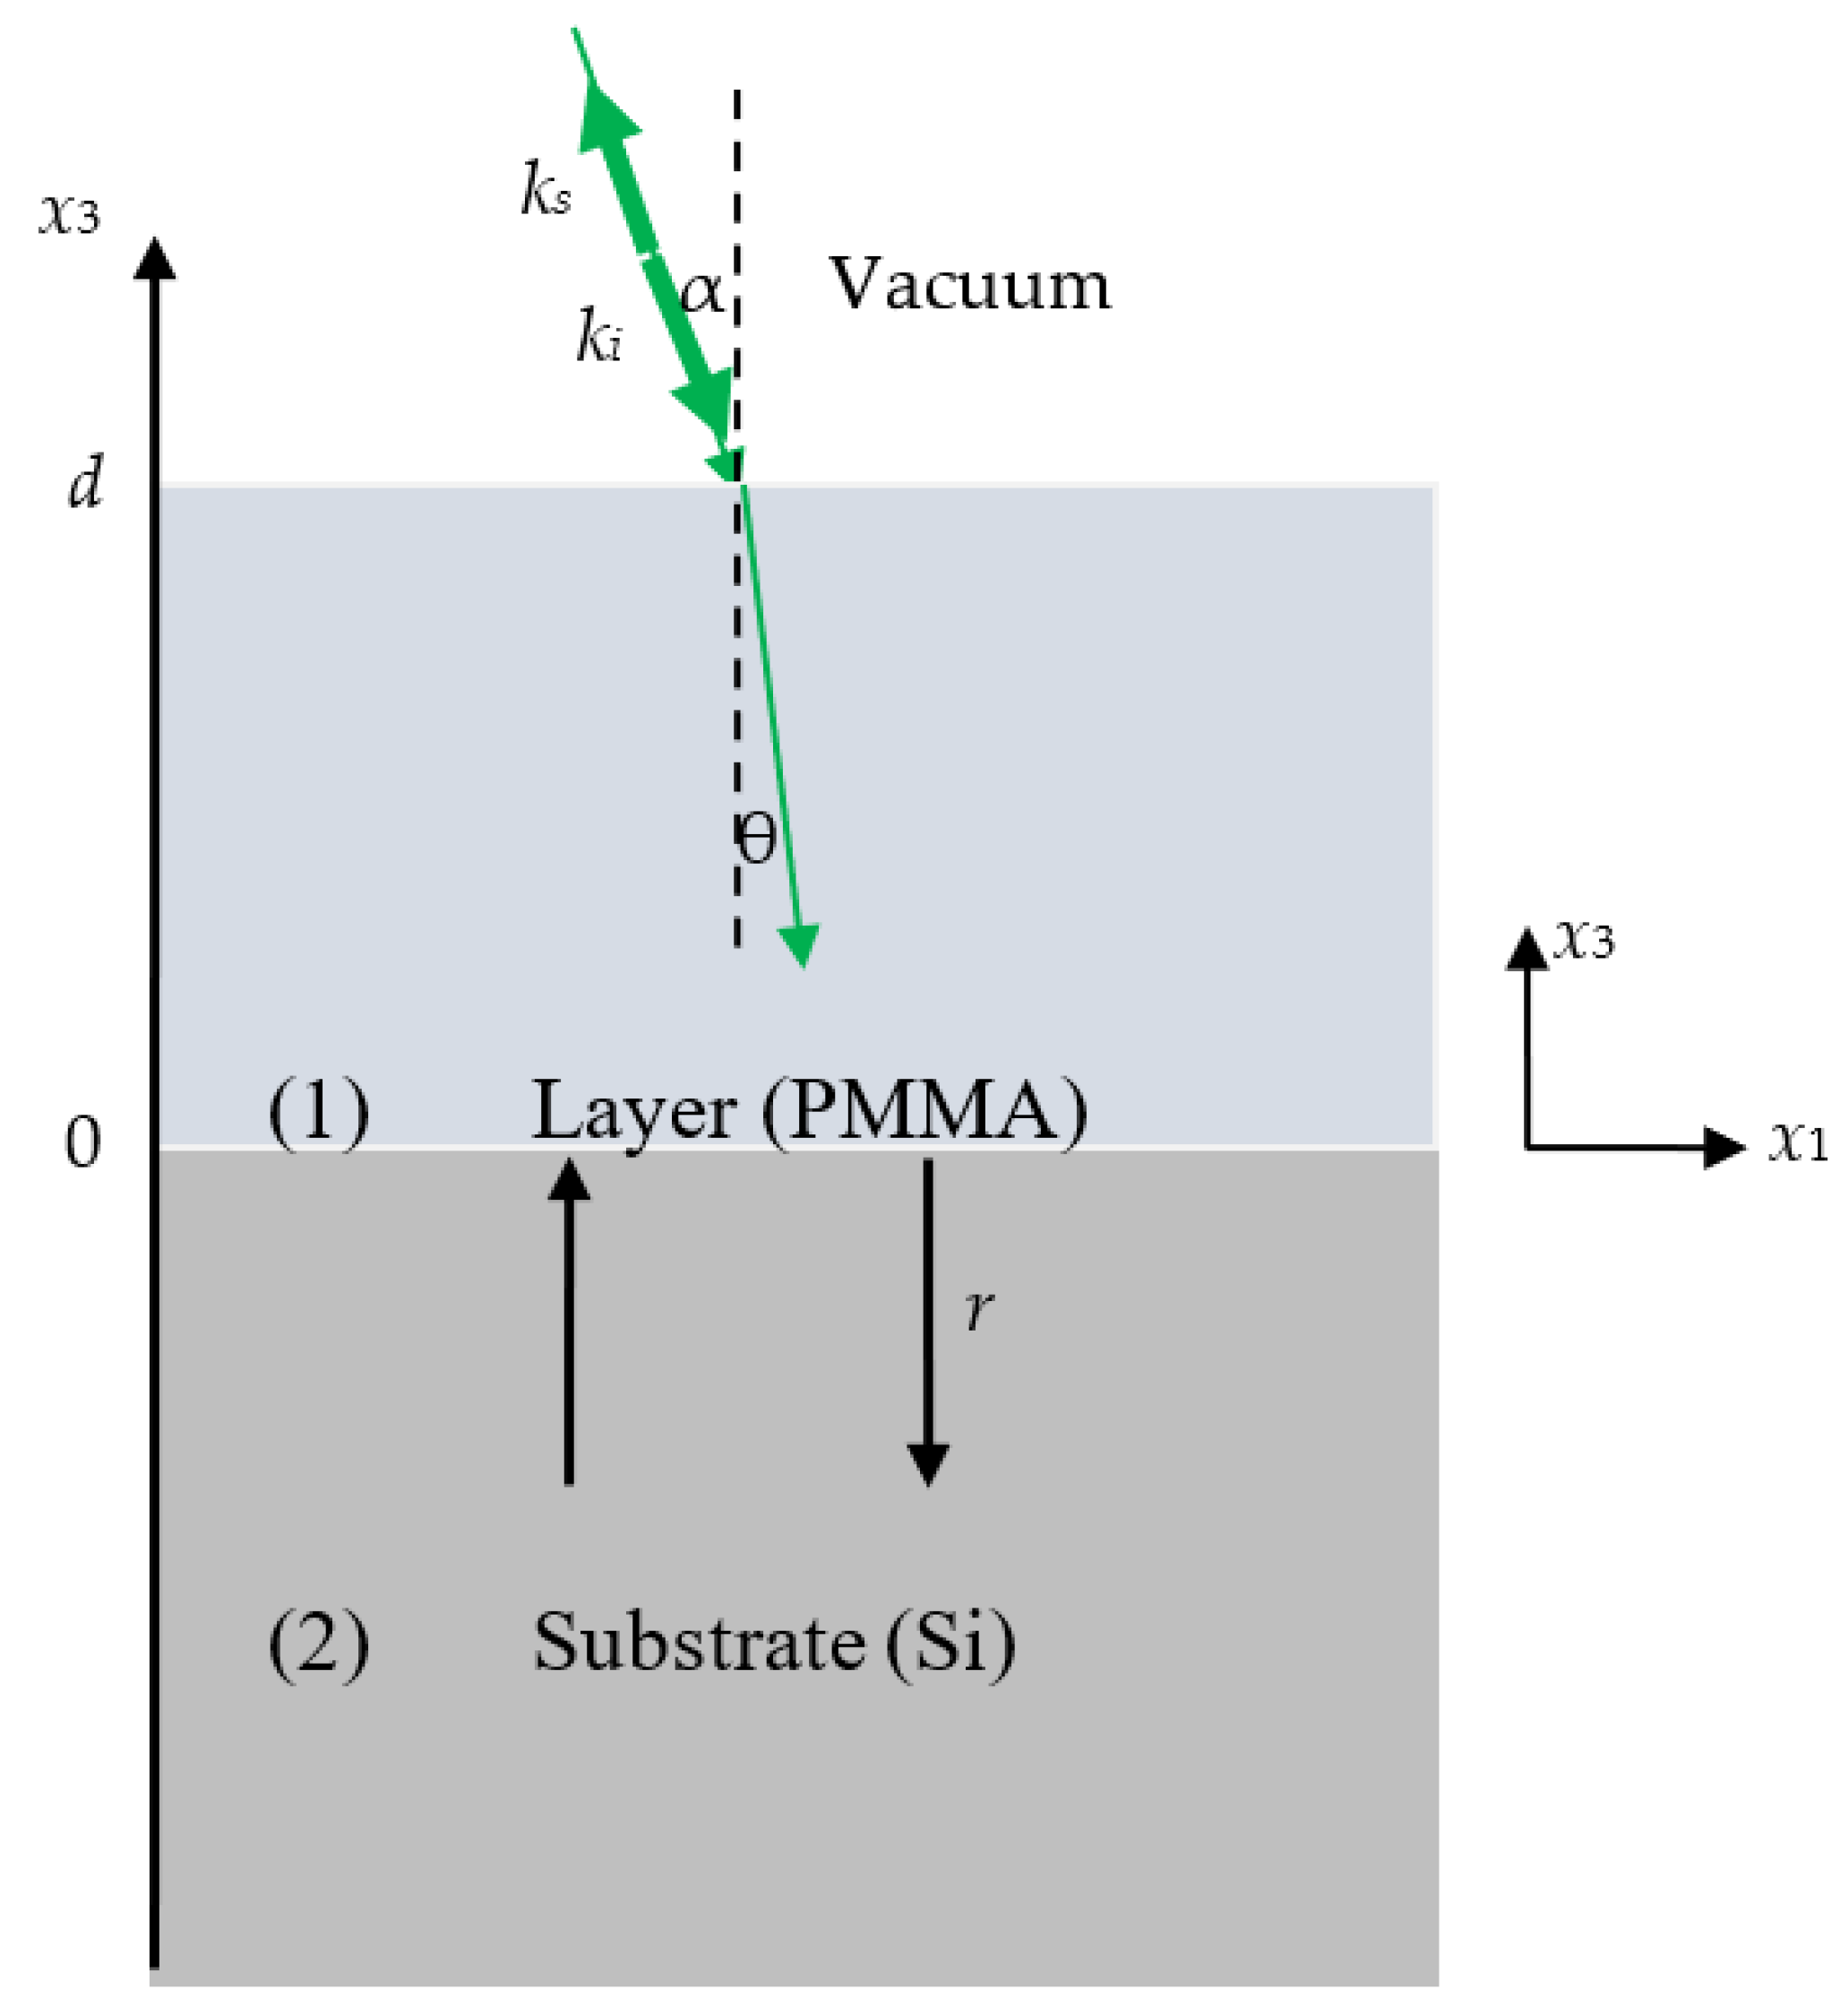
2.1. Scattering Intensity in a Supported Layer

We consider (Figure 1) a structure formed out of one adsorbed layer (labeled i = 1) of thickness d deposited on a homogeneous substrate (labeled i = 2) along the x 3 axis. All the interfaces are taken to be parallel to the x 1 x 2 plane. At normal incidence and for isotropic media, there is a decoupling between longitudinal and transverse waves in the media and the former can be treated separately. Each medium within the stack is defined by its mass density   ρ i , its optical index   n i , longitudinal sound velocity   v i , and photoelastic constant   p i . The corresponding elastic constants and acoustic impedances are given by C 11 i = ρ i v i 2 and Z i = ρ i v i respectively (i = 1, 2). The dielectric constants of the vacuum, supported layer and substrate are ε 0 ,     ε 1 and ε 2 , respectively. Since we are interested in longitudinal phonons propagating along the normal to the interfaces   x 3 , the BLS is envisaged in a backscattering geometry with both incident ( k i ) and scattered ( k s ) wavevectors forming an angle α with the x 3 axis. Additionally, we consider the so-called PP configuration with both, the incident electric field E i   and the scattered electric field E s , polarized along the   x 2 direction (transverse electric polarization). Let us also notice that the magnitudes of the scattered and incident wavevectors are very close to each other k i k s . Indeed, the phonon frequency is much lower than that of the light, so the incident ω i   and scattered ω s   photon frequencies are almost identical   ω i   ω s .
There are two different mechanisms contributing to the scattered light intensity, namely the photoelastic and interface motion effects. The former mechanism can be described as an acoustic modulation of the dielectric constant in the bulk of each medium by means of the photoelastic constant pi of this medium: δ ε i   = ε i 2 p i u i ( x 3 ) x 3 ( p i   stands for the photoelastic constant   p 12   in layer i ( i = 1 ,   2 )). Then, in the presence of an incident electric field   E i ( x 3 ) , the strain due to displacement field u i ( x 3 )   induces a polarization given by [57]
P ( x 3 ) = δ ε i   E i ( x 3 ) = ε i 2 p i u i ( x 3 ) x 3   E i ( x 3 )
The contribution of the scattered electric field   E s ( l a y e r ) of the layer at any point   x 3 is obtained by the following equation [57]
E s ( l a y e r ) ( x 3 , ω ) = ε 1 2 p 1 0 d u 1 ( x 3 ) x 3   E 1 ( x 3 ) g ( x 3 , x 3 , ω ) d x 3
where   g ( x 3 , x 3 , ω ) is the electromagnetic Green’s function between the point   x 3 where the polarization is located and any point x 3   where the scattered field is observed (here the vacuum medium, Figure 1), and ω is the electromagnetic angular frequency.
Similarly, we can calculate the contribution of the scattered field   E s ( s u b ) coming from the substrate as follows [57]
E s ( s u b ) ( x 3 , ω ) = ε 2 2 p 2 L 0 u 2 ( x 3 ) x 3 E 2 ( x 3 ) g ( x 3 , x 3 , ω ) d x 3
where L is the depth over which light is supposed to interact with phonons in the substrate.
The second mechanism, called “moving interface” or “ripple” effect, results from the difference between the dielectric constants of two adjacent media i and j , since the displacement at their interface changes the dielectric constants of a thin layer of material from ε i to ε j and vice versa. Consequently, it is proportional to the interface displacement in contrast to the photoelastic effect, which depends on the strain. It can be written as [57]:
E s ( r i p p l e ) ( x 3 , ω ) = ( ε 0 ε 1 ) u 1 ( d ) E 1 ( d ) g ( d , x 3 , ω ) + ( ε 1 ε 2 ) u 1 ( 0 ) E 1 ( 0 )   g ( 0 , x 3 , ω )
The scattered intensity of the structure is then given as the square of the sum of all scattered electric fields   E s ( l a y e r ) ,   E s ( s u b )   and   E s ( r i p p l e ) , namely
I = | E s ( l a y e r ) + E s ( s u b ) + E s ( r i p p l e ) | 2
To calculate the above scattered fields (Equations (2)–(4)), we need the spatial distribution of the displacement field and the incident electric field, as well as the electromagnetic Green function   g ( x 3 , x 3 , ω ) of the multilayer structure. The details of these calculations are given in the Supplementary Materials. Let us notice that the expressions of the displacement field and the incident electric field are very easy to calculate and the utilization of the Green function approach in this work is mainly motivated by the knowledge that the function g ( x 3 , x 3 , ω ) will later allow us to calculate the vibrational density of states.
For instance, the displacement field distribution can be obtained by launching an incident wave from the substrate (see also Supplementary Materials) and calculating its reflection at the boundaries x 3 = 0 and x 3 = d . In this way, we obtain the implicit expressions of the displacement fields in the layer ( 0 x 3 d ) and substrate ( x 3 0 ), respectively, as follows
u 1 ( x 3 ) = C [ A ( ω ) e j k 1 ( d 2 x 3 ) + B ( ω ) e j k 1 ( d 2 x 3 ) ]
and
u 2 ( x 3 ) = C ( e j k 2 x 3 + r e + j k 2 x 3 )
where k i = ω / v i   is the wavevector in medium i , v i is the longitudinal velocity of phonons in medium i ( i = 1 ,   2 ) and ω is their elastic angular frequency. C is the constant of integration of the displacement field and A ( ω ) and B ( ω ) are the amplitudes of the incident and reflected elastic waves in layer 1 containing all the information on the mechanical properties of the system. Their explicit expressions are given in Supplementary Materials. The parameter r corresponds to the acoustic reflected wave in the substrate; its expression (see Supplementary Materials) is given by
r = Z 1 sin ( ω d v 1 ) j Z 2 cos ( ω d v 1 ) Z 1 sin ( ω d v 1 ) + j Z 2 cos ( ω d v 1 )
It is worth noticing that the displacement field throughout the structure must be normalized. Indeed, the constant C in Equations (6) and (7) is obtained by the normalization condition of the displacement field throughout the system (see Supplementary Materials), namely
L 0 ω 2 ρ 2 | u 2 ( x 3 ) | 2 d x 3 + 0 d ω 2 ρ 1 | u 1 ( x 3 ) | 2 d x 3 = ( n ( ω ) + 1 2 ) ћ ω
where n ( ω ) is the Bose–Einstein population factor and ħ is the reduced Planck constant (h/2π). It should be noted that for high temperature ( n ( ω ) + 1 2 ) ћ ω   k B T , where   k B   is the Boltzmann constant.
Similarly, the implicit expressions of the electric fields in the layer ( 0 x 3 d ) and substrate ( x 3 0 ) can be written, respectively, (see Supplementary Materials) as
  E 1 ( x 3 ) = A ( ω ) e j k 1 ( d 2 x 3 ) + B ( ω ) e + j k 1 ( d 2 x 3 )
E 2 ( x 3 ) = t e j k 2 x 3
where   k i = ω n i / c = 2 π n i / λ is the wavevector of the electric field in each medium ( i = 1 ,   2 ). λ is the wavelength of the incident light in vacuum. The amplitudes A ( ω ) and B ( ω ) of the incident and reflected electromagnetic waves in layer 1 contain all the information on the optical properties of the system. Their explicit expressions are given in Supplementary Materials.
The Green’s function between any source point in the layer ( 0 x 3 d ) and the observation point in vacuum ( x 3 d ) is given by (see Supplementary Materials)
g ( x 3 , x 3 , ω ) = e j k 0 ( x 3 d ) { A ( ω ) e j k 1 ( d 2 x 3 ) + B ( ω ) e + j k 1 ( d 2 x 3 ) }
where   k 0 = ω / c = 2 π / λ is the wavevector of the electric field in vacuum.
In the same way, the Green’s function between any source point in the substrate ( x 3 0 ) and the observation point in vacuum ( x 3 d ) is given by (see Supplementary Materials)
g ( x 3 , x 3 , ω ) = j t 2 k 0 e j k 0 ( x 3 d ) e j k 2 x 3
By replacing Equations (6), (10) and (12) in Equation (2), we obtain
E s ( l a y e r ) ( x 3 ) = ε 1 2 p 1 d   e j k 0 ( x 3 d ) k 1 k 1 sin ( k 1 d ) sin ( k 1 d ) 2 { [ A ( ω ) A ( ω ) 2 + B ( ω ) B ( ω ) 2 ] sinc ( ( k 1 + 2 k 1 ) d 2 ) 2 [ A ( ω ) A ( ω ) B ( ω ) + B ( ω ) B ( ω ) A ( ω ) ] sinc ( k 1 d 2 ) + [ A ( ω ) B ( ω ) 2 + B ( ω ) A ( ω ) 2 ] sinc ( ( k 1 2 k 1 ) d 2 ) }
Due to the shape of the sinc function, the three terms in the RHS of Equation (14) take significant values only around k 1 = ω v 1 = 2 k 1 = 4 π n 1 / λ (anti-Stokes contribution), k 1 = ω v 1 = 0   (elastic scattering) and k 1 = ω v 1 = 2 k 1 = 4 π n 1 / λ (Stokes contribution). We can notice that the Stokes term in Equation (14) gives a peak around the Brillouin frequency of the layer   f 1 = 2 n 1 v 1 / λ .
Similarly, by replacing Equations (7), (11) and (13) in Equation (3), we can calculate the contribution of the scattered field coming from the substrate as follows
E s ( s u b ) ( x 3 ) = ε 2 2 p 2 e j k 0 ( x 3 d ) L k 2 k 2 t 2 sin ( k 2 L ) sin ( k 2 L ) 2 { sinc ( ( k 2 + 2 k 2 ) L 2 ) + r   sinc ( ( k 2 2 k 2 ) L 2 ) }  
where k 2 = ω / v 2 , k 2 = ω n 2 / c = 2 π n 2 / λ and k 0 = ω / c = 2 π / λ . We can notice that the Stokes term in Equation (15) gives a peak around the Brillouin frequency of the substrate   f 2 = 2 n 2 v 2 / λ .
Finally, From Equations (6), (10) and (12), one can derive the moving interface (ripple) contribution (Equation (4)) as
E s ( r i p p l e ) ( x 3 ) = C e j k 0 ( x 3 d ) { ( ε 0 ε 1 ) [ A ( ω ) e j k 1 d 2 + B ( ω ) e j k 1 d 2 ] [ A ( ω ) e j k 1 d 2 + B ( ω ) e j k 1 d 2   ] 2     j 2 k 0 ( ε 1 ε 2 ) ( 1 + r ) t 2 }

2.2. Density of States and Reflection Delay Time

The density of states (DOS) of the whole system is an interesting quantity as it enables us to deduce the distribution and the weight of the different modes. In the case of the supported layer, we can calculate the variation of DOS ( Δ n ( ω ) )   between the supported layer and the two constituting materials (layer and substrate) taken separately. This quantity is given by [1]
Δ n ( ω ) = 1 π d d ω [ A r g ( g ( 0 , 0 ) ) ]
where g ( 0 , 0 ) is the acoustic Green’s function at the interface x 3 = 0 (see Supplementary Materials). From the expression of g ( 0 , 0 ) , one can easily derive
Δ n ( ω ) = 1 π Z 1 Z 2 ( Z 1 sin ( ω d v 1 ) ) 2 + ( Z 2 cos ( ω d v 1 ) ) 2
This variation of DOS can be related to the acoustic reflection delay time defined by
τ ( ω ) = d d ω [ A r g ( r ) ]
From the expression of r (Equations (8) and (18)), one can further conveniently derive an expression for the acoustic reflection delay time as
τ ( ω ) = 2 Z 1 Z 2 ( Z 1 sin ( ω d v 1 ) ) 2 + ( Z 2 cos ( ω d v 1 ) ) 2
Equations (18) and (20) provide the relationship between the variation of DOS and the reflection delay time τ as:
τ ( ω ) = 2 π Δ n ( ω )

2.3. Particular Case of a Soft Layer on a Hard Substrate

In order to explain the behavior of the experimental BLS spectra, we have simplified the theoretical expression of the light scattered intensity of the system (layer/substrate) which is defined as the sum of both layer and substrate contributions. In order to examine each contribution, it is convenient to evaluate their amplitudes separately. However, several assumptions can be made for a soft layer on a hard substrate, i.e., (i) the main intensity contribution comes from the surface layer as phonons are confined essentially in the top layer. (ii) The light wave in the substrate is attenuated due to imaginary parts of the complex refractive index of the substrate (see Section 3.2). (iii) The substrate contribution in the scattering intensity falls at a higher frequency far from those of the layer modes (see Section 3.2). (iv) The photoelastic constant of the substrate (here silicon) is very small in comparison with the one of the surface layer (PMMA) (see Table 1). With the above assumptions, the main contributions to the BLS intensity (Equation (5)) come from the photoelastic contribution of the layer ( E s ( l a y e r ) , Equation (2) or Equation (14)) and the moving interface contribution ( E s ( r i p p l e ) , Equation (4) or Equation (16)). We shall see below that the latter contribution only contributes non-negligibly if the layer is very thin, namely below 300 nm. Otherwise, the only remaining contribution comes from E s ( 1 ) , whose Stokes term can be written from Equation (14) as:
E s ( 1 ) ( x 3 ) [ A ( ω ) B ( ω ) 2 + B ( ω ) A ( ω ) 2 ] sinc ( ( k 1 2 k 1 ) d 2 )   e k 0 ( x 3 d )
From the expressions of A ( ω ) , B ( ω ) , A ( ω ) and B ( ω ) (Equations (S10), (S11), (S23) and (S24)), one can get the following simple expression
E s ( 1 ) ( x 3 ) [ ( n 1 2 + n 2 2 ) sin ( ( k 1 + 2 k 1 ) d 2 ) j 2 n 1 n 2 cos ( ( k 1 + 2 k 1 ) d 2 ) ] sinc ( ( k 1 2 k 1 ) d 2 ) Z 2 cos ( ω d v 1 ) j Z 1 sin ( ω d v 1 ) e k 0 ( x 3 d )
where the main modes of the surface layer are observed around k 1 = 2 k 1 . We can see that the optical modulation of the refractive index in the system will affect only the amplitude in Equation (23) through the term between brackets, which means that the main behavior of the scattering amplitude follows a sinc function. Indeed, around   k 1 = 2 k 1 , the intensity can be written very simply as
I   sinc 2 ( ( ω v 1 q ) d / 2 ) ( Z 2 cos ( ω d v 1 ) ) 2 + ( Z 1 sin ( ω d v 1 ) ) 2
where q = 2 k 1 = 4 π n 1 / λ is the analog of scattering wavevector in layer 1.
From Equations (17) and (24), one can see that the scattered intensity can be considered as a density of states modulated by the square modulus of the sinc function   sinc 2 ( ( ω v 1 q ) d / 2 ) , namely
I Δ n ( ω )   sinc 2 ( ( ω v 1 q ) d / 2 )

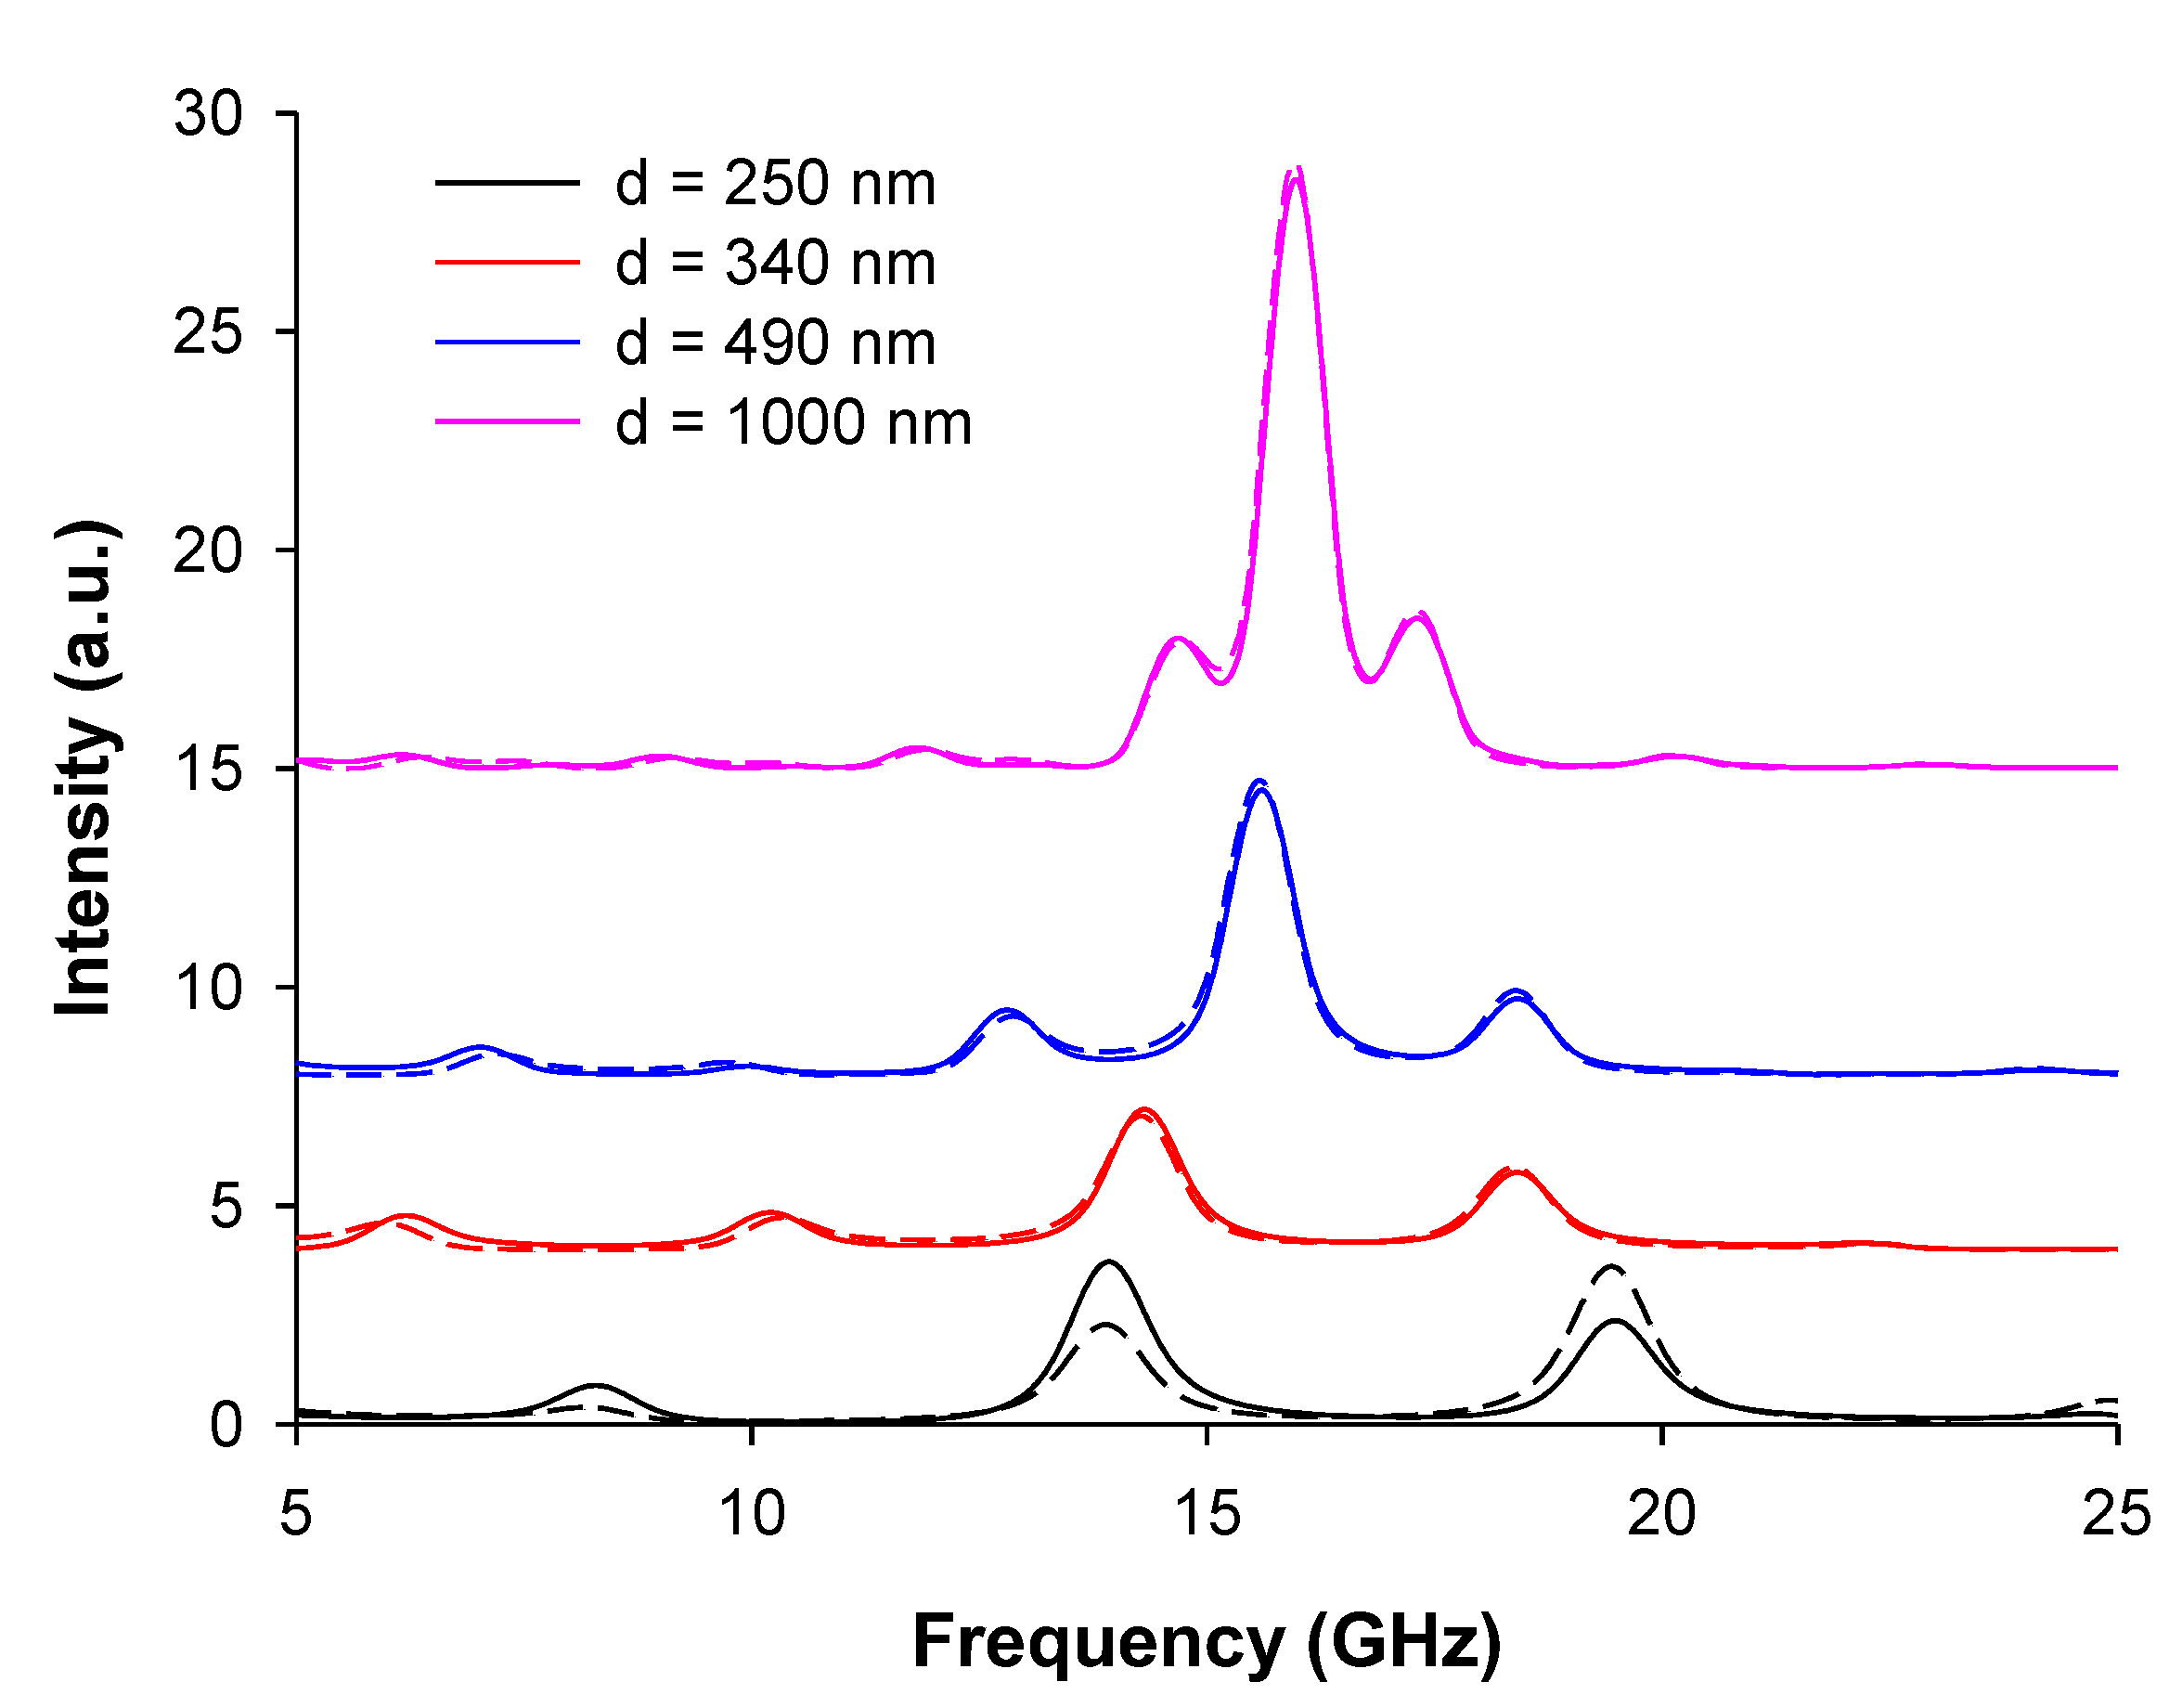
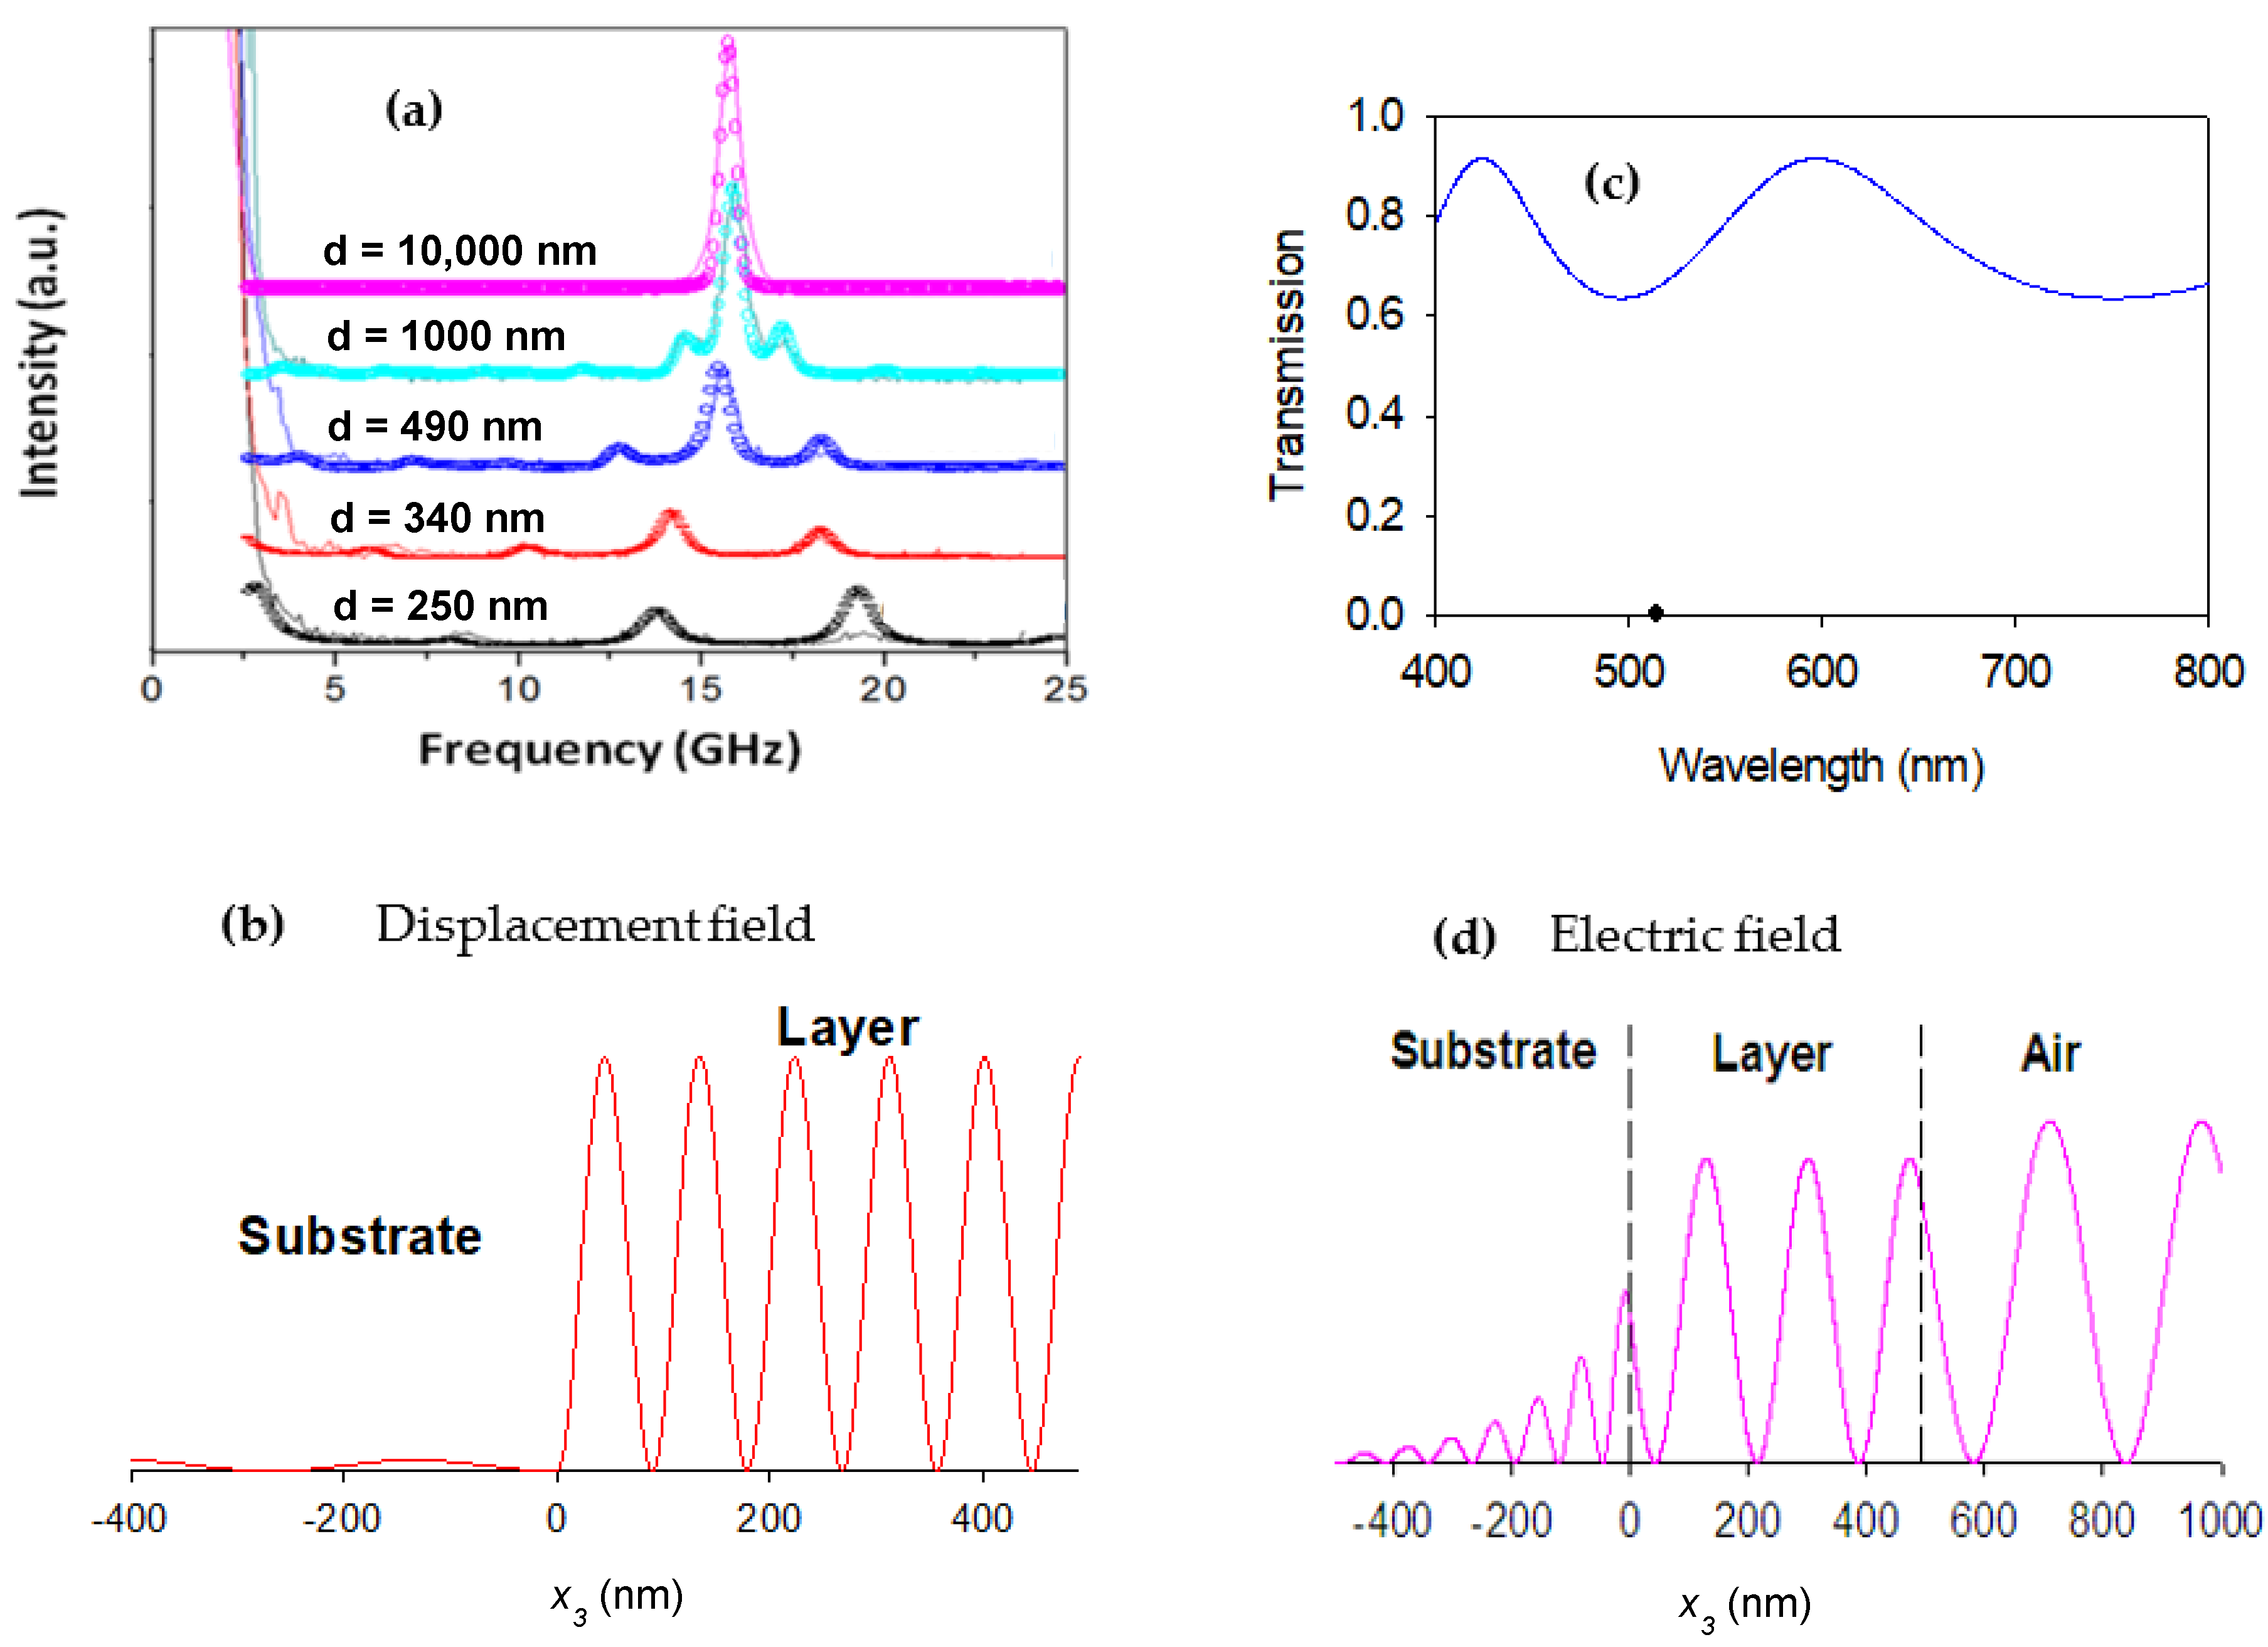
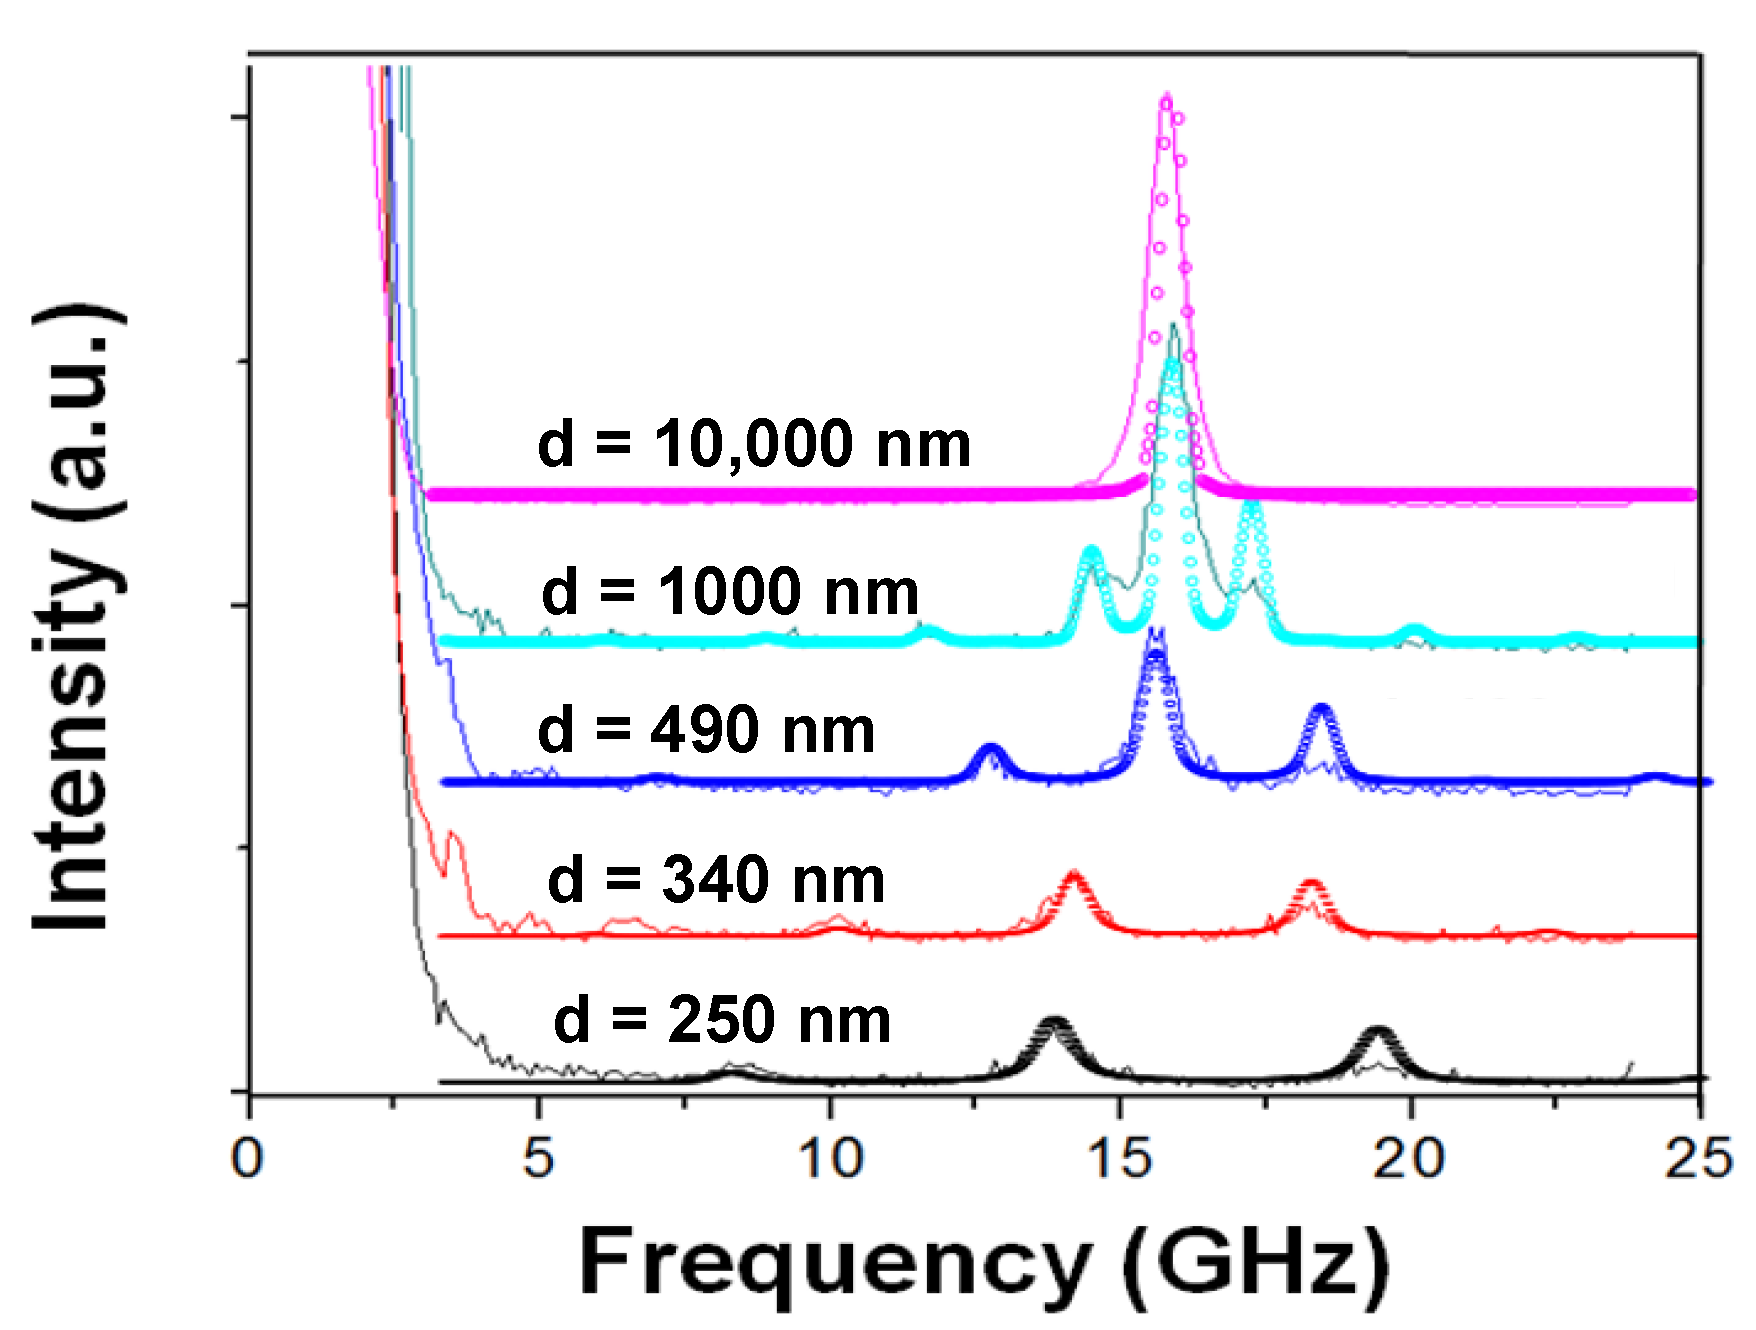
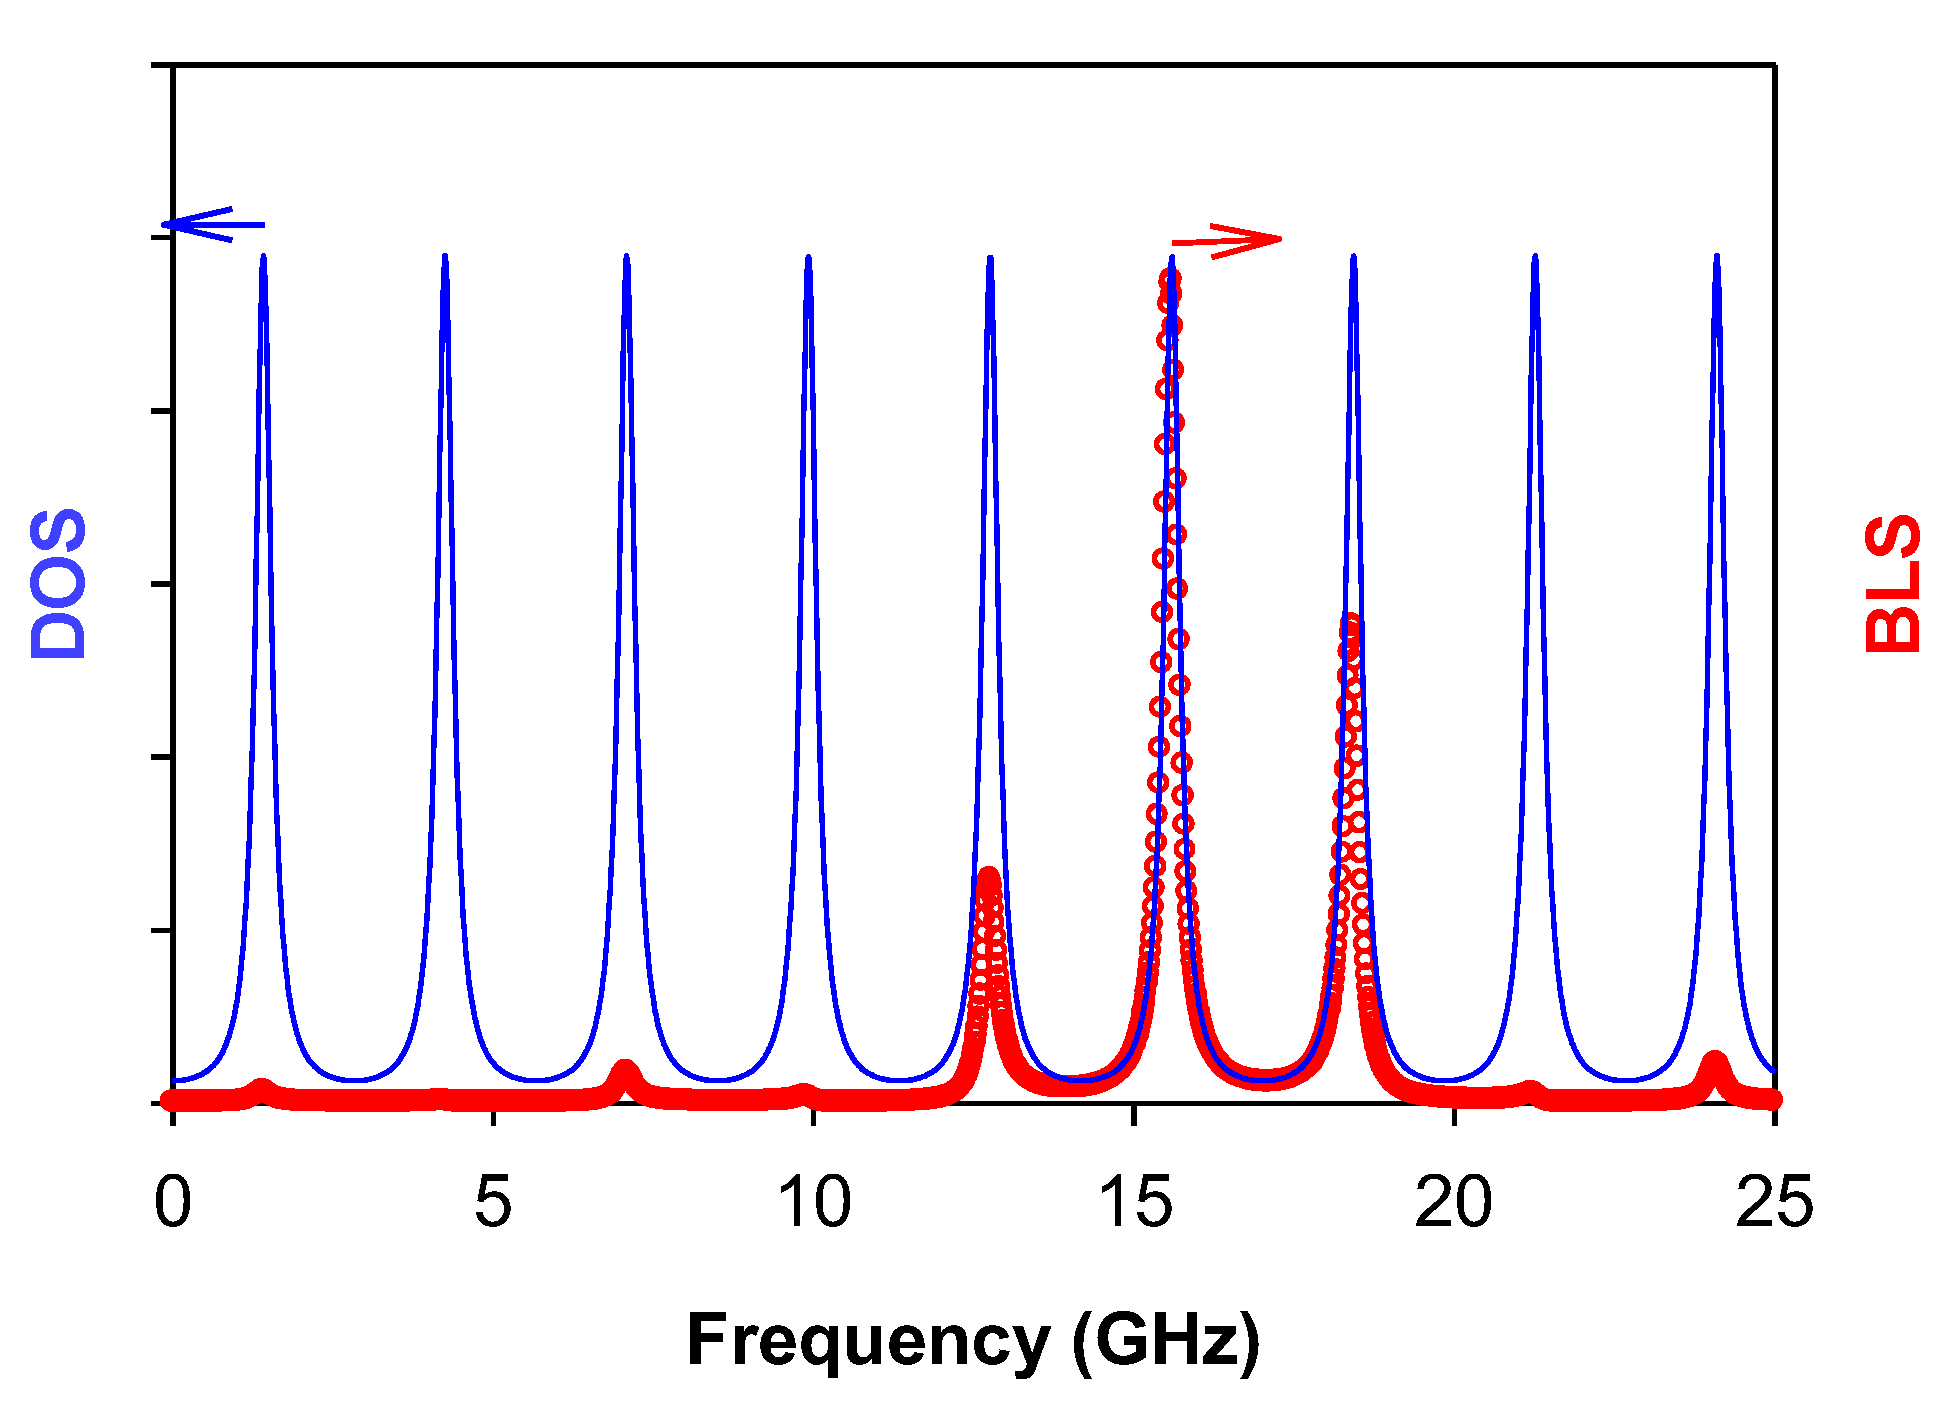
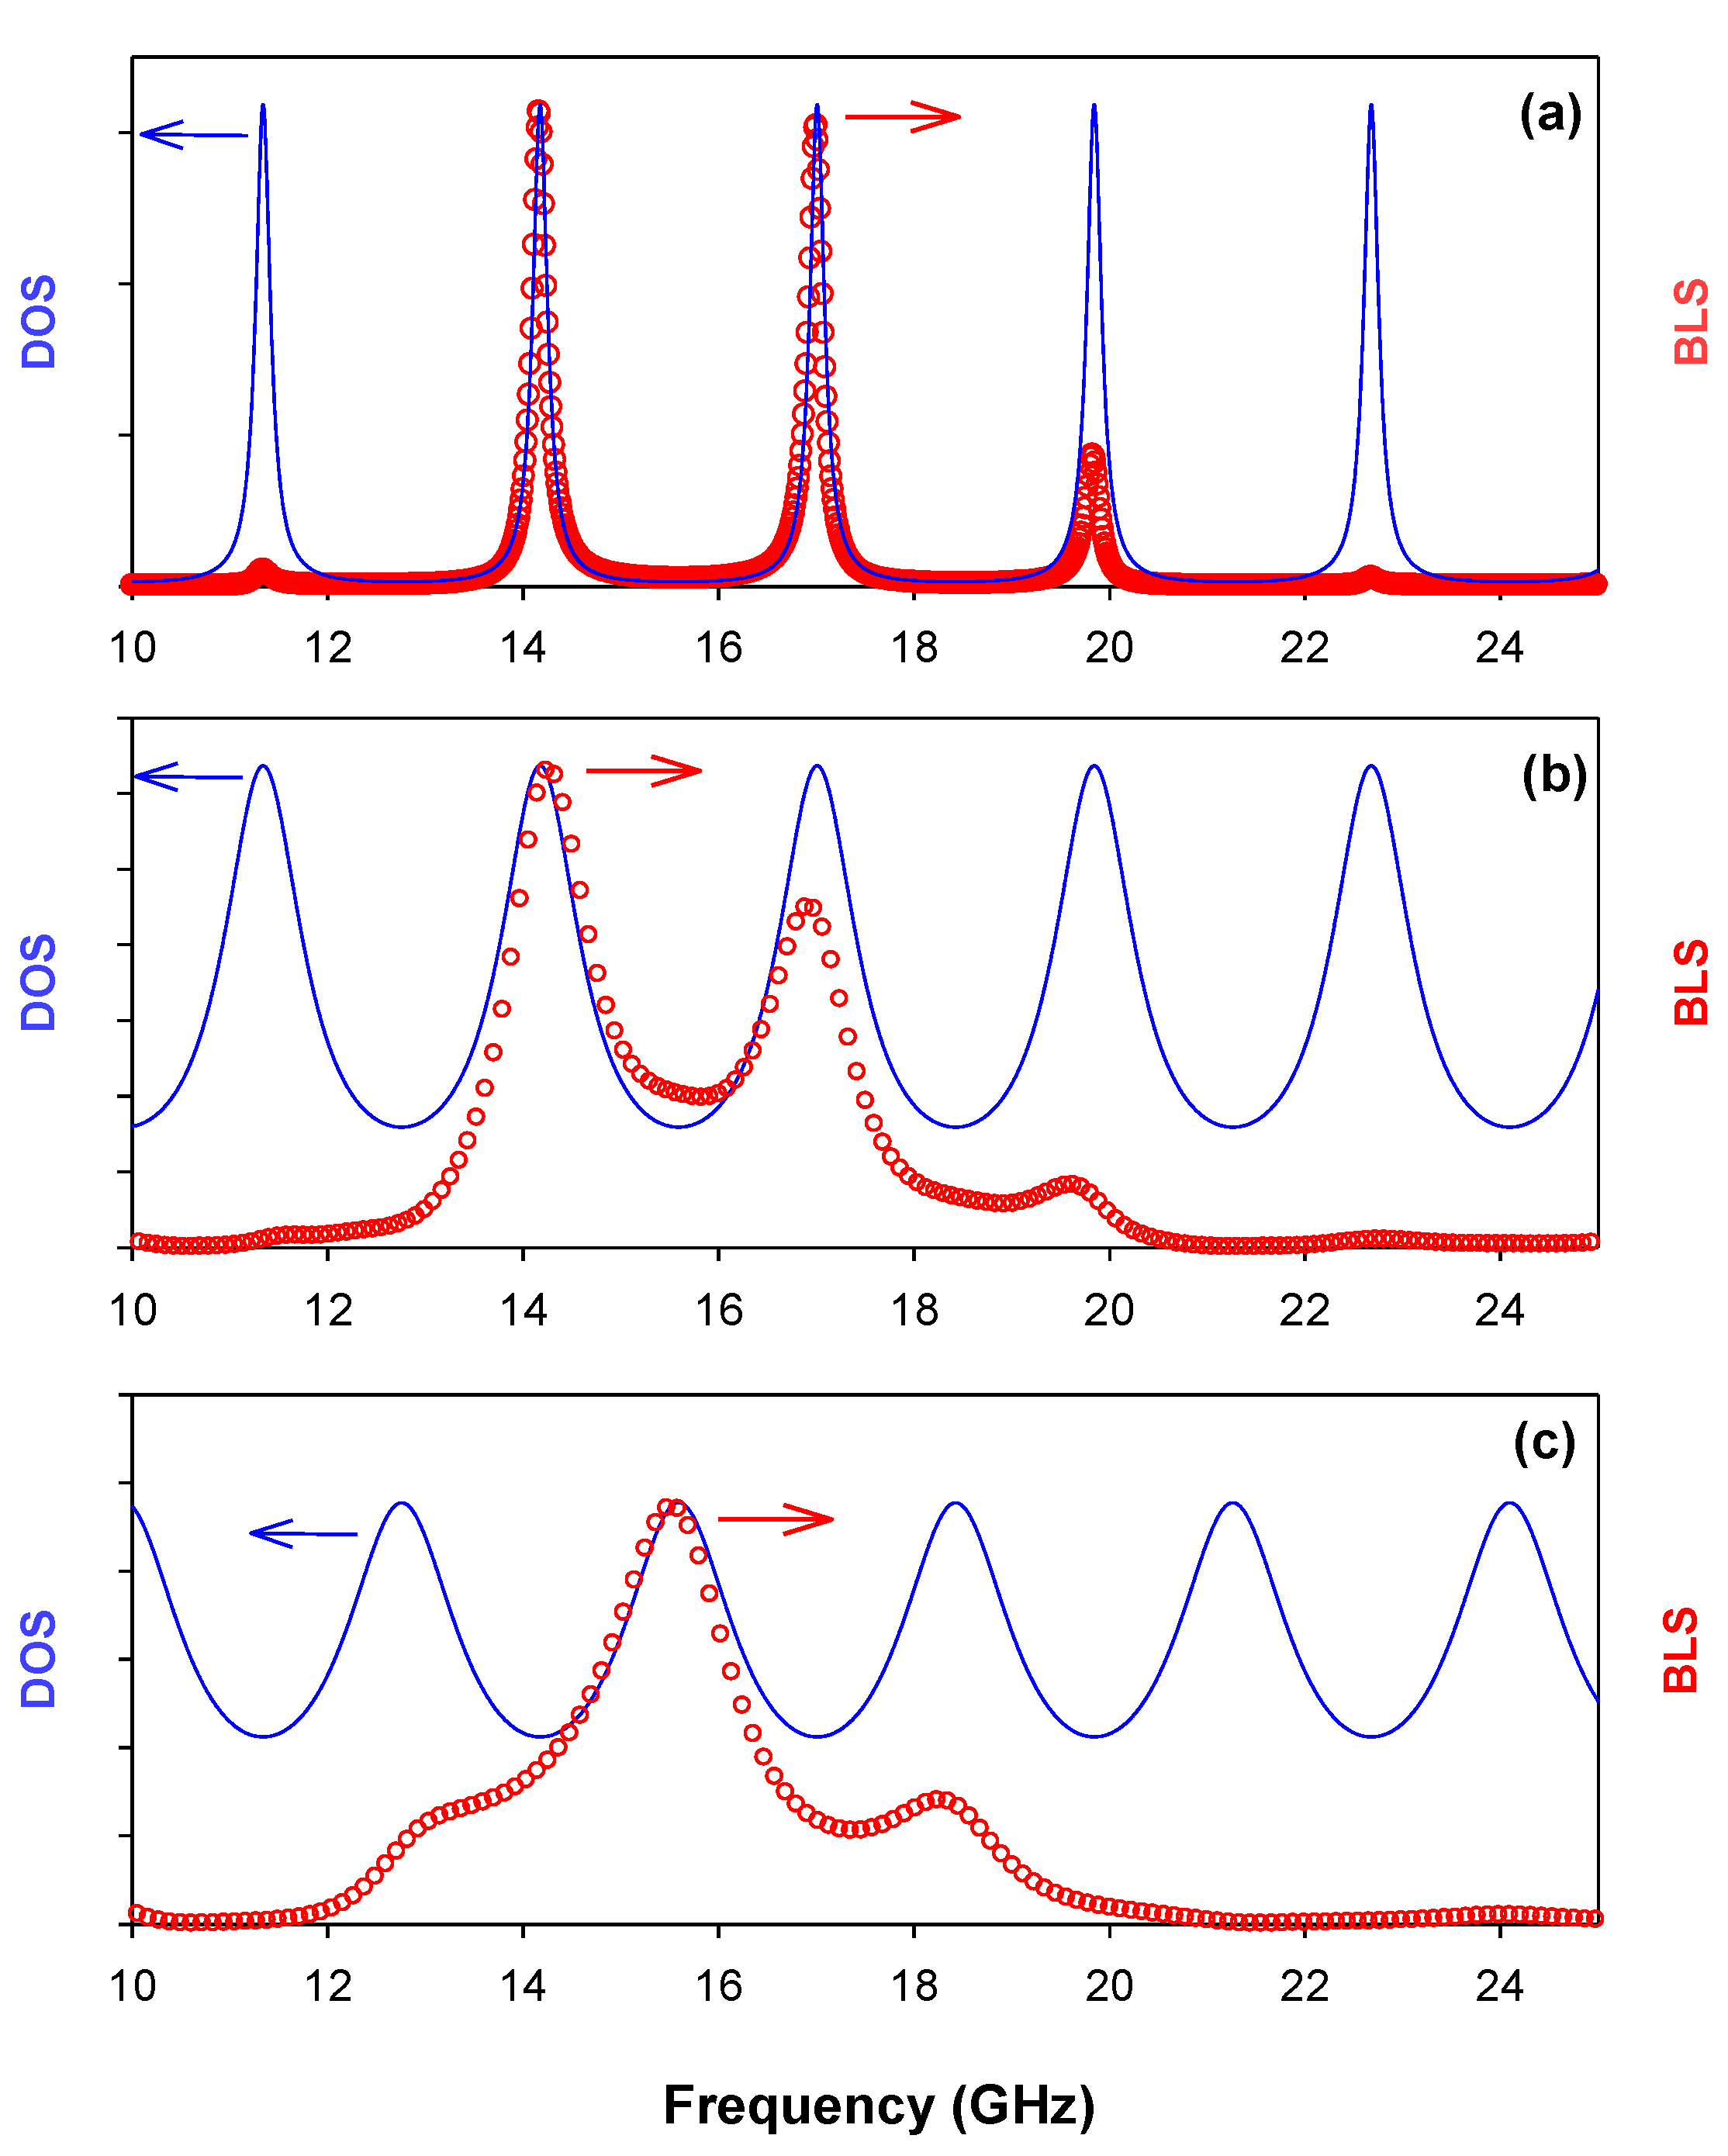
3. Numerical and Experimental Results

3.1. Experimental Setup

The polymer chosen for the investigation was PMMA 75K300 from MicroChem Corp. Layers with thickness ranging from 250 nm to 10 μm were fabricated by spin-coating for 30 s with angular velocities ranging from 500 to 3000 revolutions per minute on top of a Si substrate. The spectra were taken with a multipass (3+3) Tandem Fabry–Perot Interferometer from JRS Scientific Instruments. The λ = 514.5 nm line of an Ar gas-ion laser was used for the incident radiation, at a mirror spacing of 6 mm and scanning amplitude of 490 nm, resulting in a free spectral range (FSR) of ± 23.8 GHz. The backscattering angle was set to 8 degrees [58]. The finite angle prevented reflected light from entering the collection objective, and subsequently the spectrometer. This angle causes an increase in the effective cavity length of d/cosθ. However, due to Snell’s law, the angle inside the polymer is reduced to 5.3 degrees, which causes an overestimation of the thickness of the polymer layer of less than half a percent. As the polymer is assumed to be isotropic, the change in angle does not affect the acoustic velocity. The laser power was kept as small as possible to avoid any heating effect, the glass transition temperature of PMMA was taken around 110 °C, the polarization of incident and reflected beam was PP with respect to the sample plane, the crystallographic orientation of the Si substrate was (100), the resistivity or carrier concentration of the Si substrate was 11.5 ohm·cm, p doped boron and the FPI finesse for FSR = 23.8 GHz was set to 100.

3.2. Results and Discussion

The Brillouin spectra for the PMMA layers of different thicknesses are shown in Figure 2a by full curves. When the thickness of the film was reduced to below one micrometer, a triplet structure was observed around   q = 0.036   nm 1 (i.e., f 1 = q v 1 / 2 π = 15.9   GHz). Indeed, multiple reflections of an acoustic excitation from the film surface and interface with the substrate give rise to the equally spaced modes yielding to standing waves. Furthermore, a sufficiently large elastic impedance Z = ρ v mismatch (involving two physical quantities, density ρ and longitudinal sound velocity   v ) is required for these standing waves observations and results in the quantification of their frequencies.
At normal incidence, the eigenmodes (standing modes) of the soft layer in contact with a hard substrate are given by   cos ( ω d v 1 ) = 0 , i.e., f m = ( 2 m + 1 ) v 1 / 4 d (m is an integer). One can notice that for films with further increasing thicknesses, the spacing between the equidistant longitudinal acoustic modes Δ f m = v 1 / 2 d decreases, giving rise to a single mode (for thick layer d = 10   μ m ) falling at the frequency of the longitudinal bulk-like acoustic mode in the polymer, namely f 1 = v 1 q / 2 π 16   GHz. Indeed, for a thick layer, the frequencies of the modes become very close to each other and the sinc function becomes a delta function, with the result that only the phonon wavevector respecting the conservation of the momentum   q = k i k s is observed, as illustrated in Figure 2a for   d = 10   μ m . The intensity of the peak coming from the longitudinal bulk-like acoustic mode in the substrate falls at a high Brillouin frequency f 2 = 2 n 2 v 2 / λ 114   GHz, and therefore does not interfere with the spectra coming from the layer observed around 16   GHz.
We have reproduced the theoretical results corresponding to the experimental spectra in Figure 2a represented by open circles using Equations (6), (11), (14) and (15). The elastic, optic and photoelastic parameters of both PMMA and Si materials used in the theoretical calculations are listed in Table 1 [41,59,60]. Good agreement between the theoretical curves and the experimental data was found. The theoretical spectra had to be convoluted with the instrumental broadening function (Gaussian with Γ   0.53   GHz) to match the experimental spectra in Figure 2a. It is worth noticing that the contribution coming from the motion of the interfaces (Equation (14)) is negligible, especially for thick layers as it is explained in Figure A1 in the Appendix A.
Figure 2b shows the displacement field versus the space position for the mode at f = 16 GHz and d = 490 nm. One can see that the elastic field is well confined to the layer and almost vanishes in the substrate. Figure 2c shows the behavior of the transmission of the optical wave as a function of the wavelength. The transmission amplitude (evaluated at the top of the substrate x 3 = 0 ) shows Fabry–Perot oscillations with an amplitude of around 0.75 at λ = 514.5 nm. The variation of the electric field in the x 3   direction is plotted in Figure 2d for λ = 514.5 nm and d = 490 nm. One can notice a sharp decrease of the amplitude of the field as a function of the penetration depth which results from the absorption coefficient in Si (see Table 1). These results demonstrate the weak contribution of the substrate to the scattered field and justify the assumptions made in deducing the simple analytical expression (Equation (25)). The length L of the substrate for which light interacts with phonons is less than   1   μ m (Figure 2d).
Figure 3 shows the theoretical BLS spectra obtained from the approximate expression (Equation (22)). One can see a quite good agreement between the approximate results and the experimental data for each value of the layer thickness, which confirms the validity of the simple approximate expression given in Equation (23). The discrepancy between the observed and calculated BLS in Figure 3 is due to the simple analytical expression (Equation (23)) used where the contribution of the substrate in the BLS as well as the ripple mechanism are neglected.
The variation of the density of states (DOS) is calculated using Equation (17) for different layer thicknesses as shown in Figure 4a. As predicted from Equation (17), for cos ( ω d v 1 ) = 0 (i.e., f m = ( 2 m + 1 ) v 1 / 4 d ), Δ n ( ω ) reaches a maximum value of 1 π Z 2 Z 1 2 and for sin ( ω d v 1 ) = 0 (i.e., f m = m v 1 / 2 d ), Δ n ( ω ) reaches a minimum value of 1 π Z 1 Z 2 0.05 . Figure 4b provides the frequencies of the layer modes (full curves) as a function of the thickness d. These modes are obtained from the maxima of the DOS displayed in Figure 4a and they coincide reasonably well with the modes obtained from the quantified expression   f m = ( 2 m + 1 ) v 1 / 4 d . One can notice a decrease of their frequencies as far as d increases. As a matter of comparison, we also reported the modes obtained from the maxima of the BLS experimental spectra around 16 GHz by red circles. We can see that the separation between the modes decreases as far as d increases. As demonstrated in Equation (21), the DOS can be extracted also from the reflection delay time, which is a measurable quantity [61]. This property has been used recently to extract the DOS from the delay time measurement in photonic coaxial cables [62].
In order to give a comparison between BLS and DOS spectra, we have plotted in Figure 5 the DOS (blue curves) and the theoretical BLS spectra without convolution (red curves) for d = 490 nm. One can see clearly that among all the peaks in the DOS, only those falling around 16 GHz are observed in the scattering spectrum as the latter decreases around the main peak as a sinc function. This result confirms our theoretical findings demonstrated in Equation (25).
As a matter of completeness, we have also numerically checked the effect of the impedance of the substrate on the shape of the DOS and the theoretical BLS spectra for the same film of thickness d = 490 nm. We have found that when the impedance of the substrate Z 2 is lower than that of the PMMA layer Z 1 ( Z 2 Z 1 , i.e., Z 2 = 0.1 Z 1 ) , then the modes of the surface layer become very close to the stationary modes of a layer with free surfaces on both sides (called an unsupported layer or membrane [17,63]). These modes are given by sin ( ω d v 1 ) = 0 (i.e., f m = m v 1 / 2 d ) as it is shown in the DOS of Figure 6a displayed by a blue curve. The behavior of the BLS (red curve) shows again a sinc function around the main peak at 17 GHz, similar to the case of the PMMA layer with a free surface from one side and a blocked surface from the other side (Figure 5). In the case where the impedance of the substrate and the surface layer are such that   0.5 Z 1 < Z 2 < 1.5 Z 1 , then oscillations in the DOS become less deep, especially for   Z 2   Z 1 , and the behavior of the BLS spectra does not follow the shape of a sinc function as it is shown in Figure 6b,c. The reason for this discrepancy is due to the fact that the modes are not well confined in the layer and the displacement field is expanded over the substrate. Therefore, the thin layer behaves as a large layer where only the main mode around 15.5 GHz is observed as it is shown in Figure 6c. Additionally, the frequencies of the resonant modes in the DOS for   0 Z 2 < 0.5 Z 1 are close to those of the PMMA layer with free surfaces, whereas the frequencies of the resonant modes in the DOS for   1.5 Z 1 Z 2 are close to those of the PMMA layer with blocked surface from the bottom side (Figure 4a).

4. Conclusions

The results presented in this paper are based on an analytical calculation of the Brillouin light scattering and the density of states for a layer deposited on a substrate. We have presented first a detailed analytical calculation of the BLS intensity taking into account the modulation of elastic, optic and photoelastic constants in the different media constituting the system. Then, in order to explain the behavior of the experimental light scattering intensity, we have simplified the theoretical expression of the intensity of the system (layer/substrate) in the case of a soft layer on a hard substrate, which enables us to give an analytical comparison between BLS and DOS intensities. Theoretical and experimental results are given in the case of PMMA layer on Si substrate.
A very good agreement has been obtained between theoretical and experimental BLS spectra. In particular, we have shown that while the peaks in the DOS present a uniform behavior, the BLS spectra follow a sinc function shape around a given frequency fixed by the chosen laser wavelength. These results also remain valid when the impedance of the substrate is lower than that of the surface layer; however, a difference appears between DOS and BLS spectra when the impedances of the substrate and surface layer are close to each other. The results presented in this paper can be generalized to multilayered structures. This work is in progress.

Supplementary Materials

The following supporting information can be downloaded at: https://www.mdpi.com/article/10.3390/cryst12091212/s1, S1: Elastic displacement field calculation; S2: Electric field and electromagnetic Green’s function calculation; S3: Determination of the constant of normalization of the displacement field. Figure S1: Schematic representation of one layer (labeled i = 1) of width d deposited on a substrate (labeled i = 2). The x3 axis is normal to the surface.

Author Contributions

Conceptualization, C.M.S.T. and B.D.-R.; Formal analysis, J.C., E.C.-A. and F.A.; Investigation, E.H.E.B. and B.D.-R.; Methodology, C.M.S.T.; Software, O.E.A.; Supervision, C.M.S.T. and B.D.-R.; Validation, F.A.; Visualization, E.C.-A. and F.A.; Writing—original draft, O.E.A. and J.C.; Writing—review and editing, E.H.E.B. All authors have read and agreed to the published version of the manuscript.

Funding

ICN2 is funded by the CERCA program/Generalitat de Catalunya and is supported by the Severo Ochoa program from Spanish MINECO (Grant No. SEV-2017-0706). F.A., E.C.-A. and C.M.S.T. acknowledge support from the Spanish MICINN project SIP (PGC2018-101743-B-I00).

Conflicts of Interest

The authors declare no conflict of interest.

Appendix A. Effect of the Moving Interface Mechanism on BLS Spectra

In Figure A1, we give a comparison of the BLS spectra with (continuous curves) and without (dashed curves) taking into account the term associated to the moving interface or ripple effect (Equation (14)). We can see that both curves are almost similar especially for thick layers.
Figure A1. Theoretical Brillouin light scattering spectra displayed at q = 0.036   nm 1 for a series of supported PMMA films with different thicknesses deposited on Si substrate, with (continuous curves) and without (dashed curves) taking into account the deformation of the interfaces.
Crystals 12 01212 g0a1

References

  1. Dobrzynski, L.; El Boudouti, E.H.; Akjouj, A.; Pennec, Y.; Al-Wahsh, H.; Lévêque, G.; Djafari-Rouhani, B. Phononics, 1st ed.; Elsevier: Amsterdam, The Netherlands, 2017. [Google Scholar]
  2. Carlotti, G. Elastic Characterization of Transparent and Opaque Films, Multilayers and Acoustic Resonators by Surface Brillouin Scattering: A Review. Appl. Sci. 2018, 8, 124. [Google Scholar] [CrossRef]
  3. Bottani, C.E.; Fioretto, D. Brillouin scattering of phonons in complex materials. Adv. Phys. X 2018, 3. [Google Scholar] [CrossRef]
  4. El Boudouti, E.H.; Djafari-Rouhani, B. Acoustic waves in finite superlattices. Phys. Rev. B 1994, 49, 4586–4592. [Google Scholar] [CrossRef]
  5. Alami, M.; El Boudouti, E.; Djafari-Rouhani, B.; El Hassouani, Y.; Talbi, A. Surface acoustic waves in one-dimensional piezoelectric-metallic phononic crystal: Effect of a cap layer. Ultrasonics 2018, 90, 80–97. [Google Scholar] [CrossRef] [PubMed]
  6. Bell, J.A.; Zanoni, R.; Seaton, C.T.; Stegeman, G.I.; Makous, J.; Falco, C.M. Elastic constants of, and Stonely waves in, molybdenum films measured by Brillouin scattering. Appl. Phys. Lett. 1988, 52, 610–612. [Google Scholar] [CrossRef]
  7. Zhang, X.; Comins, J.D.; Every, A.G.; Stoddart, P.R.; Pang, W.; Derry, T.E. Surface Brillouin scattering study of the surface excitations in amorphous silicon layers produced by ion bombardment. Phys. Rev. B 1998, 58, 13677–13685. [Google Scholar] [CrossRef]
  8. Zhang, X.; Manghnani, M.H.; Every, A.G. Evidence for a shear horizontal resonance in supported thin films. Phys. Rev. B 2000, 62, R2271–R2274. [Google Scholar] [CrossRef]
  9. Lai, K.; Finkelstein-Shapiro, D.; Lehmann, S.; Devos, A.; Mante, P.-A. Fano resonance between Stokes and anti-Stokes Brillouin scattering. Phys. Rev. Res. 2021, 3, L032010. [Google Scholar] [CrossRef]
  10. Wittkowski, T.; Distler, G.; Jung, K.; Hillebrands, B.; Comins, J.D. General methods for the determination of the stiffness tensor and mass density of thin films using Brillouin light scattering: Study of tungsten carbide films. Phys. Rev. B 2004, 69, 205401. [Google Scholar] [CrossRef]
  11. Izadi, A.; Sinha, M.; Papson, C.; Roccabianca, S.; Anthony, R. Mechanical behavior of SiNC layers on PDMS: Effects of layer thickness, PDMS modulus, and SiNC surface functionality. RSC Adv. 2020, 10, 39087–39091. [Google Scholar] [CrossRef]
  12. Alonso-Redondo, E.; Belliard, L.; Rolle, K.; Graczykowski, B.; Tremel, W.; Djafari-Rouhani, B.; Fytas, G. Robustness of elastic properties in polymer nanocomposite films examined over the full volume fraction range. Sci. Rep. 2018, 8, 16986. [Google Scholar] [CrossRef] [PubMed]
  13. Trzaskowska, A.; Mielcarek, S.; Wiesner, M.; Lombardi, F.; Mroz, B. Dispersion of the surface phonons in semiconductor/topological insulator Si/Bi2Te3 heterostructure studied by high resolution Brillouin spectroscopy. Ultrasonics 2021, 117, 106526. [Google Scholar] [CrossRef] [PubMed]
  14. Zhang, X.; Bandhu, R.S.; Sooryakumar, R.; Jonker, B.T. High-frequency standing longitudinal acoustic resonances in supported thin films. Phys. Rev. B 2003, 67. [Google Scholar] [CrossRef]
  15. Groenen, J.; Poinsotte, F.; Zwick, A.; Torres, C.M.S.; Prunnila, M.; Ahopelto, J. Inelastic light scattering by longitudinal acoustic phonons in thin silicon layers: From membranes to silicon-on-insulator structures. Phys. Rev. B 2008, 77, 045420. [Google Scholar] [CrossRef]
  16. Hartschuh, R.; Ding, Y.; Roh, J.H.; Kisliuk, A.; Sokolov, A.P.; Soles, C.L.; Jones, R.L.; Hu, T.J.; Wu, W.L.; Mahorowala, A.P. Brillouin scattering studies of polymeric nanostructures. J. Polym. Sci. Part B Polym. Phys. 2004, 42, 1106–1113. [Google Scholar] [CrossRef]
  17. Link, A.; Sooryakumar, R.; Bandhu, R.S.; Antonelli, G.A. Brillouin light scattering studies of the mechanical properties of ultrathin low-k dielectric films. J. Appl. Phys. 2006, 100, 013507. [Google Scholar] [CrossRef]
  18. Nakamura, N.; Ogi, H.; Hirao, M. Stable elasticity of epitaxial Cu thin films on Si. Phys. Rev. B 2008, 77, 245416. [Google Scholar] [CrossRef]
  19. Zerdali, M.; Hamzaoui, S.; Teherani, F.; Rogers, D. Growth of ZnO thin film on SiO2/Si substrate by pulsed laser deposition and study of their physical properties. Mater. Lett. 2006, 60, 504–508. [Google Scholar] [CrossRef]
  20. Trzaskowska, A.; Hakonen, P.; Wiesner, M.; Mielcarek, S. Generation of a mode in phononic crystal based on 1D/2D structures. Ultrasonics 2020, 106, 106146. [Google Scholar] [CrossRef]
  21. Razeeb, K.M.; Dalton, E.; Cross, G.; Robinson, A. Present and future thermal interface materials for electronic devices. Int. Mater. Rev. 2017, 63, 1–21. [Google Scholar] [CrossRef]
  22. Gomopoulos, N.; Cheng, W.; Efremov, M.; Nealey, P.F.; Fytas, G. Out-of-Plane Longitudinal Elastic Modulus of Supported Polymer Thin Films. Macromolecules 2009, 42, 7164–7167. [Google Scholar] [CrossRef]
  23. Gomopoulos, N.; Saini, G.; Efremov, M.; Nealey, P.F.; Nelson, K.; Fytas, G. Nondestructive Probing of Mechanical Anisotropy in Polyimide Films on Nanoscale. Macromolecules 2010, 43, 1551–1555. [Google Scholar] [CrossRef]
  24. Parsons, L.C.; Andrews, G.T. Observation of hypersonic phononic crystal effects in porous silicon superlattices. Appl. Phys. Lett. 2009, 95, 241909. [Google Scholar] [CrossRef]
  25. Walker, P.M.; Sharp, J.S.; Akimov, A.V.; Kent, A.J. Coherent elastic waves in a one-dimensional polymer hypersonic crystal. Appl. Phys. Lett. 2010, 97, 073106. [Google Scholar] [CrossRef]
  26. Aliev, G.N.; Goller, B.; Kovalev, D.; Snow, P.A. Hypersonic acoustic mirrors and microcavities in porous silicon. Appl. Phys. Lett. 2010, 96, 124101. [Google Scholar] [CrossRef]
  27. Hesami, M.; Gueddida, A.; Gomopoulos, N.; Dehsari, H.S.; Asadi, K.; Rudykh, S.; Butt, H.-J.; Djafari-Rouhani, B.; Fytas, G. Elastic wave propagation in smooth and wrinkled stratified polymer films. Nanotechnology 2018, 30, 045709. [Google Scholar] [CrossRef]
  28. El Boudouti, E.H.; Djafari-Rouhani, B.; Akjouj, A.; Dobrzynski, L. Acoustic waves in solid and fluid layered materials. Surf. Sci. Rep. 2009, 64, 471–594. [Google Scholar] [CrossRef]
  29. Pennec, Y.; Vasseur, J.O.; Djafari-Rouhani, B.; Dobrzyński, L.; Deymier, P.A. Two-dimensional phononic crystals: Examples and applications. Surf. Sci. Rep. 2010, 65, 229–291. [Google Scholar] [CrossRef]
  30. Quotane, I.; Amrani, M.; Ghouila-Houri, C.; El Boudouti, E.H.; Krutyansky, L.; Piwakowski, B.; Pernod, P.; Talbi, A.; Djafari-Rouhani, B. A Biosensor Based on Bound States in the Continuum and Fano Resonances in a Solid–Liquid–Solid Triple Layer. Crystals 2022, 12, 707. [Google Scholar] [CrossRef]
  31. Ezzahri, Y.; Grauby, S.; Rampnoux, J.M.; Michel, H.; Pernot, G.; Claeys, W.; Dilhaire, S.; Rossignol, C.; Zeng, G.; Shakouri, A. Coherent phonons in Si/SiGe superlattices. Phys. Rev. B 2007, 75, 195309. [Google Scholar] [CrossRef]
  32. Belliard, L.; Huynh, A.; Perrin, B.; Michel, A.; Abadias, G.; Jaouen, C. Elastic properties and phonon generation in Mo/Si superlattices. Phys. Rev. B 2009, 80, 155424. [Google Scholar] [CrossRef]
  33. Kimura, N.D.L.; Fainstein, A.; Huynh, A.; Perrin, B.; Jusserand, B.; Miard, A.; Lemaitre, A. Coherent Generation of Acoustic Phonons in an Optical Microcavity. Phys. Rev. Lett. 2007, 99, 217405. [Google Scholar] [CrossRef]
  34. Beardsley, R.P.; Akimov, A.; Henini, M.; Kent, A. Coherent Terahertz Sound Amplification and Spectral Line Narrowing in a Stark Ladder Superlattice. Phys. Rev. Lett. 2010, 104, 085501. [Google Scholar] [CrossRef]
  35. Lacharmoise, P.; Fainstein, A.; Jusserand, B.; Thierry-Mieg, V. Optical cavity enhancement of light–sound interaction in acoustic phonon cavities. Appl. Phys. Lett. 2004, 84, 3274–3276. [Google Scholar] [CrossRef]
  36. Maldovan, M.; Thomas, E.L. Simultaneous localization of photons and phonons in two-dimensional periodic structures. Appl. Phys. Lett. 2006, 88, 251907. [Google Scholar] [CrossRef]
  37. Entezar, S.R.; Namdar, A. Localized modes in defective multilayer structures. Phys. Rev. A 2009, 80, 013814. [Google Scholar] [CrossRef]
  38. Liang, B.; Guo, X.S.; Tu, J.; Zhang, D.; Cheng, J.C. An acoustic rectifier. Nat. Mater. 2010, 9, 989–992. [Google Scholar] [CrossRef]
  39. Vollmer, F.; Arnold, S. Whispering-gallery-mode biosensing: Label-free detection down to single molecules. Nat. Methods 2008, 5, 591–596. [Google Scholar] [CrossRef]
  40. Botsis, J.; Humbert, L.; Colpo, F.; Giaccari, P. Embedded fiber Bragg grating sensor for internal strain measurements in polymeric materials. Opt. Lasers Eng. 2005, 43, 491–510. [Google Scholar] [CrossRef]
  41. Gomopoulos, N.; Maschke, D.; Koh, C.Y.; Thomas, E.L.; Tremel, W.; Butt, H.-J.; Fytas, G. One-Dimensional Hypersonic Phononic Crystals. Nano Lett. 2010, 10, 980–984. [Google Scholar] [CrossRef]
  42. Schneider, D.; Liaqat, F.; El Boudouti, E.H.; El Hassouani, Y.; Djafari-Rouhani, B.; Tremel, W.; Butt, H.-J.; Fytas, G. Engineering the Hypersonic Phononic Band Gap of Hybrid Bragg Stacks. Nano Lett. 2012, 12, 3101–3108. [Google Scholar] [CrossRef] [PubMed]
  43. Schneider, D.; Liaqat, F.; El Boudouti, E.H.; El Abouti, O.; Tremel, W.; Butt, H.-J.; Djafari-Rouhani, B.; Fytas, G. Defect-Controlled Hypersound Propagation in Hybrid Superlattices. Phys. Rev. Lett. 2013, 111, 164301. [Google Scholar] [CrossRef] [PubMed]
  44. Alonso-Redondo, E.; Gueddida, A.; Huesmann, H.; El Abouti, O.; Tremel, W.; El Boudouti, E.H.; Djafari-Rouhani, B.; Fytas, G. Direction-dependent elastic properties and phononic behavior of PMMA/BaTiO3 nanocomposite thin films. J. Chem. Phys. 2017, 146, 203325. [Google Scholar] [CrossRef] [PubMed]
  45. Alonso-Redondo, E.; Huesmann, H.; El Boudouti, E.-H.; Tremel, W.; Djafari-Rouhani, B.; Butt, H.-J.; Fytas, G. Phoxonic Hybrid Superlattice. ACS Appl. Mater. Interfaces 2015, 7, 12488–12495. [Google Scholar] [CrossRef]
  46. Matsuda, O.; Larciprete, M.C.; Voti, R.L.; Wright, O.B. Fundamentals of picosecond laser ultrasonics. Ultrasonics 2014, 56, 3–20. [Google Scholar] [CrossRef]
  47. Colletta, M.; Gachuhi, W.; Gartenstein, S.A.; James, M.M.; Szwed, E.A.; Daly, B.C.; Cui, W.; Antonelli, G.A. Picosecond ultrasonic study of surface acoustic waves on periodically patterned layered nanostructures. Ultrasonics 2018, 87, 126–132. [Google Scholar] [CrossRef]
  48. Dehoux, T.; Ghanem, M.A.; Zouani, O.F.; Ducousso, M.; Chigarev, N.; Rossignol, C.; Tsapis, N.; Durrieu, M.-C.; Audoin, B. Probing single-cell mechanics with picosecond ultrasonics. Ultrasonics 2015, 56, 160–171. [Google Scholar] [CrossRef]
  49. Ashcroft, N.W.; Mermin, N.D. Solid State Physics, College ed.; Thomson Learning Inc.: Noida, India, 1976. [Google Scholar]
  50. Sturhahn, W.; Toellner, T.S.; Alp, E.E.; Zhang, X.; Ando, M.; Yoda, Y.; Kikuta, S.; Seto, M.; Kimball, C.W.; Dabrowski, B. Phonon Density of States Measured by Inelastic Nuclear Resonant Scattering. Phys. Rev. Lett. 1995, 74, 3832–3835. [Google Scholar] [CrossRef]
  51. Hess, C. Introduction to Scanning Tunneling Spectroscopy of Correlated Materials. In Quantum Materials: Experiments and Theory; Pavarini, E., Koch, E., van den Brink, J., Sawatzky, G., Eds.; Verlag des Forschungszentrum Jülich: Jülich, Germany, 2016. [Google Scholar]
  52. Neumaier, D.; Turek, M.; Wurstbauer, U.; Vogl, A.; Utz, M.; Wegscheider, W.; Weiss, D. All-Electrical Measurement of the Density of States in (Ga,Mn)As. Phys. Rev. Lett. 2009, 103, 087203. [Google Scholar] [CrossRef]
  53. Ghislotti, G.; Bottani, C.E. Brillouin scattering from shear horizontal surface phonons in silicon on insulator structures: Theory and experiment. Phys. Rev. B 1994, 50, 12131–12137. [Google Scholar] [CrossRef]
  54. Chirita, M.; Sooryakumar, R.; Xia, H.; Monteiro, O.R.; Brown, I.G. Observation of guided longitudinal acoustic modes in hard supported layers. Phys. Rev. B 1999, 60, R5153–R5156. [Google Scholar] [CrossRef]
  55. Zhang, X.; Sooryakumar, R.; Every, A.; Manghnani, M.H. Observation of organ-pipe acoustic excitations in supported thin films. Phys. Rev. B 2001, 64, 081402. [Google Scholar] [CrossRef]
  56. Sandercock, J.R. Structure in the Brillouin Spectra of Thin Films. Phys. Rev. Lett. 1972, 29, 1735–1738. [Google Scholar] [CrossRef]
  57. Djafari Rouhani, B.; Khourdifi, E.M. Light Scattering in Semiconductor Structures and Superlattices; Lockwood, D.J., Young, J.F., Eds.; Springer: New York, NY, USA, 1991. [Google Scholar]
  58. Cuffe, J. Phonon-Photon Interactions in Nanostructures. Ph.D. Thesis, CORK, Faculty of Science, National University of Ireland, Galway, Ireland, 2011. [Google Scholar]
  59. Szczurowski, M.K.; Martynkien, T.; Statkiewicz-Barabach, G.; Urbanczyk, W.; Khan, L.; Webb, D.J. Measurements of stress-optic coefficient in polymer optical fibers. Opt. Lett. 2010, 35, 2013–2015. [Google Scholar] [CrossRef] [PubMed]
  60. Donadio, D.; Bernasconi, M.; Tassone, F. Photoelasticity of crystalline and amorphous silica from first principles. Phys. Rev. B 2003, 68. [Google Scholar] [CrossRef]
  61. Yang, S.; Page, J.H.; Liu, Z.; Cowan, M.L.; Chan, C.T.; Sheng, P. Ultrasound Tunneling through 3D Phononic Crystals. Phys. Rev. Lett. 2002, 88, 104301. [Google Scholar] [CrossRef]
  62. Khattou, S.; Amrani, M.; Mouadili, A.; El Boudouti, E.H.; Talbi, A.; Akjouj, A.; Djafari-Rouhani, B. Comparison of density of states and scattering parameters in coaxial photonic crystals: Theory and experiment. Phys. Rev. B 2020, 102, 165310. [Google Scholar] [CrossRef]
  63. Graczykowski, B.; Gueddida, A.; Djafari-Rouhani, B.; Butt, H.-J.; Fytas, G. Brillouin light scattering under one-dimensional confinement: Symmetry and interference self-canceling. Phys. Rev. B 2019, 99, 165431. [Google Scholar] [CrossRef] [Green Version]
Figure 1. Schematic representation of one layer (labeled i = 1 ) of width d deposited on a substrate (labeled i = 2 ). The x 3 axis is normal to the surface. k i   and k s are the incident and scattered wavevectors in vacuum. The electromagnetic fields are polarized along the x 2 axis.   α and θ are the incident and refracted angles respectively.
Crystals 12 01212 g001
Figure 2. (a) Theoretical (open circles) and experimental (continuous curves) Brillouin light scattering for a series of supported PMMA films with different thicknesses deposited on a Si substrate. The main spectra appear at the frequency position of the longitudinal acoustic phonon around   q = 4 π n 1 λ = 0.036   nm 1   i.e., f 1 = q v 1 / 2 π = 15.9   GHz. (b) Square modulus of the displacement field versus the space position for the mode at f = 16 GHz and d = 490 nm. (c) Optical transmission through the layer versus the wavelength. The circle on the abscissa axis corresponds to 514.5 nm wavelength used in the experiment. (d) Square modulus of the electric field versus the space position.
Crystals 12 01212 g002
Figure 3. Theoretical spectra (open circles) evaluated using the approximate expression (Equation (25)) for the same thicknesses of PMMA film on Si substrate. Solid curves correspond to experiments.
Crystals 12 01212 g003
Figure 4. (a) Variation of density of states (in arbitrary units) of layer modes for the different layer thicknesses. (b) Quantified frequencies of layer modes as a function of layer thickness. Peak positions of experimental spectra are given as red circles around the frequency 16 GHz.
Crystals 12 01212 g004
Figure 5. Variation of the DOS (blue curves) and BLS intensity (red curves) as a function of the frequency for the PMMA layer of thickness d = 490   nm.
Crystals 12 01212 g005
Figure 6. Same as in Figure 5 but for a hypothetical substrate with impedance   Z 2 = 0.1   Z 1 (a),   Z 2 = 0.5   Z 1 (b) and Z 2 = 1.5   Z 1 (c).
Crystals 12 01212 g006
Table 1. Physical quantities of the PMMA layer and Si substrate used in the theoretical calculations. Mass density ( ρ ), sound velocity ( v ), photoelastic constant (   p 12   ) and refractive index ( n ).
Materialp (Kg/m3)v (m/s)p12n
PMMA115027780.31.4932
Si233584310.013.5 − 0.26i
Publisher’s Note: MDPI stays neutral with regard to jurisdictional claims in published maps and institutional affiliations.

