Article

Low Cycle Fatigue Crack Damage Behavior of TC21 Titanium Alloy with Basketweave Microstructure

1
School of Materials Science and Hydrogen Energy, Foshan University, Foshan 528000, China
2
Guangdong Key Laboratory for Hydrogen Energy Technologies, Foshan 528000, China
3
School of Materials Science and Engineering, Beihang University, Beijing 100191, China
*
Authors to whom correspondence should be addressed.
Crystals 2022, 12(9), 1211; https://doi.org/10.3390/cryst12091211
Submission received: 5 August 2022 / Revised: 21 August 2022 / Accepted: 24 August 2022 / Published: 28 August 2022
(This article belongs to the Special Issue Advances in High Strength Steels)

Abstract

:
Low cycle fatigue (LCF) crack initiation, propagation and damage behaviors of TC21 alloy with basketweave microstructure were investigated. The process of LCF damage was observed by a long-focus optical microscopic imaging system, and fatigue crack propagation was analyzed through in-situ SEM fatigue. The results indicated that LCF crack damage displayed different sensitivity to cyclic stress. LCF microcracks initiated from slip bands and propagated through the microcrack coalescences at high stress, while LCF cracks tended to initiate at the αL/β interface and connect with these interface microcracks. Furthermore, the LCF damage model was established on the basis of Lemaitre damage theory. When the maximum stress exceeded yield stress, LCF damage increased sharply and fatigue life decreased significantly, which agreed with experiment data.

1. Introduction

Titanium alloys with basketweave microstructure were widely used in key components of aviation due to their high strength and toughness [1]. During the take-off and landing stages, the aircraft structure endured a high-stress cyclic load. Thus, low cycle fatigue (LCF) of high strength and toughness titanium alloys was the key factor in ensuring component reliability [2].
The microstructure exerted a significant effect on the LCF properties of titanium alloys. Titanium alloys with lamellar microstructure obtained lower LCF properties than that with bimodal structure because of the large slip distance for lamellar microstructure [3]. The short slip band in the αp phase was often responsible for the high LCF properties in titanium alloys with bimodal [4,5] and tri-modal microstructure [6]; however, titanium alloy with lamellar microstructure had higher fatigue long crack propagation resistance owing to the tortuous crack growth path [7], while the lamellar microstructure reduced the resistance to crack initiation and microcrack propagation; it was indicated that LCF life was determined by the microcrack propagation owing to the short crack initiation life.
However, there are few reports on the effect of basketweave microstructure on LCF microcrack propagation. Much research was focused on LCF crack initiation for titanium alloys [8,9,10,11]. LCF cracks of titanium alloys with lamellar microstructure were inclined to initiate from the αL/β phase interface [8], the deformation twins [9,10] and the shear deformation and spheroidization of β lamellar [11]. Conversely, the relationship between high cycle fatigue (HCF) microcrack propagation and lamellar microstructure of titanium alloy has been reported [12,13,14]. HCF microcracks are initiated in multiple primary α laths and propagated easily by the connection to each other. When the width of α lath exceeded 0.5 μm, the small crack propagation decreased due to the resistance to pass through α lath [13]. The characteristics of transgranular and crystallographic were presented in the microcrack propagation owing to the basal and prismatic slip [14]; however, it was necessary to pay attention to the difference on LCF and HCF crack initiation, propagation and fatigue damage due to the different stress level.
Multi-crack collective behavior was a significant feature of low cycle fatigue of titanium alloys. Multi-crack damage has attracted much attention in low cycle fatigue life prediction. Sun [15] established a fatigue crack life prediction model including microcrack density, but this model was more suitable for high cycle fatigue life prediction. Pang [16] developed a multi-crack propagation life based on equivalent crack to evaluate the three-dimensional structural damage. Xiao [17] proposed Polynomial Chaos Expansion (PCE) model to describe multi-crack collective behavior. Considering fatigue strain energy, a damage mechanics model based on Lemaitre theory was put forward to calibrate the low cycle fatigue life [18], which can well describe the low cycle fatigue damage evolution and life prediction.
LCF cyclic soft behavior and deformation mechanism of TC21 titanium alloy were investigated in our previous study [19]; however, LCF microcrack propagation mechanisms and fatigue damage of the alloy with basketweave microstructure had not been reported. The evolution of LCF microcrack for TC21 titanium alloy was revealed by in-situ fatigue observation. The interaction between the LCF microcrack propagation and basketweave microstructure was analyzed. The LCF damage model-based Lemaitre mechanics was further established.

2. Materials and Methods
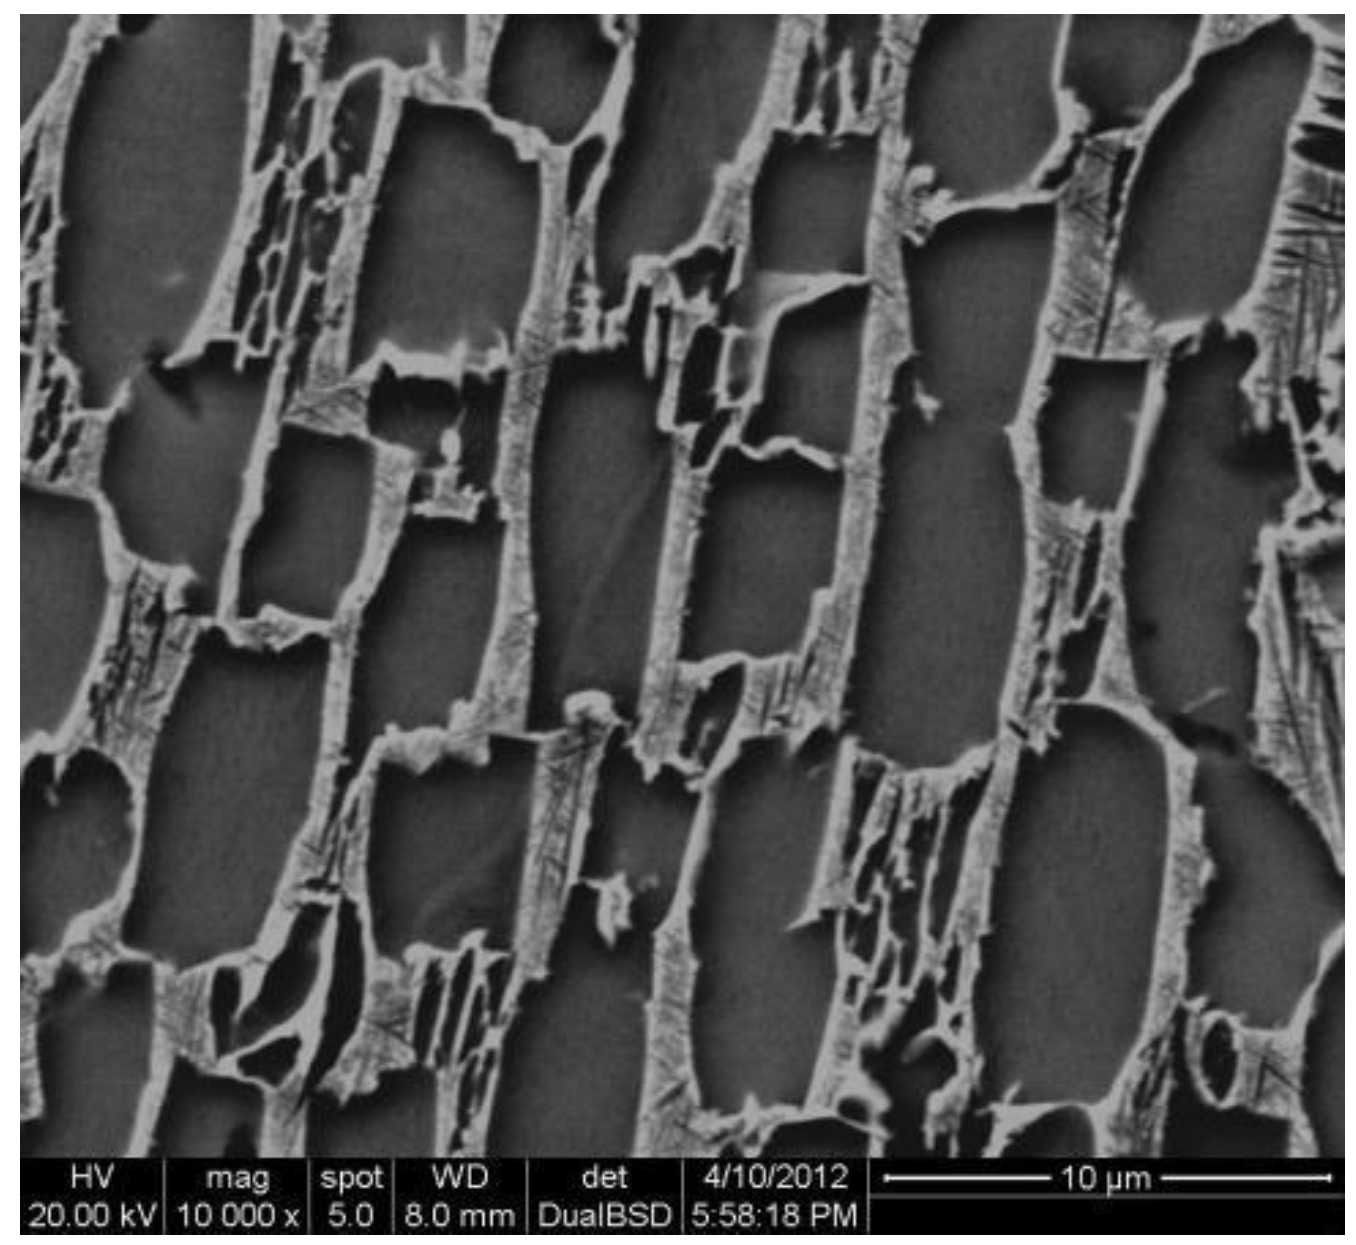
2.1. Materials

TC21 titanium alloy was used in this work with its nominal composition of Ti-6Al-2Zr-2Sn-2Mo-2Nb-1.5Cr (wt.%). The tensile strength and yield strength of titanium alloy with basketweave microstructure were 1070MPa and 970MPa, respectively. Detailed information can be referred to in the previous publications [19].

2.2. Surface Treatment

The machined fatigue specimens were subjected to degreasing, rough and fine grinding, and then electrolytic polishing. Double jet electrolytic thinning was adopted in the electrolyte of 59 pct methanol, 35 pct n-butanol, 6 pct perchloric acid at a voltage of 20~25 V, and the temperature was controlled at about −20 °C. After polishing, the machining trace of the sample was eliminated, and the basketweave microstructure of the titanium alloy can be observed on the specimen surface (Figure 1).

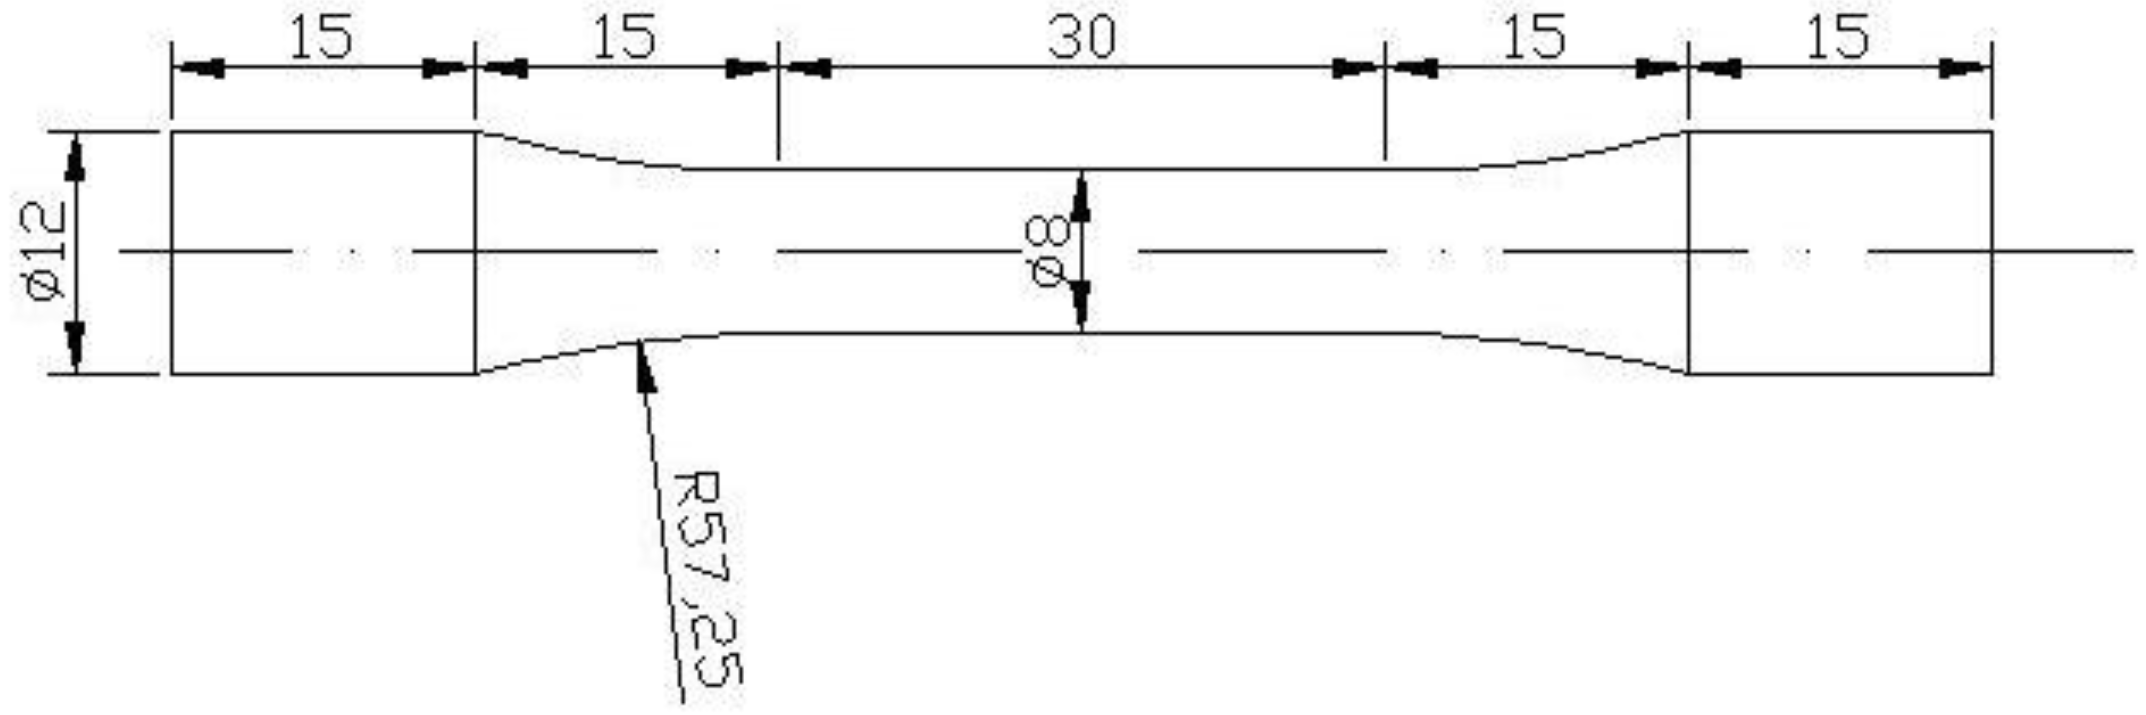
2.3. Low Cycle Fatigue

LCF tests were carried out using a servo-hydraulic testing machine (Instron 8801, Norwood, MA, USA) under the condition of stress-controlled conditions (R = −1) in order to observe fatigue cracks. Based on the yield strength of TC21 titanium alloy, low cycle fatigue stress levels were selected around the yield strength, and ranged from 850 MPa to 1000 MPa. Each fatigue test was carried out until the specimen was broken. A round bar specimen was used for the low cycle fatigue test (Figure 2). Furthermore, a strain-controlled test was carried out under the total strain of 1.4% and Rε = −1 to evaluate fatigue damage parameters.

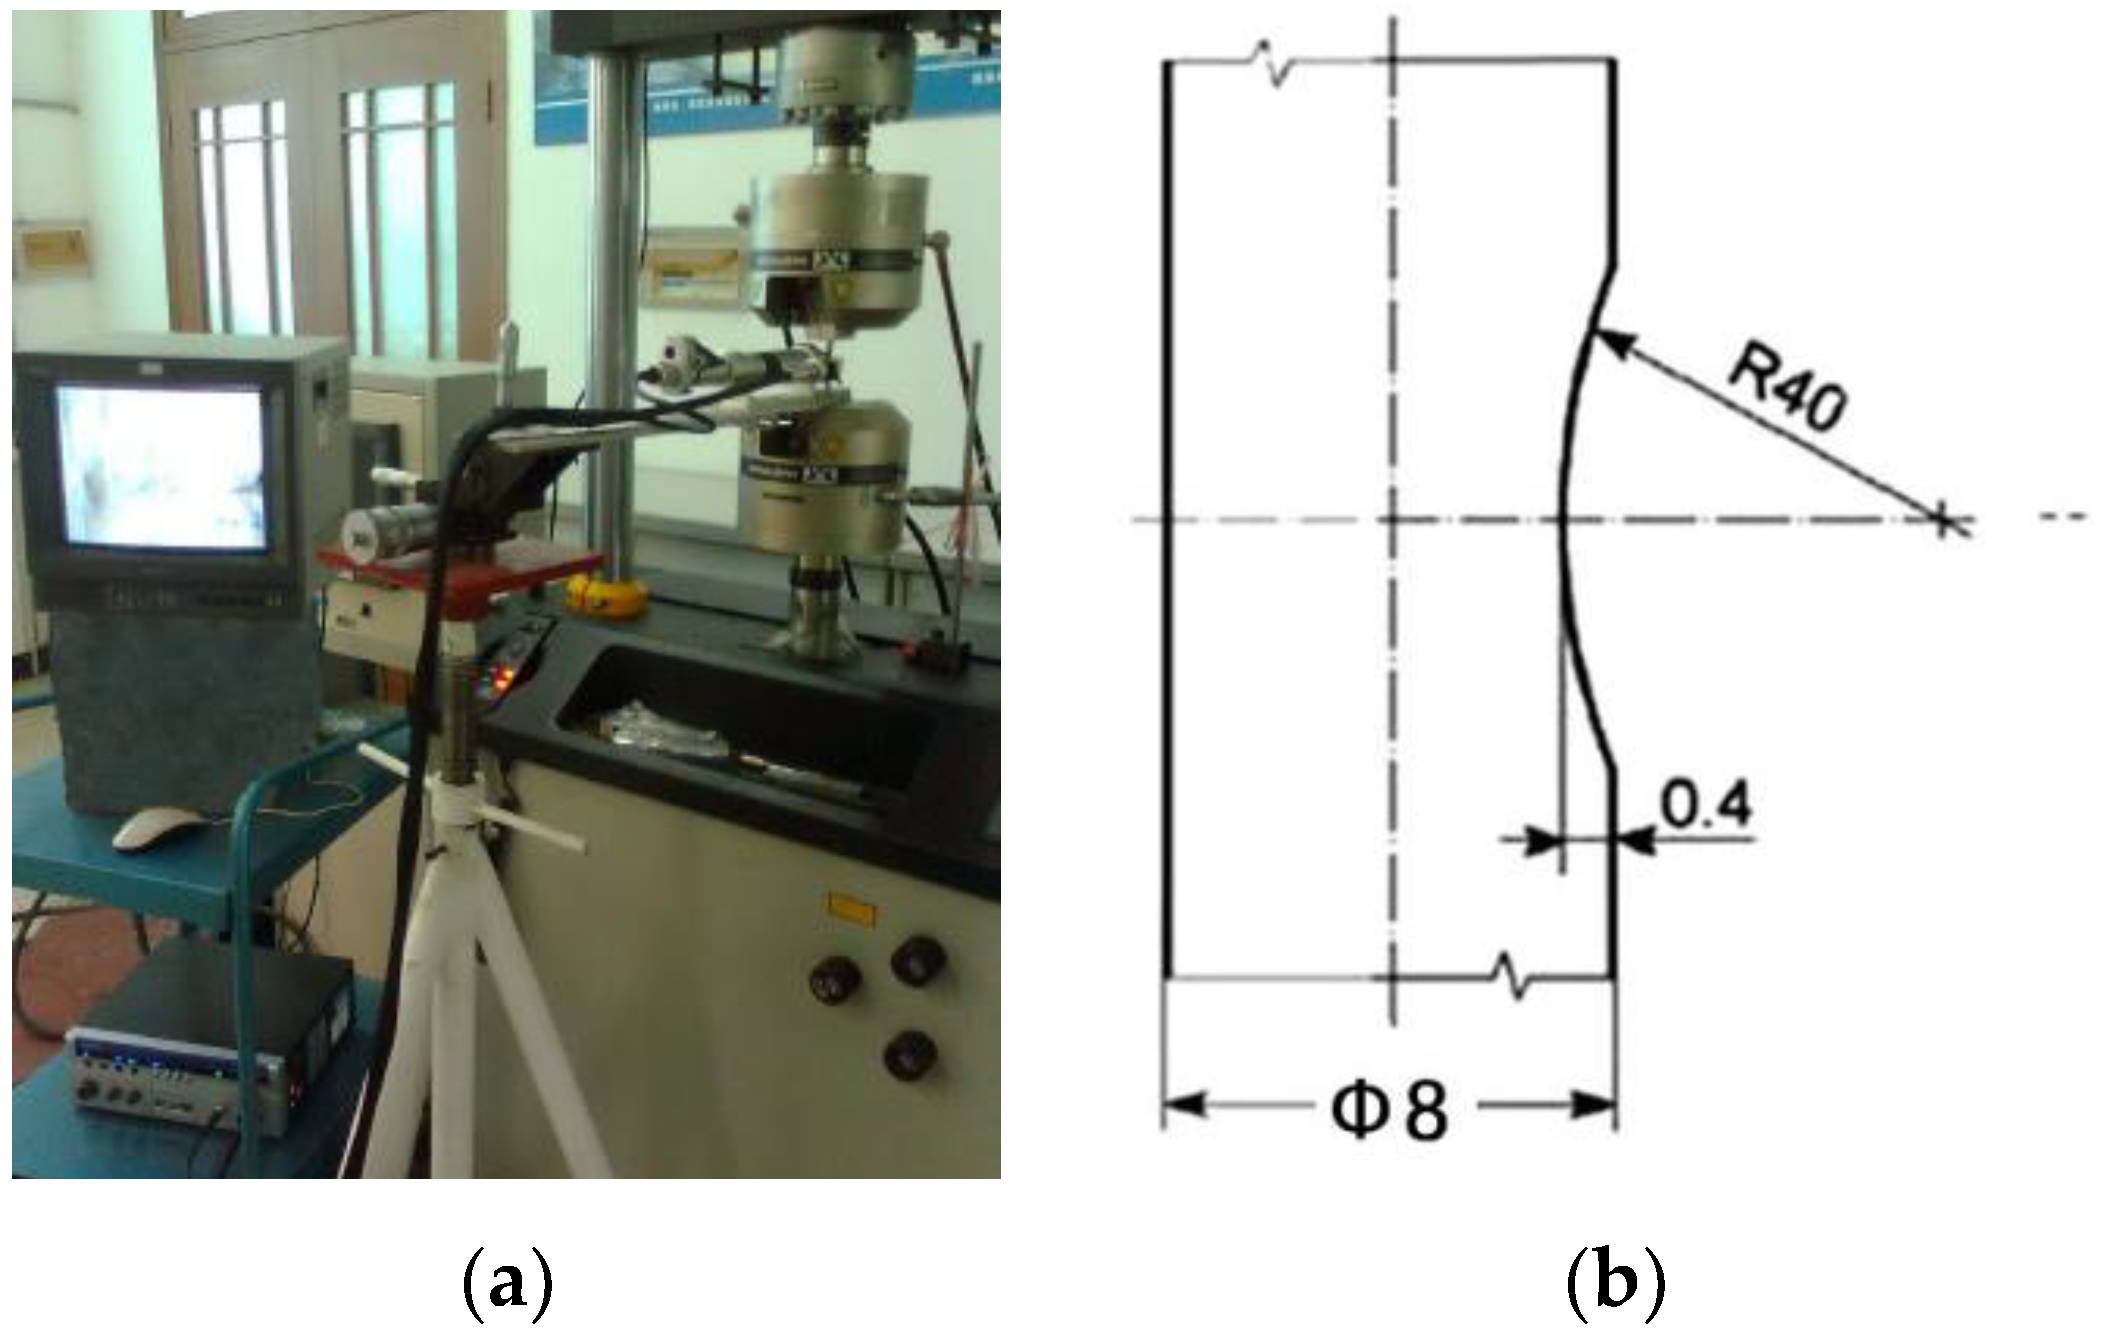
2.4. On Line Monitoring of Fatigue Crack Initiation and Propagation

LCF damage was observed online by a long-focus optical microscope observation system. The system was composed of two subsystems: a long-focus optical microscopic imaging system and a mobile bench (Figure 3a), which can observe the whole process of fatigue damage. An arc surface with a large radius of curvature was machined on the surface of the LCF specimen (Figure 3b), and electropolished to observe the process of fatigue crack initiation and propagation.
Fatigue crack observation was conducted at maximum stress of 1000 MPa, slightly higher than yield strength and 950 MPa slightly lower than yield strength with a stress ratio of −1, respectively. After certain cycles, loading was stayed at the mean load to keep the crack open. The fatigue damage observation system was used to make scanning observations (taking the plane center as the origin, left and right ± 2 mm, up and down ± 2 mm), and record the characteristics of small fatigue cracks. The above operations were repeated until the fatigue fracture occurred.

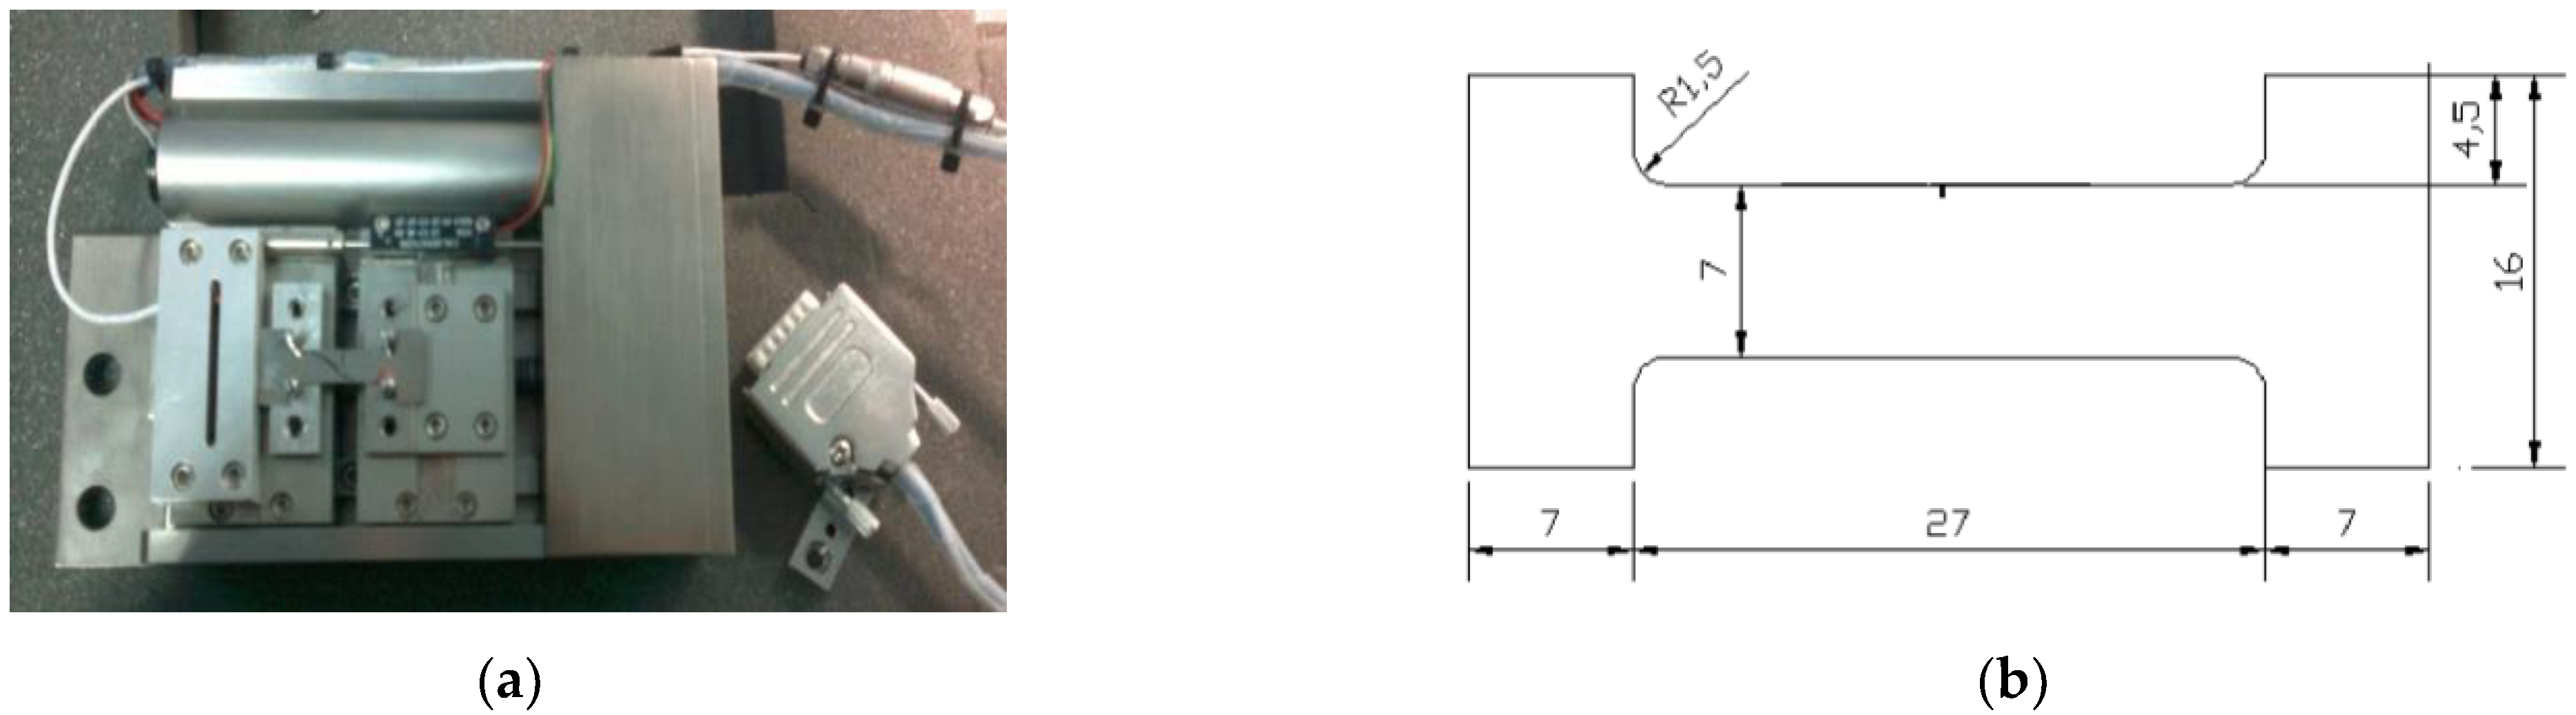
2.5. In Situ SEM Fatigue Test

An in-situ SEM fatigue test (Figure 4a) was carried out to observe the small crack initiation and growth process. The dimensions of the in-situ fatigue specimen are shown in Figure 4b. Sample thickness is about 1 mm. The fatigue sample was processed with a notch with a length of 1000 μm and a radius of 100 μm, which was prepared by 0.2 mm wire cutting. The fatigue crack initiation and propagation were in-situ observed by scanning electron microscope (CS3400, Cambridgeshire, England, United Kingdom).
Figure 5a shows the tensile load-displacement curve of the in-situ fatigue specimen. When the uniaxial tensile load F was up to 1500 N, A small amount of plastic deformation was observed at the notch root (Figure 5b). While plastic deformation occurred obviously at the notch root as the load reached up to 1800 N (Figure 5c). Microcracks can initiate from the notch root at the loading of 2000 N. Thus, fatigue specimens were loaded at the maximum stress of 1500 N and 1800 N with the stress ratio 0.1, which were used to analyze the LCF damage under low stress and high stress, respectively.

3. Results and Discussion

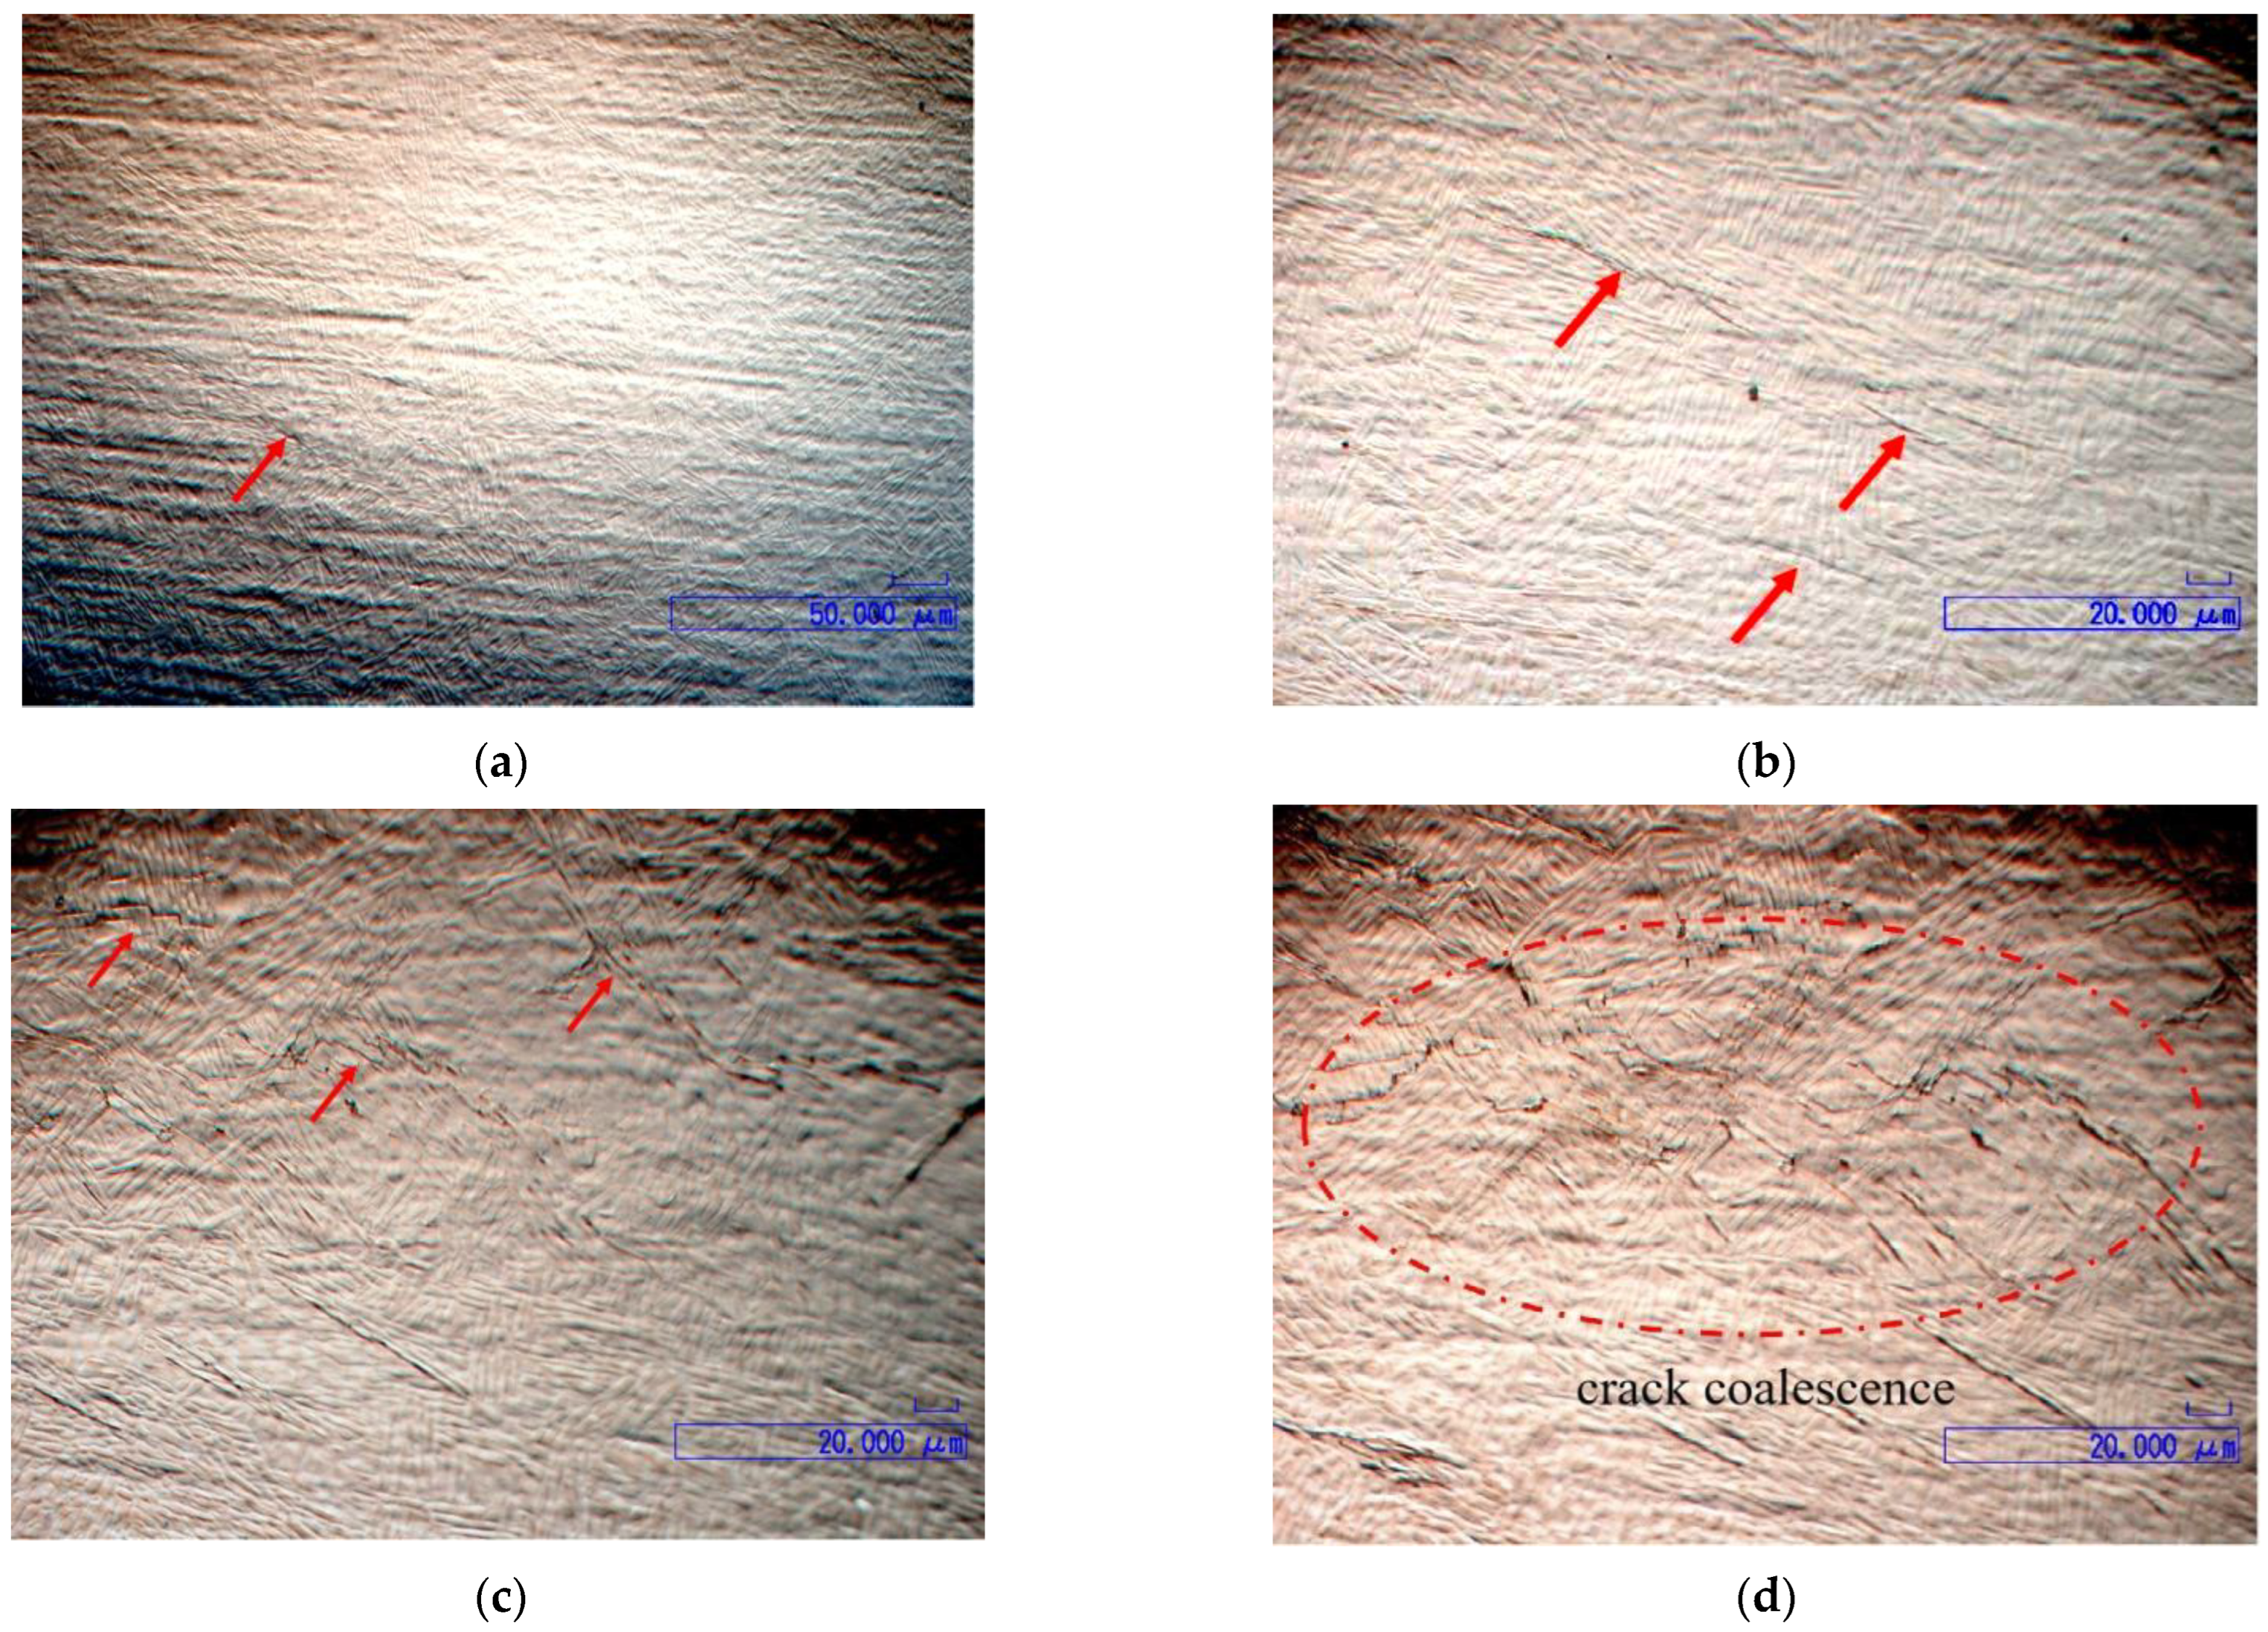
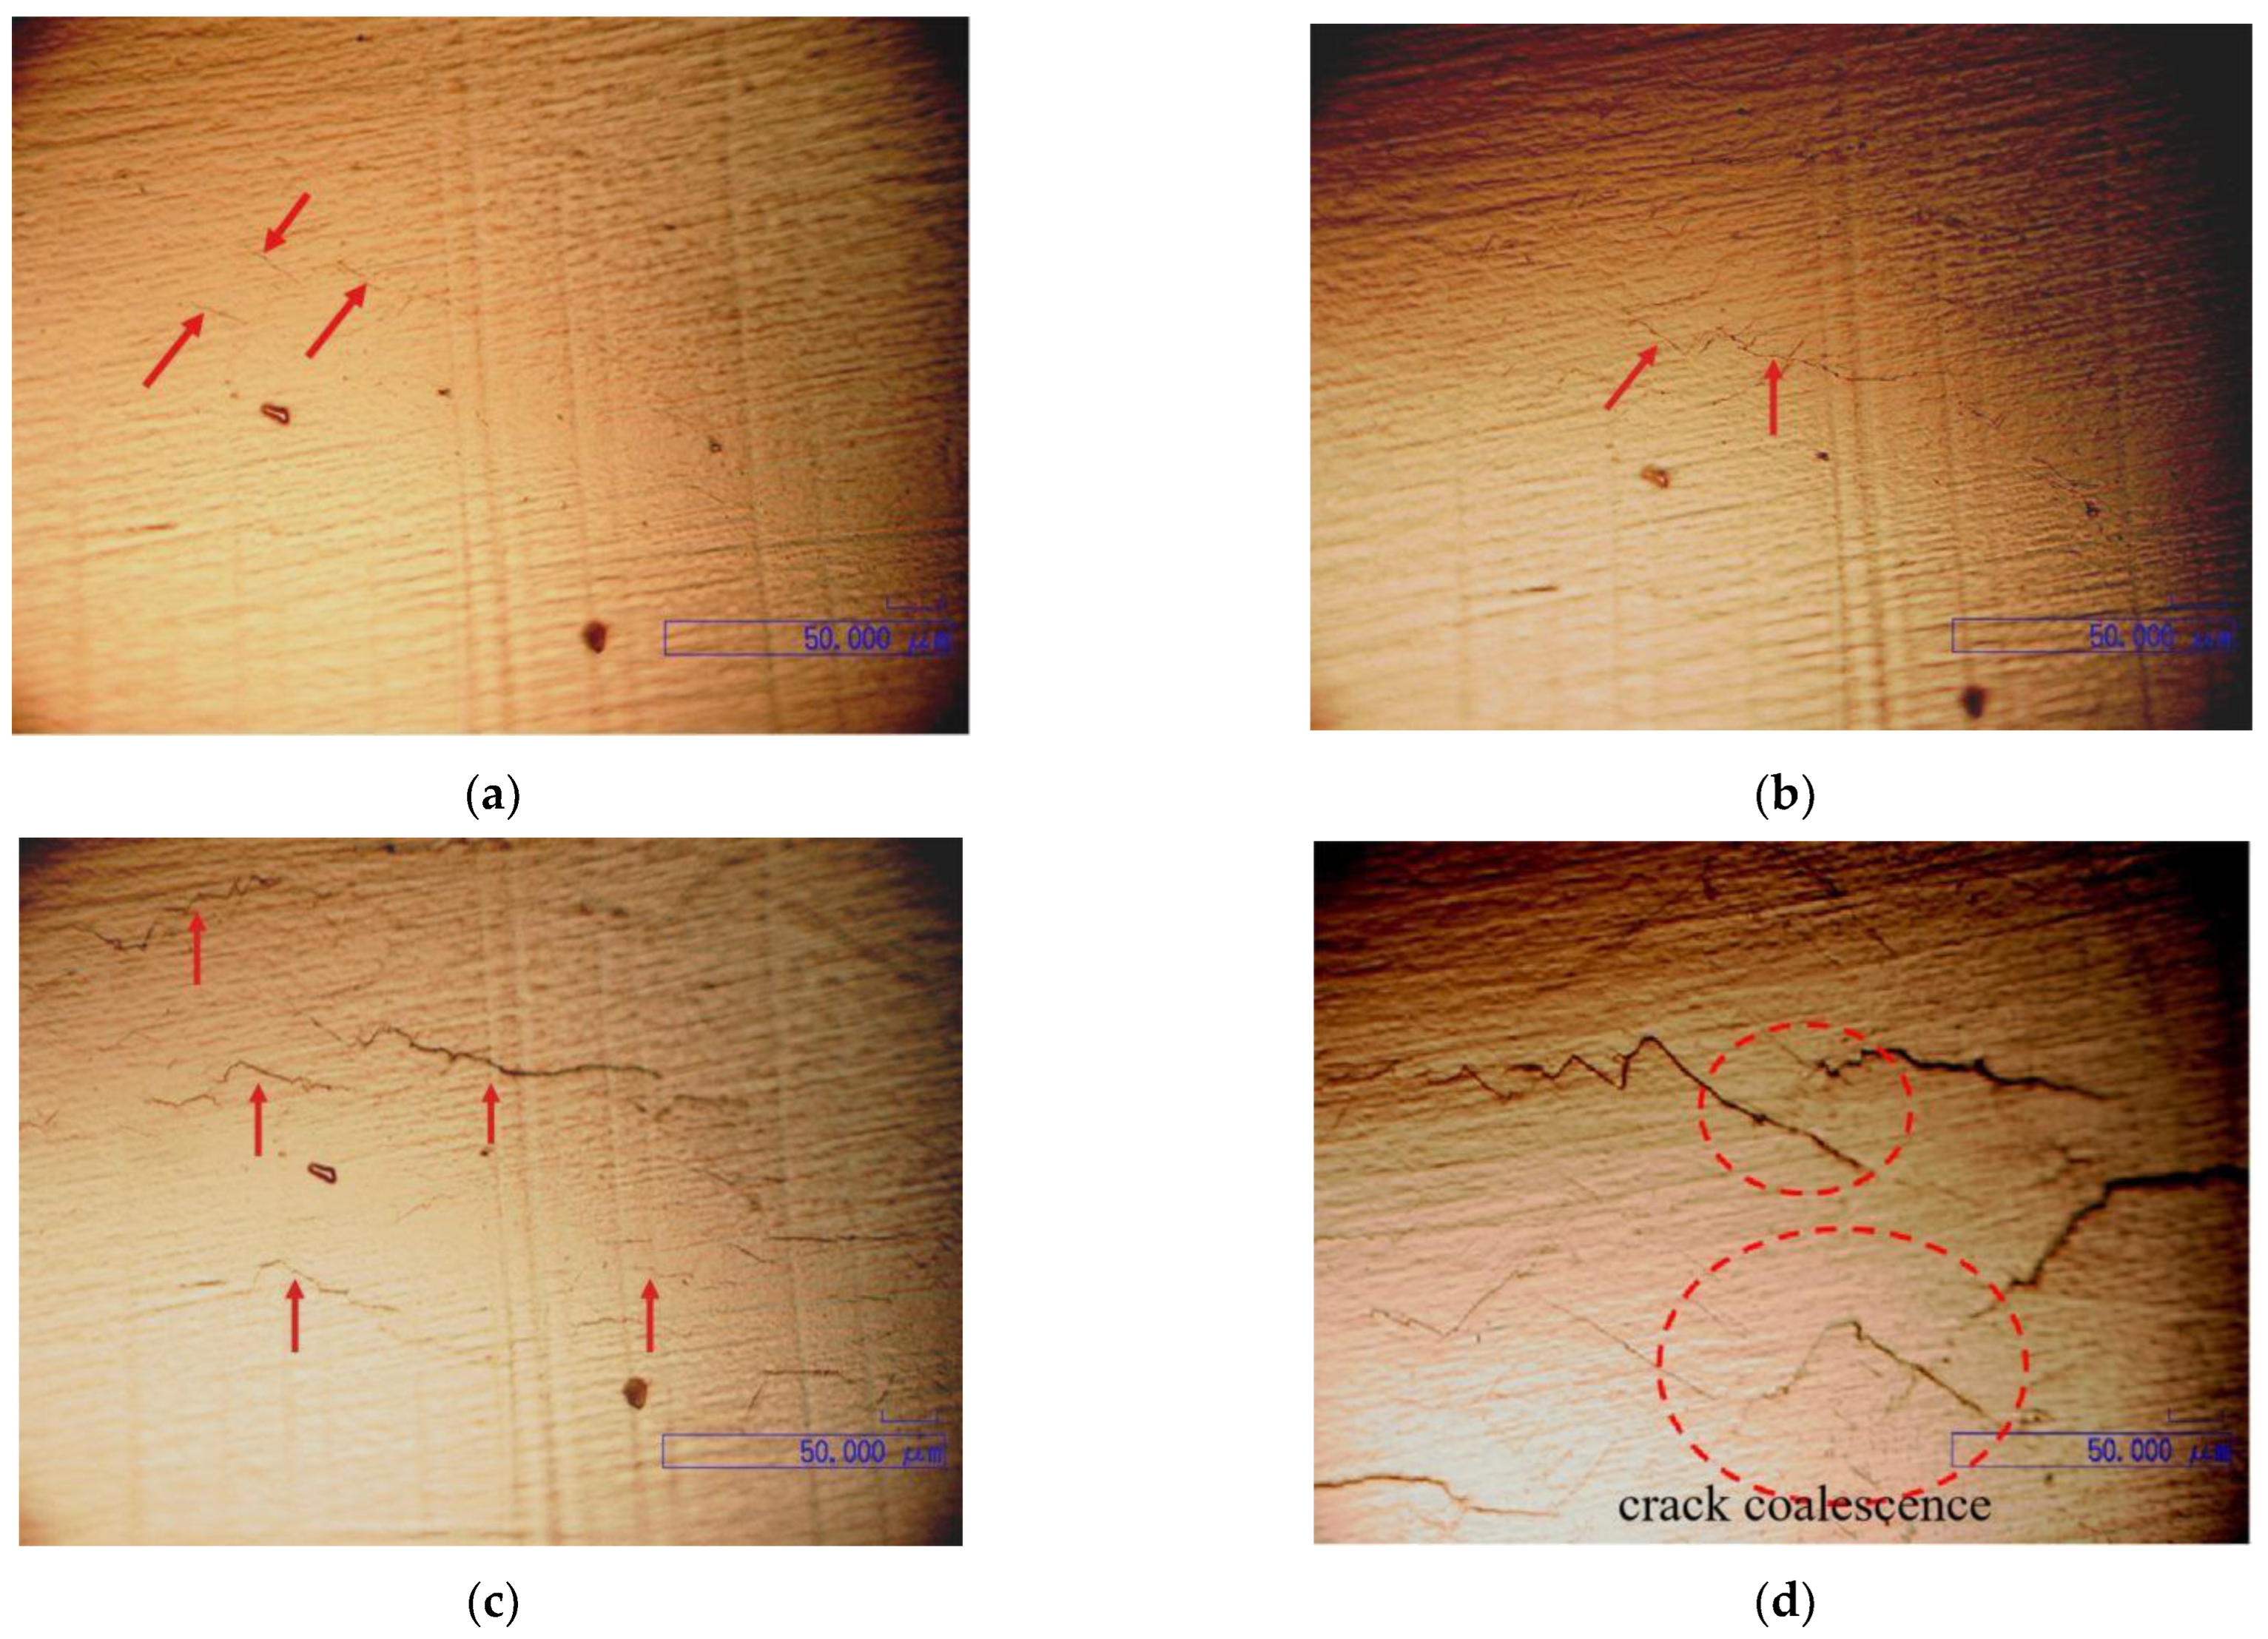
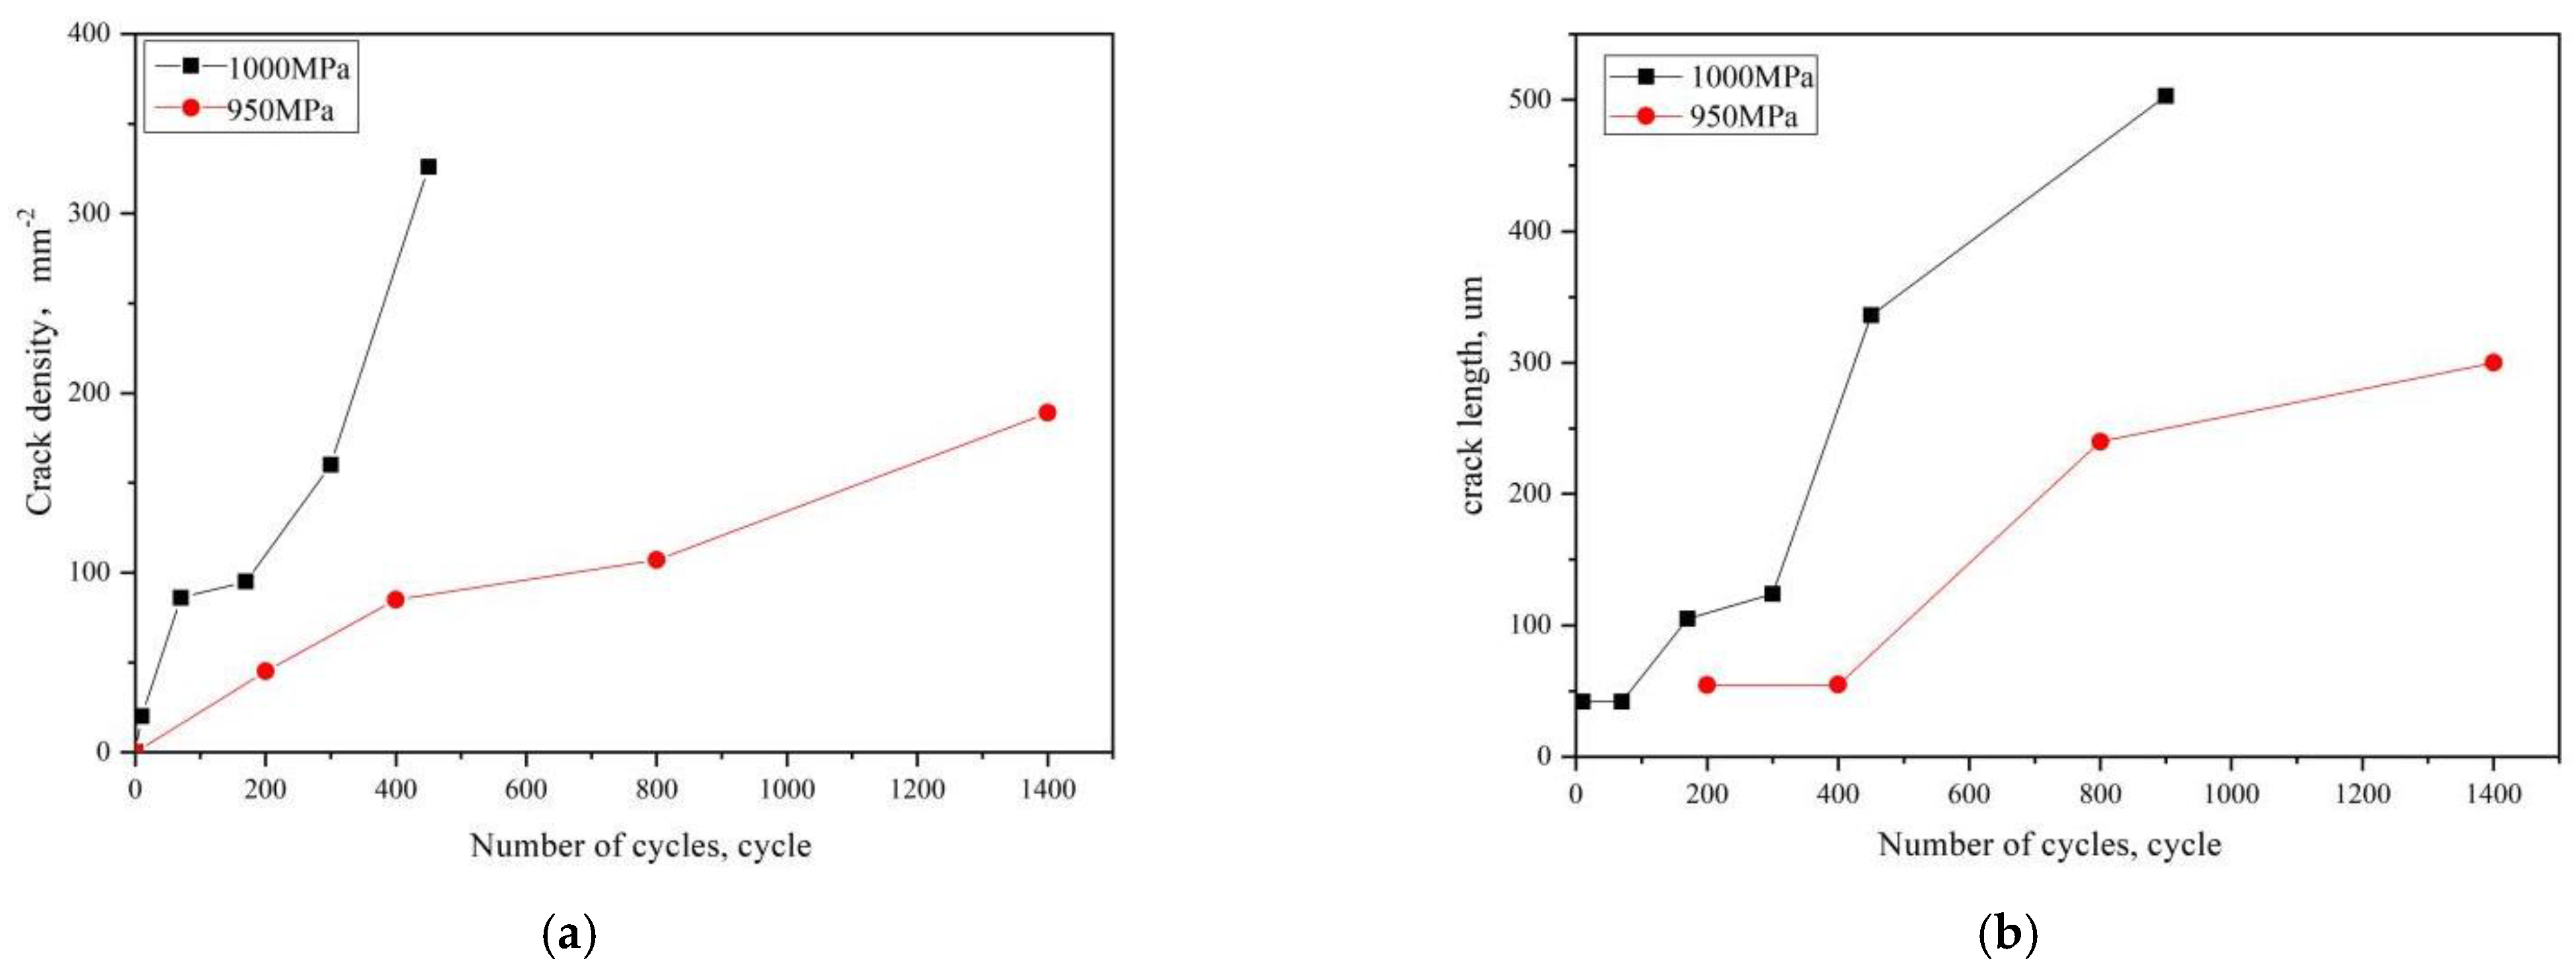
3.1. Evolution of Low Cycle Fatigue Crack on Cylindrical Specimens

Figure 6 shows the fatigue crack initiation and propagation of fatigue specimen under 1000 MPa stress. Cracks initiated at the 10th cycle (1% of total fatigue life), and more microcracks occurred at the 100th cycle. The crack direction was about 45° to the loading direction, which indicated that the shear strain promoted the crack initiation. When cyclic load grew up to the 300th cycle, microcracks propagated by the microcracks coalescence. Multiple microcracks combined into long cracks at the 450th cycle; it was noted that the crack initiation life was almost negligible at stress amplitude slightly higher than the yield stress. Compared with high cycle fatigue [14], the LCF of titanium alloys showed the characteristics of multiple crack initiation and propagation.
When cyclic stress amplitude decreased to 950 MPa slightly low than yield stress, crack initiation life increased to 200 cycles (6% of total fatigue life) (Figure 7a). Similarly, multiple microcracks combined into short cracks at the 800th cycle (Figure 7b). The number of short cracks increased with the increase of cycle number, and some short cracks merged into long cracks, then propagated into the final fracture (Figure 7d).
Statistics of early fatigue cracks under different stress are shown in Figure 8. Under the same cycle number, fatigue crack density and maximum crack size under high stress were much higher than those under low stress. The fatigue damage rate of the alloy at high stress was much higher than that at low stress. Thus, high stress accelerated the fatigue damage process.
Figure 9 illustrates the morphology of secondary cracks on the side of fatigue specimen. Under the stress amplitude of 1000 MPa, slip bands were obviously observed on the specimen, which was tilted about 45° to the direction of loading stress, and fatigue microcracks were initiated from these slip bands (Figure 9a). When the slip band passed through the αL/β interface, fatigue crack passed through the αL/β interface along the slip band (crack1, and 2 in Figure 9a); however, when the αL/β interface hindered the passage of the slip band, dislocation stacking and stress concentration occurred at the αL/β interface [19], resulting in the αL/β interface microcracks(crack 3 in Figure 9a). When the stress amplitude was decreased up to 950 MPa slightly less than the yield strength, fatigue microcracks originated at the αL/β interface, and were about 45° to the direction of loading stress (Figure 9b); it was indicated that fatigue microcracks were inclined to initiate when the αL/β interface was close to the direction of the maximum shear stress.
Furthermore, crack coalescence was observed during LCF crack propagation (Figure 10), which was a typical low cycle fatigue damage feature for high strength and high purity metals. Zhu [20] reported similar LCF crack coalescence characteristics in high-strength steel. While crack branching was another characteristic of LCF crack propagation under 950 MPa stress amplitude(Figure 10b), which was related with the microstructure. There were two main influence factors for the branching and deflection of fatigue cracks [14,21]: strain incongruity (geometric incongruity and plastic strain activation of adjacent grains. Crack branching and secondary cracks reduced the driving force of main crack growth, thereby decreasing the main crack growth rate [22].

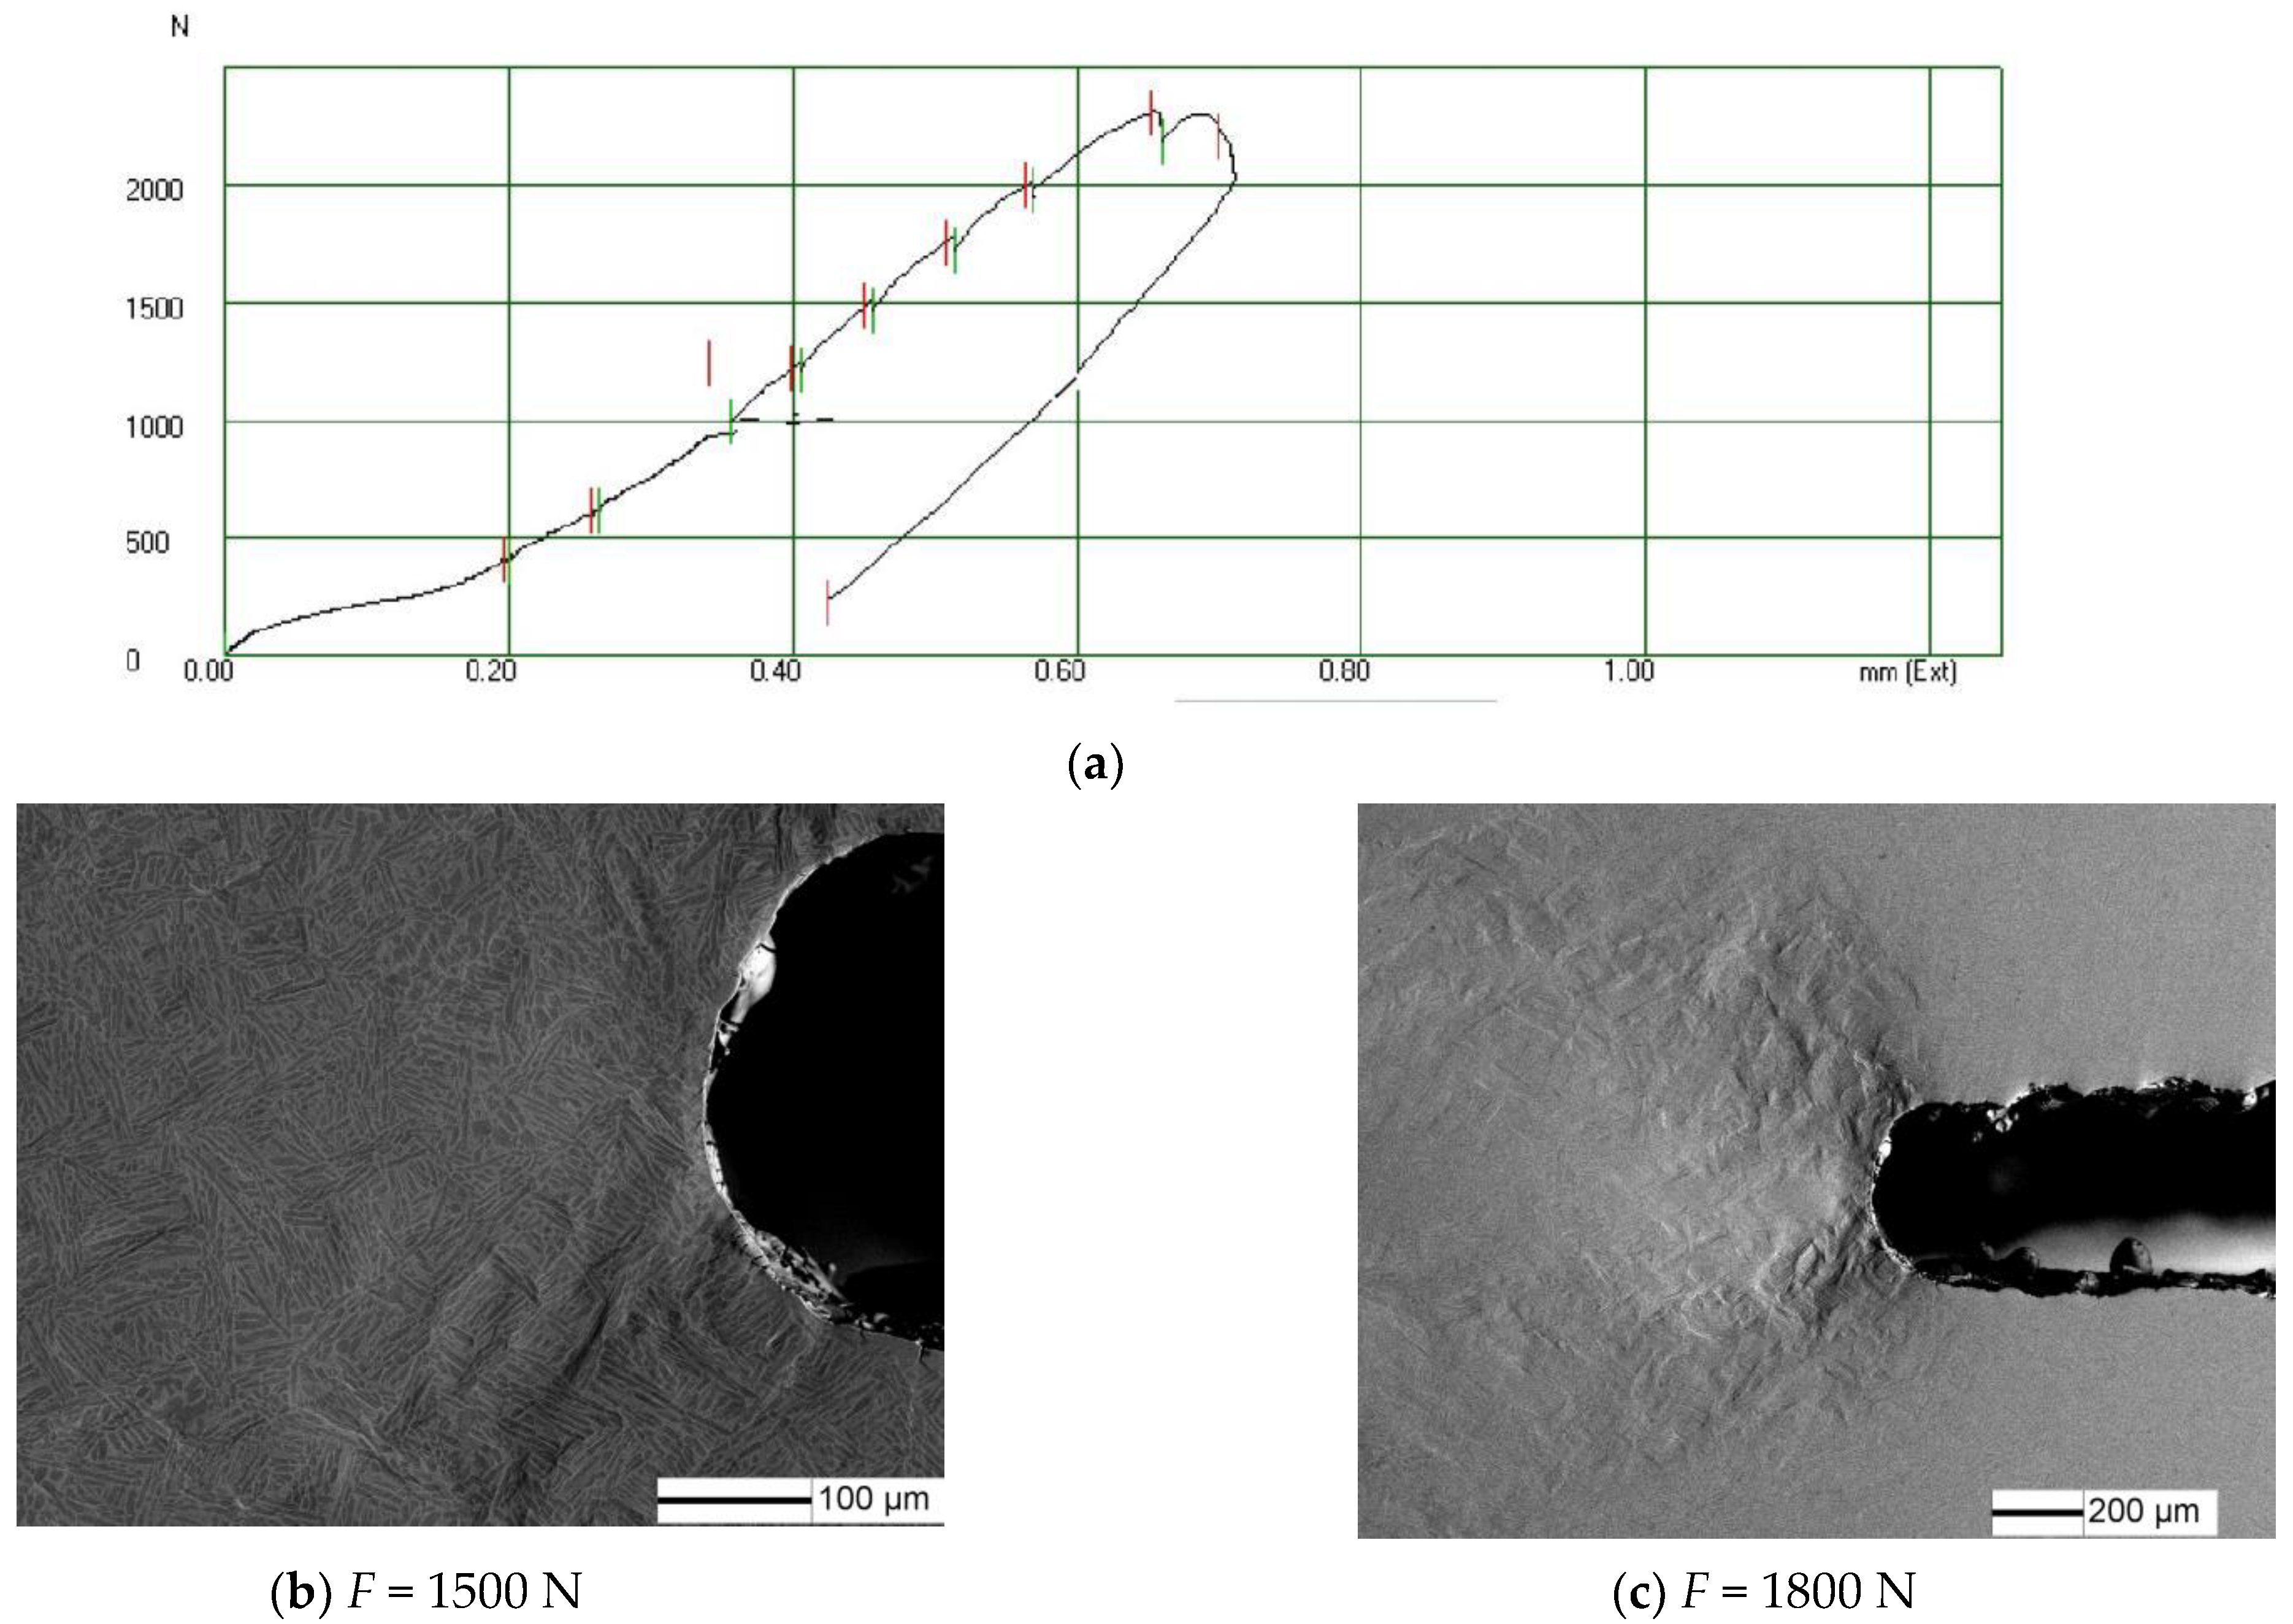
3.2. In-Situ SEM Fatigue Observation and Fatigue Small Crack Propagation Mechanism

In-situ SEM fatigue was carried out to investigate the relationship of LCF crack propagation and microstructure. Under a maximum load of 1800 N, some microcracks initiated from slip bands at the notch root of the sample when the sample was loaded up to the 25th cycle (Figure 11a), and the small crack propagated from slip bands. Many microcracks were formed by large plastic deformation near the notch root (Figure 11b); inhomogeneous strain distribution in the high strain region accelerated LCF crack initiation and propagation [23]. The main crack propagated through by the coalescence of microcracks at the crack tip (Figure 11c); however, these microcracks did not propagate continuously at the 250th cycle, and other shear cracks were observed which were deviated about 45° from the loading direction (Figure 11c). When the number of cycle reached up to 350 cycles, the dominant crack propagated by the coalescence of these shear microcracks (Figure 12d).
Under a maximum load of 1500 N, when the sample was loaded up to the 40th cycle, αL/β interface microcrack (crack 1) and transgranular microcracks (crack 2, 3) were formed at the notch root of the sample due to the stress concentration (Figure 12a). In the subsequent cyclic loading, the small crack propagated by the coalescence of microcracks; however, the small crack propagation was hindered by the different orientations microstrcuture, and another microcrack 4 was simultaneously formed around the microstructure barrier (Figure 12b). At the 480th cycle, the small crack overcame the microstructure barrier and connected with the new microcrack, displaying crack bifurcation characteristic (Figure 12c); it should be noted that the microcracks 4.5 tended to propagate along the αL/β interface as shown by the red arrow in Figure 12c, which was agreed with the investigation of short crack propagation behavior for additive manufacture Ti6Al4V [24]. Some microcracks are initiated at the front of small cracks in the subsequent cycle loading, and these microcracks are mainly initiated from the αL/β interface (Figure 12d). Thus, the αL/β interface played a key role in LCF crack initiation and propagation under a relatively low load.
Based on the above observation, the initiation and propagation mechanisms of LCF microcracks of TC21 alloy with basketweave microstructure at high and low stress, as schematically illustrated in Figure 13; it indicated that LCF crack damage displayed different sensitivity to the cyclic stress. LCF microcracks initiated from slip bands and propagated through the microcrack coalescences at high stress, while LCF cracks tended to initiate at the αL/β interface and connect with these interface microcracks.

3.3. Low Cycle Fatigue Damage Evolution

3.3.1. Low Cycle Fatigue Damage Model

LCF damage mainly depended on plastic deformation. The greater the cumulative plastic deformation increment in a cycle, the greater the energy dissipation caused by damage. Lemaitre [25] assumed that the damage increment dD was proportional to plastic deformation increment dP and the damage strain energy release rate Y, and low cycle fatigue damage was expressed as [18]:
d D = ( Y S ) α d P
where Y was the damage strain energy release rate, P was the plastic cumulative, the damage strength S represented the fatigue damage caused by the plastic strain increment, and the parameter α was the damage nonlinear cumulative coefficient.
According to Lemaitre’s strain equivalence principle [25], when the specimen was under uniaxial loading, the expression of damage strain energy release rate Y was:
Y = σ 2 2 E ( 1 D ) 2
where σ was the loading stress. Ramberg-Osgood cyclic constitutive relation under symmetric cycles can be expressed as:
P = ( σ k ( 1 D ) ) 1 n
where P was the change of cumulative plastic strain in a cycle, k and n were the cyclic hardening/softening coefficient and index.
The cyclic constitutive relation (Equation (3)) was differentiated as follows:
d P = 1 n k ( 1 D ) ( σ k ( 1 D ) ) 1 n 1 d σ
From Formulas (1), (2) and (4), fatigue damage increment dD can be calculated as:
d D = σ 1 n 1 + 2 α ( 2 E S ) α n k 1 / n ( 1 D ) 1 n 1 + 2 α d σ
The hysteresis loop usually had centrosymmetry, so fatigue damage increment during one cycle δD/δN was obtained as:
δ D δ N = 4 0 σ m a x d D
In order to obtain the analytical solution of low cycle fatigue damage, the following assumptions were made [25]:
(1)
The damage changes little during one cycle, and the damage variable D can be approximately regarded as a constant;
(2)
When the damage limit Dc was small, and the damage variable D was much small, so the change of cyclic stress between different cycles can be ignored.
Combined with Formulas (5) and (6), fatigue damage increment during one cycle δD/δN was given as:
δ D δ N = 4 σ 1 n + 2 α ( 1 n + 2 α 1 ) ( 2 E S ) α n k 1 / n ( 1 D ) 1 n + 2 α
And the relationship of fatigue damage D with the number of cycle N can be obtained by integration Equation (7):
D = 1 [ 1 4 σ 1 n + 2 α ( 2 E S ) α n k 1 / n N ] 1 1 n + 2 α
Fatigue fracture occurred when fatigue damage was equal to damage limit Dc, and its fatigue life was calculated from Equation (8):
N R = [ 1 ( 1 D c ) 1 n + 2 α ] ( 2 E S ) α n k 1 / n 4 σ 1 n + 2 α

3.3.2. Fatigue Damage Parameters

In the previous study [19], the cyclic strain hardening index n was 0.07326 and the cyclic strength coefficient K was 1067 MPa. LCF critical damage value Dc was [25]:
D c = D I C ( σ U σ ) 2
where σ U was the tensile strength of the material; DIC was tensile fracture critical damage value, and can be estimated as:
D I C = 1 σ R σ U
where σ R is the fracture strength of the tensile curve. From the tensile curve of TC21 titanium alloy [19], DIC was equal to 0.09. Thus, LCF critical damage value Dc of TC21 titanium alloy was given as:
D c = 0.09 ( 1070 σ ) 2
Combined with Formulas (1) and (2), the damage strength S was obtained as:
S = σ 2 2 E ( 1 D ) 2 ( d D / d P ) 1 / α
In order to solve the dD/dP value, the relationship between damage evolution and plastic accumulation during LCF with a strain amplitude of 0.7% (Figure 14) was adopted in this work, and fatigue damage can be estimated by the degree of cyclic stress reduction [25]:
- D = 1 Δ σ Δ σ 0
where Δ σ 0 , Δ σ were stress range at the end of cyclic softening and the N cycle, respectively. Thus, dD/dP value can be obtained from the linear D-P curve. Combined with Formulas (9) and (14), the numerical optimization calculation method was adopted to obtain S = 130.4, α = 3.0, as shown in Figure 15.

3.3.3. Fatigue Damage Model Verification and Discussion

In order to verify the model, the damage of stress fatigue is evaluated by formula:
D = 1 E * / E
where E was the elastic modulus for the undamaged sample, and E* was the elastic modulus for the damaged sample.
The elastic modulus after fatigue damage under 950 MPa stress were measured to characterize fatigue damage, as shown in Figure 16. Fatigue damage predicted by this model was consistent with experimental data.
Figure 17 illustrated that fatigue damage D gradually increased with the increase of cycle number. When fatigue damage value was close to the critical damage value Dc, the fatigue damage increased sharply, leading to fatigue fracture. The greater the stress amplitude, the greater the fatigue damage rate dD/dN, and the lower the fatigue life. Fatigue damage rate dD/dN was significantly increased when maximum stress was exceeded yield strength (1000 MPa), while decreased at relatively low stress amplitude (900 MPa and 850 MPa).

4. Conclusions

(1)
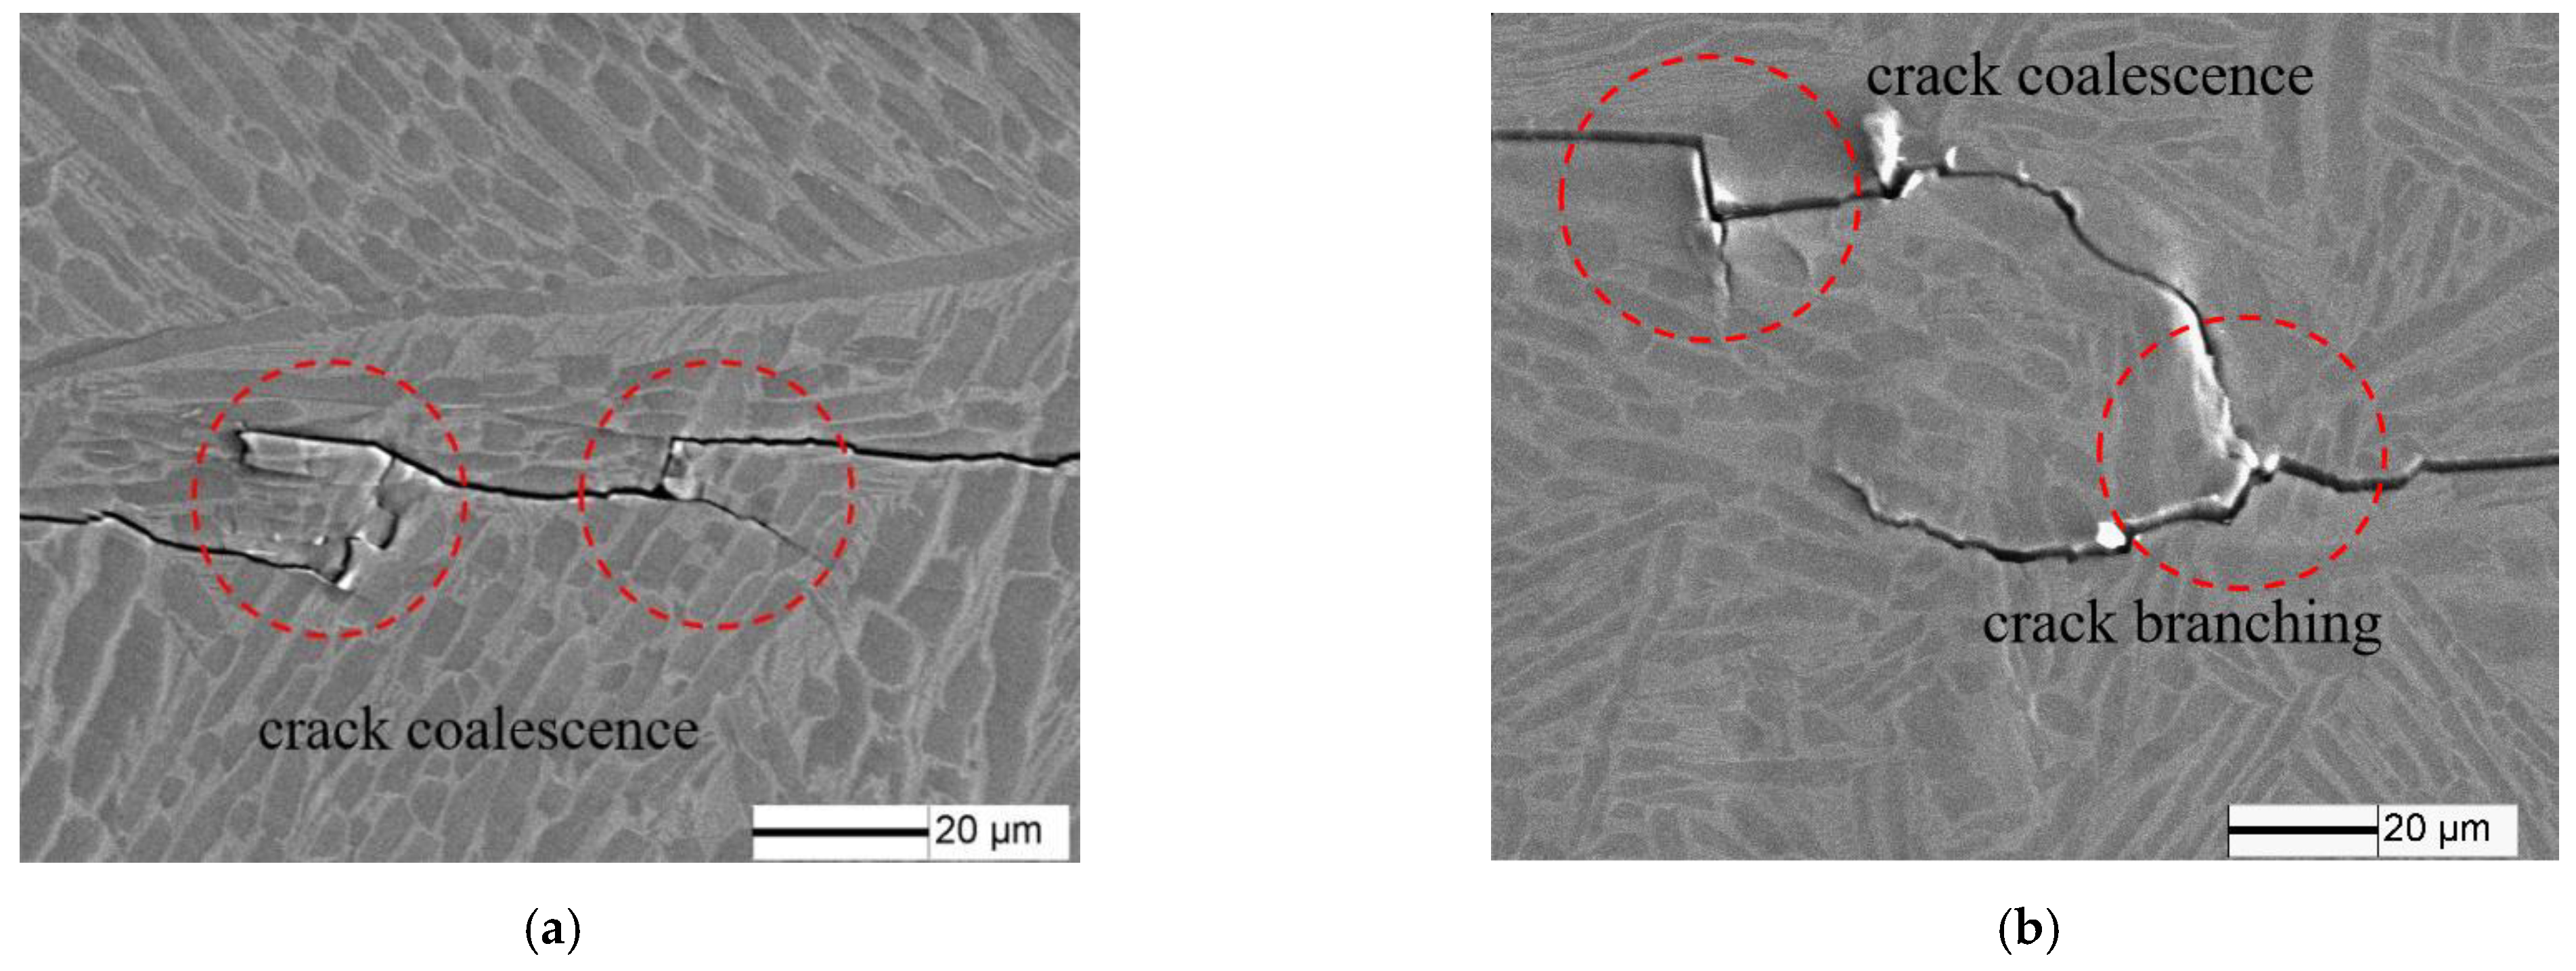
Low cycle fatigue of TC21 titanium alloy with basketweave microstructure presented multi-cracks initiation mode, and the cracks propagated through the crack coalescence.
(2)
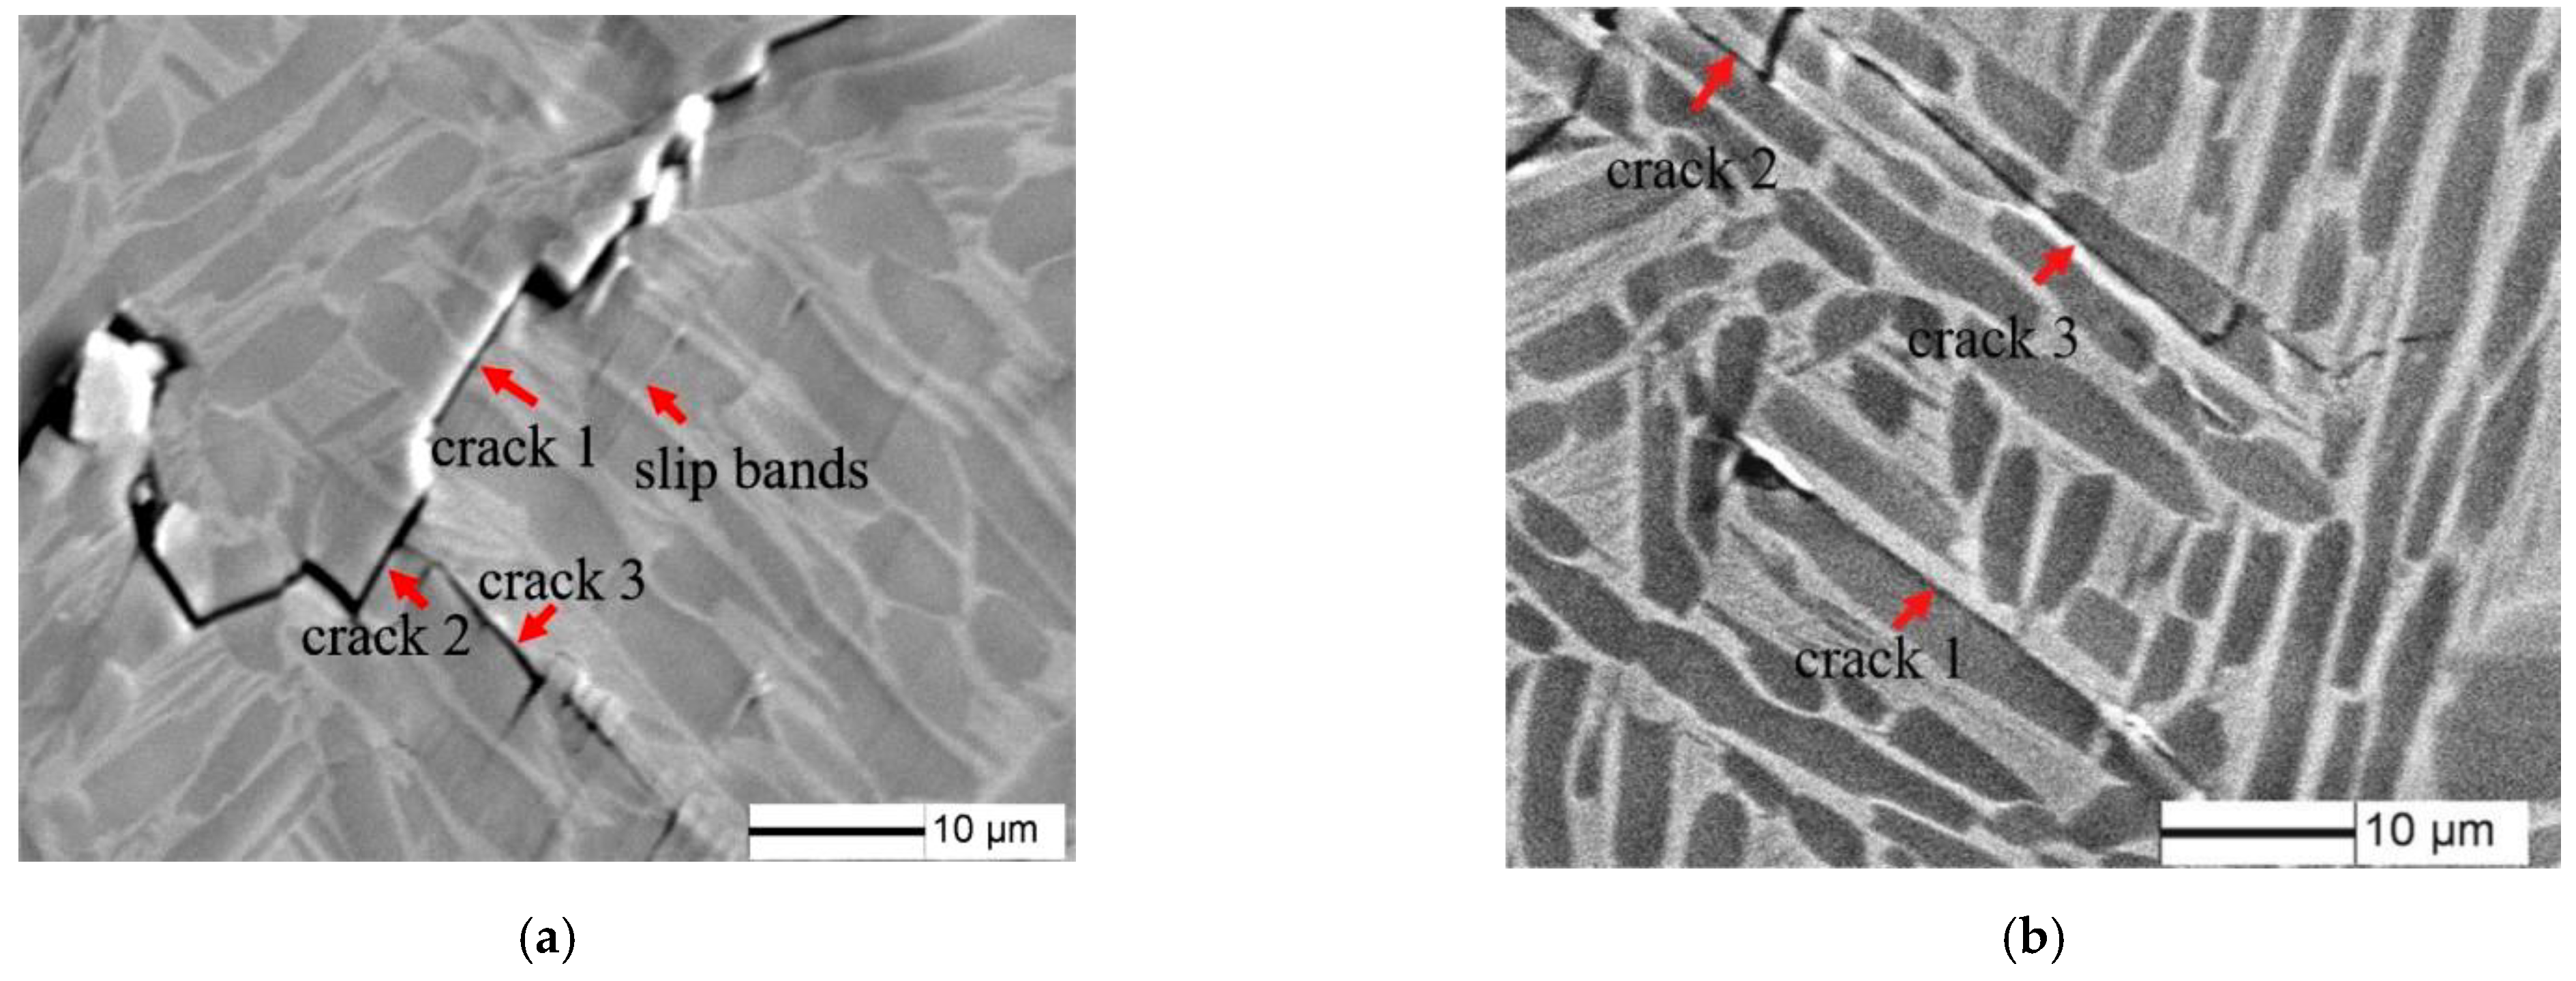
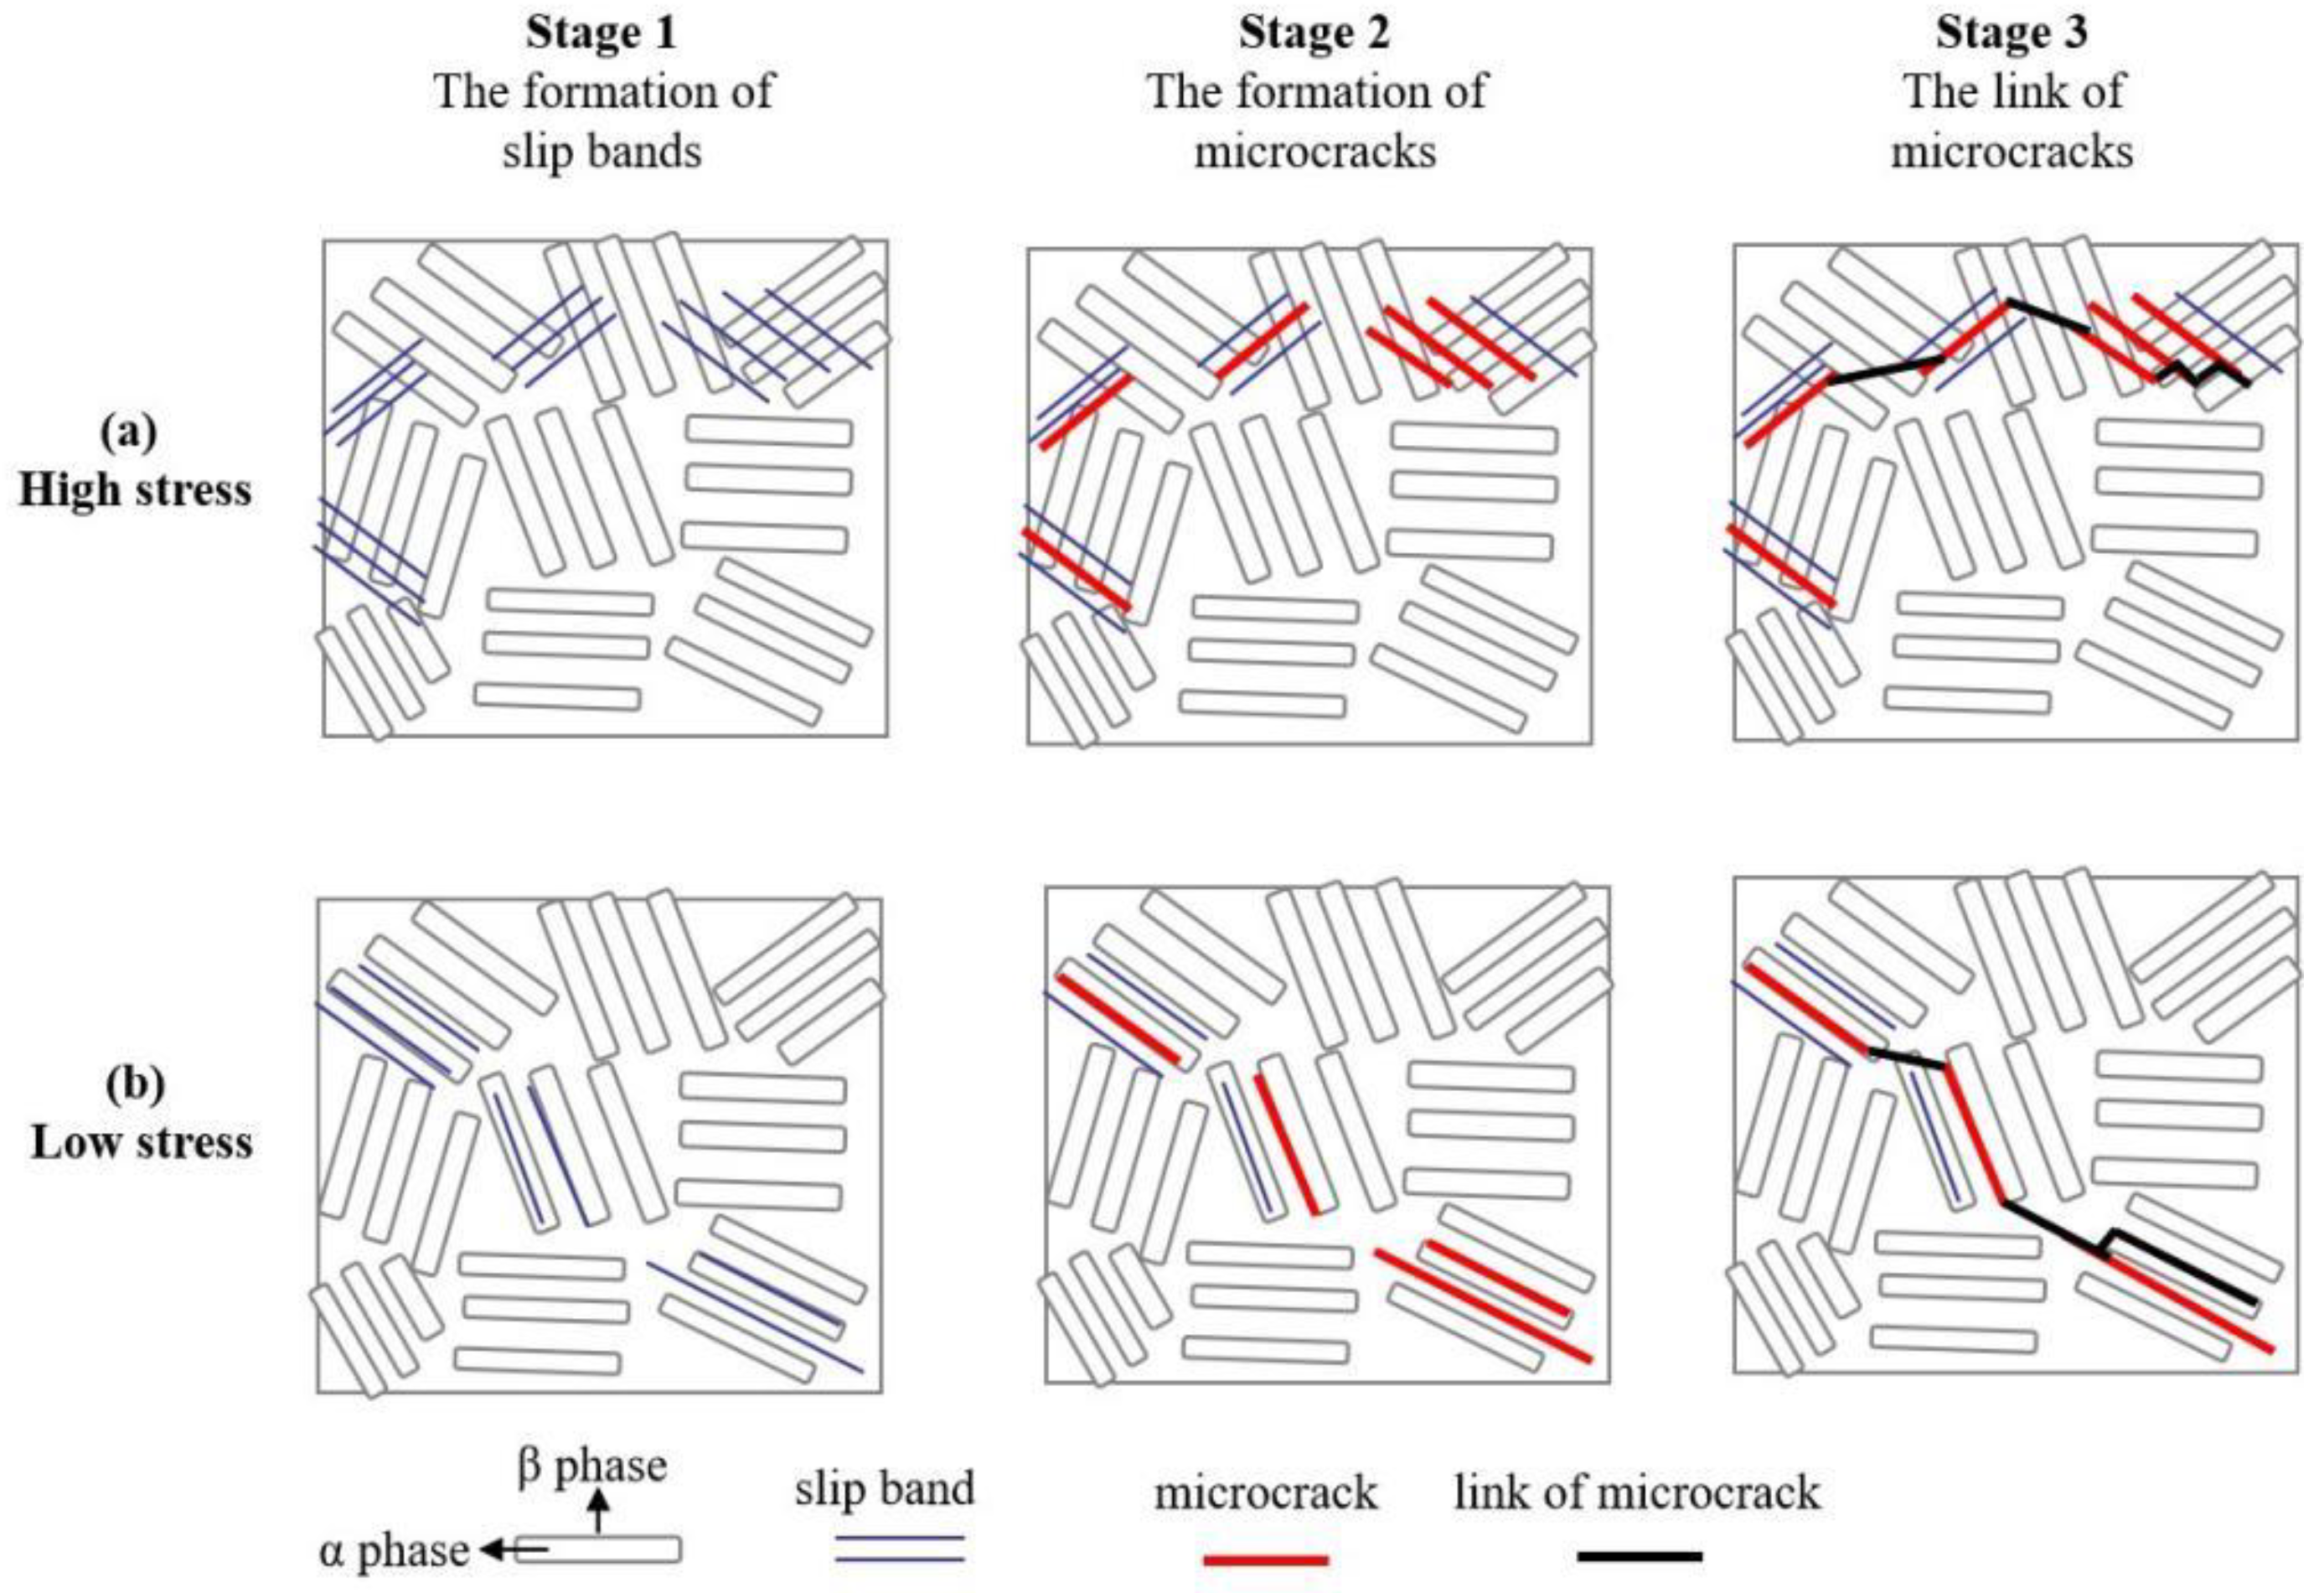
Under the stress amplitude slightly higher than the yield strength, fatigue microcracks propagated through slip bands due to the large plastic deformation; However, fatigue microcracks tended to propagate along the αL/β interface at relatively low stress amplitude.
(3)
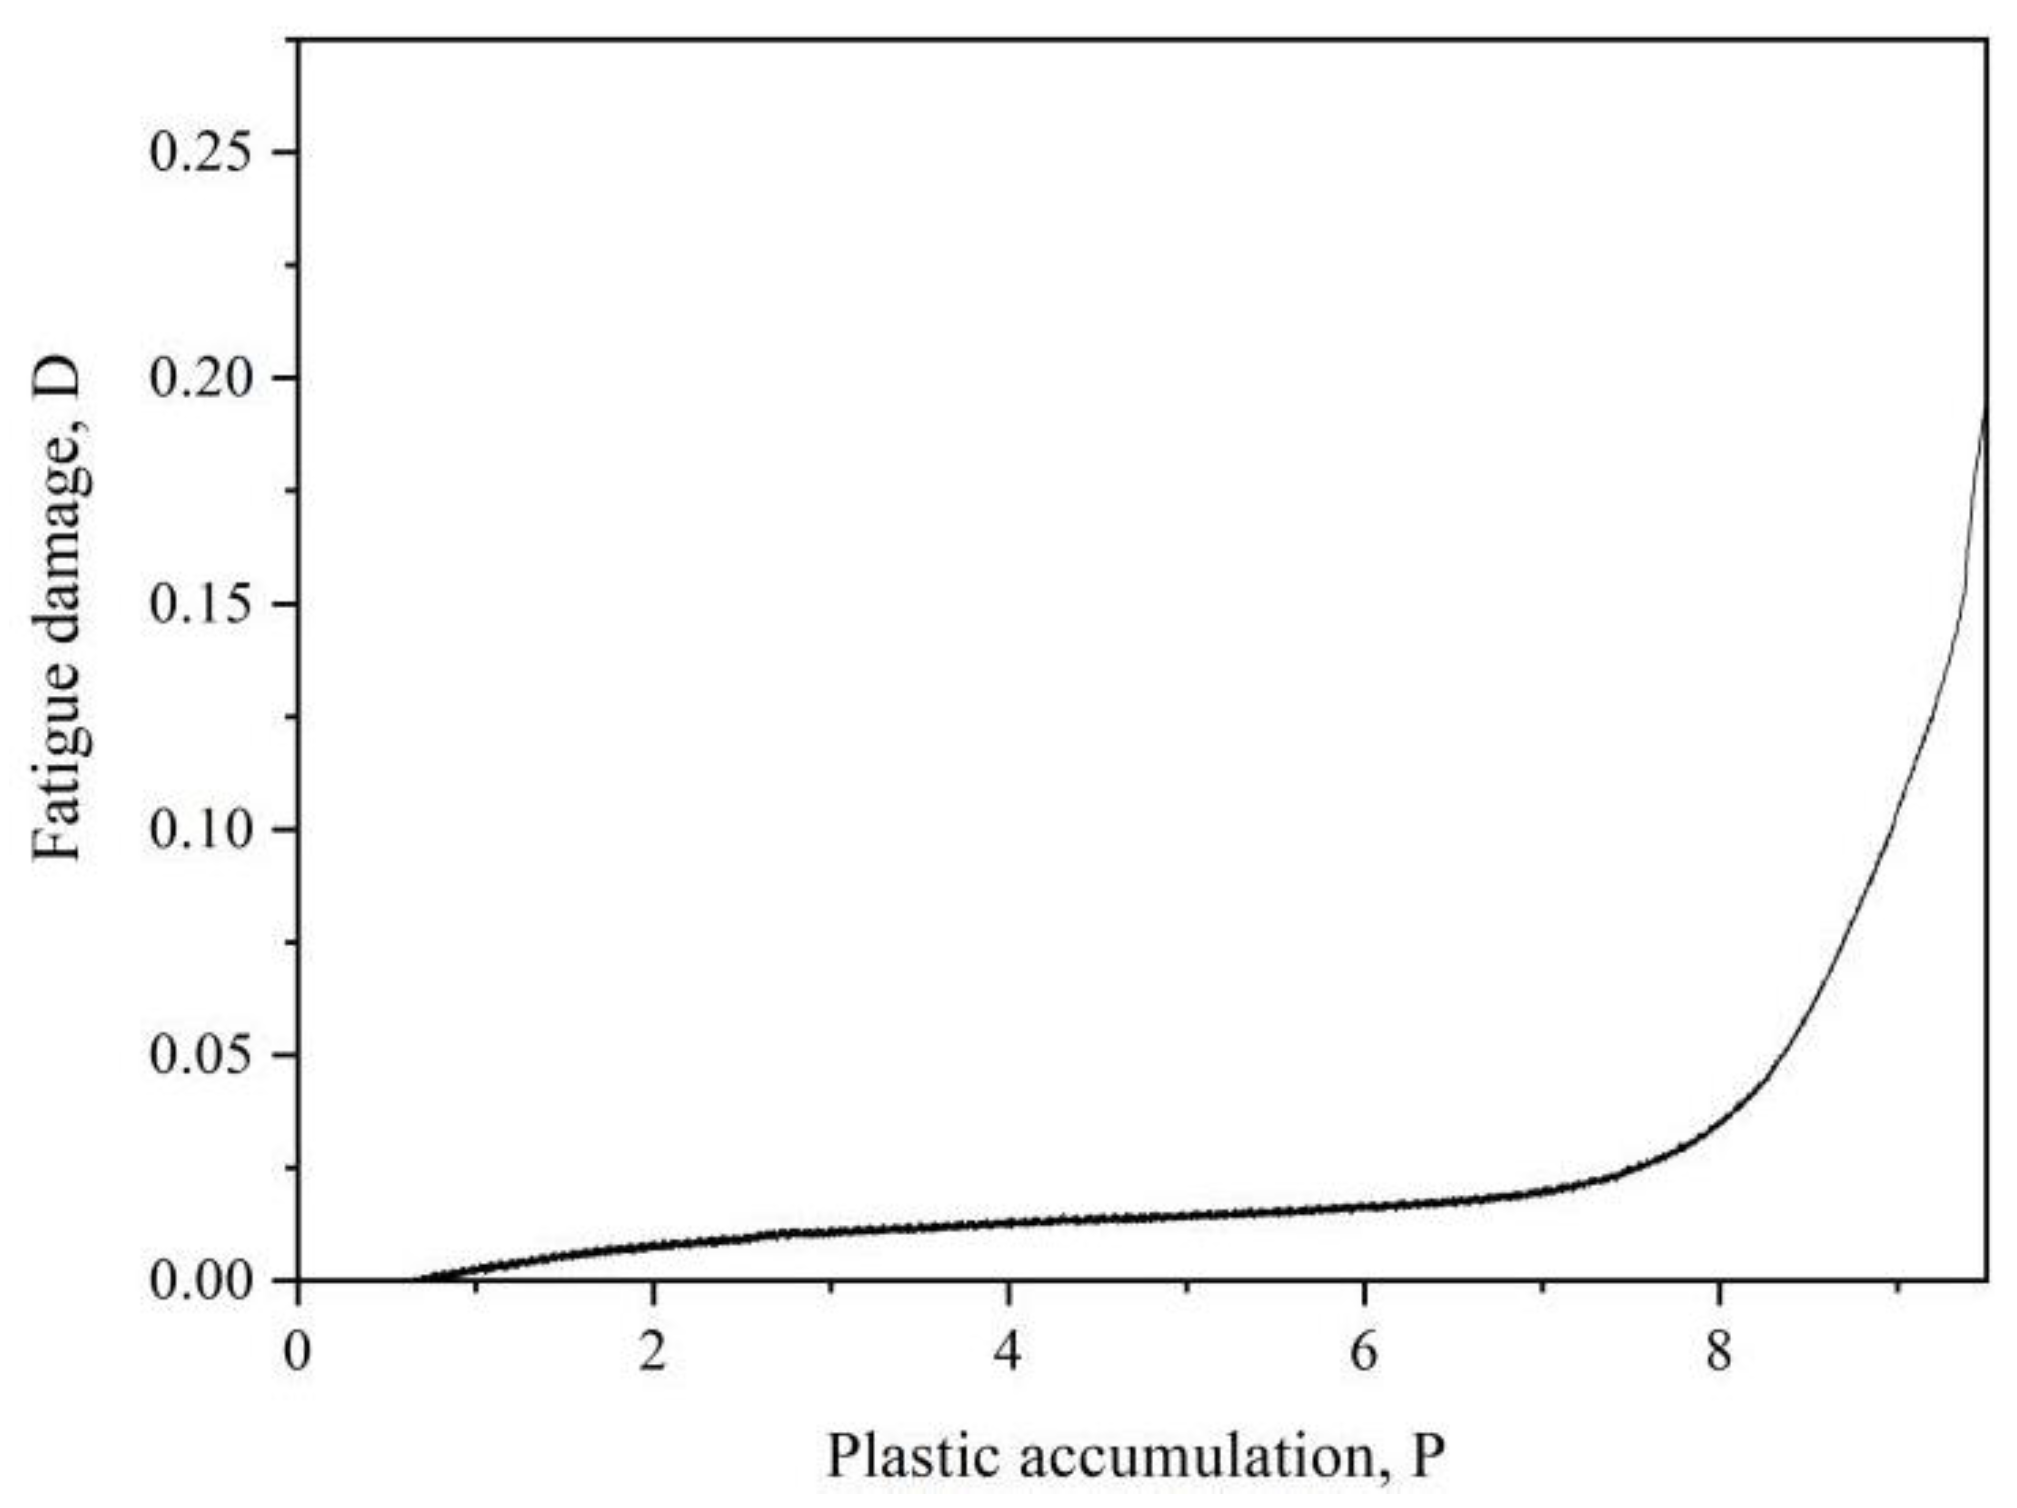
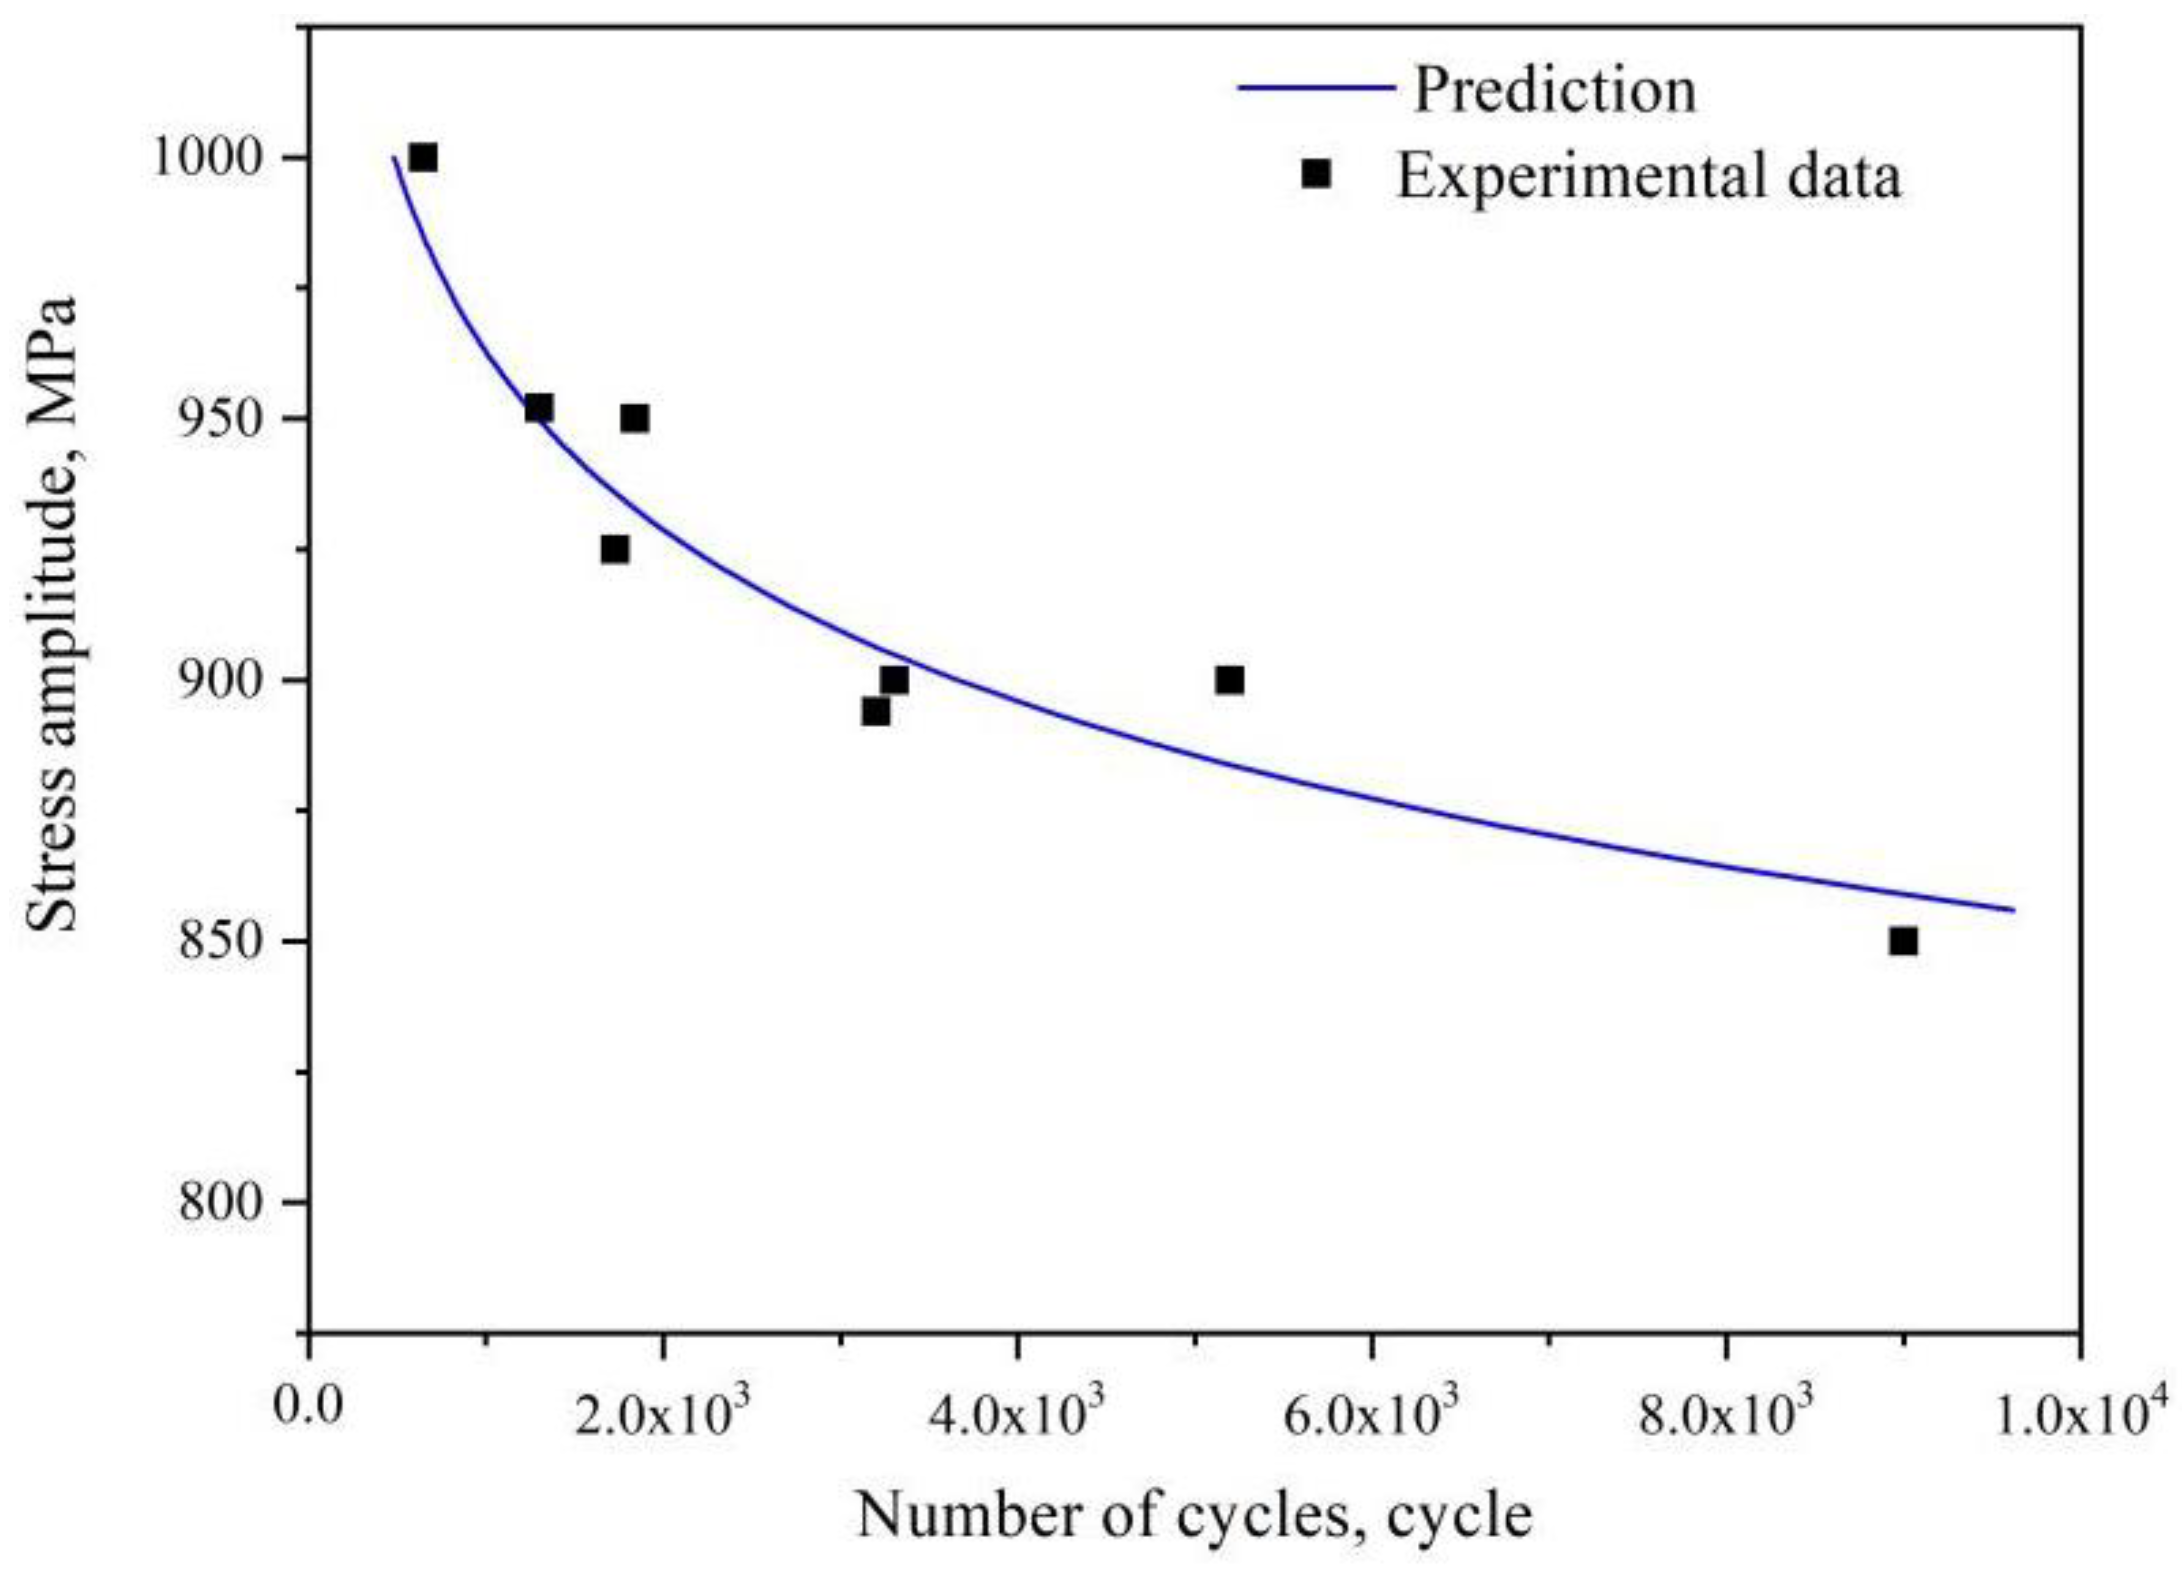
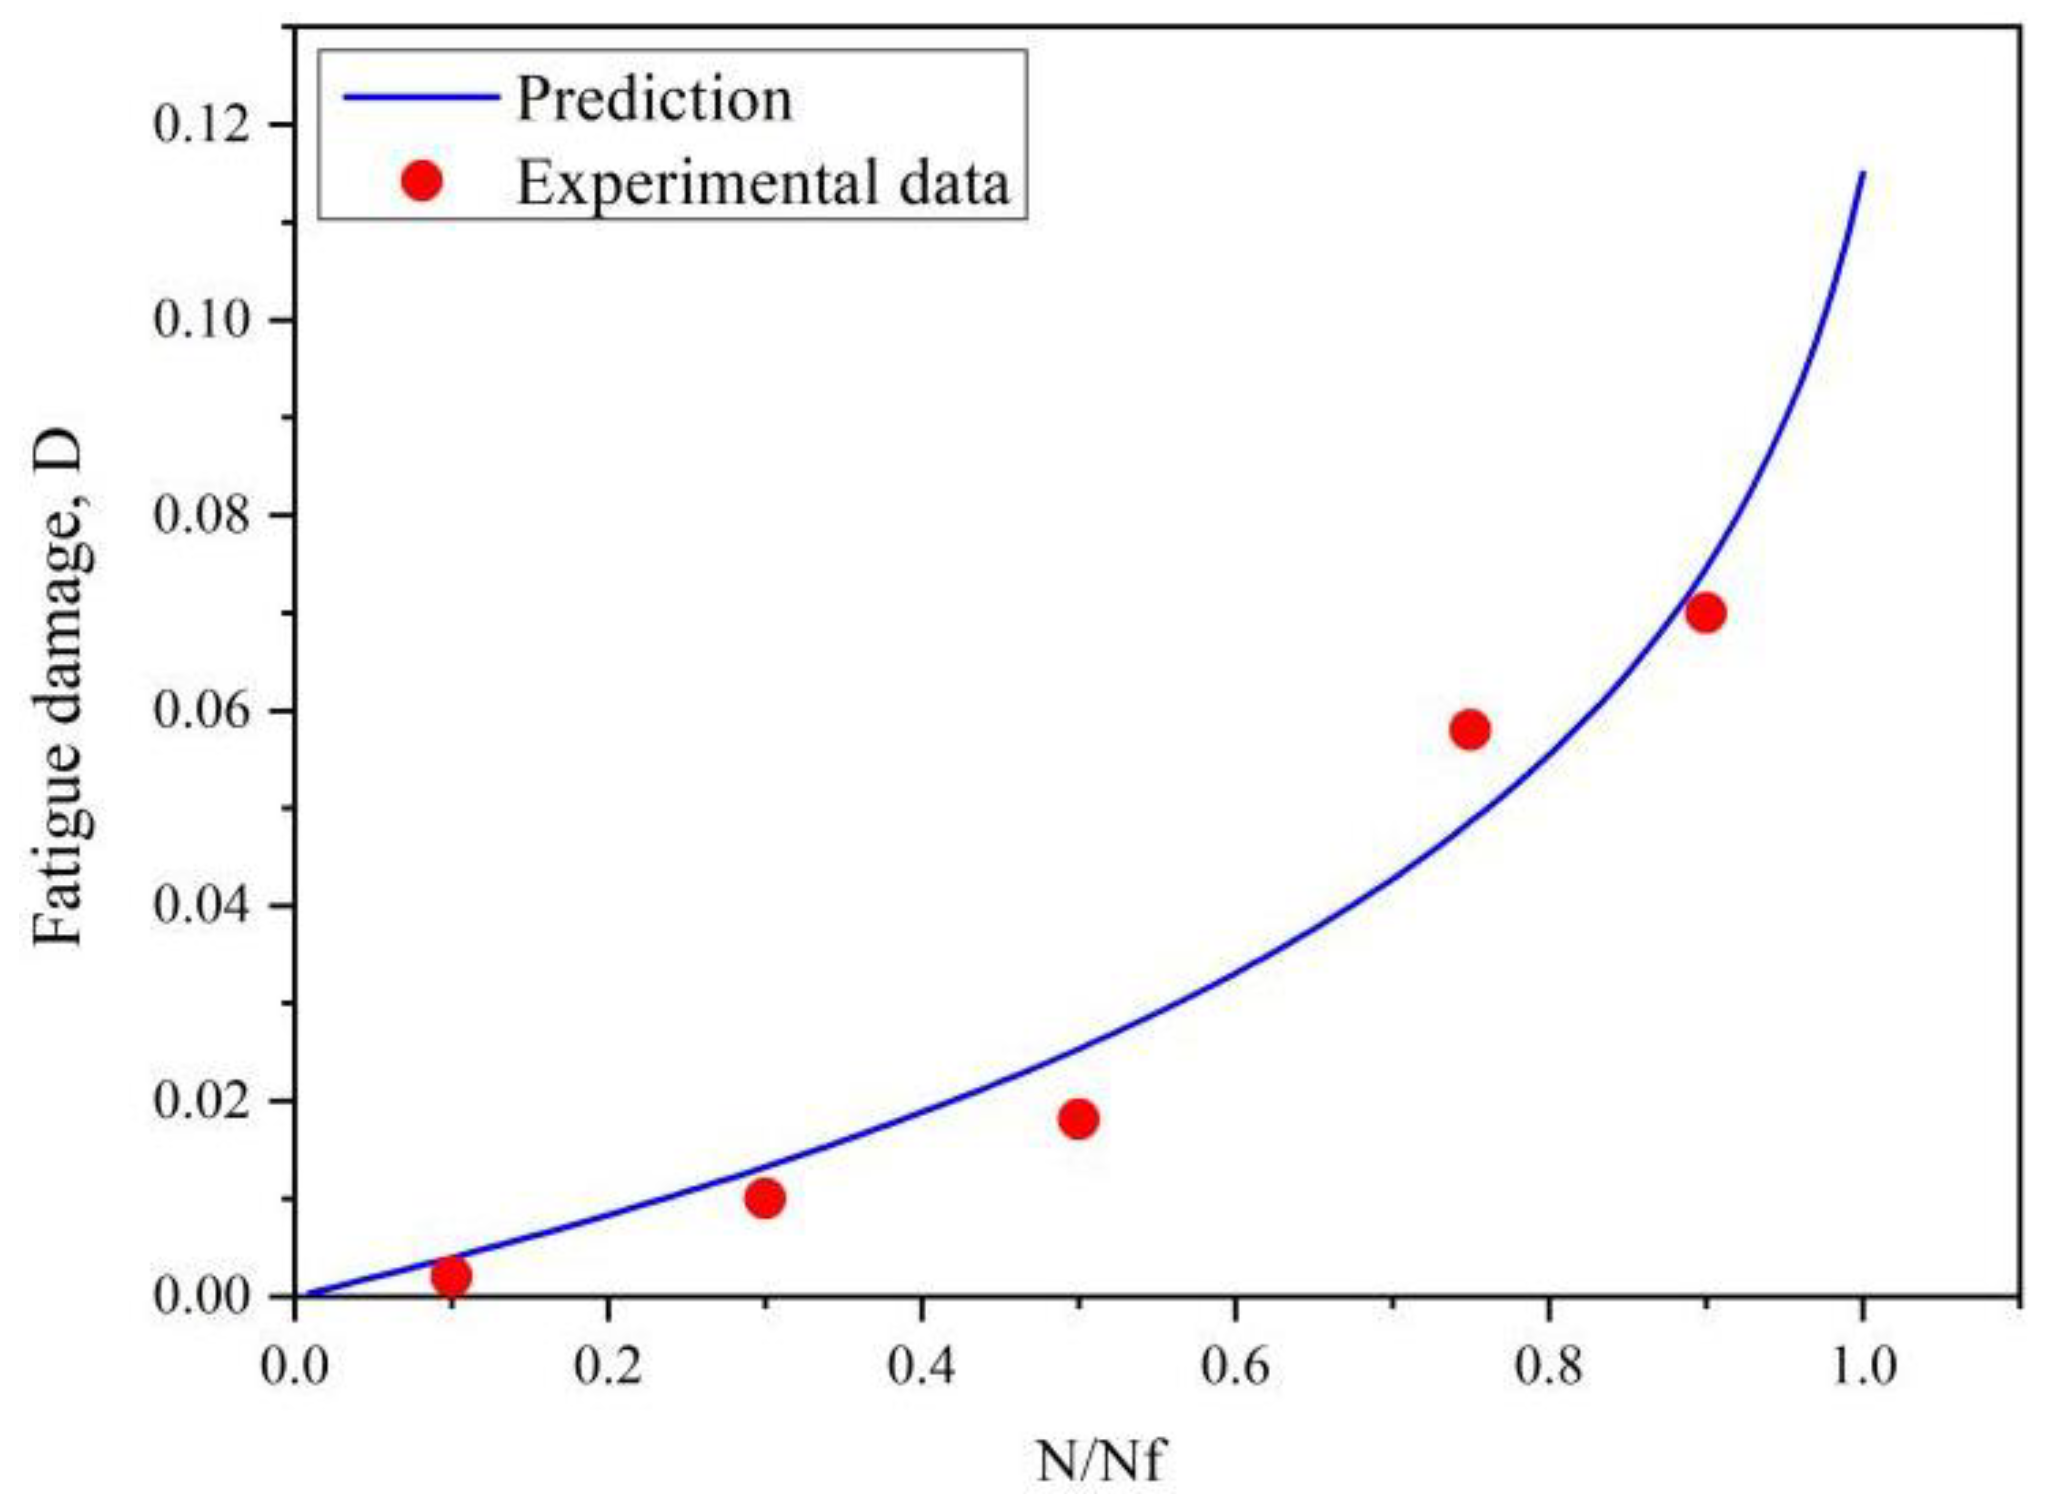
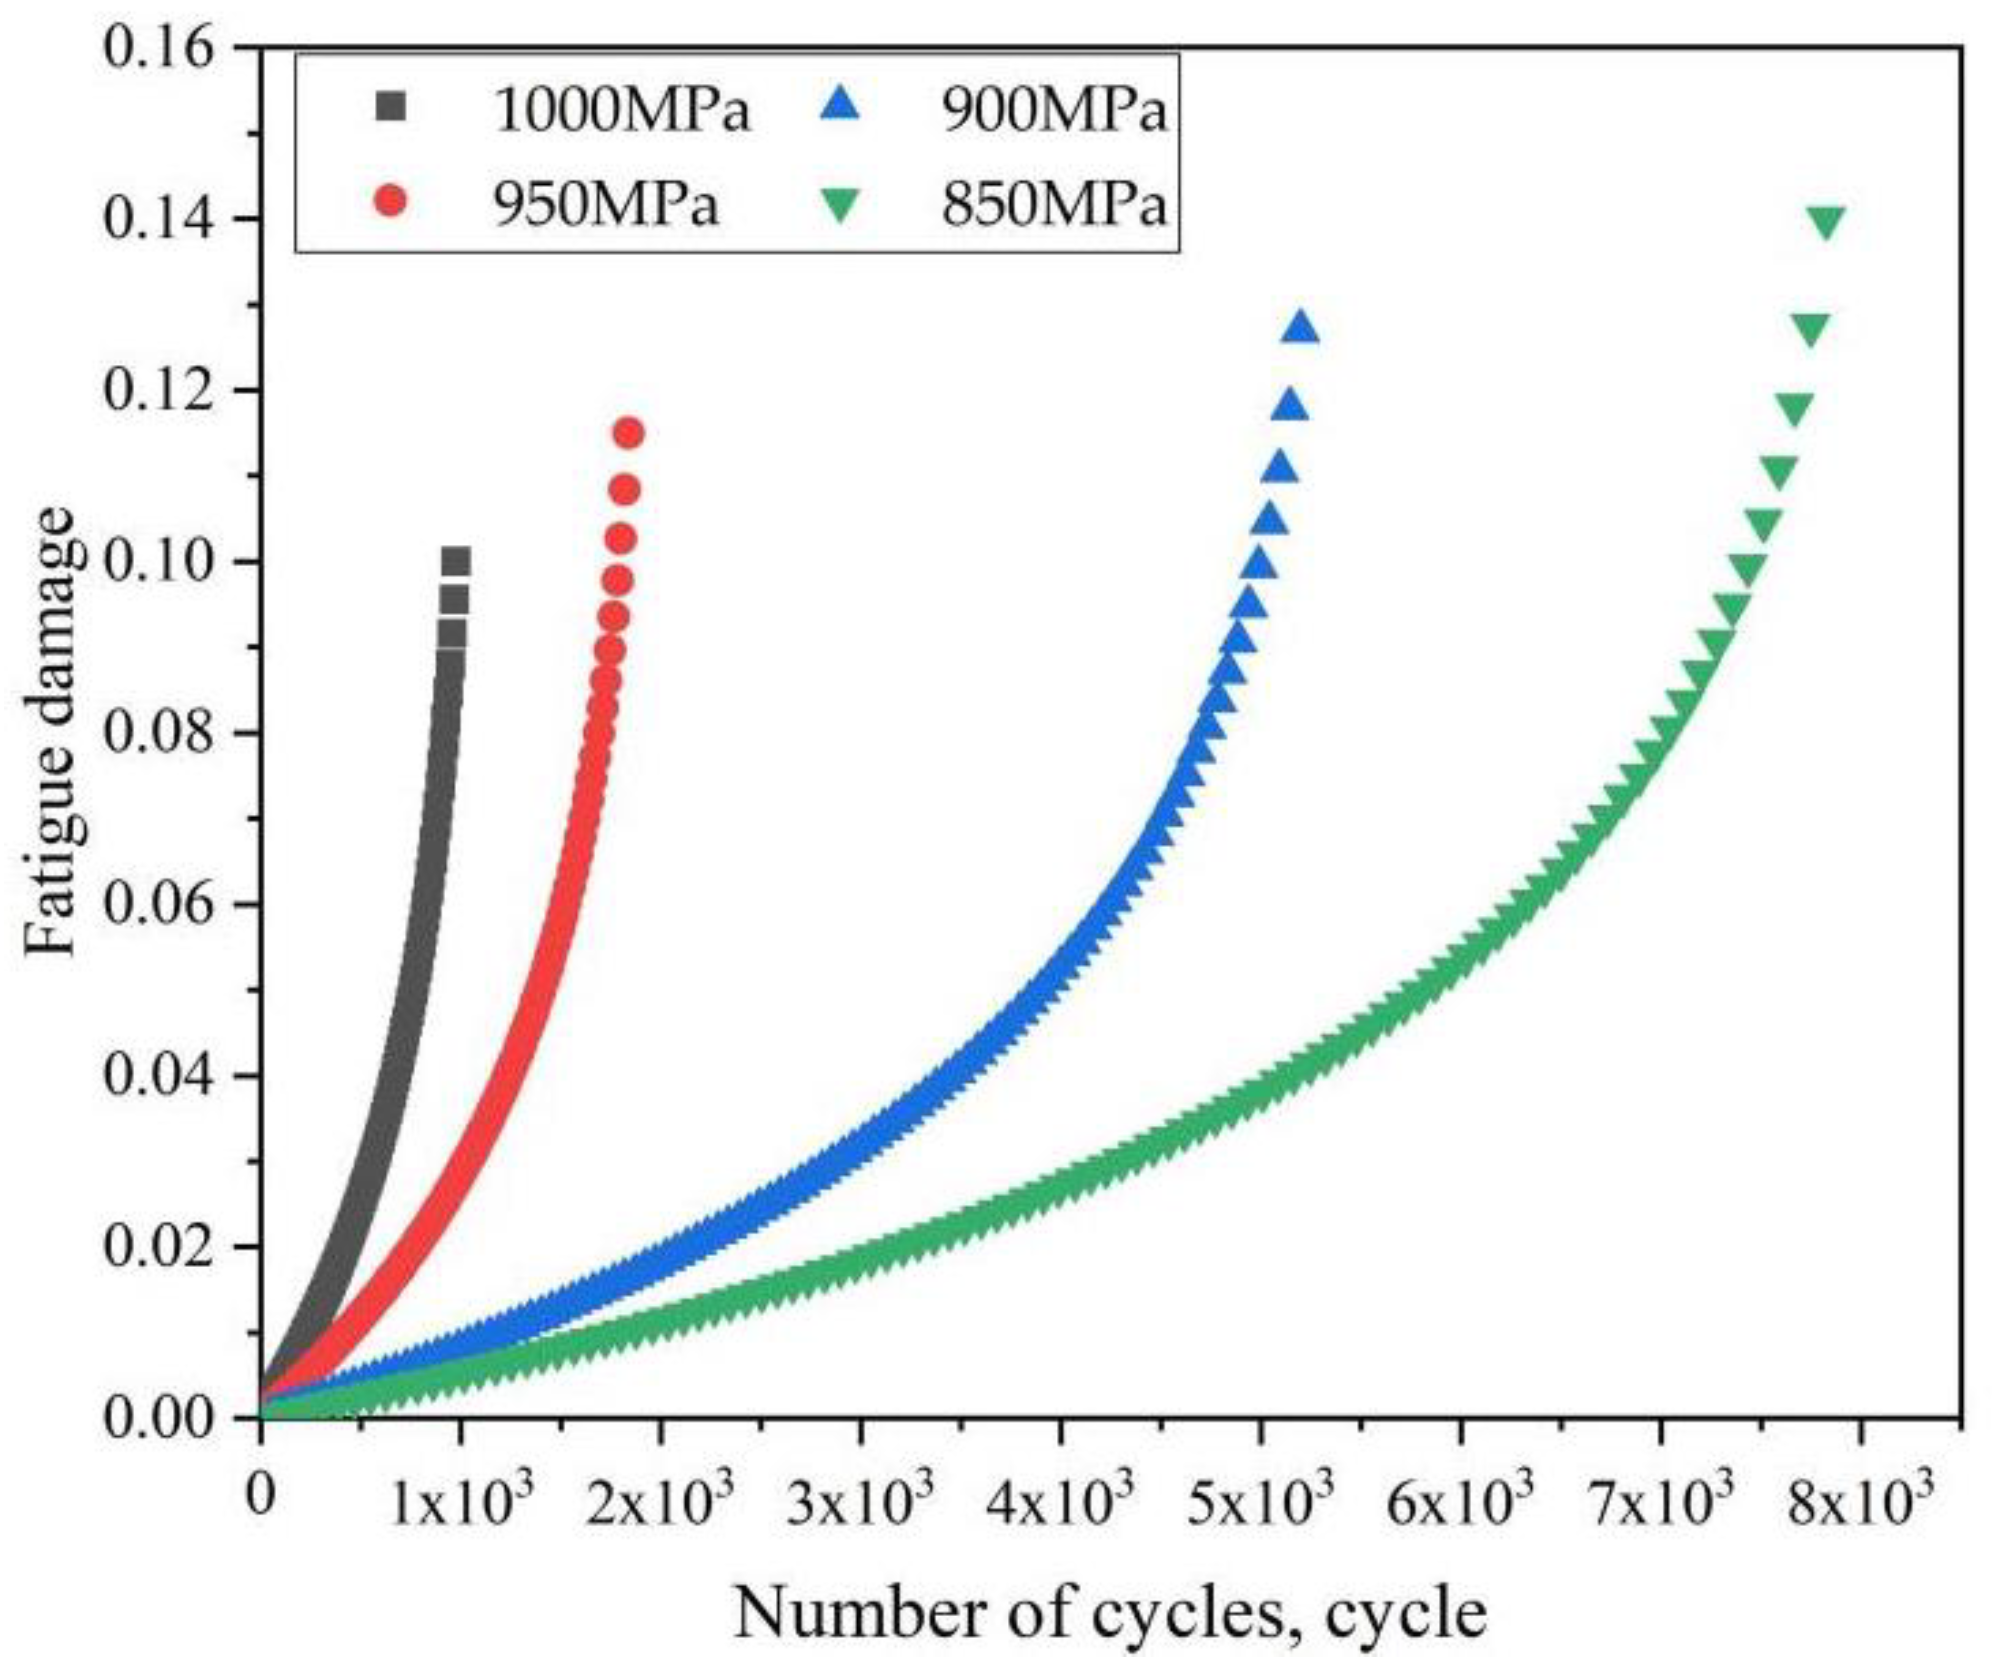
Based on Lemaitre damage theory, low cycle fatigue damage model was established to analyze the fatigue damage process, which was consistent with the experimental data. When the maximum stress exceeded yield stress, fatigue damage increased sharply and fatigue life decreased significantly.

Author Contributions

Z.Z. and D.C. conceived and designed the research; S.L., X.H., H.Q. and B.S. performed the experiment; B.N. analyzed and wrote the manuscript. All authors have read and agreed to the published version of the manuscript.

Funding

This research was funded by R and D plan for key areas in Guangdong Province (2020B010186001), Core technology research project of Foshan (1920001000412), Basic and applied basic research fund project in Guangdong Province(2020b15120093), Science and technology project in Guangdong (2020B121202002), R and D plan for key areas in Jiangxi Province (20201BBE51009, 20212BBE51012), Foshan material computing Engineering Technology Research Center and Innovation driven project of science and technology plan in Jiangxi Yichun.

Conflicts of Interest

The authors declare no conflict of interest.

References

  1. Zhao, Q.; Sun, Q.; Xin, S.; Chen, Y.; Wu, C.; Wang, H.; Xu, J.; Wan, M.; Zeng, W.; Zhao, Y. High-strength titanium alloys for aerospace engineering applications: A review on melting-forging process. Mater. Sci. Eng. A 2022, 845, 143260. [Google Scholar] [CrossRef]
  2. Zhang, P.; Zhang, D.; Zhong, B. Constitutive and damage modelling of selective laser melted Ti-6Al-4V lattice structure subjected to low cycle fatigue. Int. J. Fatigue 2022, 159, 106800. [Google Scholar] [CrossRef]
  3. Xu, Z.; Huang, C.; Wan, M.; Tan, C.; Zhao, Y.; Ji, S.; Zeng, W. Influence of microstructure on strain controlled low cycle fatigue crack initiation and propagation of Ti-55531 alloy. Int. J. Fatigue 2022, 156, 106678. [Google Scholar] [CrossRef]
  4. Helstroffer, A.; Hémery, S.; Andrieu, S.; Villechaise, P. Low cycle fatigue crack initiation in Ti-5Al-5Mo-5V-3Cr in relation to local crystallographic orientations. Mater. Lett. 2020, 276, 128198. [Google Scholar] [CrossRef]
  5. Joseph, S.; Bantounas, I.; Lindley, T.C. Slip transfer and deformation structures resulting from the low cycle fatigue of near-alpha titanium alloy Ti-6242Si. Int. J. Plast. 2018, 100, 90–103. [Google Scholar] [CrossRef]
  6. Gao, P.F.; Lei, Z.N.; Li, Y.K.; Zhan, M. Low-cycle fatigue behavior and property of TA15 titanium alloy with trimodal microstructure. Mater. Sci. Eng. A 2018, 736, 1–11. [Google Scholar] [CrossRef]
  7. Ren, J.; Wang, Q.; Zhang, B.; Yang, D.; Lu, X.; Zhang, X.; Zhang, X.; Hu, J. Influence of microstructure on fatigue crack growth behavior of Ti–6Al–3Nb–2Zr–1Mo alloy: Bimodal vs. lamellar structures. Intermetallics 2021, 130, 107058. [Google Scholar] [CrossRef]
  8. Li, S.; Xiong, B.; Hui, S. Comparison of the fatigue and fracture of Ti-6Al-2Zr-1Mo-1V with lamellar and bimodal microstructures. Mater. Sci. Eng. A 2007, 460, 140–145. [Google Scholar] [CrossRef]
  9. Xu, Z.; Huang, C.; Tan, C.; Wan, M.; Zhao, Y.; Ye, J.; Zeng, W. Influence of microstructure on cyclic deformation response and micromechanics of Ti-55531 alloy. Mater. Sci. Eng. A 2021, 803, 140505. [Google Scholar] [CrossRef]
  10. Sen, M.; Suman, S.; Mukherjee, S. Low cycle fatigue behavior and deformation mechanism of different microstructures in Ti-5Al-5Mo-5V-3Cr alloy. Int. J. Fatigue 2021, 148, 106238. [Google Scholar] [CrossRef]
  11. Anoushe, A.S.; Zarei-Hanzaki, A.; Abedi, H.R.; Barabi, A.; Huang, C.; Berto, F. On the microstructure evolution during isothermal low cycle fatigue of β-annealed Ti-6242S titanium alloy: Internal damage mechanism, substructure development and early globularization. Int. J. Fatigue 2018, 116, 592–601. [Google Scholar]
  12. Tan, C.; Sun, Q.; Xiao, L.; Zhao, Y.; Sun, J. Cyclic deformation and microcrack initiation during stress controlled high cycle fatigue of a titanium alloy. Mater. Sci. Eng. A 2018, 711, 212–222. [Google Scholar]
  13. Shao, H.; Zhao, Y.; Ge, P.; Zeng, W. Crack initiation and mechanical properties of TC21 titanium alloy with equiaxed microstructure. Mater. Sci. Eng. A 2013, 586, 215–222. [Google Scholar]
  14. Briffod, F.; Bleuset, A.; Shiraiwa, T.; Enoki, M. Effect of crystallographic orientation and geometrical compatibility on fatigue crack initiation and propagation in rolled Ti-6Al-4V alloy. Acta Mater. 2019, 177, 56–67. [Google Scholar]
  15. Sun, B.; Li, Z. A multi-scale damage model for fatigue accumulation due to short cracks nucleation and growth. Eng. Fract. Mech. 2014, 127, 280–295. [Google Scholar]
  16. Pang, K.; Yuan, H. Assessment of three-dimensional multi-crack propagation for fatigue life Prediction. Int. J. Pres. Ves. Pip. 2022, 198, 104660. [Google Scholar]
  17. Xiao, H.; Song, T.; Jia, B.; Lu, X. Uncertainty analysis of MSD crack propagation based on polynomial chaos expansion. Theor. Appl. Fract. Mech. 2022, 120, 103390. [Google Scholar]
  18. Tang, J.; Hu, W.; Meng, Q.; Sun, L.; Zhan, Z. A novel two-scale damage model for fatigue damage analysis of transition region between high- and low-cycle fatigue. Int. J. Fatigue 2017, 105, 208–218. [Google Scholar]
  19. Nie, B.; Song, Y.; Huang, X.; Qi, H.; Zhao, Z.; Chen, D. Low Cycle fatigue behavior of TC21 titanium alloy with bi-Lamellar basketweave microstructure. Crystals 2022, 12, 796. [Google Scholar]
  20. Zhu, S.; Hao, Y.; Liao, D. Probabilistic modeling and simulation of multiple surface crack propagation and coalescence. Appl. Math. Model. 2020, 78, 383–398. [Google Scholar]
  21. Briffod, F.; Bleuset, A.; Shiraiwa, T.; Enoki, M.; Emura, S. Effect of macrozones on fatigue crack initiation and propagation mechanisms in a forged Ti-6Al-4V alloy under fully-reversed condition. Materialia 2022, 22, 101401. [Google Scholar]
  22. Wang, X.; Zhao, Y.; Wang, L.; Wei, L.; He, J.; Guan, X. In-situ SEM investigation and modeling of small crack growth behavior of additively manufactured titanium alloy. Int. J. Fatigue 2021, 149, 106303. [Google Scholar]
  23. Koga, N.; Sakamaki, Y.; Kaseya, A.; Umezawa, O.; Nakata, H.; Toyoda, S. Visualization of strain distribution around fatigue crack developed by low cycle fatigue test in high-strength steels using digital image correlation method for replica films. Mater. Charact. 2022, 185, 111731. [Google Scholar]
  24. Xie, Y.; Gong, M.; Luo, Z.; Li, Q.; Gao, M.; Wang, F.; Zeng, X.; Wang, G. Effect of microstructure on short fatigue crack growth of wire arc addictive manufactured Ti-6Al-4V. Mater. Charact. 2021, 177, 111183. [Google Scholar]
  25. Lemaitre, J.; Desmorat, R. Engineering Damage Mechanics: Ductile, Creep, Fatigue and Brittle Failures; Springer: Dordrecht, The Netherlands, 2006. [Google Scholar]
Figure 1. Basketweave microstructure of TC21 titanium alloy after polishing.
Crystals 12 01211 g001
Figure 2. Shape and dimension specimens of low cycle fatigue.
Crystals 12 01211 g002
Figure 3. Observation of LCF damage: (a) Observation system for fatigue damage; (b) Fatigue specimens with an arc surface.
Crystals 12 01211 g003
Figure 4. In-situ SEM fatigue of TC21 titanium alloy: (a) In-situ fatigue loading device; (b) Dimensions of in-situ fatigue specimen.
Crystals 12 01211 g004
Figure 5. Tensile curve and deformation morphology of in-situ fatigue specimen: (a) curve of tensile load-displacement; (b) deformation morphology of notch root under 1500 N loads; F = 1500 N. (c) deformation morphology of notch root under 1800 N loads. F = 1800 N.
Crystals 12 01211 g005
Figure 6. Fatigue crack evolution of TC21 titanium alloy specimen under 1000 MPa stress amplitude (Red arrows represent fatigue cracks; red rings represent fatigue crack coalescence). (a) N = 10 cycles (1% Nf). (b) N = 100 cycles (10% Nf). (c) N = 300 cycles (30% Nf). (d) N = 450 cycles (46% Nf).
Crystals 12 01211 g006
Figure 7. Fatigue crack evolution of TC21 titanium alloy specimen under 950 MPa stress amplitude (Red arrows represent fatigue cracks; red rings represent fatigue crack coalescence). (a) N = 200 cycles (6% Nf). (b) N = 800 cycles (23% Nf). (c) N = 1400 cycles (40% Nf). (d) N = 2000 cycles (57% Nf).
Crystals 12 01211 g007
Figure 8. Statistics early fatigue cracks under different stress amplitudes. (a) Crack density. (b) Maximum crack length.
Crystals 12 01211 g008
Figure 9. Morphology of secondary crack initiation on the side of fatigue specimen under different stress amplitudes. (a) 1000 MPa. (b) 950 MPa.
Crystals 12 01211 g009
Figure 10. Morphology of secondary crack propagation on the side of fatigue specimen under different stress amplitudes. (a) 1000 MPa. (b) 950 MPa.
Crystals 12 01211 g010
Figure 11. Cracks propagation process under maximum load of 1800 N. (a) N = 25 cycles. (b) N = 180 cycles. (c) N = 250 cycles. (d) N = 350 cycles.
Crystals 12 01211 g011
Figure 12. Fatigue small cracks propagation process under maximum load of 1500 N. (a) N = 80 cycles. (b) N = 240 cycles. (c) N = 480cycles. (d) N = 600 cycles.
Crystals 12 01211 g012
Figure 13. Three stages of LCF microcracks damage: (a) high stress; (b) low stress.
Crystals 12 01211 g013
Figure 14. The relationship between fatigue damage and plastic accumulation during low cycle fatigue under strain amplitude of 0.7%.
Crystals 12 01211 g014
Figure 15. Fitting of damage mechanics parameters for low cycle fatigue life of TC21 titanium alloy.
Crystals 12 01211 g015
Figure 16. Comparison of the prediction of fatigue damage and experimental data under 950 MPa stress.
Crystals 12 01211 g016
Figure 17. Fatigue damage evolution under the different maximum stress.
Crystals 12 01211 g017
Publisher’s Note: MDPI stays neutral with regard to jurisdictional claims in published maps and institutional affiliations.

