Article

X-ray Line Profile Analysis of Austenitic Phase Transition and Morphology of Nickel-Free Fe-18Cr-18Mn Steel Powder Synthesized by Mechanical Alloying

by
Eliza Romanczuk-Ruszuk
1,*,
Krzysztof Nowik
2 and
Bogna Sztorch
3
1
Institute of Biomedical Engineering, Faculty of Mechanical Engineering, Bialystok University of Technology, Wiejska 45C, 15-351 Bialystok, Poland
2
Institute of Mechanical Engineering, Faculty of Mechanical Engineering, Bialystok University of Technology, Wiejska 45C, 15-351 Bialystok, Poland
3
Centre for Advanced Technologies, Adam Mickiewicz University in Poznan, Uniwersytetu Poznanskiego 10, 61-614 Poznan, Poland
*
Author to whom correspondence should be addressed.
Crystals 2022, 12(9), 1233; https://doi.org/10.3390/cryst12091233
Submission received: 31 July 2022 / Revised: 22 August 2022 / Accepted: 23 August 2022 / Published: 1 September 2022
(This article belongs to the Special Issue Crystal Plasticity (Volume II))

Abstract

:
In this study, microstructural evolution and phase transition of nickel-free Fe-18Cr-18Mn (wt. %) austenitic steel powders, induced by mechanical alloying, were investigated. X-ray diffraction, scanning electron microscopy, and microhardness testing techniques were used to observe the changes in the phase composition and particle size as functions of milling time. The first 30 h of mechanical alloying was performed in an argon atmosphere followed by nitrogen for up to 150 h. X-ray diffraction results revealed that the Fe-fcc phase started to form after 30 h of milling, and its fraction continued to increase with alloying time. However, even after 150 h of milling, weak Fe-bcc phase reflections were still detectable (~3.5 wt. %). Basic microstructure features of the multi-phase alloy were determined by X-ray profile analyses, using the whole powder pattern modeling approach to model anisotropic broadening of line profiles. It was demonstrated that the WPPM algorithm can be regarded as a powerful tool for characterizing microstructures even in more complicated multi-phase cases with overlapping reflections. Prolonging alloying time up to 150 h caused the evolution of the microstructure towards the nanocrystalline state with a mean domain size of 6 nm, accompanied by high densities of dislocations exceeding 1016/m2. Deformation-induced hardening was manifested macroscopically by a corresponding increase in microhardness to 1068 HV0.2. Additionally, diffraction data were processed by the modified Williamson–Hall method, which revealed similar trends of domain size evolutions, but yielded sizes twice as high compared to the WPPM method.

1. Introduction

Mechanical alloying (MA) is a popular method for obtaining new materials with a controlled structure. This method can be used for the synthesis of materials with equilibrium and non-equilibrium structures, and the preparation of supersaturated, metastable crystalline, quasi-crystalline, intermetallic, nanostructured, and amorphous alloys [1,2]. The advantage of MA involves the possibility of obtaining nanocrystalline solid solutions and the occurrences of low-temperature phase transformations [2]. During the mechanical alloying process, parameters such as milling time, milling atmosphere, ball-to-powder ratio, or the size of grinding balls are selected. The milling time is one of the most important variables that affect the purity, structure, and properties of the final powder product. Therefore, many publications focus on the analysis of the properties of powders depending on the milling time [1,3,4,5]. Another important process parameter that affects the oxidation and contamination of powders is the milling atmosphere. Generally, an inert atmosphere, such as argon or helium, is used. Nevertheless, when milling reactive powders, such as titanium, aluminum, iron, or iron alloys, a different protective atmosphere can be used to introduce gas from the atmosphere into the powders [1]. Mechanical alloying of iron alloy powders in a nitrogen atmosphere introduces nitrogen into the matrix in a solid–gas reaction. One interesting issue is the development of nickel-free austenitic stainless steel with nitrogen obtained by mechanical alloying in a nitrogen atmosphere and then consolidating these powders. Therefore, many studies have been carried out on nickel-free austenitic steel powders mechanically alloyed in a nitrogen atmosphere, which allows the introduction of nitrogen into the matrix. The use of nitrogen atmosphere in the mechanical alloying process leads to the transformation of ferrite into austenite. Additionally, manganese is added to these materials to increase the solubility of nitrogen [6,7].
The influence of the milling parameters and atmospheres on the Fe-α→Fe-γ phase transformation and amorphization process of the nickel-free stainless steel powder were analyzed by researchers [8,9,10,11]. However, there is no systematic analysis of the manganese (Mn) and nitrogen (N) influence and MA process parameters on the powder properties. Amini et al. [9] used elemental powders for the synthesis of Fe-18Cr-18Mn (wt. %) stainless steel under a nitrogen atmosphere. A fully fcc (Fe-γ) phase structure was achieved after 96 h of ball milling in a high-energy ball mill. Prolonging the ball milling process in this atmosphere up to 144 h resulted in an amorphous phase. Similar results, for Fe-18Cr-11Mn (wt. %) steel elemental powders mechanically alloyed in argon were reported by Haghir et al. [10]. A fully austenitic structure was achieved after 120 h of milling using a planetary high-energy ball mill (Retsch, PM100, Haan, Germany). When nitrogen atmosphere was used, a complete phase transformation occurred 20 h earlier. This emphasizes the nitrogen interstitial effect on the bcc to fcc phase transformation.
Tehrani et al. [12] reported an influence of Mn content on the Fe-α→Fe-γ phase transformation on two Fe-18Cr-7Mn and Fe-18Cr-8Mn (in wt. %) steel powder compositions mechanically alloyed in argon using a planetary high-energy ball mill (Retsch, PM100, Haan, Germany). In the higher manganese content alloy (8 wt. %), the fully austenitic structure was detected after 100 h of MA, while in the material with lower manganese content, even after 150 h of milling, the Fe-α→Fe-γ phase transformation was incomplete. This suggests that Mn content in the mechanically-alloyed austenitic steel should be higher than 7%.
The results in the literature show that the influence of manganese content from 6 to 12% on the properties of nickel-free stainless steel was usually investigated. The literature appraisal revealed that the influence of manganese content from 6 to 12% on the nickel-free stainless steel properties was usually investigated. In this study, a higher manganese content (18%) and a mixed atmosphere of mechanical alloying were used.
The main goal of this work was to analyze the phase transformation process and morphology of the Fe-18Cr-18Mn steel powder after mechanical alloying using argon followed by a nitrogen atmosphere.

2. Materials and Methods

2.1. Mechanical Alloying of Powders

Iron, chromium, and manganese elemental powders (average particle size ~45 μm, 99.5% purity) supplied by Alfa Aesar (Kandel, Germany) were mixed and mechanically alloyed to obtain a nominal composition of Fe-18Cr-18Mn (in wt. %). The MA process was conducted in a planetary, high-energy ball mill Pulverisette 6 (Fritsch, Amberg, Germany) at a rotation speed of 250 rpm. Stainless steel balls (12 mm in diameter) were charged into a 500 mL stainless steel bowl with a ball to powder ratio (BPR) of 10:1. First, mixing of the powders was performed for 0.5 h at 150 rpm under argon atmosphere. For the first 30 h, the milling process was conducted under a pure argon atmosphere (>99.999%); after that, pure nitrogen (>99.999%) was applied. After 150 h of MA, the process was finished.

2.2. Morphology and Microhardness of Powders

The morphology of the powders was examined using scanning electron microscopy (SEM, Hitachi 3000N, Tokyo, Japan) with an energy dispersive spectroscopy (EDS) (Hitachi, Tokyo, Japan). Semi-quantitative chemical analysis of the main elements in the powders was performed. Figure 1 shows the SEM image of the surface area of the particle taken for the EDS analysis.
Vickers microhardness (HV0.2) tests of the powders after different mechanical alloying times were performed using the PMT-3 tester (PMT Labs, Wah, Pakistan) under a load of 1.96 N (0.2 kg) for 15 s. For accurate results, at least ten indents were conducted on each sample and then the results were averaged and standard deviations determined.

2.3. X-ray Diffraction of Powders

A small amount of the MA powder was taken for the X-ray diffractometry (XRD) (Bruker, Karlsruhe, Germany) analysis after 30, 60, 90, 120, and 150 h of the milling process. To minimize the powder contamination, loading and unloading of the powder were performed in a glove box under a protection argon atmosphere. The phase structure was measured by means of X-ray diffractometry using Bruker D8 Advance equipped with Cu anode (λ = 0.15418 nm) radiation of 40 kV and 25 mA. For all samples, the angular range (2θ) of 20° to 100° with a step width of 0.01 and an acquisition time of 5 s was used. The instrumental broadening of peak profiles was determined using a corundum (Al2O3) standard (NBS SRM 1976b) and processed accordingly to the Caglioti et al. formula [13], following the procedures described widely in the literature (e.g., [14]).
It is widely known that traditional, “single-peak” methods of extracting microstructural data (e.g., Williamson–Hall method) do not take strain anisotropy effects into consideration [15], which are manifested in that the widths of the peaks do not increase monotonically with the diffraction angle θ [16]. For that reason, Ungár and Borbély developed an upgraded dislocation model of the mean square strain by incorporating the so-called average dislocation contrast factor C ¯ , which is known as the modified Williamson–Hall plot (MWH) [17]. The strain contribution can be expressed in terms of dislocation properties, as demonstrated in Equation (1):
K = 0.9 / d + π A b 2 / 2 1 2 ρ 1 2 K C ¯ 1 2 + O K 2 C ¯
where K = 2 sin θ / λ , K = 2 cos θ θ / λ , θ , θ , λ are the diffraction angle, FWHM of the reflection and the wavelength of X-rays. C ¯ is the average dislocation factor, where the average is made over the equally populated equivalent slip system. Other physical parameters in Equation (1) are: the dislocation density ρ , respectively, A is a constant determined by the outer cutoff radius of the strain field, R e , and O stands for noninterpreted, higher-order terms. Finally, b is the Burgers vector equal to b = a b c c 3 1 2 / 2 or b = a f c c 2 1 2 / 2 for bcc and fcc crystal systems, respectively, where a is the lattice constant. The value of C ¯ depends only on the ratios of the material’s elastic constants c 11 , c 12 , and c 44 , which can be further reduced to two parameters—elastic anisotropy A i = 2 c 44 / c 11 c 12 and the ratio c 12 / c 44 [18]. In the case of cubic lattice systems, C ¯ is a linear function of the fourth-order invariant of the h k l Miller indices [19], as shown in Equation (2):
C ¯ = C ¯ h 00 1 q H 2
where:
H 2 = h 2 k 2 + h 2 l 2 + k 2 l 2 h 2 + k 2 + l 2 2
Equation (2) shows that, under the hypothesis that the sample has a random texture, which is entirely justifiable for a milled powder or randomly oriented polycrystal, C ¯ can be evaluated if the values of q and C ¯ h 00 are known. C ¯ h 00 is the average contrast factor corresponding to the h 00 reflection, whereas the value of q determines the edge/screw type of dislocations [20].
To implement the strain anisotropy model, contrast factor coefficients had to be calculated for both Fe-bcc and Fe-fcc phases. As the austenitic transformation is caused by the continuous dissolution of Mn in the Fe matrix, it was assumed that the ferritic phase occurring at the beginning of MA was pure Fe, while the austenitic phase had the nominal composition of Fe-18Cr-18Mn. The necessary single crystal c i j elastic constants of pure ferrite (Fe-bcc) were adopted from the literature [21], whereas Fe-18Cr-18Mn alloy elastic properties were estimated by the relations provided by Razumovskiy et al. [22]. These values were used to calculate the average contrast factors toward the h 00 direction for edge C ¯ h 00 e and screw the C ¯ h 00 s dislocations, considering the 111 110 and 110 111 primary slip systems for bcc and fcc metals, respectively, using the online program ANIZC [23]. Similarly, the extreme values of q , corresponding to pure edge q e and pure screw q s dislocation characters were obtained by equations elaborated by Ungár et al. [18]. After obtaining C ¯ h 00 and q , the average contrast factor can be calculated. The trend of C ¯ as a function of the scattering vector modulus s = 2 sin θ / λ is plotted in Figure 2. As presumed, C ¯ reaches its maximum towards the h 00 direction, which is the soft crystallographic direction in both bcc and fcc Fe, along which the strain proceeds the most easily [24]. Relevant parameters needed to incorporate the dislocation model are summarized in Table 1. As can be noticed, the anisotropy of Fe-18Cr-18Mn austenitic alloy is considerably higher than in the case of pure bcc Fe, which is manifested by bigger deviations of A i from unity.
Contrary to the classical methods of the line profile analysis (LPA), i.e., fitting peak profiles using arbitrarily defined, bell-shaped mathematical functions (top-down approach), the more sophisticated, bottom-up approach was recently developed. In the bottom-up approach, the entire diffractogram is modeled directly as a set of physical parameters affecting the peak‘s shape, width, and position. The size broadening calculation is based on the concept of column heights and the lognormal distribution of crystallite sizes is assumed (in contrast to the plain average obtained by classical LPA methods), which was largely verified in the case of highly deformed metals and finely dispersed powders [25]. Strain broadening was considered by the Krivoglaz–Wilkens theory of dislocations in distorted crystals [26].
The whole powder pattern modeling (WPPM) has been proposed as a universal technique for microstructure refinement. It provides detailed data on specimen microstructures by directly comparing model peak profiles with the entire experimental pattern, considering instrumental broadening and background [27,28]. Size and defect contributions are convoluted together with the instrumental component, and the pattern is then directly synthesized through Fourier transformation [29]. Despite the close analogy to the widely used Rietveld method, in WPPM, structural information is limited only to lattice parameters, while Rietveld refinement strictly relates integrated intensity to the structural model (atomic positions, occupancy, thermal factors, etc.) [28]. Another (but very similar to WPPM) approach is known as the convolutional multiple whole profile fitting (CWMP) [30], with the procedure of employing the instrumental profile being the only major difference. WPPM has been successfully utilized for investigating microstructural evolution in many ball-milled powders and other nanocrystalline materials [29]. Its algorithm has been implemented in a free and flexible software package, named PM2K [31], which was exploited in this study.

3. Results and Discussion

3.1. Morphology and Microhardness of the MA Powders

Figure 3 shows SEM images of the powder morphology as a function of milling time. The histogram of the average particle size is presented in Figure 4. It is clear that the time of the process impacts the powder morphology. As received, an iron powder is regular and smooth in shape (Figure 3a). The chromium powder is irregular and angular in shape (Figure 3b), whereas the manganese powder (Figure 3c) has a morphology similar to chromium, with a more regular and smoother surface. The first 30 h of MA revealed an irregular shape of the powder, with an average size of 165 ± 10 µm. After replacing argon with nitrogen and prolonging the milling time up to 60 h, an average particle size continues increasing up to 213 ± 11 µm. The next 30 h of milling (30 h in argon and 60 h in nitrogen) did not change the morphology of powder particles; however, the average size of particles slightly decreased to 200 ± 10 µm. After another 30 h of MA, significant particle refinement to 81 ± 8 µm was observed. Thus, at this stage of the MA process, after 30 h of milling in argon and 90 h of milling in nitrogen (total time of MA was 120 h), the powder fracturing took place. The MA process was performed up to a total of 150 h (30 h in argon and 120 h in nitrogen) and revealed bimodal distributions of particle, where approximately 75% of the powder had particle sizes of 51 ± 6 µm and 25% of powder had particle sizes of 10 ± 5 µm. This kind of bimodal powder distribution might have a favorable influence on the classical PM consolidation process, e.g., annealing, cold compaction, and sintering.
The mechanical alloying process consists of the repetition of cold welding, fracturing, and rewelding of powder particles occurring in the milling jar by collisions of balls against each other and the walls of the jar. The cold welding leads to an increase in particle sizes, while the fracturing leads to the fragmentation of particles [32]. Analyzing changes in the morphology of particles as a function of milling time, it can be concluded that during the first 60 h of MA, cold welding dominates, increasing the average particle size. The subsequent 30 h of milling does not cause a significant alteration in the particle size. This means that the fracturing process, resulting in the particle size decrease, is in equilibrium with the cold welding process. After 120 h of MA, the fracturing phenomenon causes a continuous decrease in the particle size, which emphasizes domination of the fracturing over cold welding. After 150 h of ball milling, the average particle sizes were almost similar to the initial sizes of the particles used at the beginning of the process (but with the bimodal distribution). Similar trends were reported by Haghir et al. [10], whereas Cisneros et al. [33] and Duan et al. [34] observed that the initial sizes of the elemental powders of ~50 μm after mechanical alloying, up to 170 h in nitrogen, were reduced to 10 μm. The authors pointed out that first the powder particles flattened and then the prolonging of milling time became equiaxed.
Coarser particle sizes observed here, in comparison with the literature data [33,34], are due to the different milling devices and process parameters, including atmospheres. For instance, decreasing the ball to the powder weight ratio from 10:1 to 5:1 can cause a significant increase in the crystallite and particle size of the obtained powder [32]. Cisneros et al. [33] used an attritor ball mill with the ball to powder weight ratio of 30:1, the rotation speed of 300 rpm, and nitrogen. Duan et al. [34] used a planetary ball mill, for instance, with a rotation speed of 350 rpm, and with three different types of ball diameters. This explains the differences between the literature data and the results presented here. Moreover, the atmosphere used here differs from the literature cited. The powder obtained here is softer in comparison to the hardness measurements presented by the other authors. This suggests that nitrogen content in the bulk powder is lower and, therefore, the number density of hard nitride precipitations can be reduced. This is clearly observed especially when argon atmosphere is used.
Figure 4 depicts the microhardness variation of the as-milled powder as a function of the milling time. The average microhardness of the powder increased from 450 ± 35 HV0.2 (after 0.5 h of powder blending) to 523 ± 45 HV0.2 after the first 30 h of MA. Note that when the atmosphere changed from argon to nitrogen, the hardness of the powder abruptly increased from 523 ± 45 up to 731 ± 52 HV0.2 within the same period of time. By further prolonging the milling time, an average hardness almost linearly increased, reaching 1068 ± 56 HV0.2 after 150 h of milling.
The mechanical alloying process, due to collisions of the powder with the balls and jar wall, generated microstructure defects, which caused the hardening effect and a continuous increase in hardness. As expected, a greater increase in the hardness of the powder was measured after changing the milling atmosphere from argon to nitrogen. However, the final hardness measured in this work was about 5% lower in comparison with the literature data [7], where the nominal composition of the tested powder was Fe-18Cr-4Mn (in % wt.), a 2.5 times lower percent of manganese in comparison with this work [7]. It is worth noting that Salahinejad et al. [7] applied different mechanical alloying process parameters (e.g., the ball to powder weight ratio was 30:1) and nitrogen atmosphere through the whole period of MA. After 153 h of mechanical alloying, a fully amorphous phase was obtained. Moreover, the microhardness of powder after 99 h of milling, when the phase structure was crystalline, was 1070 HV similar to the value obtained in this work after 150 h of MA.

3.2. Chemical Composition of Powders

In this work, the nominal composition of the alloy (Fe-18Cr-18Mn-N) was selected based on the modified Schaeffler’s diagram for austenitic stainless steel. The percentage of manganese used in this study was higher in comparison to the literature data [6,33,35,36,37]. Higher Mn content stabilizes γ-Fe phase and alters the final powder’s properties. We calculated both the Ni and Cr equivalents assuming that the steel possessed 18% of Mn and 18% of Cr, to find out the minimum N content that ensured the austenitic structure. From these calculations, it followed that 0.75% of N content was enough to obtain the austenite phase structure at room temperature. This N content can also be diminished when the equivalent carbon in the powder is included. From the literature, it is known that 0.9 ÷ 1.2% of N and 0.02 ÷ 0.03% of C content in austenitic steel powder after 120–150 h of MA was measured [33,36].
Table 2 presents the changes in the main element composition of the steel powder as a function of the milling time. These results reveal that, with up to 90 h of MA, the Mn and Cr content continuously increase; however, after this time of milling, the concentrations of these elements are almost unaffected. Therefore, taking into account the optimization process, the expected composition of the alloy was achieved after 90 h of milling, which suggests that the process of MA should be interrupted. The MA process was continued for up to 150 h to find out whether—after such a long time of milling—an amorphous phase would occur. The content of nitrogen and carbon increased gradually with the increasing milling time. After 150 h of mechanical alloying, the nitrogen content was 0.9% and carbon was 0.03%; the content of N and C were similar to the data from the literature.

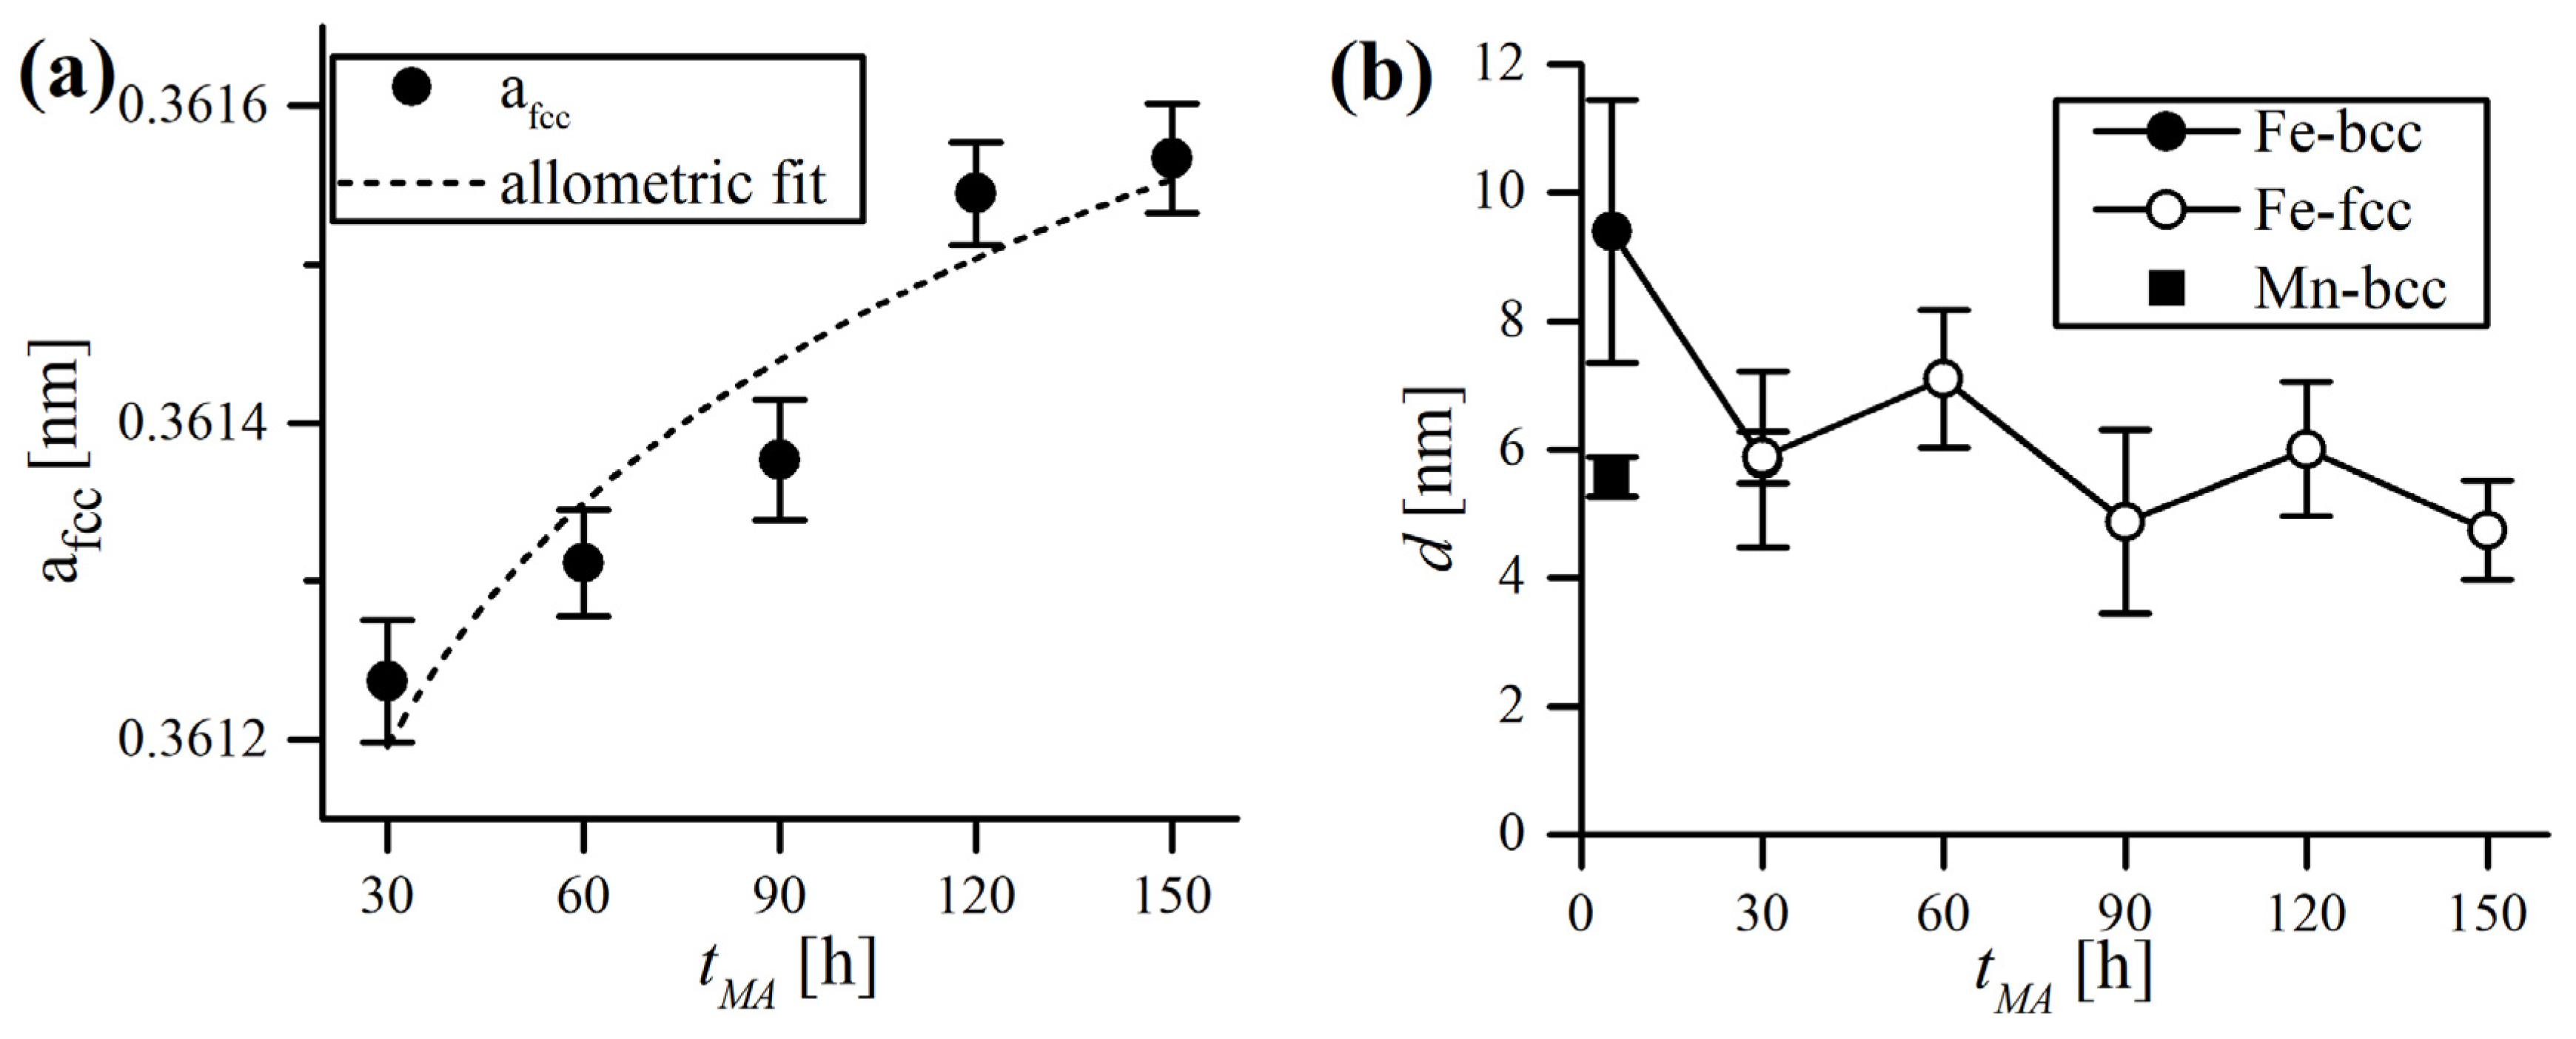
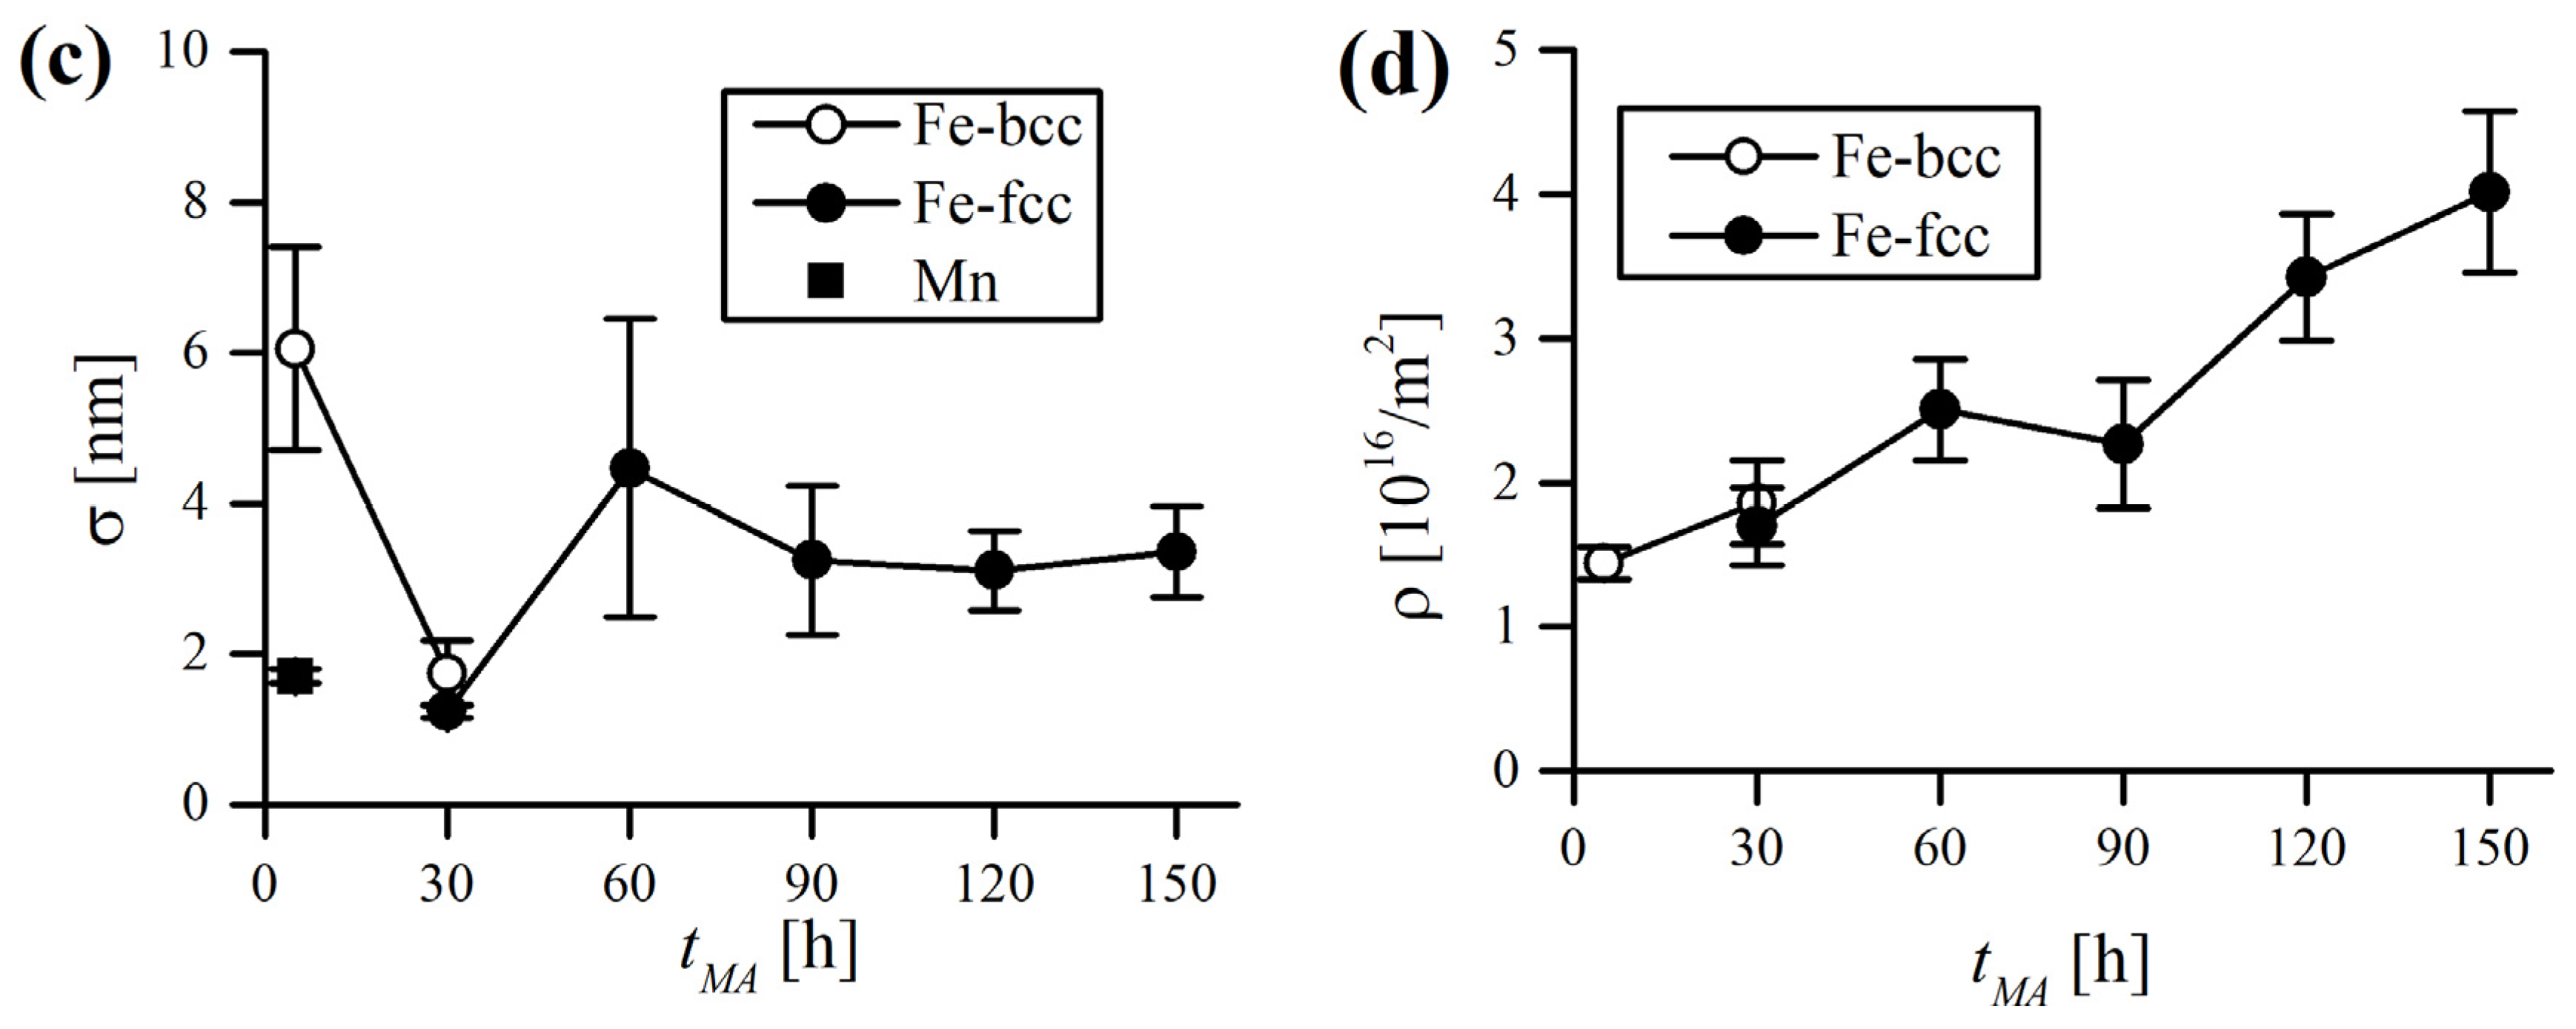
3.3. X-ray Diffraction Analysis of the Powders

Several XRD patterns gathered at various stages of MA are shown in Figure 5a. As can be seen at the early stage of MA (5 h), the microstructure was purely bcc, and the main Fe-bcc phase was accompanied by several reflections of Mn-bcc. After 5 h of milling, no significant change in microstructure occurred as compared to the initial powder mixture (Figure 5c), besides broadening of reflections, and Mn peaks were still present. Eventually, after 30 h of MA, Mn reflections vanished, suggesting that it was finally dissolved in the Fe matrix. At this point, the Mn-induced phase transformation process was obvious, as the bcc peak intensities dropped drastically and fcc peaks became dominant (Figure 5a,c). After 60 h of MA, the bcc reflections were nearly elusive, with the exception of the most prominent [110] Fe-bcc peak. Prolonged milling caused a further increase in the intensity of the Fe-fcc phase. The Fe-bcc [110] peak trace, however, was still detectable even after 150 h of MA (Figure 5d).
XRD patterns were fitted using the pseudo-Voigt function and the extracted data (peak 2 θ position and FWHM) were processed in accordance with the MWH procedure, using the calculated contrast factor values for Fe-bcc and Fe-fcc phases, and regarding the instrumental broadening correction and proper background definition. The phase percentage was estimated by the ratio of integrated areas of peak profiles of Fe-bcc and Fe-fcc phases, respectively, as presented in Figure 6.
Extracting information from the experimental peak profiles, where multiple phases exist simultaneously, outlines the major problem concerning the traditional LPA methods—overlapping among peak profiles (especially within the region of Fe-bcc [110] and Fe-fcc [111] peaks). The most common solution to this difficulty is pattern decomposition—separating the individual contributions from different phases and subtracting the instrumental and background effects.
The main results of the MWH analysis are collated in Figure 7. The experimental values of q , which imply the edge/screw characters of dislocation, were evaluated using the methodology provided by Ungár et al. [18] (Figure 7a). The FWHM values were plotted according to the MWH relation (Figure 7b), where the intersection at K C 1 / 2 = 0 gave the average crystallite size d . It is clear that the data points follow the linear trend in almost the exact manner and, therefore, were fitted using the linear function. It should be underlined that, due to the progressive bcc→fcc phase transformation over the MA time, the reliable determination of FWHM of Fe-bcc reflections was rather unobtainable after 30 h of MA, caused by the strong broadening and low intensity. Although after 30 h of MA, there were still three apparent Fe-bcc reflections present (Figure 5a), they were not enough to calculate d accurately using the MWH method.
As presented in Figure 7c, the domain size was reduced from ~20 nm to around 10 nm during the first 60 h of MA and saturates at this level until the end of milling. The slope of the MWH linear approximation is also plotted in Figure 7c, which can be related to the dislocation arrangement parameter M and the square root of dislocation density ρ . However, the M can be determined thoroughly only with the Fourier methods, such as WPPM. Consequently, the determination of ρ from the results obtained by MWH alone is improper and should be avoided [38]. Nevertheless, the inspection of the MWH slope provides some insight into the strain accumulation in the material, and it can be noticed that it mimics the trend of d in the opposite manner (Figure 7c). Finally, the dislocation character trend was plotted in the form of the edge dislocation fraction f e (Figure 7d). In general, the dislocation structure is in favor of screw dislocations over the whole MA process, which might be caused by the rotational nature of the ball milling process, promoting the formation of twists in crystals [39]. The f e value fluctuates in the 0.2–0.4 region and never exceeds the half edge–half screw line. This supports the other authors’ conclusions that edge dislocations are unstable in fine Fe domains [24,40].
The diffraction data were furtherly analyzed by the WPPM approach and the quality of fit can be perceived in Figure 8. Plots present the experimental data compared with model WPPM diffractograms, further decomposed into single analyzed phases (Mn-bcc, Fe-bcc, and Fe-fcc). A flat, nearly featureless residual line (the difference between experimental and calculated patterns) proves good quality of modeling. The graphical analysis is essential to determine the quality of fit and to ensure that the model is chemically plausible. The quality of WPPM fit, such as in other least-squares minimization methods, can also be defined by inspecting the discrepancy factors. In this study, the most straightforward discrepancy index, the weighted profile R -factor, R w p , did not exceed 3.46%, which indicates a robust quality of fit, particularly considering the multiplicity of phases and overlapping peaks. Another marker, goodness of fit (GoF, related to the ratio between actual and expected R w p ) had a maximum of 1.52 (pattern after 5 h of MA) and a mean value of 1.21 (where unity indicates the flawless fit).
Unlike the MWH method, the pattern is not decomposed into individual line profiles, but the whole diffractogram is modeled by optimizing the value of several physical parameters. Figure 8a presents the pattern obtained after 5 h of MA, with a detailed view of multiple, minor Mn-bcc reflections, successfully refined using WPPM. Figure 8b–d magnify the most interesting, from the modeling viewpoint, 2 θ region, where prominent Fe-bcc [110] and Fe-fcc [111] peaks extensively overlap. Additionally, inserts show the fit quality of the remaining reflections.
Basic results derived from WPPM refinement, in terms of size and strain evolution during MA, are revealed in Figure 9. It is a known fact that MA prompts the volume expansion of the unit cell, predominantly as a result of severe plastic deformation and persistent dissolution of alloying additives and various contaminants originating from the milling equipment into the matrix [28]. As depicted in Figure 9a, the lattice parameter a f c c of the Fe-fcc phase increases constantly up to 90 h of MA and then exhibits a sharp rise and sets around this value.
The domain size d decreases with the MA time, following a similar trend as using the MWH method, and so does the lognormal standard deviation (Figure 9b,c). However, the d values obtained with the WPPM method are roughly half of that calculated by MWH. Both methods confirm that grain refinement is effective only during the beginning of MA (up to 30 h), with little reduction achieved afterward. It is worth mentioning that real materials have distributions of domain sizes, so the trends of the size distributions should also be followed, as demonstrated in Figure 10, and the corresponding values of the standard deviation of lognormal distribution are plotted in Figure 9c. It is clear that mechanical treatment causes the shift of the domain size distribution curve to lower values, the standard deviation being reduced accordingly, especially in the early stage of MA (Figure 10a). Eventually, a microstructure consisting of very fine ( d = 6 nm) and narrowly distributed ( σ = 3 nm) crystalline domains is established. Similar crystallite sizes were previously reported for other ball-milled fcc alloys (e.g., [41,42]).
It is also clear that ball milling generates a high density of dislocations due to severe plastic deformation of ground material, which can be followed in Figure 9d. In general, the accumulation of defects in the Fe-fcc phase follows a similar trend to lattice expansion, with the same sharp rise after 120 h of MA. This is foreseeable, given the fact that the lattice inflation is caused not only by the dissolution of alloying additives but is directly caused by an increase in the dislocation density [43] and is further promoted by extrinsic dislocations pilling up at the grain boundaries [44]. Rawers and Cook suggested that the strain on the grain boundary could extend into the nanograin itself, expanding the lattice [45]. In this study, from the moment of appearing (30 h) up to 90 h of MA, the ρ of Fe-fcc phase oscillates around 2 × 10 16 / m 2 , then experiences a sharp rise and sets around 3.5 × 10 16 / m 2 , the effective outer cutoff radius R e being 6.24 nm. The final value of R e is around that of the mean crystallite size d (6.0 nm), and corresponds to an average of half the dislocation per crystalline domain (for d = 6.0 nm: d / π d 3 / 6   ~   5.3 × 10 16 / m 2 ), which is plausible. This is in line with HRTEM observations of ball-milled FeMo alloy by Rebuffi et al. [24], which concluded that dislocations are rather unlikely to be present in every single crystalline domain. As the accumulation of defects in powders, subjected to serious mechanical treatment, is the principal cause of microhardness growth during MA (Figure 4), ρ and H V can be related, which is demonstrated in Figure 11.
Regarding the mutual dependence of ρ and R e parameters in the Krivoglaz–Wilkens dislocation theory, Wilkens introduced the dimensionless parameter M = R e ρ 1 = R e / l d called the Wilkens parameter. As can be noticed, M is also directly related to the average dislocation distance l d ; therefore, it is used to determine the arrangements of dislocation arrangements in the strain fields [30]. The value of M much larger than unity ( M 1 ) indicates that the dislocations are very weakly correlated and randomly arranged (weak dipole character). In contrast, M 1 signifies a distinctly correlated dislocation arrangement, accompanied by an intense screening of strain fields ( R e < l d ) (strong dipole character). In the present case, the decreasing value of M of the fcc phase to the value of ~1 with milling time (Figure 12) supports the hypothesis of gradual transformation from a dislocation cell structure with long-range strain fields into the nanocrystalline microstructure with a high density of dislocations, systematically distributed in grain boundaries.
The WPPM modeling quality was good (mean GoF = 1.21) and hassle-free in almost all cases, except the problems encountered during refining the pattern obtained after 30 h of MA. In that case, during refinement of the Fe-bcc phase, R e constantly reached unrealistically small values (<1 nm), the lower limit of the continuum approach [46]. As a consequence, ρ rose to incredibly high levels a few times 10 17 / m 2 , accompanied with very low M (~0.35). When the dislocation density in material becomes sufficiently high (≫ 10 16 / m 2 ), the strain field parameters ( ρ , R e , M ) can become uncertain in the sense that R e constantly approaches 0; this is a known intrinsic problem with the Krivoglaz–Wilkens theory caused by the strong reciprocal correlation of R e and ρ [47]. The simplest way to overcome this discrepancy is by imposing the arbitrary value of R e and keeping it fixed during refinement. Here, we assumed that R e was extended to the size of the entire crystalline domain ( R e = d , ~6 nm), and with this constraint, ρ = 2.92 × 10 16 / m 2 and M = 0.85 was obtained, which seemed perfectly reasonable.

4. Conclusions

The Fe-18Cr-18Mn-N nickel-free austenitic stainless steel powder was synthesized by mechanical alloying under argon for the first 30 h followed by nitrogen for up to 150 h. The formation of the nanocrystalline Fe-fcc phase involved the bcc to fcc phase transition induced by MA, which was studied via the analysis of powder diffraction data. After the first 30 h of MA in argon, an XRD examination revealed solubility of the main alloying elements (manganese and chromium) in the iron matrix and the mixture of fcc and bcc phase structure. Nitrogen incorporation into the powder intensified the phase transformation. The final morphology of the powder was globular but flattened, with a bimodal distribution. A greater increase in the hardness of the powder was measured after changing the milling atmosphere from argon to nitrogen.
The XRD line profile analysis was illustrated herein by means of a typical case of an experimental study of plastically deformed metal powders subjected to intense ball milling. It was demonstrated that the classic Williamson–Hall method can be relevantly enhanced by incorporating the anisotropic contrast factor, but there is no doubt that WPPM provides a far more detailed description of complex phenomena occurring during MA, and, in general, microstructure evolution. However, despite entirely different methodology of processing the XRD data, our comparison shows that results obtained by MWH and WPPM are coincident in terms of the domain size evolution trend, as both of them indicate that the final value of d halved during the MA cycle. The agreement between the grain size trend in WPPM and MWH certainly contributes to validating the calculations. However, each domain size value produced by MWH is generally twice higher compared to the results obtained by WPPM; however, both of these methods still indicate very fine, nanocrystalline sizes of crystallites (~10 nm or below). The source of the discrepancies in the d estimation might be numerous but is most likely caused by the fact that neither shape nor distribution of the domain size was taken into account in the MWH procedure. Thus, MWH should mostly be used for the preliminary analysis of diffraction lines and quantitative interpretation of its results should be discouraged.
Our simulations proved that the WPPM algorithm can be successfully adopted to quantify the microstructural parameters of more complex, multi-phase patterns when overlapping of line profiles occur. WPPM delivered detailed information on the evolution of the crystallite size and average defect density. Microstructural information attained by WPPM is useful in terms of optimizing and controlling the phase transformation during MA.
The SEM-EDS analysis of the powder revealed that manganese and chromium content continuously increases up to 90 h of MA; however, after this time, the concentration of these elements is almost unaffected, which suggests that the process of MA can be considered finished. Due to the gentle MA process parameters applied in this work in comparison to the literature, no amorphous phase of the steel powder was detected.

Author Contributions

Conceptualization, E.R.-R. and K.N.; methodology, E.R.-R., K.N. and B.S.; formal analysis, E.R.-R., K.N. and B.S.; investigation, E.R.-R. and K.N., data curation, K.N. and E.R.-R.; writing—original draft preparation, E.R.-R., K.N. and B.S.; writing—review and editing, E.R.-R. and B.S.; visualization, E.R.-R. and K.N.; supervision, E.R.-R. and B.S.; project administration, E.R.-R.; funding acquisition, E.R.-R. All authors have read and agreed to the published version of the manuscript.

Funding

This research was funded by the Institute of Biomedical Engineering, Faculty of Mechanical Engineering, Bialystok University of Technology, project no. WZ/WM-IIB/2/2020.

Acknowledgments

The authors are grateful to Zbigniew Oksiuta for the constructive suggestions during the planning and development of this research.

Conflicts of Interest

The authors declare no conflict of interest.

References

  1. Amini, R.; Salahinejad, E.; Askari Bajestani, E.; Hadianfard, M. Microstructural and hardness evolution of mechanically alloyed Fe–Cr–Mn–N. J. Alloys Compd. 2010, 497, 369–372. [Google Scholar]
  2. Dorofeev, G.A.; Lubnin, A.N.; Ulyanov, A.L.; Kamaeva, L.V.; Lad′yanov, V.I.; Pushkarev, E.S.; Shabashov, V.A. XRD characterization of mechanically alloyed high-nitrogen nanocrystalline Fe–Cr system. Mater. Lett. 2015, 159, 493–497. [Google Scholar] [CrossRef]
  3. Amornpitoksuk, P.; Suwanboon, S. Correlation of milling time on formation of TiCoSb phase by mechanical alloying. J. Alloys Compd. 2008, 462, 267–270. [Google Scholar] [CrossRef]
  4. Jain, A.; Agarwal, S.; Jain, I. Correlation between the milling time and hydrogen-storage properties of nanostructured ZrFeNi ternary alloy. J. Alloys Compd. 2009, 480, 325–328. [Google Scholar] [CrossRef]
  5. Chaisan, W.; Yimnirun, R.; Ananta, S. Effect of vibro-milling time on phase formation and particle size of barium titanate nanopowders. Ceram. Int. 2009, 35, 173–176. [Google Scholar] [CrossRef]
  6. Sumita, M.; Hanawa, T.; Teoh, S. Development of nitrogen-containing nickel-free austenitic stainless steels for metallic biomaterials—Review. Mater. Sci. Eng. C 2004, 24, 753–760. [Google Scholar] [CrossRef]
  7. Salahinejad, E.; Amini, R.; Marasi, M.; Sritharan, T.; Hadianfard, M. The effect of nitrogen on the glass-forming ability and micro-hardness of Fe–Cr–Mn–N amorphous alloys prepared by mechanical alloying. Mater. Chem. Phys. 2009, 118, 71–75. [Google Scholar] [CrossRef]
  8. Rawers, J.C.; Govier, D.; Doan, R. Nitrogen addition to iron powder by mechanical alloying. Mater. Sci. Eng. A 1996, 220, 162–167. [Google Scholar] [CrossRef]
  9. Amini, R.; Hadianfard, M.; Salahinejad, E.; Marasi, M.; Sritharan, T. Microstructural phase evaluation of high-nitrogen Fe–Cr–Mn alloy powders synthesized by the mechanical alloying process. J. Mater. Sci. 2009, 44, 136–148. [Google Scholar] [CrossRef]
  10. Haghir, T.; Abbasi, M.; Golozar, M.; Panjepour, M. Investigation of α to γ transformation in the production of a nanostructured high-nitrogen austenitic stainless steel powder via mechanical alloying. Mater. Sci. Eng. A 2009, 507, 144–148. [Google Scholar] [CrossRef]
  11. Amini, R.; Salahinejad, E.; Hadianfard, M.; Marasi, M.; Sritharan, T. Characterization of Fe–Cr–Mn–N amorphous powders with a wide supercooled liquid region developed by mechanical alloying. Mater. Sci. Eng. A 2010, 527, 1135–1142. [Google Scholar] [CrossRef]
  12. Tehrani, F.; Abbasi, M.; Golozar, M.; Panjepour, M. The effect of particle size of iron powder on α to γ transformation in the nanostructured high nitrogen Fe–Cr–Mn–Mo stainless steel produced by mechanical alloying. Mater. Sci. Eng. A 2011, 538, 3961–3966. [Google Scholar] [CrossRef]
  13. Caglioti, G.; Paoletti, A.; Ricci, F.P. Choice of Collimator for a Crystal Spectrometer for Neutron Diffraction. Nucl. Instr. Meth. 1958, 3, 223–228. [Google Scholar] [CrossRef]
  14. Scardi, P.; Leoni, M. Fourier modelling of the anisotropic line broadening of X-ray diffraction profiles due to line and plane lattice defects. J. Appl. Crystallogr. 1999, 32, 671–682. [Google Scholar] [CrossRef]
  15. Scardi, P.; Leoni, M.; Delhez, R. Line broadening analysis using integral breadth methods: A critical review. J. Appl. Crystallogr. 2004, 37, 381–390. [Google Scholar] [CrossRef]
  16. Ungár, T.; Révész, Á.; Borbély, A. Dislocations and Grain Size in Electrodeposited Nanocrystalline Ni Determined by the Modified Williamson-Hall and Warren-Averbach Procedures. J. Appl. Crystallogr. 1998, 31, 554–558. [Google Scholar] [CrossRef]
  17. Ungár, T.; Borbély, A. The effect of dislocation contrast on X-ray line broadening: A new approach to line profile analysis. Appl. Phys. Lett. 1996, 69, 3173–3175. [Google Scholar] [CrossRef]
  18. Ungár, T.; Dragomir, I.; Révész, Á.; Borbély, A. The contrast factors of dislocations in cubic crystals: The dislocation model of strain anisotropy in practice. J. Appl. Crystallogr. 1999, 32, 992–1002. [Google Scholar] [CrossRef]
  19. Ungár, T.; Tichy, G. The Effect of Dislocation Contrast on X-Ray Line Profiles in Untextured Polycrystals. Phys. Status Solidi A 1999, 171, 425–434. [Google Scholar] [CrossRef]
  20. Ustinov, A.I.; Polishchuk, S.S.; Demchenkov, S.A.; Petrushinets, L.V. Effect of microstructure of vacuum-deposited Fe100-xNix (30 < x < 39) foils with FCC structure on their mechanical properties. J. Alloys Compd. 2015, 622, 54–61. [Google Scholar]
  21. Adams, J.J.; Agosta, D.S.; Leisure, R.G.; Ledbetter, H.M. Elastic constants of monocrystal iron from 3 to 500 K. J. Appl. Phys. 2006, 100, 113530. [Google Scholar] [CrossRef]
  22. Razumovskiy, I.V.; Hahn, C.; Lukas, M.; Romaner, L. Ab Initio Study of Elastic and Mechanical Properties in FeCrMn Alloys. Materials 2019, 12, 1129. [Google Scholar] [CrossRef] [Green Version]
  23. Available online: http://metal.elte.hu/anizc/ (accessed on 22 August 2022).
  24. Rebuffi, L.; Troian, A.; Ciancio, R.; Carlino, E.; Amimi, A.; Leonardi, A.; Scardi, P. On the reliability of powder diffraction Line Profile Analysis of plastically deformed nanocrystalline systems. Sci. Rep. 2016, 6, 20712. [Google Scholar] [CrossRef] [PubMed]
  25. Langford, J.I.; Louër, D.; Scardi, P. Effect of a crystallite size distribution on X-ray diffraction line profiles and whole-powder-pattern fitting. J. Appl. Crystallogr. 2000, 33, 964–974. [Google Scholar] [CrossRef]
  26. Wilkens, M. The Determination of Density and Distribution of Dislocations in Deformed Single Crystals from Broadened X-ray Diffraction Profiles. Phys. Stat. Sol. 1970, 2, 359–370. [Google Scholar] [CrossRef]
  27. Scardi, P.; Leoni, M. In Diffraction Analysis of the Microstructure of Materials; Mittemeijer, E.J., Scardi, P., Eds.; Springer: New York, NY, USA, 2004; pp. 51–91. ISBN 978-3-642-07352-6. [Google Scholar]
  28. Scardi, P.; Leoni, M. Whole powder pattern modelling. Acta Crystallogr. A 2002, 58, 190–200. [Google Scholar] [CrossRef]
  29. Leoni, M.; Scardi, P. Nanocrystalline domain size distributions from powder diffraction data. J. Appl. Cryst. 2004, 37, 629–634. [Google Scholar] [CrossRef]
  30. Ribárik, G.; Jóni, B.; Ungár, T. The Convolutional Multiple Whole Profile (CMWP) Fitting Method, a Global Optimization Procedure for Microstructure Determination. Crystals 2020, 10, 623. [Google Scholar] [CrossRef]
  31. Leoni, M.; Confente, T.; Scardi, P. PM2K: A flexible program implementing Whole Powder Pattern Modelling. Z. Krist. Suppl. 2006, 23, 249–254. [Google Scholar] [CrossRef]
  32. Suryanarayana, C. Mechanical alloying and milling. Prog. Mater. Sci. 2001, 46, 1–184. [Google Scholar] [CrossRef]
  33. Cisneros, M.M.; Valdes, E.; Vazquez, D.; Lopez, H.F.; Mancha, H.; Mendoza, G.; Mendez, M. Development of austenitic nanostructures in High-nitrogen steel powders processed by mechanical alloying. Metall. Mater. Trans. A 2002, 33, 2139–2144. [Google Scholar] [CrossRef]
  34. Duan, C.; Chen, C.; Zhang, J.; Shen, Y.; Feng, X. Nitriding of Fe-18Cr-8Mn stainless steel powders by mechanical alloying method with dual nitrogen source. Powder Technol. 2016, 294, 330–337. [Google Scholar] [CrossRef]
  35. Eliades, T.; Pratsinis, H.; Kletsas, D.; Eliades, G.; Makou, M. Characterization and cytotoxicity of ions released from stainless steel and nickel-titanium orthodontic alloys. Am. J. Orthod. Dentofac. Orthop. 2004, 125, 24–29. [Google Scholar] [CrossRef]
  36. Salahinejad, E.; Amini, R.; Hadianfard, M.J. Structural evolution during mechanical alloying of stainless steels under nitrogen. Powder Technol. 2012, 215, 247–253. [Google Scholar] [CrossRef]
  37. Ahmed, A.; Ghali, S.; Eissa, M.; El Badry, S. Influence of Partial Replacement of Nickel by Nitrogen on Microstructure and Mechanical Properties of Austenitic Stainless Steel. J. Metall. 2011, 2011, 639283. [Google Scholar] [CrossRef]
  38. Borbély, A. The modified Williamson-Hall plot and dislocation density evaluation from diffraction peaks. Scr. Mater. 2022, 217, 114768. [Google Scholar] [CrossRef]
  39. Kumari, S.; Singh, D.K.; Giri, P.K. Strain Anisotropy in Freestanding Germanium Nanoparticles Synthesized by Ball Milling. J. Nanosci. Nanotechnol. 2009, 9, 5231–5236. [Google Scholar] [CrossRef]
  40. Swygenhoven, H.; Weertman, J.R. Grain boundaries and dislocations. Science 2002, 296, 66–67. [Google Scholar] [CrossRef]
  41. Seelam, U.M.R.; Suryanarayana, C. Mechanically induced fcc phase formation in nanocrystalline hafnium. J. Appl. Phys. 2009, 105, 063524. [Google Scholar] [CrossRef]
  42. Loudjani, N.; Benchiheub, M.; Bououdina, M. Structural, Thermal and Magnetic Properties of Nanocrystalline Co80Ni20 Alloy Prepared by Mechanical Alloying. J. Supercond. Nov. Magn. 2016, 29, 2717–2726. [Google Scholar] [CrossRef]
  43. Mhadhbi, M.; Khitouni, M.; Escoda, L.; Suñol, J.J.; Dammak, M. Characterization of Mechanically Alloyed Nanocrystalline Fe(Al): Crystallite Size and Dislocation Density. J. Nanomater. 2010, 2010, 712407. [Google Scholar] [CrossRef]
  44. Nazarov, A.A.; Romanov, A.E.; Valiev, R.Z. Disclination ensembles in ultrafine-grained materials produced by severe plastic deformation. Scr. Mater. 1996, 34, 729–734. [Google Scholar] [CrossRef]
  45. Rawers, J.; Cook, D. Influence of attrition milling on nano-grain boundaries. Nanostruct. Mater. 1999, 11, 331–342. [Google Scholar] [CrossRef]
  46. Seif, D.; Po, G.; Mrovec, M.; Lazar, M.; Elsässer, C.; Gumbsch, P. Atomistically enabled nonsingular anisotropic elastic representation of near-core dislocation stress fields in α-iron. Phy. Rev. B 2015, 91, 184102. [Google Scholar] [CrossRef]
  47. Leonardi, A.; Scardi, P. Dislocation effects on the diffraction line profiles from nanocrystalline domains. Metall. Mater. Trans. A 2016, 47, 5722–5732. [Google Scholar] [CrossRef] [Green Version]
Figure 1. Example SEM image of a particle surface area for the SEM-EDS analysis.
Crystals 12 01233 g001
Figure 2. The average value of anisotropic contrast factor C ¯ versus the scattering vector s calculated for bcc and fcc microstructures of the Fe-18Cr-18Mn alloy, considering pure edge and pure screw dislocation characters.
Crystals 12 01233 g002
Figure 3. Morphology of the elemental powders: (a) Fe, (b), Cr and (c) Mn, and mechanically alloyed powder at different milling times, after: (d) 30 h, (e) 60 h, (f) 90 h, (g) 120 h, (h) 150 h.
Crystals 12 01233 g003aCrystals 12 01233 g003b
Figure 4. The particle size and microhardness of powders at different milling times.
Crystals 12 01233 g004
Figure 5. Microstructural evolution of Fe-18Cr-18Mn alloy: (a) overall comparison of XRD patterns after a certain MA time, (b) insight showing the vanishing of Fe-bcc peaks, (c) comparison of initial and after 5 h of MA patterns with emphasis on Mn-bcc reflections, (d) changes of the shape and intensity of most prominent Fe-bcc [110] and Fe-fcc [111] reflections during the MA course.
Crystals 12 01233 g005
Figure 6. Phase percentage of Fe-fcc.
Crystals 12 01233 g006
Figure 7. The principal result of the MWH analysis: (a) determination of experimental q values, (b) FWHM values plotted according to the MWH procedure, (c) evolution of crystallite size and MWH slope, (d) fraction of edge dislocations during MA.
Crystals 12 01233 g007
Figure 8. WPPM-refined experimental patterns gathered after: (a) 5 h of MA, (b) 30 h of MA, (c) 60 h of MA, (d) 150 h of MA. Legend: hollow dot—experimental data, red line—WPPM model, orange line—Mn-bcc phase, blue line—Fe-bcc phase, green line—Fe-fcc phase, black line—residual.
Crystals 12 01233 g008
Figure 9. Basic microstructural data derived from WPPM refinement in terms of the progression of following the parameters during MA: (a) lattice parameter, (b) lognormal domain size, (c) lognormal standard deviation, (d) dislocation density. Error bars correspond to the estimated standard deviation of the WPPM fit.
Crystals 12 01233 g009aCrystals 12 01233 g009b
Figure 10. Lognormal domain size distributions of crystalline domains: (a) up to 30 h of MA, (b) after 30 h of MA, in terms of probability density function (PDF).
Crystals 12 01233 g010
Figure 11. Relationship between dislocation density ρ and powder microhardness H V . Dashed line is the linear fit of the data.
Crystals 12 01233 g011
Figure 12. Trend of the Wilkens parameter M in the function of milling time.
Crystals 12 01233 g012
Table 1. Elastic parameters required to implement the strain anisotropy model.
ParameterFe, bccFe-18Cr-18Mn, fcc
c 11 230219
c 12 134153
c 44 116152
A i 2.4174.606
C ¯ h 00 e 0.4038340.333565
C ¯ h 00 s 0.3613530.357697
q e 0.7211.821
q s 2.5972.561
Table 2. SEM-EDS analysis of the iron, chromium, and manganese concentrations in the MA powders at different milling times.
Milling Time (h)Element Composition (wt. %)
FeCrMnNC
3072.04 ± 3.4612.28 ± 1.2515.67 ± 0.890.12 ± 0.030.01 ± 0.01
6067.08 ± 2.3216.18 ± 0.8616.74 ± 1.580.28 ± 0.050.015 ± 0.006
9064.21 ± 3.8617.86 ± 0.9817.93 ± 2.030.35 ± 0.010.016 ± 0.003
12064.33 ± 1.0217.66 ± 1.5318.01 ± 0.990.68 ± 0.080.023 ± 0.007
15064.22 ± 2.2917.92 ± 1.3717.86 ± 1.240.93 ± 0.090.029 ± 0.002
Publisher’s Note: MDPI stays neutral with regard to jurisdictional claims in published maps and institutional affiliations.

