Article

Jedi Spinel from Man Sin, Myanmar: Color, Inclusion, and Chemical Features

1
Guild Gem Laboratories, Shenzhen 518020, China
2
School of Gemology, China University of Geosciences, Beijing 100183, China
3
National Gemstone Testing Center (NGTC) Shenzhen Lab., Shenzhen 518020, China
4
Shenzhen Zhiai Jewelry Co., Ltd., Shenzhen 518020, China
*
Authors to whom correspondence should be addressed.
Crystals 2023, 13(1), 103; https://doi.org/10.3390/cryst13010103
Submission received: 6 December 2022 / Revised: 23 December 2022 / Accepted: 26 December 2022 / Published: 5 January 2023
(This article belongs to the Special Issue Mineralogical Crystallography (3rd Edition))

Abstract

:
In the present study, we collected and investigated spinels from the Man Sin deposit in Myanmar using standard gemological testing, microscopic observation, EDXRF, and Raman spectrometry. The color observation was performed under various lighting conditions to show color differences. A very high Cr/Fe ratio is linked with exceptionally strong red fluorescence. Microscopic observation and Raman spectroscopy identified mineral inclusions of colorless phlogopite, molybdenite, hauerite, native sulfur, and calcite. Man Sin spinels are typical Fe– and Zn–poor spinels. Binary and ternary diagrams were used to discriminate each deposit (i.e., Man Sin, Mogok, and Namya in Myanmar) with high reliability. Jedi spinel fever in the Asian market, due to their unique neon color appearance and exceptionally strong fluorescence, is also discussed.

1. Introduction

Spinel is an oxide mineral, and gem–quality ones come in various colors. Jedi spinels refer to vivid pink to red spinels with strong fluorescence owing to trace element combinations. The vibrant brilliance and distinct neon color appearance distinguish them from other pink to red spinels.
The nomenclature of “Jedi” spinels originates from a previous article by Pardieu [1], which gave rise to the rising popularity of spinels among gem dealers and collectors in the trade. Compared with the usual pink to red spinels, Jedi spinels usually exhibit beautiful colors with a bright tone and intense saturation. Most importantly, the strong red color and fluorescence give the stone a unique neon color, distinguishing it from any rivals. A study has been published on the color of Jedi spinel recently [1,2,3]. This study focuses on Man Sin spinels from the aspects of color, inclusions, and trace elements with the aim of decoding the mysterious color of Jedi spinels. The current Chinese market is also introduced in this article.
Gem–quality spinels are recovered from various geological settings, such as Mogok (Myanmar), Kuh–i–Lal (Tajikistan), and Luc Yen (Vietnam) along the Himalaya mountain belt, Sri Lanka, Madagascar, and Tanzania in eastern Africa [4,5,6,7,8]. Myanmar lies at the corner of the Indian ocean. Gemstones found in Myanmar were formed after the Himalayan orogeny created by the collision between the Indian and Eurasian plates [9]. The Mogok metamorphic belt extends for more than 1500 km, dividing Myanmar into its western and eastern parts [10,11]. Spinels are mined from primary and secondary deposits such as alluvial and eluvial placers, karstic sinkholes, and caverns [3].
In this article, we focus on the producing areas of spinel rather than the individual mines in Myanmar. We use the Mogok area, designating mines located in Mogok, except for the Man Sin area. At the same time, Namya and Man Sin refer to mines located in Namya and Man Sin, respectively (Figure 1). The historical area of Mogok valley in Myanmar has been producing high–quality gemstones, including rubies, sapphires, and spinels. Another important but less productive Namya area is located in the north [12,13,14]. Namya spinels were recovered from the secondary deposit, showing a rounded appearance. Another mining area in Man Sin near Mogok town [1] has produced bright pink spinels, which were appreciated as “Jedi spinel” in the trade due to their vibrant visual appearance. Since then, Burmese materials have become much more popular in the Asian market due to their attractive bright colors and relatively stable supply. Some other mines operated around Mogok producing spinels of various fancy colors, such as metallic grey, violet, purple, and orange.

2. Mining and Production

Spinels can be found in primary and secondary deposits, mainly in the north of Myanmar (Namya) and central Myanmar (Mogok), including the Man Sin deposit. A deal is usually negotiated on a small table among the buyers and sellers in the Mogok local market. Most mining activities take place by independent miners, mainly working in the field, using the traditional way to find precious gems. Local cutters are also active in cutting and polishing, using cutting machines pumped by electricity.
Since 2015, the author Wei has visited Myanmar five to six times per year until the end of 2019 and witnessed the changes in the market and the mine. The cost of the hotel, traffic, and local labor has increased, as well as the mining cost. The senior global buyers compete fiercely for top quality material. Consequently, they drive the price of spinels to a higher level. In 2020, mining activity became less active due to COVID–19. At the beginning of 2021, the unstable political event dramatically impacted the mine, casting more uncertainty on the gem mining industry. Major production was suspended temporarily. Fewer stones are coming to the Chinese market. Spinels in various colors can be found in Myanmar, among which the pink to red ones are sought after by dealers from all over the world. Red color spinels with high saturation and medium to low tone mainly come from Mogok. In contrast, the Man Sin materials in this study show a brighter tone and neon pink color, distinguishing them from the classic Mogok red spinels. Namya material typically exhibits rounded crystals with a neon pink to red color.

3. Materials and Methods

3.1. Materials

As shown in Table 1, in this study, sets No.1 and 2 refer to samples from the Man Sin area, whereas sets No. 3–4 from other mining areas were used for comparison. A total of 78 pieces of spinel from the Man Sin area have been investigated using a series of methods, including standard gemological testing, microscopic observation, energy–dispersive X–ray fluorescence (EDXRF), and Raman spectrometry. The author Wei has built a close connection with many important local dealers, including Mr. U Ko James, also known as “Spinel king.” Several parcels of 55 samples in total were collected by one of the authors, Wei, in the Mogok market from Mr. U Ko James during his trip in December 2019, as shown in Figure 2 and Figure 3. The 55 samples are grouped as the No.1 set in this study. A parcel of 23 samples (No. 2 set) was kindly provided by a gem dealer Mr. Yulan Zhuang, who frequently visited Man Sin and Mogok markets. He acquired these samples from one Man Sin mine owner Mr. U Kyaw Thu in June 2018. Sets 3–4 were acquired by author Wei from a local dealer in Mogok during his trip in December 2019.
All the samples (Figure 4) have been studied using standard gemology, and advanced tests were performed optionally. As shown in Table 1, among the No. 1 set samples, 55 have gone through standard gemology such as R.I. and specific gravity tests. After microscopic observation, 23 samples with distinct inclusions were micro–photographed and underwent a further Raman test. EDXRF tested 23 samples; however, some of the data was flawed by the sample holder owing to the relatively small size of the samples. The EDXRF equipment supplier built the RoHS + Bigspot method for calibration using various standards, including G.S.R. 2, 3, 4, 7; G.S.S. 5, 6; GnA; GXR–3; GSD–12; SARM–20; SY–3; FLXPVC–2; HB 1000; and Elo1–11. As lab gemologists, the authors also brought up some typical samples from the daily testing sample for comparison. The details of the comparison samples are listed in Table 2. These samples were selected to show the gemological difference, such as color and fluorescence. We selected representative stones to show the difference between Jedi and non–Jedi stones. For example, we tested hundreds of stones using EDXRF to find four stones with a similar level of Cr and different levels of Fe to discuss the impact of Fe and Cr on the color of spinels, as seen in the discussion part.

3.2. Methods

3.2.1. Standard Gemology

A refractometer with a near–sodium equivalent light source was used to measure refractive indices (R.I.). Fluorescence was observed in a dark room under 365 nm long–wave and 254 nm short–wave UV lights. Inclusions were studied using an 80× magnification gemological microscope with Leica optics, equipped with different lighting sources. The color observation was performed under a lightbox equipped with multiple lights of color temperatures ranging from 2700, 5000, 6500, and 7500 K. All the lights were LEDs except for the 2700 k light, which was an incandescent bulb.

3.2.2. Trace Element Analysis

The chemical composition analyses were performed on a Spectro Midex type energy dispersive X–ray fluorescence (EDXRF, Spectro, Kleve, Germany) equipped with calculating software X–LabPro 5, using a Ta target with a spot size of 2 mm. The machine was calibrated by M.C.A. (multi–channel analysis, Spectro, Kleve, German) using reference material supplied by the equipment supplier. The reference material is prepared with chemical reagents with a concentration weight of 15% Na2O, 40% SiO2, 30% CaO, 4% V2O5, 3% Fe2O3, 4% As2O3, and 4% MoO. The standard testing method is called RoHS + Bigspot, which is also initially provided by the equipment supplier. We developed a modified RoHS + Bigspot method for better application in gemstone detection, using natural and synthetic gemstones, including corundum, spinel, and beryl. These gemstone samples were carefully selected for a collection of elements with different concentration gradients. They were quantified using laser ablation inductively coupled plasma mass spectrometry (LA–ICP–MS, Agilent, Santa Clara, CA, USA) equipped with a 193 nm ArF Excimer laser ablation system (GeoLasPro, Agilent, Santa Clara, CA, USA) coupled to an Agilent 7700 ICP–MS (Agilent, Santa Clara, CA, USA) at the sample solution laboratory in Wuhan, China. Details of the machine and method can be found in the previous literature [15,16,17]. The modified RoHS + Bigspot method was used at an acceleration voltage of 19 kV and a beam current of 0.30 mA for Al, Si, K, and Ca, whereas it was 48 kV and 0.60 mA for elements Ti, V, Cr, and Fe. Each sample was tested for 2–3 points for accuracy.

3.2.3. Inclusion Analysis

Raman Microspectroscopy was performed using Renishaw via the Raman system on the inclusions in several samples in National Gemstone Testing Center (NGTC) Shenzhen Lab, China. The Raman spectra were primarily collected in the range of 1500–100 cm−1 using a direct diode laser at 785 nm, with a scanning time of 10–15 s, and 5–10 scan accumulations were recorded. We use the online RRUFF Database of Raman spectroscopy as a reference to identify the inclusions.

4. Results

4.1. Gemological Properties

In this study, Jedi spinel samples from Man Sin showed a vivid pink to red color with a distinct neon visual appearance, distinguishing them from other red spinels from other localities in Myanmar. The typical refractive index measurements for Jedi spinels are 1.718 and isotropic, and the specific gravity averages 3.60. All of these properties are consistent with gem spinels from other origins (Table 2).

4.2. Crystal Habit and Morphology

With a chemical formula of MgAl2O4, spinel belongs to the cubic crystal system, usually exhibiting an octahedral crystal habit. In this study, the rough samples from set No. 2 showed a near–perfect octahedral shape with a well–crystallized and smooth surface (111), as shown in Figure 5. Both the protrusions and etch were observed on the octahedral crystals’ surfaces, most of which are triangular. Whereas the protrusions are parallel to the octahedral face (111), these etches are opposite (Figure 6).

4.3. Color

Spinel bears a wide range of colors, with the main transition metal cations (Fe2+, Co2+, Cu2+, Fe3+, Cr3+, and V3+) that determine the colors [18]. Generally, the Jedi spinel in this study showed a pink to red color with a moderate to bright tone; no distinct secondary hue was observed, and it owes its color mainly to the presence of V3+ and Cr3+ [18]. The stones showed uniform color, and we found no color banding or patch. Based on the Munsell color theory, three parameters are under consideration when studying spinel color, i.e., hue, saturation, and tone. Lighting conditions and fluorescence are also critical.
To study the influence of light sources on spinel color, we have observed samples in a lightbox lighting condition with different color temperatures of 2700, 5000, 6500, and 7500 K, and a long–wave UV light (365 nm), as shown in Figure 7. Three samples were selected to be observed under the various light conditions mentioned above. Natural sunlight outside the lab (22°38′17.54″ N, 114°05′52.35″ E, around 2 pm, on a sunny day) was also considered as spinels are usually traded under sunlight.
As shown in Figure 8, all of the samples exhibit warm colors with a slight tint of orange under low–temperature light, and they become more purplish as the color temperature of the light source increases up to 7500 K. A distinct color shift was observed between 5000 and 6500 K, where the orangy pink changed to pink with subtle purple. The color exhibited under sunlight seems to fall into the range between 5000 and 6500 K.

4.4. Fluorescence

Fluorescence is a variety of luminescence. For years, people have been fascinated by the neon appearance of Jedi spinels. When irradiated by a UV light, the spinel displays visible light owing to the Cr3+ ion in the spinel [19,20,21,22,23]. In contrast, Fe may restrain fluorescence by giving out the energy in a thermal way. Thus, the fluorescence we observe with the naked eye is influenced by both Cr and Fe, with Fe quenching the fluorescence due to Cr. Both rough and faceted Man Sin spinels in this study show neon pink to red color under daylight, and they exhibit exceptionally strong fluorescence under long–wave UV light, as shown in Figure 9 and Figure 10.

4.5. Inclusions and Micro–Raman Results

Previous studies have shown the existence of several inclusions in spinels from Myanmar, such as molybdenite, pyrrhotite, marcasite, sulfur, phlogopite, and calcite [3]. Microscopic observations revealed several mineral inclusions in this study, including near–colorless transparent crystals, opaque minerals showing strong metallic luster, and yellow sulfur. Then, we conducted Raman tests to confirm their identities. All the inclusions were observed in the samples from set No.1 unless specified. The mineral inclusions discovered in this study and in the Burmese spinel in the previous study are listed in Table 3.

4.5.1. Phlogopite

Phlogopite, belonging to the mica group, is a silicate mineral that usually exhibits a six–sided platy and tabular crystal habit. In this study, phlogopite is commonly seen in Man Sin spinel and is usually a euhedral hexagonal and subhedral shape (Figure 11a,b). Distinct interference color was observed under the cross–polarizers (Figure 11c,d). No alteration of phlogopite by the formation of the spinel host was observed. A further Raman test confirmed these crystals as phlogopite with distinct peaks at 197, 277, 681, and 1024 cm−1 (Figure 11e).

4.5.2. Molybdenite

Molybdenite is a sulfide mineral composited of molybdenum and sulfur, with a chemical formula of MoS2. It was observed in Man Sin spinel samples in a well–formed hexagonal platy shape accompanied by phlogopite, showing metallic luster under reflected light (Figure 12a). Further Raman test results of the opaque platy crystals showed prominent peaks at 382, 408, and 453 cm−1, along with a series of small peaks between 500 and 900 cm−1 (Figure 12b). Such a pattern agrees with molybdenite, according to RRUFF. Additionally, a distinct growth step–like pattern was observed; there may be a particular crystalline relation between molybdenite and the spinel host, i.e., the (0001) face of molybdenite is parallel to the (111) face of spinel. Although this phenomenon has not been proved and reported yet, it appears reasonable as the six–fold axis of molybdenite and the three–fold axis of the spinel host are in the same direction. We have encountered six well–formed rough spinels in both sets No. 1 and 2, showing such phenomena if the platy molybdenite is present. Further work needs to be carried out to prove this hypothesis.

4.5.3. Sulfur

Yellow freeform sulfur is the most encountered inclusion in this study, and such inclusions are very diagnostic for the spinel from Man Sin, which agrees with Peretti et al. (2017) and Phyo et al. (2019) [2,3]. As shown in Figure 13c, two distinct peaks at 219 and 474 cm−1, accompanied by three small peaks at 193, 243, and 442 cm−1, were detected by Raman, consistent with sulfur based on the RRUFF reference spectrum. Sulfur is generally distributed in two ways. First, the sulfur can be trapped in individual restricted spaces, forming a closed chamber (Figure 13a). Several sulfide minerals have been identified in this study with these sulfur chambers, including hauerite and stibnite. Alternatively, it also fills the fissures around some minerals, as shown in Figure 13b. The abundance of sulfur trapped in spinels could provide clues for the formation of Man Sin spinels, and spinels with such inclusions are highly possible from Man Sin, if not diagnostic.

4.5.4. Stibnite

Stibnite is another sulfide composed of antimony (Sb) and sulfur (S), with a formula of Sb2S3. A prismatic dark mineral was encountered within the sulfur chamber (Figure 14a); the Raman spectroscopy showed several prominent peaks identified as sulfur and the spinel host. This dark mineral’s main peaks were 242 and 450 cm−1, which is consistent with stibnite from RRUFF (Figure 14b). Unlike molybdenite, stibnite is in a crumb–like condition, suggesting that it may have been altered during spinel formation. To the best of our knowledge, this is the first report of stibnite in spinel from Man Sin.

4.5.5. Hauerite

Hauerite is a manganese sulfide mineral consisting of manganese and sulfur with the mineral formula of MnS2. It did not show the exact crystal form and seemed to be an altered relic staying within the sulfur chamber, retaining the octahedral crystal shape in Figure 15a. Apart from the spectral matches with the RRUFF database, spectra with bands at 488, 245, and 228 cm−1, with a fragile feature at 171 and 161 cm−1, showed a close match to the spectra (Figure 15b).

4.5.6. Calcite

It was not surprising to find abundant calcite (Figure 16a) in these investigated samples. Colorless rounded calcite crystals exhibit interference color under cross–polarized light, as shown in Figure 16b. Figure 16c reveals several colorless rounded calcite crystals detected and identified using Raman, showing distinct peaks at 154, 281, and 1087 cm−1.

4.5.7. Unidentified Dark Crystal Surrounded by “Halo”

Some dark crystals were also observed, and they were usually surrounded by a discoidal fracture, also referred to as a halo (Figure 17). However, Raman did not identify it, probably because of the crystal’s depth and tiny size. Similar inclusions, i.e., dark crystals surrounded by a halo, have been reported in many different gems, such as sapphires and diamonds, owing to the decrepitation of radioactive inclusion, i.e., zircon. Although no radioactive inclusion has been reported yet in spinels, the dark crystal could be radioactive such as thorianite or uraninite. Further work needs to be carried out to identify it.

4.6. Chemistry

The chemical compositions of spinel from Myanmar were investigated using energy–dispersive X–ray spectroscopy (EDXRF). In Table 4, selected EDXRF data are expressed in ppm. Binary and ternary diagrams were used to discriminate each origin. The variation in the chemistry from various deposits and occurrences allows geographic traceability. Cr, V, Fe, and Zn were commonly present in the highest concentrations and were highly variable. In contrast, other investigated elements (i.e., Ti, Mn, and Ga) were generally low, with some even below the detection limit. In addition, the representative data of pink Man Sin spinel from Guiliani [30] was also shown.
Myanmar spinels, mainly from the Man Sin deposit, are typical Fe– and Zn–poor spinels. Man Sin spinels show the lowest Fe and Zn contents from a few up to less than 500 ppm, which is similar to the chemical profile shown by Guiliani [30,31]. The Fe and Zn contents of Mogok spinels are the highest among the Myanmar spinels. The ternary diagram (Figure 18) shows the Cr + V, Fe, and Zn content distribution, confirming Myanmar spinel samples’ clustering around the Cr + V (mainly Cr) corner.
The Zn–V vs. Cr–Fe diagram (Figure 19) shows that the chemical field of spinels from Myanmar plots in the Fe < Cr box, and deposits in Myanmar presented a slight overlap with each other, which is the same as the analysis by Giuliani [30,31]. Man Sin spinel sits in the Zn < V box with the highest Cr/Fe ratio from 16.40 to 45.68 and a Cr/V ratio higher than 8 (n = 23), whereas Mogok spinel plots in the Zn > V box with a relatively low Cr/Fe ratio from 1.03 to 6.06 and a Cr/V ratio lower than 13 (n = 24). Namya spinels are distributed along the horizontal axis.

5. Discussion

5.1. Inclusions and Formation of Spinel

The combination of the inclusions above can be instrumental in studying the geological formation of spinel. Before the formation, phlogopite and calcite already existed in the ambient environment. Spinels were formed within a fluid system rich in sulfur. The spinel starts to crystallize first and consumes the Al, Mg, O, and Cr quickly whenever molybdenite forms.
It seems that there may exist some crystalline relation between molybdenite and the spinel host, i.e., the (0001) face of molybdenite is parallel to the (111) face of the spinel. Molybdenite is composed of MoS2, whereas S is also present with the spinel structure as an ion. Hypothetically, Mo may exist in the system during spinel, and molybdenite formation crystallizes as a syngenetic inclusion with spinel. Although these phenomena have not been reported yet, it appears reasonable as the six–fold axis of molybdenite and the three–fold axis are in the same direction. We will look for further evidence in the future.
Previous studies have shown that sulfur cannot only enter the crystalline structure of spinels [32,33], but it can also replace the oxygen atoms and play a very important role in the framework of the spinel structure. According to the CNMNC, Commission on New Minerals, Nomenclature and Classification of the International Mineralogical Association, all 56 valid species of spinel group minerals can be classified into three groups based on their anion (O, S, or Te): oxyspinel, thiospinel, and selenospinel, among which the thiospinel group is the S dominant anion, giving a general formula of ABS4, where A and B represent cation elements, such as Fe and Cu et al.
It is observed that platy molybdenite is parallel to the octahedral face, suggesting they are possibly oriented following the crystalline structure of spinels. Further work is needed to find more proof. Afterward, the system becomes sulfur–oversaturated, and S starts to combine with Sb, Mo, and Mn and crystallize as other sulfides, with Sb for stibnite, Mo for molybdenite, and Mn for hauerite. The remaining sulfur forms as native sulfur eventually. As S can enter the spinel structure, it is highly possible that a trace of S has entered the spinel host; further work may be needed on this matter. The presence of sulfur and several sulfide minerals is a good indicator of the S–rich environment during the formation of Man Sin spinels.
One advantage of studying well–formed spinel crystals is that we can do more work on the crystalline orientation and further study the inclusion and host relation from a crystallography perspective. It will be challenging to determine the crystalline direction in a cut spinel.

5.2. Color and Fluorescence

To further discuss the impact of trace elements on color and fluorescence behavior, we have selected four samples to show the difference mainly based on their Fe and Cr content. The No. 1 and 2 samples are from Mogok, and they show a typical red color, medium to high saturation, and medium to dark tone. The No. 3 and 4 samples are from Man Sin and Namya, respectively, exhibiting a neon pink to red color with a bright tone, as shown in Figure 20. The Cr/Fe ratio of these samples is illustrated in Table 4 and Figure 21. The chemical composition is shown in Table 5.
It is essential to point out that what we perceive when observing the spinel with the naked eye is the combination of body color and fluorescence. According to the strength of the red fluorescence of the spinel under long–wave UV light, we have drawn an illustration to demonstrate the difference. As shown in Figure 22, spinels exhibit red fluorescence of continuous gradients varying from left to right: exceptionally strong, very strong, medium, and weak. The spinel’s body color is caused by the selective absorption of visible light by the spinel, whereas the fluorescence color is stimulated by the UV component of the light source. Owing to Jedi spinel’s exceptionally strong fluorescence, they exhibit an extraordinary visual appearance which distinguishes them from other pink–red color spinels. Hence, it is vital to consider the fluorescence and bodycolor when evaluating a spinel.

6. Jedi Spinel Fever in the Asian Market

Spinels have been considered as substitution gems for rubies for centuries due to their similar color and visual appearances; however, these Jedi spinels distinguish themselves from other classic red ones by their unique neon visual appearance and exceptional fluorescence.
Jedi spinels have become more popular than in the past, and they are coveted by collectors and connoisseurs, especially the young generation in the Asian market, such as in China. Several factors possibly contribute to the rise of Jedi spinel. According to Baidu.com, the biggest online search engine in China, the search index on spinel has more than doubled in the past ten years. The index was around 191 on 1st January 2011, which increased to 533 on 31st December 2020 approximately, increasing by 179%. The search index ranking by city indicates high demand for spinel, with Beijing, Shanghai, and Guangzhou being the top 3, as illustrated in Figure 23 [34]. Quantity of spinel submitted to Guild Gem Laboratories, Shenzhen, China, from the first quarter of 2017 to the second quarter of 2021 in Figure 24 [35].
First of all, before the discovery and large production of high–quality neon Jedi spinel, the traditional red color spinels from Mogok were similar in color to rubies. When people go for a red gem, ruby will be the first choice, and red spinel is regarded as a substitute. However, the intense neon color sets this material apart in the marketplace. Such uniqueness gives it an edge to circulate in the market and quickly get accepted.
Secondly, spinel possesses a Mohs hardness of 8 and lacks distinct cleavage, making it durable enough for daily wearing. Most of the time, spinel does not need to be treated to modify the color.

7. Conclusions

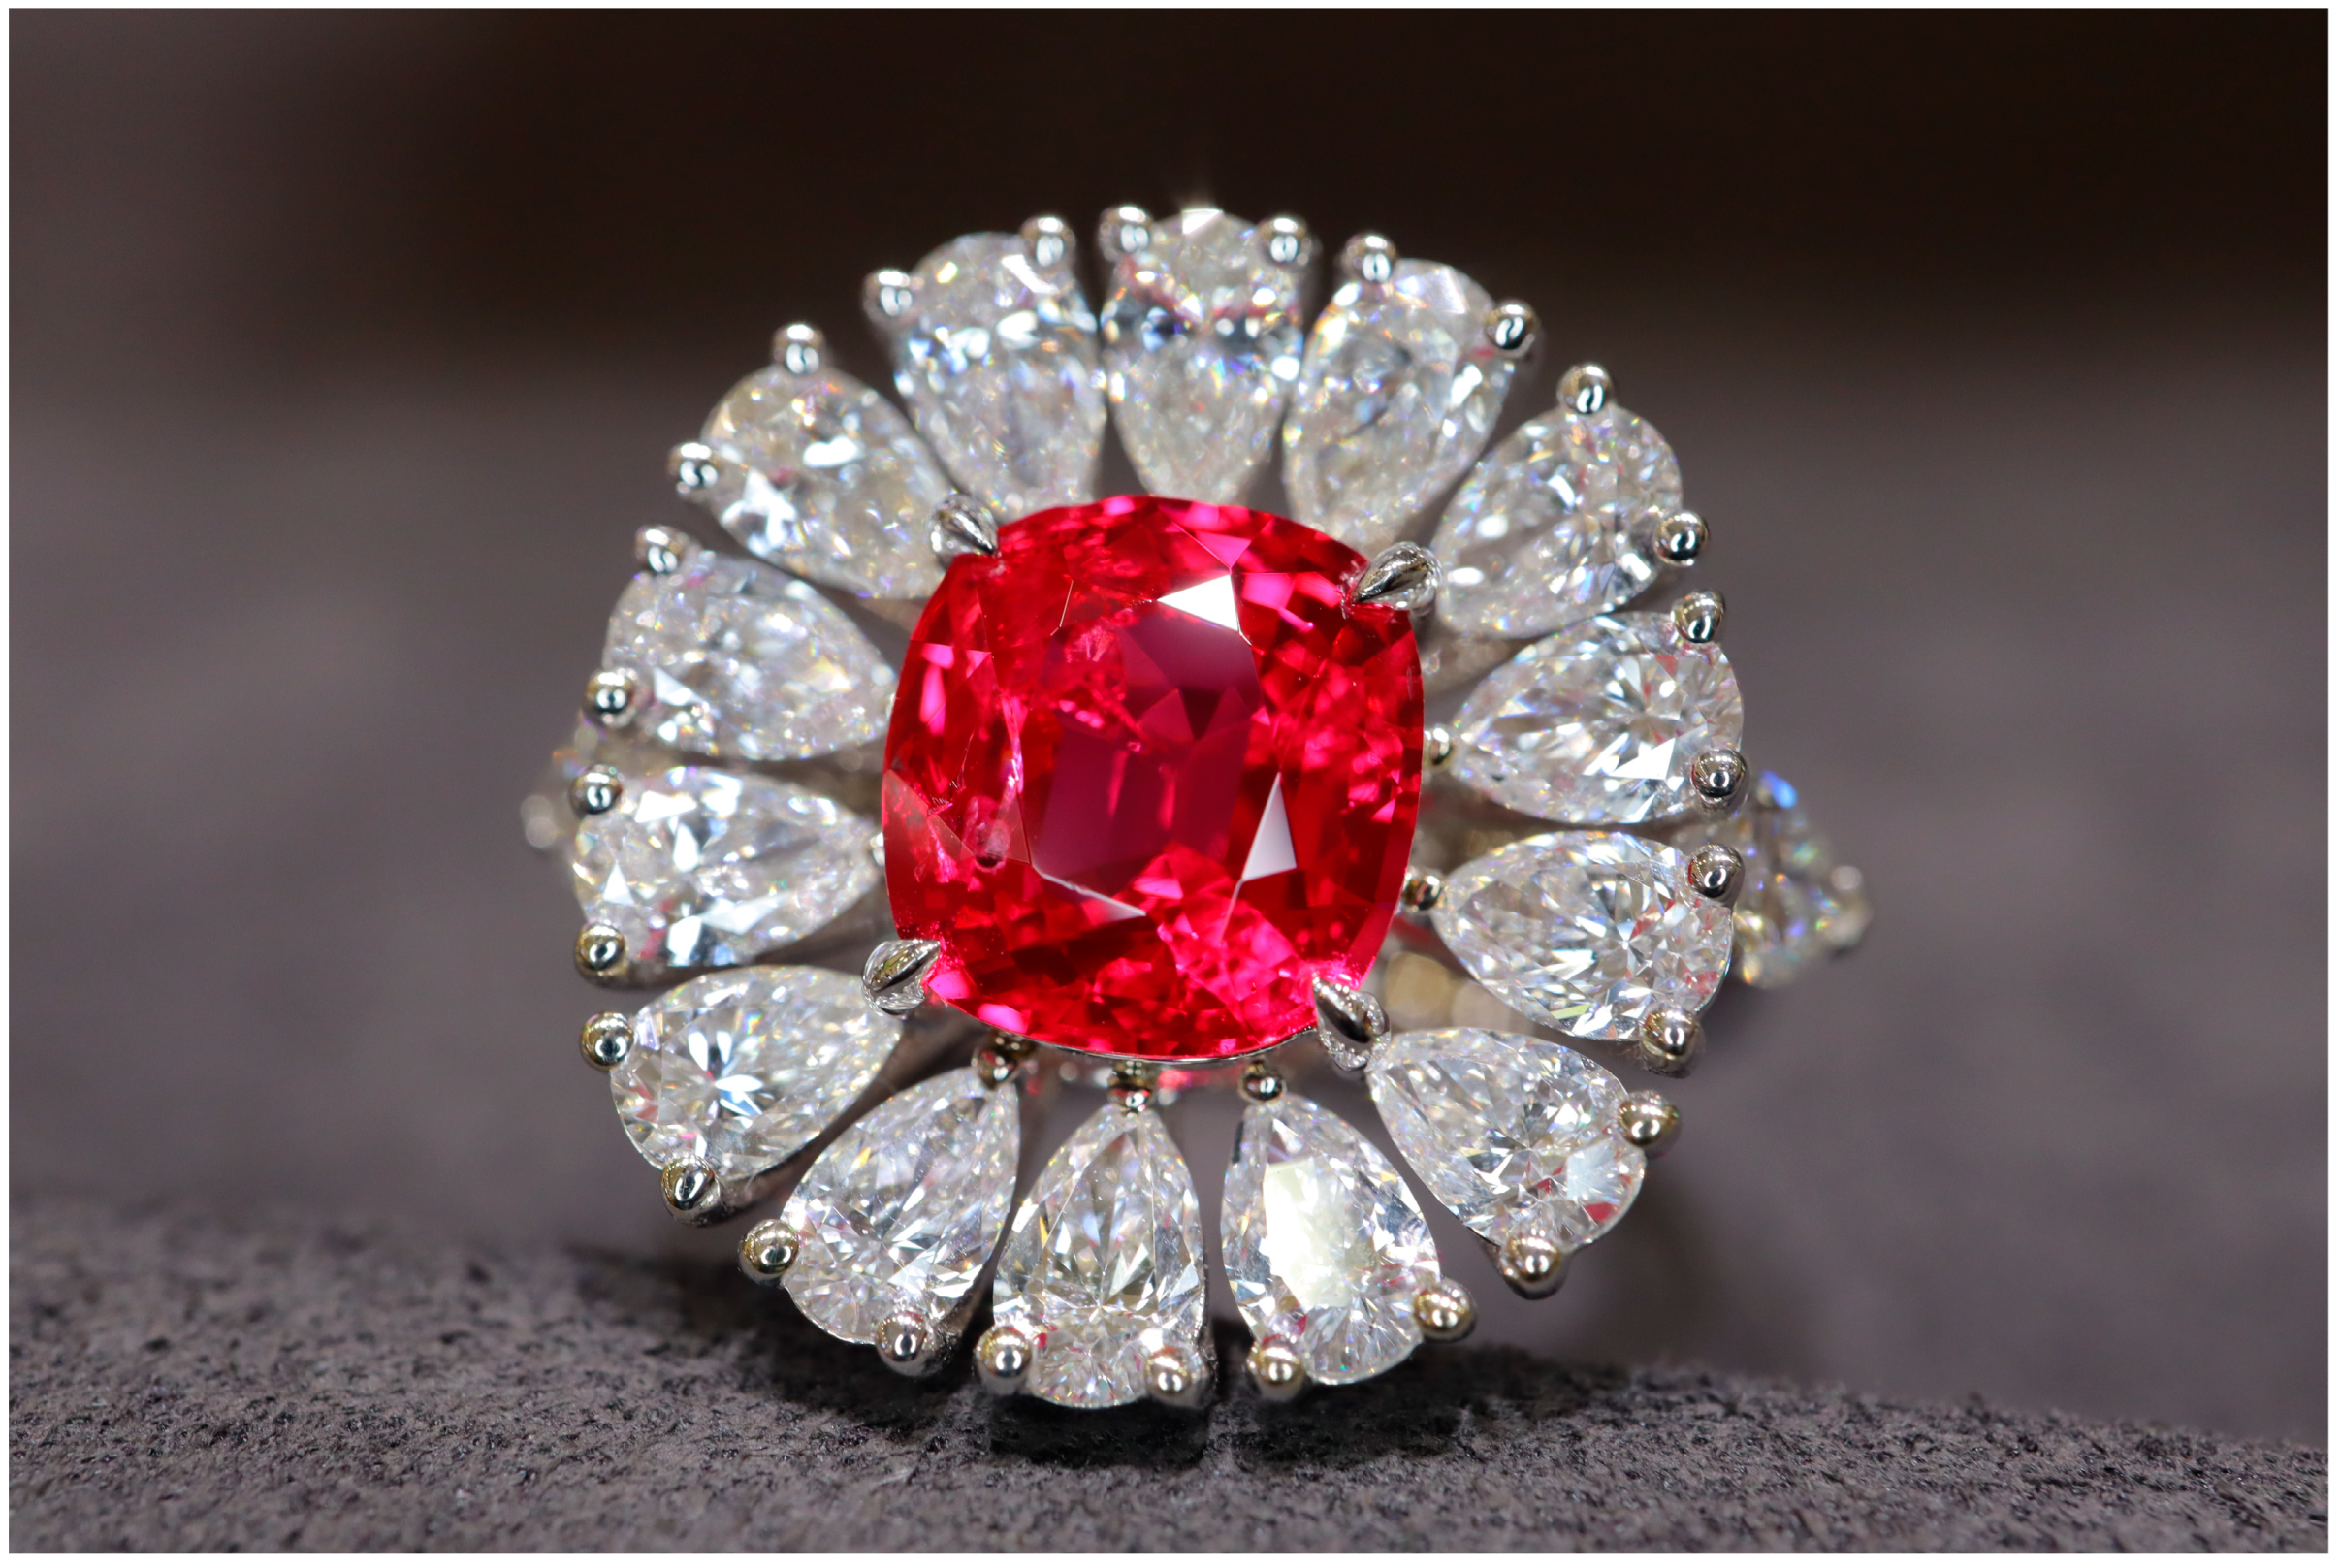
The vibrant neon pink–red visual appearance of spinel earns it the legendary name Jedi spinel in the trade (Figure 25). Various types of mineral inclusions have been identified in this study, with mainly sulfur and other sulfide minerals, hauerite, and calcite. The combination of these mineral inclusions may imply an origin of spinel from Man Sin and be instrumental in studying the geological formation of spinel.
Jedi spinels refer to vivid pink to red spinels with strong fluorescence owing to the high Cr and low Fe. The vibrant brilliance and distinct neon visual appearance, which wipes out most of the extinction, distinguish them from other pink to red spinels. They are usually free of treatments, with neither heating nor clarity enhancement, and they are currently found in Myanmar.
Chemical analysis revealed high chromium and low iron, resulting in a very high Cr/Fe ratio linked with exceptionally strong red fluorescence. Man Sin spinels can be further chemically characterized and separated from Mogok and Namya ones using binary and ternary diagrams of the trace elements, mainly V, Cr, Fe, and Zn. However, challenges still exist to distinguish Man Sin from Namya. Further studies with more samples are underway.

Author Contributions

Conceptualization Y.G., X.S. and X.W.; methodology, Y.G., X.S. and H.L.; software, X.S. and Y.Z; validation, Y.G and X.S.; formal analysis, Y.G. and C.Z.; investigation, Y.G, X.S. and C.Z.; resources, Y.G, X.S., X.W., M.H. and H.L.; data curation, Y.G, X.S. and Y.Z.; writing—original draft preparation, Y.G. and X.S; writing—review and editing, Y.G. and X.S; visualization, Y.G. and X.S.; supervision, Y.G.; funding acquisition, Y.G. and M.H. All authors have read and agreed to the published version of the manuscript.

Funding

This research was funded by the National Science and Technology Infrastructure—The National Infrastructure of Mineral, Rock and Fossil Resources for Science and Technology (http://www.nimrf.net.cn, accessed on 25 December 2021), and the Program of the Data Integration and Standardization in the Geological Science and Technology from MOST, China, grant number 2013FY110900-3.

Acknowledgments

The authors are very grateful to Andrew Lucas and Ruby Liu for their professional suggestions and discussions. We would like to thank Yulan Zhuang from Gem Co., Ltd. and Wenmei Jiang for their help while collecting samples. Special thanks also to Wenfang Zhu, Hongjun Yu, and Jinlin Wu for providing help in operating Raman. Qiaoqiao Li and Mengjie Shan are thanked for their help in testing samples using EDXRF. Thanks to Kaiyin Deng and Huixin Zhao from Guild Gem Lab and Ma Rui from Colorland Co., Ltd. for their support in photographing.

Conflicts of Interest

The authors declare no conflict of interest.

References

  1. Pardieu, V. Hunting for Jedi Spinels in Mogok. Gems Gemol. 2014, 50, 46–56. [Google Scholar] [CrossRef]
  2. Peretti, A.; Mullis, J.; Franz, L.; Capitani, C.; Mathys, D.; Günther, D. Spinel formation by sulphur–rich saline brines from Mansin (Mogok area, Myanmar). In Proceedings of the 15th Swiss Geoscience Meeting, Davos, Germany, 17–18 November 2017. [Google Scholar] [CrossRef]
  3. Phyo, M.M.; Bieler, E.; Franz, L.; Balmer, W.; Krzemnicki, M.S. Spinel from Mogok, Myanmar—A Detailed Inclusion Study by Raman Microspectroscopy and Scanning Electron Microscopy. J. Gemol. 2019, 36, 418–435. [Google Scholar] [CrossRef]
  4. Pardieu, V.; Hughes, R.W. Spinel: Resurrection of a classic. InColor 2008, 2, 10–18. [Google Scholar]
  5. Balocher, F. The Spinels of Mogok A Brief Overview. Incolor 2019, 43, 34–39. [Google Scholar]
  6. Malsy, A.; Klemm, L. Distinction of Gem Spinels from the Himalayan Mountain Belt. Chimia 2010, 64, 741–746. [Google Scholar] [CrossRef] [PubMed]
  7. Shigley, J.E.; Laurs, B.M.; Janse, A.J.A. Gem Localities of the–2000S. Gems Gemol. 2010, 46, 188–216. [Google Scholar] [CrossRef]
  8. Chankhantha, C.; Amphon, R.; Rehman, H.; Shen, A. Characterisation of Pink–to–Red Spinel from Four Important Localities. J. Gemmol. 2020, 37, 393–403. [Google Scholar] [CrossRef]
  9. Giuliani, G.; Ohnenstetter, D.; Fallick, A.E.; Groat, L.; Fagan, A. The Geology and Genesis of Gem Corundum Deposits. In Geology of Gem Deposits; Mineralogical Association of Canada Short Course Series, 44; Mineralogical Association of Canada: Tucson, AZ, Canada, 2014; pp. 35–112. [Google Scholar]
  10. Zaw, K. Overview of Mineralization Styles and Tectonic–metallogenic Setting in Myanmar. Geol. Soc. Lond. Mem. 2017, 48, 531–556. [Google Scholar] [CrossRef]
  11. Mitchell, A. Geological Belts, Plate Boundaries, and Mineral Deposits in Myanmar. Econ. Geol. 2018, 113, 1219–1220. [Google Scholar]
  12. Gübelin, E.J. The Ruby Mines in Mogok in Burma. J. Gemmol. 1965, 9, 411–426. [Google Scholar] [CrossRef]
  13. Keller, P.C. The Rubies of Burma: A Review of the Mogok Stone Tract. Gems Gemol. 1983, 19, 209–219. [Google Scholar] [CrossRef]
  14. Kane, R.E.; Kammerling, R.C. Status of Ruby and Sapphire Mining in the Mogok Stone Tract. Gems Gemol. 1992, 28, 152–174. [Google Scholar] [CrossRef]
  15. Hu, Z.C.; Gao, S.; Liu, Y.S.; Hu, S.H.; Chen, H.H.; Yuan, H.L. Signal enhancement in laser ablation ICP–MS by addition of nitrogen in the central channel gas. J. Anal. At. Spectrom. 2008, 23, 1093–1101. [Google Scholar] [CrossRef]
  16. Liu, Y.S.; Gao, S.; Hu, Z.C.; Gao, C.G.; Zong, K.Q.; Wang, D.B. Continental and oceanic crust recycling–induced melt–peridotite interactions in the Trans–North China orogen: U\Pb dating, Hf isotopes and trace elements in zircons from mantle xenoliths. J. Petrol. 2010, 51, 537–571. [Google Scholar] [CrossRef]
  17. Liu, Y.S.; Hu, Z.C.; Gao, S.; Gunther, D.; Xu, J.; Gao, C.G.; Chen, H.H. In situ analysis of major and trace elements of anhydrous minerals by LA–ICP–MS without applying an internal standard. Chem. Geol. 2008, 257, 34–43. [Google Scholar] [CrossRef]
  18. Andreozzi, G.B.; D’Ippolito, V.; Skogby, H.; Hålenius, U.; Bosi, F. Color mechanisms in spinel: A multi–analytical investigation of natural crystals with a wide range of coloration. Phys. Chem. Miner. 2019, 46, 343–360. [Google Scholar] [CrossRef]
  19. Mikenda, W.; Preisinger, A. N–lines in the luminescence spectra of Cr spinels (I) identification of N–lines. J. Lumin 1981, 26, 53–66. [Google Scholar] [CrossRef]
  20. Malíčková, I.; Bačík, P.; Fridrichová, J.; Hanus, R.; Štubňa, J.; Milovská, S.; Škoda, R. Detailed luminescence spectra interpretation of selected oxides: Spinel from Myanmar and chrysoberyl—Var. alexandrite from Tanzania. Acta Geol. Slovaca 2020, 12, 69–74. [Google Scholar]
  21. Malíčková, I.; Bačík, P.; Fridrichová, J.; Hanus, R.; Illášová, L.; Štubňa, J.; Furka, D.; Furka, S.; Škoda, R. Optical and Luminescence Spectroscopy of Varicolored Gem Spinel from Mogok, Myanmar and Lục Yên, Vietnam. Minerals 2021, 11, 169. [Google Scholar] [CrossRef]
  22. Shevell, S. The Science of Colour; Elsevier Science Ltd.: Amsterdam, The Netherlands, 2003. [Google Scholar]
  23. Manutchehrdanai, M. Dictionary of Gems and Gemology; Springer: Berlin/Heidelberg, Germany, 2005. [Google Scholar]
  24. Vertriest, W.; Raynaud, V. Complex Yellow Fluid Inclusions in Red Burmese Spinel. Gems Gemol. 2017, 53, 468. [Google Scholar]
  25. Zhai, S.; Pei, J.; Huang, W. Orange–Yellow Inclusion in Spinel from Man Sin, Myanmar. J. Gems Gemmol. 2019, 21, 24–30. [Google Scholar]
  26. Zhang, Y.; Zhu, J. –R.; Yu, X.–Y. A Comparative Study of the Gemological Characteristics and Inclusions in Spinels from Myanmar and Tajikistan. Crystals 2022, 12, 617. [Google Scholar] [CrossRef]
  27. Hughes, E.B.; Koivula, J.I.; Renfro, N.; Manorotkul, W.; Hughes, R.W. Spinel inclusions: An exercise in aesthetics. Incolor 2019, 43, 66–73. [Google Scholar]
  28. Phyo, M.M.; Wang, H.A.O.; Guillong, M.; Berger, A.; Franz, L.; Balmer, W.A.; Krzemnicki, M.S. U–Pb Dating of Zircon and Zirconolite Inclusions in Marble–Hosted Gem–Quality Ruby and Spinel from Mogok, Myanmar. Minerals 2020, 10, 195. [Google Scholar] [CrossRef] [Green Version]
  29. Khowpong, C. Chondrodite in Red Spinel from Mogok, Myanmar. Gems Gemol. 2021, 57, 383. [Google Scholar]
  30. Giuliani, G.; Fallick, A.E.; Boyce, A.J.; Pardieu, V.; Pham, V.L. Pink and red spinels in marble: Trace elements, oxygen isotopes, and sources. Can. Mineral. 2017, 55, 743–761. [Google Scholar] [CrossRef]
  31. Giuliani, G.; Fallick, A.E.; Boyce, A.J.; Pardieu, V.; Pham, V.L. Pink and Red Gem Spinels in Marble and Placers. Incolor 2019, 43, 14–28. [Google Scholar]
  32. Mills, S.J.; Hatert, F.; Nickel, E.H.; Ferraris, G. The standardisation of mineral group hierarchies: Application to recent nomenclature proposals. Eur. J. Mineral. 2009, 21, 1073–1080. [Google Scholar] [CrossRef]
  33. Bosi, F.; Biagioni, C.; Pasero, M. Nomenclature and classification of the spinel supergroup. Eur. J. Mineral. 2018, 31, 183–192. [Google Scholar] [CrossRef]
  34. Baidu Index. 2021. Available online: https://index.baidu.com/v2/main/index.html#/crowd/尖晶石?words=尖晶石 (accessed on 4 August 2021).
  35. Guild. Guild Chinese Spinel Market Report 2021. Gemol. Front. 2021, 2, 211–223. [Google Scholar]
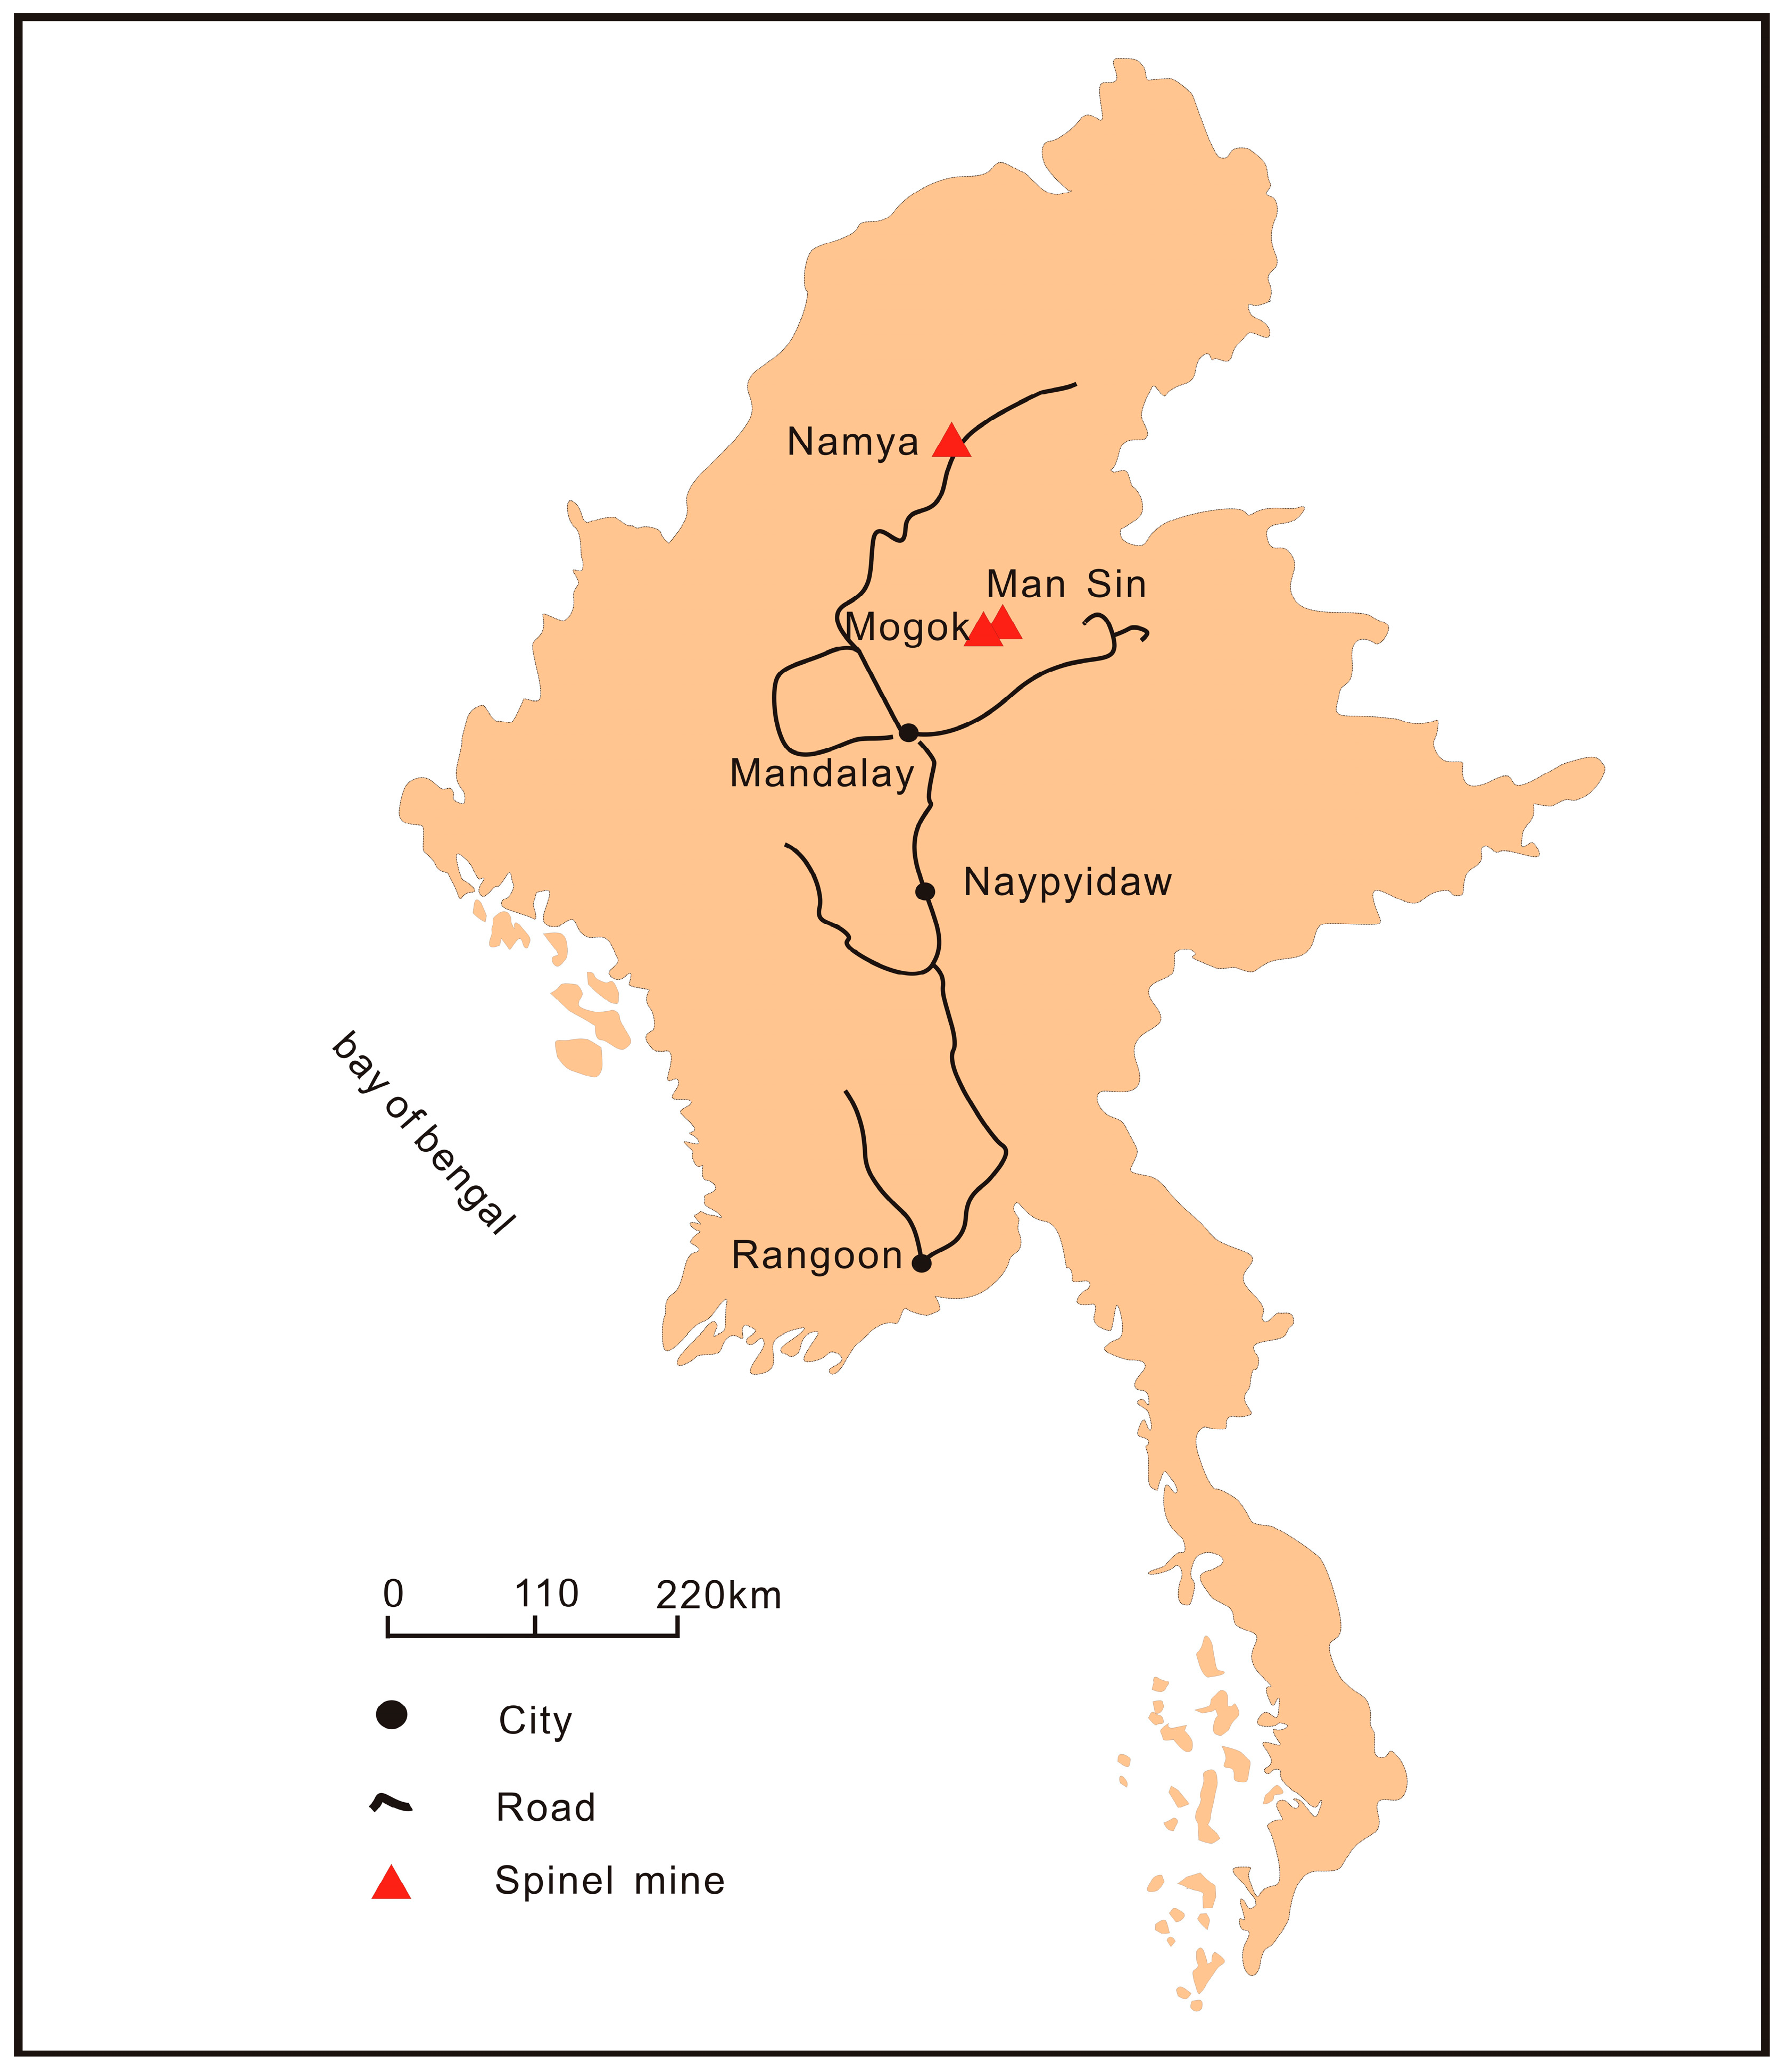
Figure 1. The geographic location of spinel mining areas in Myanmar. Illustrated by Cuiling Zhen.
Crystals 13 00103 g001
Figure 2. One of the authors (X.W.) examined a parcel of Man Sin Jedi spinels under sunlight (a), showing a very strong neon pink color (b). This lot was taken back to Guild Gem laboratories for research in this study. Photos by Xiaotao Wei.
Crystals 13 00103 g002
Figure 3. Unlike the euhedral and subhedral materials from the Mogok region, spinel from Namya usually exhibits a rounded octahedral shape with a neon pink to red color. Photo by Xiaotao Wei.
Crystals 13 00103 g003
Figure 4. Spinel crystals from Man Sin with octahedral crystal shape were studied: (a) 54 samples (No. 1) ranging from 0.19 to 2.50 ct and (b) 23 samples (No. 2) ranging from 1.40 to 2.22 carats. Photos by Kaiyin Deng.
Crystals 13 00103 g004
Figure 5. Rough Man Sin spinel generally shows a euhedral crystal habit. A thin flat octahedral or uniformed octahedral crystal from set No.1 weighing from 0.48 to 0.75 ct. Photo by Kaiyin Deng.
Crystals 13 00103 g005
Figure 6. Surface features of spinal rough samples. (a) Etched triangles were observed oriented in the opposite direction of the (111) octahedral faces. (b) Protrusions on the octahedral face (111) also show a triangular shape, but they are in the same direction as the (111) face. Field of view widths: (a) 1.45 and (b) 2.30 mm. Photomicrographs by Yizhi Zhao.
Crystals 13 00103 g006
Figure 7. A lightbox has different light sources, such as (a) 2700 and (b) 6500 K. Photos by Kaiyin Deng.
Crystals 13 00103 g007
Figure 8. The color of the spinel samples from set No. 1 varies with the temperature of color, from top to bottom 2700, 5000, 6500, and 7200 K, and sunlight. Photo by Kaiyin Deng.
Crystals 13 00103 g008
Figure 9. (a) Twelve rough samples from set No.1 show neon pink to red color under daylight. (b) They show exceptionally strong red fluorescence under long–wave UV light. Photos by Kaiyin Deng.
Crystals 13 00103 g009
Figure 10. (a) In this study, Man Sin spinels show neon pink to red color under daylight. (b) They exhibit exceptionally red fluorescence under long–wave UV light. Photos by Kaiyin Deng; courtesy of Wenmei Jiang from Shenzhen Zhenbao Shijia Jewelry Co., Ltd in Shenzhen, China.
Crystals 13 00103 g010
Figure 11. Phlogopite crystals were observed and identified in this study. (a) Near−colorless and transparent hexagonal platy phlogopite crystal, (b) tabular phlogopite, (c) subhedral phlogopite crystal observed under single polarized light, and (d) cross−polarized light. (e) Platy near−colorless transparent crystal identified as phlogopite using Raman spectrum. Peaks in the inclusion spectra that are marked with an asterisk are from the host spinel. Field of view widths: (a) 2.08; (b) 1.04; and (c) and (d) 2.23 mm. Photomicrographs by Yizhi Zhao.
Crystals 13 00103 g011aCrystals 13 00103 g011b
Figure 12. Molybdenite crystals were observed and identified in this study. (a) Two opaque platy molybdenite crystals, accompanied by tabular phlogopite, showed a well−preserved hexagonal outline. (b) Raman spectrum of opaque platy crystal identified as molybdenite. Peaks in the inclusion spectra that are marked with an asterisk * are from the host spinel. Field of view width: (a) 1.21 mm. Photomicrograph by Yizhi Zhao.
Crystals 13 00103 g012
Figure 13. (a) Freeform yellow sulfur was trapped in a restricted area, which contained multiple phases, including two immiscible sulfur–rich liquid and vapor bubbles and several anhedral and subhedral sulfide minerals, such as stibnite and hauerite. (b) Sulfur is filled within the fissures surrounding the colorless crystal (calcite). (c) Raman spectrum of yellow sulfur inclusions. Peaks in the inclusion spectra that are marked with an asterisk * are from the host spinel. Field of view widths: (a) 1.29 and (b) 0.45 mm. Photomicrographs by Yizhi Zhao.
Crystals 13 00103 g013aCrystals 13 00103 g013b
Figure 14. (a) Dark minerals associated with sulfur accompanied transparent crystal. Field of view width: 1.70 mm. Photomicrographs by Yizhi Zhao. (b) The Raman spectrum matched with a spectrum of stibnite in the RRUFF database. Peaks in the inclusion spectra that are marked with an asterisk * are from the host spinel.
Crystals 13 00103 g014
Figure 15. (a) Dark opaque hauerite inclusions stayed within the sulfur chamber and showed a slaggy appearance (lower) and subhedral crystal shape (upper). (b) The Raman spectrum matched with a spectrum of hauerite in the RRUFF database. Peaks in the inclusion spectra that are marked with an asterisk * are from the host spinel. Field of view width: (a) 1.62 mm. Photomicrograph by Yizhi Zhao.
Crystals 13 00103 g015
Figure 16. (a) Colorless rounded calcite crystals. (b) They exhibit interference color under cross–polarized light. (c) These colorless crystals were proved to be calcite using Raman. The peaks of the Raman spectrum were consistent with that of calcite in the RRUFF database. Peaks in the inclusion spectra that are marked with an asterisk * are from the host spinel. Field of view widths: (a,b) 1.74 mm. Photomicrographs by Yizhi Zhao.
Crystals 13 00103 g016aCrystals 13 00103 g016b
Figure 17. Unknown dark crystal surrounded by a halo under oblique illumination. Field of view width: 1.30 mm. Photomicrograph by Yizhi Zhao.
Crystals 13 00103 g017
Figure 18. The ternary Cr + V–Fe–Zn diagram permits the differentiation of pink and red spinels from Myanmar (Mogok, Namya, and Man Sin). Illustrated by Xueying Sun.
Crystals 13 00103 g018
Figure 19. Zn–V vs. Cr–Fe diagram for pink and red spinels from Myanmar (Mogok, Namya, Man Sin). Illustrated by Xueying Sun.
Crystals 13 00103 g019
Figure 20. Color and fluorescence comparisons of spinels from the Mogok area (first and second from left), Man Sin area (third from left), and Namya area (fourth from left). Mogok spinels generally show high saturation and darker tone under daylight, and they react to UV, showing weak red fluorescence. In contrast, spinels from Man Sin and Namya exhibit medium to high saturation and a brighter tone under daylight, showing exceptionally strong red fluorescence. Photo by Kaiyin Deng.
Crystals 13 00103 g020
Figure 21. The Cr/Fe ratio of spinel shows that Man Sin and Namya samples occupy a much higher ratio than Mogok stones. Illustrated by Yujie Gao.
Crystals 13 00103 g021
Figure 22. The illustration and photographing show spinels exhibiting red fluorescence of continuous gradients varying from left to right: exceptionally strong, very strong, medium, and weak. Illustrated by Cuiling Zhen.
Crystals 13 00103 g022
Figure 23. Search index indicates the top ten cities where spinel is in high demand from 1 July 2013 to 31 December 2020 [35].
Crystals 13 00103 g023
Figure 24. Quantity of spinel submitted to Guild Gem Laboratories, Shenzhen, China, from the first quarter of 2017 to the second quarter of 2021 [35].
Crystals 13 00103 g024
Figure 25. A stunning Jedi spinel makes a perfect ring. Photo by Ma Rui.
Crystals 13 00103 g025
Table 1. Materials and methods used in this study.
No.Number of SamplesOriginWeight/ctShapeColorNo. of Samples in Each Test
Standard GemologyMicroscopic Observation and PhotographyEDXRFRaman
No. 155Man Sin, Myanmar0.19–2.50Rough (54), faceted (1)Pink to red557137
No. 223Man Sin, Myanmar1.40–2.22RoughPink to red23151015
No. 324Mogok, Myanmar0.42–1.49Rough (22), faceted (2)Pink to red with an orangy and purplish hue24
No. 430Namya, Myanmar0.39–1.28Rough (29), faceted (1)Pink to red30
Table 2. Gemological properties of spinel from Man Sin area, Myanmar.
ColorPink to red color with a bright tone
ClarityVery slightly to heavily included
Refractive index1.718
Optical characterIsotopic
Specific gravity3.60 on average
FluorescenceUsually exceptionally strong red fluorescence
Crystal habit and morphologyOctahedral crystal habit with inverted triangular etches on the (111) surface
Step–like growth lines on (111) surface
Internal featuresNear–colorless subhedral to well–formed phlogopite crystals
Euhedral opaque molybdenite crystal
Dark sulfide minerals, such as hauerite
Yellow sulfur
Unidentified dark crystal surrounded by a halo
Unidentified dark mineral near the sulfur
Table 3. Mineral inclusions were discovered in this research and in Burmese spinel in the previous study.
MineralReferences
MolybdeniteThis study; [3]
StibniteThis study
HaueriteThis study
Pyrrhotite[3]
Marcasite[3]
SulfurThis study, [3,24,25]
PhlogopiteThis study, [3]
CalciteThis study, [3,26]
Dolomite[3,26]
Apatite[26,27]
Zircon[3,28]
Zirconolite[28]
Fluorophlogopite [27]
Chondrodite[29]
Pyrite[26]
Table 4. Chemical compositions of pink and red spinels from Myanmar (Man Sin, Mogok, Namya) using EDXRF.
Man Sin, Myanmar *Man Sin, Myanmar **Namya, Myanmar *Mogok, Myanmar *
Number of sample analyses233024
Trace elements (ppm)RangeMeanRangeMeanRangeMeanDetection Limit
Ti277–77650491081–172764391–10183182.0
V273–60939840884–879530249–222912801.0
Cr3655–809756784174833–716042422222–779845911.0
Fe114–360187140151–1539471605–332519171.0
Zn23–25613470145–8834791343–440727960.5
Gab.d.l.–24960b.d.l.–20467b.d.l.–5502800.5
Abbreviation: b.d.l. = below detection limit. * Data tested on samples in this study and samples from Guild Gem Laboratories collection. ** Representative electron microprobe data of deep pink spinel from Man Sin, Myanmar, from Guiliani et al. (2017) [30].
Table 5. The chemical composition and fluorescence strength of these four spinels from Mogok, Man Sin, and Namya were tested using EDXRF.
Sample No.1234Detection Limit
MineMogokMogokMan SinNamya
Ti19639868752.0
V9644196222791.0
Cr10,1906066933357481.0
Fe160615313292701.0
Zn6333253710711360.5
Cr/Fe6.34.028.421.3
Fluorescence StrengthMediumMediumExceptionally strongExceptionally strong
Disclaimer/Publisher’s Note: The statements, opinions and data contained in all publications are solely those of the individual author(s) and contributor(s) and not of MDPI and/or the editor(s). MDPI and/or the editor(s) disclaim responsibility for any injury to people or property resulting from any ideas, methods, instructions or products referred to in the content.