Abstract
We prepared a dense AgNbO3 ceramic using a conventional solid-state reaction method. The phase structure, electrical properties and electrocaloric effect (ECE) were systematically investigated. Large negative and positive ECEs (−4.38 °C at 65 °C and 2.3 °C at 210 °C) under an external electric field of 180 kV·cm−1 were obtained in the eco-friendly AgNbO3 antiferroelectric (AFE) ceramic due to affluent phase transition and a high electric field. The large positive and negative ECEs originated from the phase transition between ferrielectric (FIE) phases (the orthorhombic space group (Pmc21) and AFE phases (Pbcm) tuned by an applied external field. Additionally, a probable mechanistic model was proposed to illustrate the generation of positive and negative ECEs. This study may provide guidelines for the design of high-efficiency solid-state cooling devices.
1. Introduction
Conventional vapor-compression refrigeration technology emits hazardous gas, causing inevitable environmental problems. Hence, eco-friendly cooling technologies with high conversion efficiency and which are carbon-neutral are important for developing new types of refrigeration devices [1]. Cooling devices based on the electrocaloric-effect (ECE) are expected to replace the currently dominant conventional vapor-compression refrigeration devices due to their capacity for reversible temperature change (non-polluting) under the stimulation of an external electric field [2]. The ECE refers to the isothermal entropy (ΔS) or adiabatic temperature change (ΔT) of a dielectric material upon application or withdrawal of an external electric field [3,4,5,6,7]. Recent theoretical and experimental studies have shown that there are two types of ECEs in various ferroelectric (FE)/antiferroelectric (AFE) bulk and film systems, including positive and negative types [8,9,10,11]. Usually, a large magnitude of |ΔT|, for either the positive ECE or its negative counterpart, is expected and required for commercial solid-state cooling devices that can be widely used in biological refrigeration, on-chip cooling and temperature regulation [12,13]. Some studies have focused on the coexistence of positive and negative ECEs, such as BaZr0.2Ti0.8O3 (BZT) relaxor ferroelectric (RFE) films [14], (Pb0.97La0.02)(ZrxSn0.94−xTi0.06)O3 (PLZST) antiferroelectric ceramics [15], and (Pb0.97La0.02)(Zr0.95Ti0.05)1+yO3 antiferroelectric ceramics [16]. However, Pb-based materials suffer from the harmful effects of Pb elements on the environment and human beings and, as a result, their use will be seriously limited in the future. Nonetheless, the ECE of lead-free RFE is lower than that of Pb-based materials due to its strong dependence on a high breakdown electric field, resulting in a failure to meet market demand for commercial devices.
Silver niobate (AgNbO3) was synthesized in the 1950s [17]. Subsequent studies mainly focused on analyzing its structure, phase transitions, its piezoelectric, as well as dielectric, properties and its energy-storage behavior [18,19,20,21,22,23,24,25,26,27,28,29,30,31]. AgNbO3 exhibits various phase transformations and shows AFE-like electrical polarization under a high applied electric field. A series of phase transitions take place in AgNbO3 materials with increasing temperature: . M1 is the ferrielectric (FIE) phase with weak ferroelectricity, while M2 and M3 are disordered AFE phases. The phase transitions for M1–M2 and M2–M3 are associated with cation (Nb and Ag) displacements [22,32]. Therefore, based on the abundant phase transition properties of AgNbO3, it is predicted to obtain an efficient ECE.
In the present study, we report a large negative ECE (−4.38 °C at 65 °C) and a positive ECE (2.3 °C at 210 °C) under an external electric field of 180 kV·cm−1 in the eco-friendly AgNbO3 AFE ceramic. The simultaneously achieved positive and negative ECE in AgNbO3 results from phase transitions between FIE and AFE with a high electric field. The coexistence of positive and negative ECEs represents a novel technology for the development of solid-state cooling devices.
2. Experimental Procedure
2.1. Fabrication
AgNbO3 ceramics were synthesized by a conventional solid-state reaction method in a tube furnace, using Ag2O (≥99.7%) and Nb2O5 (≥99.99%) as the starting materials. All starting materials were obtained from the Sinopharm Chemical Reagent Co. Ltd., Shanghai, China. Stoichiometric amounts of Ag2O and Nb2O5 were mixed in absolute ethyl alcohol for 24 h using a planetary ball mill. After drying at 110 °C, the mixture was calcined at 850 °C for 6 h in an O2 atmosphere. Subsequently, the calcined powders were milled and dried again. The powders were then pressed into disks with a diameter of 10 mm using a 5 wt% solution of polyvinyl alcohol (PVA) as a binder, followed by cold isostatic pressing under 200 MPa for 1.5 min. After burning out the PVA binder, the sintering process was carried out at 1080 °C for 6 h in an O2 atmosphere to avoid the possible decomposition of the silver oxide at high temperature.
2.2. Characterization
The densities of the ceramic samples were measured in alcohol using the Archimedes method. The microstructure of AgNbO3 ceramics was examined by scanning electron microscopy (SEM, JSM-5510, JEOL Ltd., Tokyo, Japan). The phase structure was determined using an X-ray diffractometer (XRD, Bruker D8 Advanced Diffractometer, Bruker AXS, Ettlingen, German) with monochromatic Cu Kα radiation (λ = 1.5405 Å). For the electric property measurements, the AgNbO3 ceramics were polished to 150 μm in thickness and were sputtered with Au top electrodes of 2 mm in diameter by a DC sputtering method. The temperature-dependent dielectric properties were assessed by an inductance capacitance resistance analyzer (LCR, TH2828, Tonghui Co., Ltd., China) with an automated temperature controller at a rate of 2 °C·min−1. Polarization-electric field (P-E) hysteresis loops were measured using a ferroelectric tester (Radiant Technologies, Inc., Albuquerque, NM, USA) with a temperature-controlled probe station. Differential scanning calorimetry (DSC, DSC-Q2000, TA Instruments, New Castle, DE, USA) was used to measure the heat flow and specific heat capacity (Cp) on crushed unpoled ceramics in air at a scan rate of 10 °C·min−1.
3. Results and Discussion
The XRD pattern of the sintered AgNbO3 ceramic in the range of 20~70° is shown in Figure 1. A single phase assigned to an orthorhombic perovskite structure was achieved (JCPDS Card No.70-4738), which was consistent with results reported previously [33]. It is worth noting that an antipolar M1 (Pbcm symmetry/AFE) phase and a polar M1 (Pmc21 non-centrosymmetry/FE) phase coexist at room temperature [34,35,36]. SEM images of the AgNbO3 ceramic are presented in the inset of Figure 1. The grains of the ceramics developed satisfactorily, resulting in a dense and cubic microstructure. The grain size was in the range of 2~4 μm and the density of the ceramic was 6.565 g·cm−3 representing 96% of the theoretical density. The results indicate that a high breakdown strength (BDS) was achieved, contributing to the large obtained polarization value.
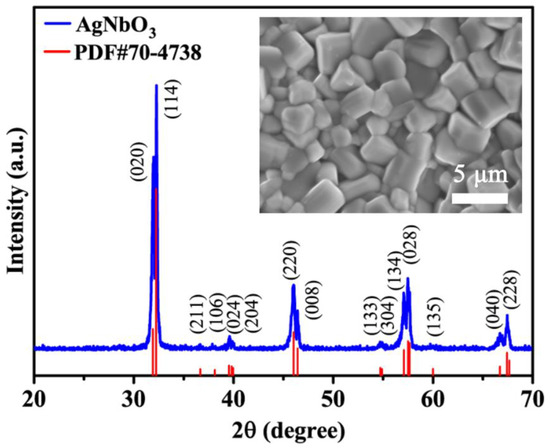
Figure 1.
XRD pattern of the sintered AgNbO3 ceramics. The inset shows SEM morphology images of the AgNbO3 ceramics.
Figure 2a shows the temperature dependence of the dielectric constants on heating and cooling cycles at 100 kHz with 3 °C per minute of the heating/cooling rate for dielectric measurements. Three obvious dielectric anomalies were detected in the heating curve. The first dielectric anomaly was located at about 70 °C (mark as T1), corresponding to the phase transition from the M1 to the M2 phase. The second dielectric anomaly was located at about 270 °C (mark as T2), corresponding to the phase transition from the M2 to the M3 phase. The third dielectric anomaly was caused by the phase transition from the M3 to the O1 phase (at about 380 °C), which corresponds to the Curie temperature (Tc) of pure AgNbO3. It is worth noting that a weak dielectric anomaly was found near 170 °C on the cooling curve, which could be assigned to the freezing temperature (Tf) of the antipolar alignment of Nb5+ ions in the lattice [24]. The phase transition temperature was further demonstrated by the DSC curves, as shown in Figure 2b. A strong endothermic event was observed on heating at ~350 °C, with a much weaker endothermic event at ~380 °C. The corresponding exotherms on cooling occurred at ~330 °C and ~370 °C, respectively. The results of the DSC curves are consistent with the temperature dependence of the dielectric constant. Characteristic P-E and I-E loops of AgNbO3 antiferroelectric ceramics at room temperature were observed, as shown in Fig 2c. Double P-E loops indicated large saturated polarizations (Ps) and non-zero remanent polarizations (Pr). Two strong current peaks, EF (the electric field from antiferroelectric to ferroelectric phase transition) and EA (the electric field from ferroelectric to antiferroelectric phase transition) could be observed in the I-E loops.
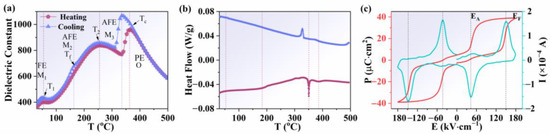
Figure 2.
(a) Temperature dependence of the dielectric constant for AgNbO3 ceramics. (b) DSC curves of AgNbO3 ceramics on heating and cooling. (c) P-E and I-E loops of AgNbO3 ceramics at room temperature.
The temperature dependence of the P-E loops collected at 180 kV cm−1 was evident during the heating process, as shown in Figure 3a–c. In order to unambiguously reveal the variation in the P-E loops at different temperature stages, the results were divided into three temperature segments. For the temperature stage from 30 °C to 110 °C, the Pmax value monotonically decreased with increase in temperature, while the EF showed an upward trend. For the temperature stage from 110 °C to 170 °C, Pmax monotonically increased with temperature increase, while EF reduced. When the temperature was above 170 °C (>Tf), the Pmax value monotonically decreased again with increase in temperature, while the EF again showed an upward trend compared with that for P-E at 170 °C. It was observed that there was an opposite trend in the changes between Pmax and EF at different temperature stages, which further reinforced the complexity of the structure in the AgNbO3 AFE ceramics.
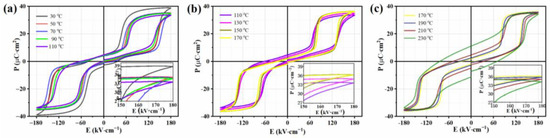
Figure 3.
P-E loops of AgNbO3 ceramics within the temperature range of 30~230 °C under 180 kV·cm−1: (a) 30~110 °C, (b) 110~170 °C, (c) 170~230 °C.
In order to evaluate the electrocaloric effect of AgNbO3 AFE ceramics, the Pmax values under different electric-fields and temperatures were extracted from Figure 3, as presented in Figure 4a. Below the EF (140 kV cm−1), the Pmax values monotonically increased with increase in temperature (dP/dT > 0, Figure 4b), while, above this field (140 kV cm−1), the situation was more complex, with polarization occurring non-monotonically with a peak near T2. For T < T2, the Pmax values obviously increased with increase in temperature (dP/dT > 0, Figure 4b), whereas above T2, it decreased rapidly (dP/dT < 0, Figure 4b). With increase in the electric-field intensity and temperature, the AFE phase gradually transformed to ferroelectric, so the Pmax value gradually increased. When the electric-field reached the EF, the polarization state of the AFE phase rapidly transformed to the FE state. With increase in temperature, this AFE-FE transformation process was accentuated, bringing about a rapid increase in the polarization value. However, when the temperature exceeded T2, under the action of the high temperature and electric field, the FE state became dominant, so the polarization value rapidly decreased with further increase in temperature, which reflected the intrinsic characteristics of the ferroelectric state.
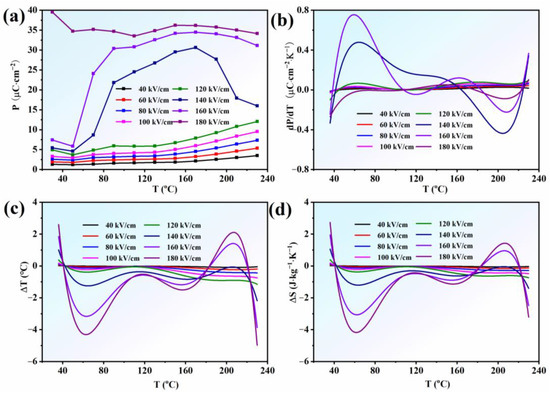
Figure 4.
(a) the Pmax; (b) dP/dT; (c) ΔT; (d) ΔS as a function of temperature under different electric fields for AgNbO3 ceramics.
The ECE performance of this system was measured using an indirect method based on the Pmax-T data. The well-known Maxwell relation , the adiabatic temperature change (ΔT) and the adiabatic entropy change (ΔS) are given by the equations [37,38]:
where Cp is the heat capacity, ρ is the density of the samples, T is the operating temperature, P is the maximum polarization at an applied electric field E, and E1 and E2 are the initial and final applied electric fields. The values of were obtained from sixth-order polynomial fits to the raw Pmax-T data extracted from the upper branches of the P-E loops for E > 0. ρ is the density of the AgNbO3 ceramics (6.565 g·cm−3). The heat capacity Cp was selected to be 0.33 J·g−1·K−1 at room temperature. The profiles of ΔT and ΔS versus temperature (ΔT-T and ΔS-T) under different electric fields were calculated according to Equations (1) and (2), as shown in Figure 4c,d. It was found that a positive and negative ECE were achieved over a broad temperature range of 30~230 °C. In particular, a large negative ECE (−4.38 °C under 180 kV cm−1 at 65 °C) was obtained in the ambient temperature range with a broad temperature span, which contributed to a large dP/dT (>0) and large entropy change (|ΔS|~4.4 J mol−1 K−1 in Figure 4d) in this temperature range. In addition, a positive ECE (2.3 °C under 180 kV cm−1 at 210 °C) was also obtained under a high electric-field (>EF) in the temperature range from 170 °C to 230 °C. As previously mentioned with respect to Figure 3, it should be noted that the ferroelectric state dominated the system at this temperature stage when EF > 140 kV cm−1; therefore, the decrease in the polarization value with increase in temperature caused the appearance of the positive ECE owing to negative dP/dT, which was consistent with normal ECEs observed in FE materials [39,40]. Overall, a positive and negative ECE in the lead-free silver niobate AFE ceramic was obtained. However, the deeper ECE mechanisms of AgNbO3 lead-free AFE ceramics need to be explored in the future.
Based on the structure, phase transition and measurement results for AgNbO3, we consider that the generation of positive and negative ECE derives from the synergistic effect of the temperature (T) and the electric field (E) [33]. To better illustrate this synergistic effect, a mechanistic model is proposed as shown in Figure 5. At T < T1, the FE phase decreases while the AFE phase gradually increases with increasing temperature in the FIE phase of the AgNbO3 ceramics (Figure 5a). This transition from an FE phase to an AFE phase will cause a decay in polarization. The inversion of the ferroelectric dipoles plays a role in enhancing the polarization. It is well-known that the entropy reduces by aligning dipoles in the ferroelectric state when an electric field is applied, resulting in a positive ECE according to Equation (1) in this temperature segment. When the temperature rises to T1, a phase transition occurs from a weak FE phase M1 to an AFE phase M2. Figure 5b displays the process of the negative ECE in the AFE phase induced by an electric field in the temperature range of T1 to Tf. At this stage, the M2 AFE phase is dominant. The AFE phase is relatively stable because the movement of Nb5+ is partially frozen within this temperature range. When a moderate electric field (E < EF) is applied in the AFE phase, the entropy will generally increase by misaligning the dipoles, therefore generating the negative ECE [41]. It is generally accepted that EF in AFE ceramics decreases with increase in temperature, which means it is easier for the dipoles to deflect under the external electric field. Therefore, a higher saturated polarization can be obtained at higher temperature under the same E. As the temperature rises from T1 to Tf, the increasing saturated polarization leads to a positive , causing a negative ECE. The generation of ECEs at T > Tf is exhibited in Figure 5c. When the temperature increases from Tf to Tc, the AFE polar phase gradually decreases, with the appearance of a paraelectric non-polar phase, and then the polarization weakens. At a lower electric field (E < EF), the dipoles will be more easily inversed and the entropy will generally increase by misaligning the dipoles at the higher temperature, leading to the negative ECE. However, the dipoles are completely aligned along the orientation of the electric field under E > EF, but the polarization values reduce because of the decrease in dipoles at higher temperatures, which leads to a negative , resulting in a positive ECE.
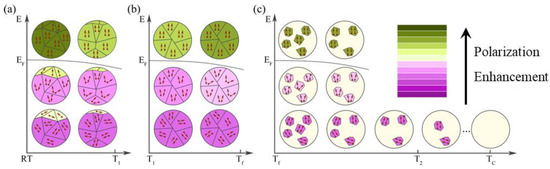
Figure 5.
Schematic representation of the positive and negative ECE process of AgNbO3 antiferroelectric ceramics upon application of an external electric field under different temperatures: (a) T < T1; (b) T1 < T <Tf; (c) T > Tf. Purple depth indicates the strength of antiferroelectricity; green depth indicates the strength of ferroelectricity.
4. Conclusions
In summary, a AgNbO3 lead-free AFE ceramic was prepared by a conventional solid-state reaction method. The AgNbO3 ceramic showed the coexistence of positive and negative ECEs over a wide temperature range (from 40 °C to 230 °C). A large negative ECE (−4.38 °C under 180 kV cm−1 at 65 °C) and a positive ECE (2.3 °C under 180 kV cm−1 at 210 °C) were obtained. This original study not only broadens the field of investigation of AgNbO3 in refrigeration, but also highlights the advantages of application of this component with regard to the electrocaloric effect.
Author Contributions
Conceptualization, J.D. and X.H.; methodology, J.D.; validation, J.D., Y.Z. and N.S.; investigation, J.D. and N.S.; resources, X.H. and Y.L..; data curation, J.D.; writing—original draft preparation, J.D.; writing—review and editing, Y.L. and X.H.; funding acquisition, Y.Z. and X.H. All authors have read and agreed to the published version of the manuscript.
Funding
This research was funded by [the Natural Science Foundation of China] grant number [52102136], [the Natural Science Foundation of Inner Mongolia] grant number [2019ZD12, 2020BS05005], [the Support Program for “Grassland Talents” Innovation Team of Inner Mongolia], and [the Plan Project for Science and Technology of Baotou] grant number [2019P3070].
Institutional Review Board Statement
Not applicable.
Informed Consent Statement
Not applicable.
Data Availability Statement
Not applicable.
Acknowledgments
We would like to thank Jia-Han Zhang at Nanjing University and Junlin Yang at Beijing Institute of Technology for their favorable helps in drawing.
Conflicts of Interest
The authors declare no conflict of interest.
References
- Greco, A.; Masselli, C. Electrocaloric Cooling: A Review of the Thermodynamic Cycles, Materials, Models, and Devices. Magnetochemistry 2020, 6, 67. [Google Scholar] [CrossRef]
- Li, J.; Li, J.; Wu, H.-H.; Qin, S.; Su, X.; Wang, Y.; Lou, X.; Guo, D.; Su, Y.; Qiao, L.; et al. Giant Electrocaloric Effect and Ultrahigh Refrigeration Efficiency in Antiferroelectric Ceramics by Morphotropic Phase Boundary Design. ACS Appl. Mater. Interfaces 2020, 12, 45005–45014. [Google Scholar] [CrossRef] [PubMed]
- Xavier, M.; Enric, S.-T.; Sam, C.; David, G.-A.; Sohini, K.-N.; Antoni, P.; Lluís, M.; Neil, D.M. Giant Electrocaloric Strength in Single-Crystal BaTiO3. Adv. Mater. 2013, 25, 1360–1365. [Google Scholar]
- Mischenko, A.S.; Zhang, Q.; Scott, J.F.; Whatmore, R.W.; Mathur, N.D. Giant electrocaloric effect in thin-film PbZr0.95Ti0.05O3. Science 2006, 311, 1270–1271. [Google Scholar] [CrossRef]
- Qian, X.S.; Ye, H.J.; Zhang, Y.T.; Gu, H.; Li, X.; Randall, C.A.; Zhang, Q.M. Giant Electrocaloric Response Over A Broad Temperature Range in Modified BaTiO3 Ceramics. Adv. Funct. Mater. 2014, 24, 1300–1305. [Google Scholar] [CrossRef]
- Bai, Y.; Zheng, G.; Shi, S. Direct measurement of giant electrocaloric effect in BaTiO3 multilayer thick film structure beyond theoretical prediction. Appl. Phys. Lett. 2010, 96, 192902. [Google Scholar] [CrossRef]
- Scott, J.F. Electrocaloric Materials. Annu. Rev. Mater. Res. 2011, 41, 229–240. [Google Scholar] [CrossRef]
- Ponomareva, I.; Lisenkov, S. Bridging the Macroscopic and Atomistic Descriptions of the Electrocaloric Effect. Phys. Rev. Lett. 2012, 108, 167604. [Google Scholar] [CrossRef]
- Li, B.; Wang, J.B.; Zhong, X.L.; Wang, F.; Zeng, Y.K.; Zhou, Y.C. The coexistence of the negative and positive electrocaloric effect in ferroelectric thin films for solid-state refrigeration. EPL 2013, 102, 47004. [Google Scholar] [CrossRef]
- Peräntie, J.; Hagberg, J.; Uusimäki, A.; Jantunen, H. Field-induced thermal response and irreversible phase transition enthalpy change in Pb(Mg1/3Nb2/3)O3-PbTiO3. Appl. Phys. Lett. 2009, 94, 102903. [Google Scholar] [CrossRef]
- Uddin, S.; Zheng, G.-P.; Iqbal, Y.; Ubic, R.; Yang, J. Unification of the negative electrocaloric effect in Bi1/2Na1/2TiO3-BaTiO3 solid solutions by Ba1/2Sr1/2TiO3 doping. J. Appl. Phys. 2013, 114, 213519. [Google Scholar] [CrossRef]
- Lu, S.G.; Zhang, Q. Electrocaloric Materials for Solid-State Refrigeration. Adv. Mater. 2009, 21, 1983–1987. [Google Scholar] [CrossRef]
- Moya, X.; Kar-Narayan, S.; Mathur, N.D. Caloric materials near ferroic phase transitions. Nat. Mater. 2014, 13, 439–450. [Google Scholar] [CrossRef]
- Guo, F.; Wu, X.; Lu, Q.; Zhao, S. Near room temperature giant negative and positive electrocaloric effects coexisting in lead–free BaZr0.2Ti0.8O3 relaxor ferroelectric films. Ceram. Int. 2018, 44, 2803–2808. [Google Scholar] [CrossRef]
- Zhuo, F.P.; Li, Q.; Gao, J.H.; Ji, Y.J.; Yan, Q.F.; Zhang, Y.L.; Wu, H.H.; Xi, X.Q.; Chu, X.C.; Cao, W.W. Giant Negative Electrocaloric Effect in (Pb,La)(Zr,Sn,Ti)O3 Antiferroelectrics Near Room Temperature. ACS Appl. Mater. Interfaces 2018, 10, 11747–11755. [Google Scholar] [CrossRef] [PubMed]
- Niu, Z.-H.; Jiang, Y.-P.; Tang, X.-G.; Liu, Q.-X.; Li, W.-H.; Lin, X.-W.; Lu, S.-G. Giant negative electrocaloric effect in B-site non-stoichiometric (Pb0.97La0.02)(Zr0.95Ti0.05)(1+y)O3 anti-ferroelectric ceramics. Mater. Res. Lett. 2018, 6, 384–389. [Google Scholar] [CrossRef]
- Francombe, M.H.; Lewis, B. Structural and Electrical Properties of Silver Niobate and Silver Tantalate. Acta Cryst. 1958, 11, 175–178. [Google Scholar] [CrossRef]
- Kania, A.; Roleder, K.; Łukaszewski, M. The Ferroelectric Phase in AgNbO3. Ferroelectrics 1984, 52, 265–269. [Google Scholar] [CrossRef]
- Tendeloo, G.V.; Verwerft, M.; Landuyt, J.V.; Coene, W.; Amelinckx, S. Trial Model for the Tilting Scheme in AgNbO3 Derived by Electron Diffraction and Imaging. Phys. Status Solidi (a) 1988, 109, 67–78. [Google Scholar]
- Fu, D.S.; Endo, M.; Taniguchi, H.; Taniyama, T.; Itoh, M. AgNbO3: A lead-free material with large polarization and electromechanical response. Appl. Phys. Lett. 2007, 90, 252907. [Google Scholar] [CrossRef]
- Levin, I.; Krayzman, V.; Woicik, J.C.; Karapetrova, J.; Proffen, T.; Tucker, M.G.; Reaney, I.M. Structural changes underlying the diffuse dielectric response in AgNbO3. Phys. Rev. B 2009, 79, 104113. [Google Scholar] [CrossRef]
- Levin, I.; Woicik, J.C.; Llobet, A.; Tucker, M.G.; Krayzman, V.; Pokorny, J.; Reaney, I.M. Displacive Ordering Transitions in Perovskite-Like AgNb1/2Ta1/2O3. Chem. Mater. 2010, 22, 4987–4995. [Google Scholar] [CrossRef]
- Li, G.; Liu, H.; Zhao, L.; Gao, J.; Li, J.F.; Yu, R.; Zhu, J. Atomic-scale structure characteristics of antiferroelectric silver niobate. Appl. Phys. Lett. 2018, 113, 242901. [Google Scholar] [CrossRef]
- Tian, Y.; Jin, L.; Zhang, H.F.; Xu, Z.; Wei, X.Y.; Politova, E.D.; Stefanovich, S.Y.; Tarakina, N.V.; Abrahams, I.; Yan, H.X. High energy density in silver niobate ceramics. J. Mater. Chem. A 2016, 4, 17279–17287. [Google Scholar] [CrossRef]
- Zhao, L.; Liu, Q.; Gao, J.; Zhang, S.; Li, J.F. Lead-Free Antiferroelectric Silver Niobate Tantalate with High Energy Storage Performance. Adv. Mater. 2017, 29, 1701824. [Google Scholar] [CrossRef]
- Xu, C.H.; Fu, Z.Q.; Liu, Z.; Wang, L.; Yan, S.G.; Chen, X.F.; Cao, F.; Dong, X.L.; Wang, G.S. La/Mn Co-doped AgNbO3 Lead-Free Antiferroelectric Ceramics with Large Energy Density and Power Density. ACS Sustain. Chem. Eng. 2018, 6, 16151–16159. [Google Scholar] [CrossRef]
- Zhao, L.; Gao, J.; Liu, Q.; Zhang, S.; Li, J.F. Silver Niobate Lead-Free Antiferroelectric Ceramics: Enhancing Energy Storage Density by B-Site Doping. ACS Appl. Mater. Interfaces 2018, 10, 819–826. [Google Scholar] [CrossRef]
- Lu, Z.; Bao, W.; Wang, G.; Sun, S.-K.; Li, L.; Li, J.; Yang, H.; Ji, H.; Feteira, A.; Li, D.; et al. Mechanism of enhanced energy storage density in AgNbO3-based lead-free antiferroelectrics. Nano Energy 2021, 79, 105423. [Google Scholar] [CrossRef]
- Luo, N.; Tang, X.; HAN, K.; Ma, L.; Chen, Z.; Chen, X.; Feng, Q.; Hu, C.; Wei, Y.; Toyohisa, F. Silver stoichiometry engineering: An alternative way to improve energy storage density of AgNbO3-based antiferroelectric ceramics. J. Mater. Res. 2021, 36, 1067–1075. [Google Scholar] [CrossRef]
- Miga, S.; Kania, A.; Dec, J. Freezing of the Nb5+ ion dynamics in AgNbO3 studied by linear and nonlinear dielectric response. J. Phys. Condens. Matter 2011, 23, 155901. [Google Scholar] [CrossRef]
- Tian, Y.; Jin, L.; Hu, Q.; Yu, K.; Zhuang, Y.; Viola, G.; Abrahams, I.; Xu, Z.; Wei, X.; Yan, H. Phase transitions in tantalum-modified silver niobate ceramics for high power energy storage. J. Mater. Chem. A 2019, 7, 834–842. [Google Scholar] [CrossRef]
- Tan, X.L.; Ma, C.; Frederick, J.; Beckman, S.; Webber, K.G. The Antiferroelectric ↔ Ferroelectric Phase Transition in Lead-Containing and Lead-Free Perovskite Ceramics. J. Am. Ceram. Soc. 2011, 94, 4091–4107. [Google Scholar] [CrossRef]
- Yan, Z.N.; Zhang, D.; Zhou, X.F.; Zhang, M.; Zhang, L.D.; Zhang, H.F.; Xue, G.L.; Abrahams, I.; Yan, H.X. Investigation of transitions between the M-phases in AgNbO3 based ceramics. J. Mater. Chem. A 2021, 9, 3520–3529. [Google Scholar] [CrossRef]
- Yashima, M.; Matsuyama, S.; Sano, R.; Itoh, M.; Tsuda, K.; Fu, D.S. Structure of Ferroelectric Silver Niobate AgNbO3. Chem. Mater. 2011, 23, 1643–1645. [Google Scholar] [CrossRef]
- Sciau, P.; Kania, A.; Dkhil, B.; Suard, E.; Ratuszna, A. Structural investigation of AgNbO3 phases using x-ray and neutron diffraction. J. Phys. Condens. Matter 2004, 16, 2795. [Google Scholar] [CrossRef]
- Hiroki, M.; Ayako, K.; Takafumi, O.; Craig, A.J.F.; Akihide, K.; Kazuki, S.; Fu, D.S. Polarization fluctuations in the perovskite-structured ferroelectric AgNbO3. Phys. Rev. B 2018, 97, 224104. [Google Scholar]
- Correia, T.; Zhang, Q. Electrocaloric Materials in Engineering Materials; Springer: Berlin/Heidelberg, Germany, 2014. [Google Scholar]
- Tuttle, B.A.; Payne, D.A. The effects of microstructure on the electrocaloric properties of Pb(Zr,Sn,Ti)O3 ceramics. Ferroelectrics 1981, 37, 603–606. [Google Scholar] [CrossRef]
- Yang, J.; Zhao, Y.; Lou, X.; Wu, J.; Hao, X. Synergistically optimizing electrocaloric effects and temperature span in KNN-based ceramics utilizing a relaxor multiphase boundary. J. Mater. Chem. C 2020, 8, 4030–4039. [Google Scholar] [CrossRef]
- Zhao, Y.; Du, J.; Yang, J.; Zhu, L.; Wang, Y.; Li, Y.; Hao, X. Large Room-Temperature Electrocaloric Response Realized in Potassium-Sodium Niobate by a Relaxor Enhancement Effect and Multilayer Ceramic Construct. ACS Appl. Mater. Interfaces 2022, 14, 11626–11635. [Google Scholar] [CrossRef]
- Geng, W.P.; Liu, Y.; Meng, X.J.; Laurent, B.; James, F.S.; Brahim, D.; Anquan, J. Giant Negative Electrocaloric Effect in Antiferroelectric La-Doped Pb(ZrTi)O3 Thin Films Near Room Temperature. Adv. Mater. 2015, 27, 3165–3169. [Google Scholar] [CrossRef]


Disclaimer/Publisher’s Note: The statements, opinions and data contained in all publications are solely those of the individual author(s) and contributor(s) and not of MDPI and/or the editor(s). MDPI and/or the editor(s) disclaim responsibility for any injury to people or property resulting from any ideas, methods, instructions or products referred to in the content. |
© 2023 by the authors. Licensee MDPI, Basel, Switzerland. This article is an open access article distributed under the terms and conditions of the Creative Commons Attribution (CC BY) license (https://creativecommons.org/licenses/by/4.0/).