Article

Carbonate and Oxalate Crystallization Effected by the Metabolism of Fungi and Bacteria in Various Trophic Conditions: The Case of Penicillium chrysogenum and Penicillium chrysogenum with Bacillus subtilis

by
Katerina V. Sazanova
1,2,3,*,
Marina S. Zelenskaya
1,
Alina R. Izatulina
1,
Anatoliy V. Korneev
1,
Dmitry Yu. Vlasov
1,2 and
Olga V. Frank-Kamenetskaya
1
1
Department of Botany, St. Petersburg State University, University emb. 7/9, 199034 Saint Petersburg, Russia
2
Komarov Botanical Research Institute of Russian Academy of Science, Prof. Popov Street 2, 197376 Saint Petersburg, Russia
3
The Archive of the Russian Academy of Sciences, University emb. 1, 199034 Saint Petersburg, Russia
*
Author to whom correspondence should be addressed.
Crystals 2023, 13(1), 94; https://doi.org/10.3390/cryst13010094
Submission received: 30 November 2022 / Revised: 22 December 2022 / Accepted: 25 December 2022 / Published: 4 January 2023

Abstract

:
The present work contributed to the patterns of crystallization affected by the metabolism of fungi and bacteria in various trophic conditions and specifically covers the case of Penicillium chrysogenum and P. chrysogenum with Bacillus subtilis. The cultivation of microorganisms was carried out on the dolomitic calcite marble in liquid Czapek–Dox nutrient medium with glucose concentrations of 1, 10 and 30 g/L. The study of the crystal component of mycelium formed on the marble surface was supported through powder X-ray diffraction, scanning electron microscopy and energy-dispersive X-ray spectroscopy; the quantitative content of the extracellular polymer substance (EPS) and low-molecular-weight organic acids (LMWOAs) in the medium was determined through chromatography–mass spectrometry (GC-MS). The results obtained clearly demonstrated the unique ability of the fungus P. chrysogenum to not only release organic acids (primarily oxalic), but the EPS also which significantly affected the pH of the culture liquid and, accordingly, the carbonate and oxalate crystallization. Carbonate crystallization manifested in the presence of Bacillus subtilis as well. The transition from oxalate crystallization to carbonate and vice versa could occur with a change in the species composition of the microbial community as well as with a change in the nutritional value medium. Under the conditions closest to natural conditions (glucose content of 1 g/L), through the action of P. chrysogenum, oxalate crystallization occurred, and through the action of P. chrysogenum with B. subtilis, carbonate crystallization was observed. The identified patterns can be used to reveal the role of fungi and bacteria in the oxalate–carbonate pathway.

1. Introduction

The bacterial–fungal metabolism is the main driving force of the biogeochemical cycles and solubilization processes of rocks and minerals, leading to biomineralization [1,2,3,4]. One of the global biogeochemical processes in which microbial biomineralization plays an important role is the oxalate–carbonate pathway (OCP) that transfers atmospheric CO2 into the geological CaCO3 reservoir [5,6,7].
It is known that the processes of the microbial metabolism are very labile and depend on many factors among which one of the main is trophic [8]. The relations between the microbial metabolism and induced biomineralization are poorly studied [5,7,9]. In addition, with the modeling of microbial crystallization in laboratory conditions, it is generally overlooked that in nature, on the surface of rocks, there are usually multispecies communities of microorganisms, the metabolism of which differs significantly from the metabolism of the individual species included in the communities [10,11,12]. Obtaining these fundamental results would contribute to the development of biotechnologies using bacteria and fungi, including the restoration technologies of industrial facilities and monuments of carbonate materials through the “treatment” and compaction of stone [13,14,15] as well as the technologies of the biodetoxification of toxic metals in various media by initiating ion exchange, adsorption and coprecipitation processes [16,17,18].
The present work continued our studies of carbonate and oxalate crystallization in vitro induced through the interaction of marble with the products of the bacterial–fungal metabolism in various trophic conditions [9,19]. Model experiments made it possible to recreate the patterns of the formation of crystals under the action of microorganism on marble and other calcium-containing rocks and minerals: calcium oxalates (weddellite and whewellite) by fungi [2,7,20,21,22,23,24] and secondary calcites by different bacteria, such as cyanobacteria, ureolytic bacteria, nitrate-reducing bacteria, myxobacteria, sulfate-reducing bacteria and others [25,26]. However, the following interrelated questions remained: How do environmental conditions affect the metabolism of fungi, bacteria and their associations? Through the action of which organisms and why does oxalate crystallization transform into carbonate crystallization and vice versa?
Our previous experiments with the bacterium Bacillus subtilis showed that this bacterium could form both carbonates and oxalates. The formation of calcite was facilitated by a medium enriched with nutrients, while the formation of calcium oxalates was facilitated by an oligotrophic medium [9]. Additionally, in the example of the association B. subtilis with the fungus Aspergillus niger, it was shown that the acidification activity of micromycetes, which increases as the nutrient medium increases, may suppress the formation of the bacterial extracellular polymer substance (EPS) and prevent calcite formation.
In this work, in order to understand how common the previously revealed patterns are, we studied the effect on biomineralization of the metabolism of the fungus Penicillium chrysogenum and the fungal–bacterial association P. chrysogenum and B. subtilis in different nutrient conditions.
The choice of the fungus P. chrysogenum was due to the fact that its metabolism is extremely different from that of A. niger. P. chrysogenum produces the same low-molecular-weight organic acids (LMOAs) as A. niger, but the intensity of its acid formation is much lower, which affects the pH of the crystallization medium and the interaction of P. chrysogenum with the cations present in it [23,27]. In addition, our preliminary experiments showed that P. chrysogenum can produce secondary calcites, proving that it can produce the EPS. The fact that the formation of the EPS is characteristic not only of bacteria but also of many fungi is known [28]. It is also important that the urease enzyme produced by P. chrysogenum hydrolyzes urea, contributing to a stable interaction between the calcium and carbonate ions coexisting at the sites of nucleation under the activity of the EPS [29].
B. subtilis is widely used in biotechnology (in metal remediation, construction restoration and others) [13,17]. We studied the metabolism of B. subtilis and the interaction of this strain with marble in the previous work, including its association with A. niger [9]. Planned experiments on the association P. chrysogenum and B. subtilis made it possible not only to compare the effect of this association on marble with the effect of the two monocultures (fungus P. chrysogenum and bacterium B. subtilis) but also with the effect of another bacterial–fungal association A. niger with B. subtilis.

2. Materials and Methods

Two series of experiments were carried out on the surface of dolomitic calcite marble with following microorganisms: (1) monocultures of fungus P. chrysogenum and (2) cocultures of fungus P. chrysogenum and bacterium B. subtilis.

2.1. Bacterial and Fungal Strain Identification

Bacillus subtilis (deposited under number RCAMO4920 in the RCAM collection) was isolated from weathered rapakivi granite from Virolahti, Finland. The methods of molecular identification were described in detail early [9].
The fungus Penicillium chrysogenum (strain Cs/21, Genbank number OP758843) was isolated from surface deposits on the bronze sculpture Farnese Hercules («Tsarskoe Selo» State Museum and Heritage Site). The fungus was identified based on molecular genetic analysis. DNA isolation was carried out according to the standard procedure [30]. Amplification of a taxonomically significant region was carried out using the following primers: ITS-1 TCCGTAGGTGAACCTGCGG and ITS-4 TCCTCCGCTTATTGATATGC [31]. Visualization of products in 1% agarose gel was carried out with the addition of ethidium bromide. Sanger sequencing was performed using BrilliantDye reagents (Nimagen).

2.2. Bioinspired Syntheses

Cultivation of microorganisms was carried out in liquid Czapek–Dox nutrient medium (g/L: NaNO3–2.0; KH2PO4–1.0; MgSO4·7 H2O–0.5; KCl–0.5; FeSO4·7 H2O–0.01) with various glucose concentrations (1, 10 and 30 g/L). The experimental conditions were similar to those described earlier [9]. The duration of cultivation was 7, 14, 21, 28 and 70 days. The experiments were carried out in triplicate. As a control, Czapek–Dox medium with a fragment of marble without the addition of microorganisms was used.
The precipitation formed during the experiment, which contained crystallization products and microbial biofilm, was investigated directly on the underlying piece of marble and in surface culture close to marble.

2.3. Methods and Approaches

2.3.1. Powder X-ray Diffraction (PXRD)

The PXRD method was used to determine phase composition of precipitates. The measurements were performed by means of Bruker “D2 Phaser” powder diffractometer (CoKα radiation). X-ray diffraction patterns were collected at room temperature in the range of 2θ = 5–60° with a step of 0.02° 2θ and a counting time of half of a second per data point. A sample holder of a single crystal silica slice was used to eliminate the background noise. The PDF-2 database was used for phase identifications.

2.3.2. Scanning Electron Microscopy (SEM) and Energy-Dispersive X-ray Spectroscopy (EDXS)

SEM and EDXS were used to study the morphology and composition of formed crystals and their intergrowths as well as for diagnostics of biomineralization products on this basis. At the detection of second calcite crystallization, when PXRD was impossible to use, this was the main-phase diagnostic approach. The investigation was carried out using the TM3000 (HITACHI, Japan, 2010) microscope. For semiquantitative EDX analysis, the microscope was equipped with the Oxford Inca system (Oxford Instruments, Abingdon, UK), which was operated in low-vacuum (60 Pa) mode and at an acceleration voltage of 15 kV. To avoid the charging effect on SEM images, the samples were coated with a thin carbon layer (High Vacuum Carbon Sprayer Q150TE). The EDX spectra were analyzed by means of the EDAX Genesis software package.

2.3.3. Chromatography–Mass Spectrometry (GC-MS Analysis)

For determination of the composition of low-molecular-weight organic acids (LMWOAs) produced by microorganisms, cultural fluid was treated with HCl (3 mL) in order to dissolve insoluble calcium oxalates, and it was passed through cationic exchanger (KU—2–8) to free acids from their salts. The obtained water solution of organic acids was dried by a rotary evaporator at 40 °C. The dried extracts were solubilized in pyridine (50 μL) and were incubated with BSTFA (N,O-bis—3-methyl-silyl-3-F-acetamide) (50 μL) at 100 °C for 15 min.
The derivatized samples were analyzed through gas chromatography–mass spectrometry (GC-MS) on a Maestro instrument (Interlab, Russia) with an Agilent 5975 mass selective detector (Santa Clara, CA, USA). Column HP-5MS of 30 m × 0.25 mm × 0.25 µm was used. Chromatograms of the samples were recorded using the total ion current.
Mass spectrometric information was processed and interpreted using AMDIS program (http://www.amdis.net/index.html, accessed on 20 November 2020) and standard NIST2005 library. Quantitative interpretation of chromatograms through internal standard method was also performed using tridecane in the UniChrom program (5.0.19.1180 version) (http://www.unichrom.com/unichrome.shtml, accessed on 29 November 2022).

2.3.4. Determination of Biomass, EPS Content and pH Values

The microbial biomass was determined using the gravimetric method after centrifugation of cultural liquid (at 11.000 rpm for 10 min). The biomass was dried at 60 °C to an absolutely dry weight.
Quantitative analysis of the content of EPS in the liquid cultures of microorganisms was carried out on the 7th, 14th, 21st, 28th and 70th days of the experiment by weighing the sediment precipitated with cold ethanol as described previously [12].
The pH values during the experiment were evaluated using pH meter Checker 1 (HI 98103).

3. Results

3.1. The Growth of the Biomass on Marble Surface

3.1.1. P. chrysogenum

With an increase in the glucose concentration, an uneven increase in the biomass of the P. chrysogenum monocultures was observed in most cases (Table 1). At the beginning of the cultivation (day 7), the content of the biomass in the medium with a glucose content of 10 g/L was 10 times greater than in the medium with a glucose content of 1 g/L. Later, this ratio decreased and, after 28 days, became ~2 times greater. With an increase in the glucose content from 10 to 30 g/L, an increase in the biomass either did not occur (7 days) or was very insignificant: from 1.2 times (14 days) to 1.7 times (70 days).
Depending on the cultivation time (from 7 to 70 days), the biomass of P. chrysogenum increased unevenly as well (Table 1): at a glucose content of 1 g/L, the biomass increased by ~10 times; at a glucose content of 10 g/L, it increased by ~1.7 times; and at a glucose content of 30 g/L, it increased by ~4 times, i.e., the biomass increased most rapidly at a glucose content of 1 g/L. After 21 days of cultivation, the amount of the biomass remained almost unchanged.

3.1.2. P. chrysogenumB. subtilis Association

The dynamics of the biomass growth of the P. chrysogenumB. subtilis association depended on the concentration of glucose (Table 2). At the beginning of the cultivation (7 days), the content of the biomass in the medium at a glucose concentration of 10 g/L was 10 times greater than that at a concentration of 1 g/L; starting at 28 days, the ratio decreased to 2 times greater. In the medium with glucose concentrations of 10 and 30 g/L, the differences in the biomass were very insignificant. The maximum difference (1.4 times) was observed on the 28th day of the experiment and did not change until 70 days.
The biomass of the association during the cultivation (from 7 to 70 days) increased unevenly as well: at a glucose content of 1 g/L, the biomass increased by ~15 times; at a glucose content of 10 g/L, it increased by ~2.5 times; and at a glucose content of 30 g/L of the medium, it increased by ~3.3 times, i.e., the growth of the biomass in the case of the bacterium–fungus association occurred most rapidly at a glucose content of 1 g/L as well. In general, the difference in the content of the biomass formed under the action of the monoculture of the fungus and the bacterium–fungus association in the media with the same glucose content mostly did not exceed ~5–10%. This difference was the greatest (up to 20%) at 10 g/L of glucose in the medium.
In the medium with a glucose concentration of 1 g/L, the biomass content practically ceased to change after 28 days of cultivation. With glucose contents of 10 and 30 g/L, such as those under the action of the fungal monocultures, it occurred after 21 days of cultivation.

3.2. The Metabolism of Microorganisms and the pH of Liquid Medium

3.2.1. P. chrysogenum

At a glucose concentration of 1 and 10 g/L, only oxalic acid was found in the cultural liquid from 7 to 70 days of cultivation (Table 1). As the cultivation continued, the concentration of oxalic acid increased (up to ~10 times on the 70th day). With an increase in the glucose concentration, the amount of oxalic acid rose as well (most intensively in the glucose concentration range from 1 to 10 g/L). On the 14th and 21st days, at a glucose content of 10 g/L, the amount of oxalic acid was more than 20 times that at 1 g/L, and, at 30 g/L, it was only 3 times greater than it was at 10 g/L. At the later periods of the cultivation, this difference was lower: on the 70th day, it was ~10 times greater (when comparing media containing 1 and 10 g/L of glucose) and ~1.5 times (when comparing media with 10 and 30 g/L of glucose). As a result, the maximum amount of oxalic acid, which, at a glucose content of 1 g/L, was achieved only on the 70th day of the experiment, in the medium containing 10 g/L of glucose was already reached on the 7th day, and, at 30 g/L, it was reached even earlier (Table 1). The maximum content of oxalic acid with a glucose content of 10 g/L and 30 g/L was reached at no later than 14 days.
At a glucose concentration of 30 g/L, in addition to oxalic acid, succinic, fumaric, malic, citric and gluconic acids were produced (Table 3). At this glucose concentration, during the cultivation, the content of oxalic acid increased by 7.4 times; the highest concentration was reached at 28 days and then fluctuated within the error of determination. The maximum content of gluconic acid was reached on the 7th day, and then it gradually decreased, becoming 0 on the 70th day. The contents of citric, succinic and fumaric acids reached their maximum values on the 14th day; content of malic acid reached its maximum value by day 28. On the 70th day, only oxalic acid was again present in the culture liquid.
At all the concentrations of glucose in the culture liquid of the P. chrysogenum monocultures, an EPS was also found, which, like oxalic acid, accumulated with the age of the cultures and accumulated even more intensively with an increase in the concentration of glucose in the medium (Table 1). At a glucose concentration of 1 g/L, for up to 21 days (and at 10 g/L, for up to 14 days), an EPS in the culture fluid was contained at trace amounts. Then, its content began to grow. In the cultural liquid containing 30 g/L of glucose, the content of the EPS that had already appeared on the 7th day of the experiment was practically equal to the EPS concentration achieved at a glucose content of 10 g/L only on the 70th day of the experiment. On the 28th and 70th days, the concentration of the EPS at 30 g/L of glucose was more than 100 times higher than the concentration of the EPS in the culture liquid containing 1 g/L of glucose. The maximum content of the EPS at 30 g/L was ~60 times higher than at 10 g/L on the 70th day.
At the beginning of the experiment (for up to 21 days, at 1 g/L, and for up to 14 days, at 10 g/L), there was more oxalic acid in the medium than the EPS and then (up to 70 days) vice versa. When the content of glucose was 30 g/L, the content of the EPS significantly exceeded the content of oxalic acid throughout the experiment (up to 70 days).
Changes in the pH during the experiment (Table 1) in the culture fluid with a glucose content of 1 and 10 g/L were comparable to those observed in the control experiment (from 5.5 to 6.6). At a glucose concentration of 30 g/L, within a month of cultivation, an intensive acidification of the medium occurred. Then the pH began to rise and was neutral on the 70th day.

3.2.2. P. chrysogenumB. subtilis association

As in the case of the P. chrysogenum monocultures, at glucose concentrations of 1 and 10 g/L, only oxalic acid was produced by the P. chrysogenumB. subtilis association from 7 to 70 days of cultivation (Table 2). The amount of oxalic acid produced by this association was 5–10% higher than the amount of oxalic acid produced by the P. chrysogenum monocultures on the same days. As the cultivation continued, the concentration of oxalic acid grew: at a glucose concentration of 1 g/L, it increased by 822 times; at a glucose concentration of 10 g/L, it increased by 7.5 times; and at a glucose concentration of 30 g/L, it increased by 6.5 times. At glucose concentrations of 1 and 10 g/L, the amount of oxalic acid increased throughout the 70 days; at a glucose content of 30 g/L, the maximum content of oxalic acid was reached on the 28th day and then varied within the error. In general, the patterns of the changes in the content of oxalic acid in the culture liquid of the P. chrysogenumB. subtilis association were similar to those described above in the P. chrysogenum monocultures.
As in the monocultures of the fungus, at a glucose concentration of 30 g/L, in addition to oxalic acid, succinic, fumaric, malic, citric and gluconic acids were produced (Table 3). The amounts of gluconic, succinic and fumaric acids in the association cocultures were 1.5–2.5 times higher than those in the monocultures. The amount of malic acid did not vary significantly. The concentrations of citric acid were the highest in the cocultures on the 21st day (three times more than those in monocultures) and sharply decreased to the minimum amounts on the 28th day. The patterns of the changes in the concentrations of succinic, fumaric, malic, citric and gluconic acids in the monocultures and cocultures were also similar. On the 70th day, again, only oxalic acid was present in the culture liquid. In general, the patterns of the changes in the content of oxalic acid in the liquid cultures of the association P. chrysogenumB. subtilis were similar to those described above in the P. chrysogenum monocultures.
The concentration of the EPS in the cocultures of P. chrysogenumB. subtilis was higher at all glucose contents and increased faster with the cultivation time compared to that of the fungal monocultures. At all glucose concentrations, the EPS content exceeded that of oxalic acid. At a glucose concentration of 1 g/L, the EPS concentration varied by 1.8 times, and at 10 g/L, it varied by 4.6 times. At 30 g/L of glucose, the amount of EPS produced reached its maximum value.
Unlike other synthesis options, where the changes in the composition of the metabolites occurred rather monotonously, at 30 g/L of glucose, a change in the content of the EPS in the medium in the interval of 21 to 28 days abruptly occurred 14 times. At the end of the experiment, the concentration of the EPS in the culture fluid containing 30 g/L of glucose was more than 100 times higher than the concentration of the EPS in the culture fluid containing 1 g/L of glucose (on the 70th day of the experiment).
The dynamics of the accumulations of oxalic acid and the EPS depended on the content of glucose and differed significantly in the monocultures and cocultures. At the beginning of the cultivation, when the glucose content was no more than 10 g/L, the amount of oxalic acid exceeded the amount of the EPS, and then this ratio changed: at a glucose content of 1 g/L, this occurred between 21 and 28 days, and, at a content of 10 g/L, it occurred a week earlier. In the monoculture of the fungus that had a glucose content of 30 g/L and in the cultures of the bacterial–fungal association, regardless of glucose content (probably due to the metabolism of B. subtilis), the excess of the EPS over the content of oxalic acid could be traced from the beginning of the experiment. Additionally, at a glucose concentration of 30 g/L, both in the monoculture of the fungus and in the bacterial–fungal coculture, after a month of cultivation, a jump-like increase in the EPS (by more than 10 times) was observed.
The values of the pH of the culture fluids of the P. chrysogenumB. subtilis association at a glucose concentration of 1 g/L throughout the experiment were close to seven (Table 1). At glucose concentrations of 10 and 30 g/L, in the process of cultivation, a gradual alkalization of the medium occurred. The greatest changes in the pH of the culture liquid of the P. chrysogenumB. subtilis association compared to those of the P. chrysogenum culture liquid occurred at a glucose content of 10 g/L.

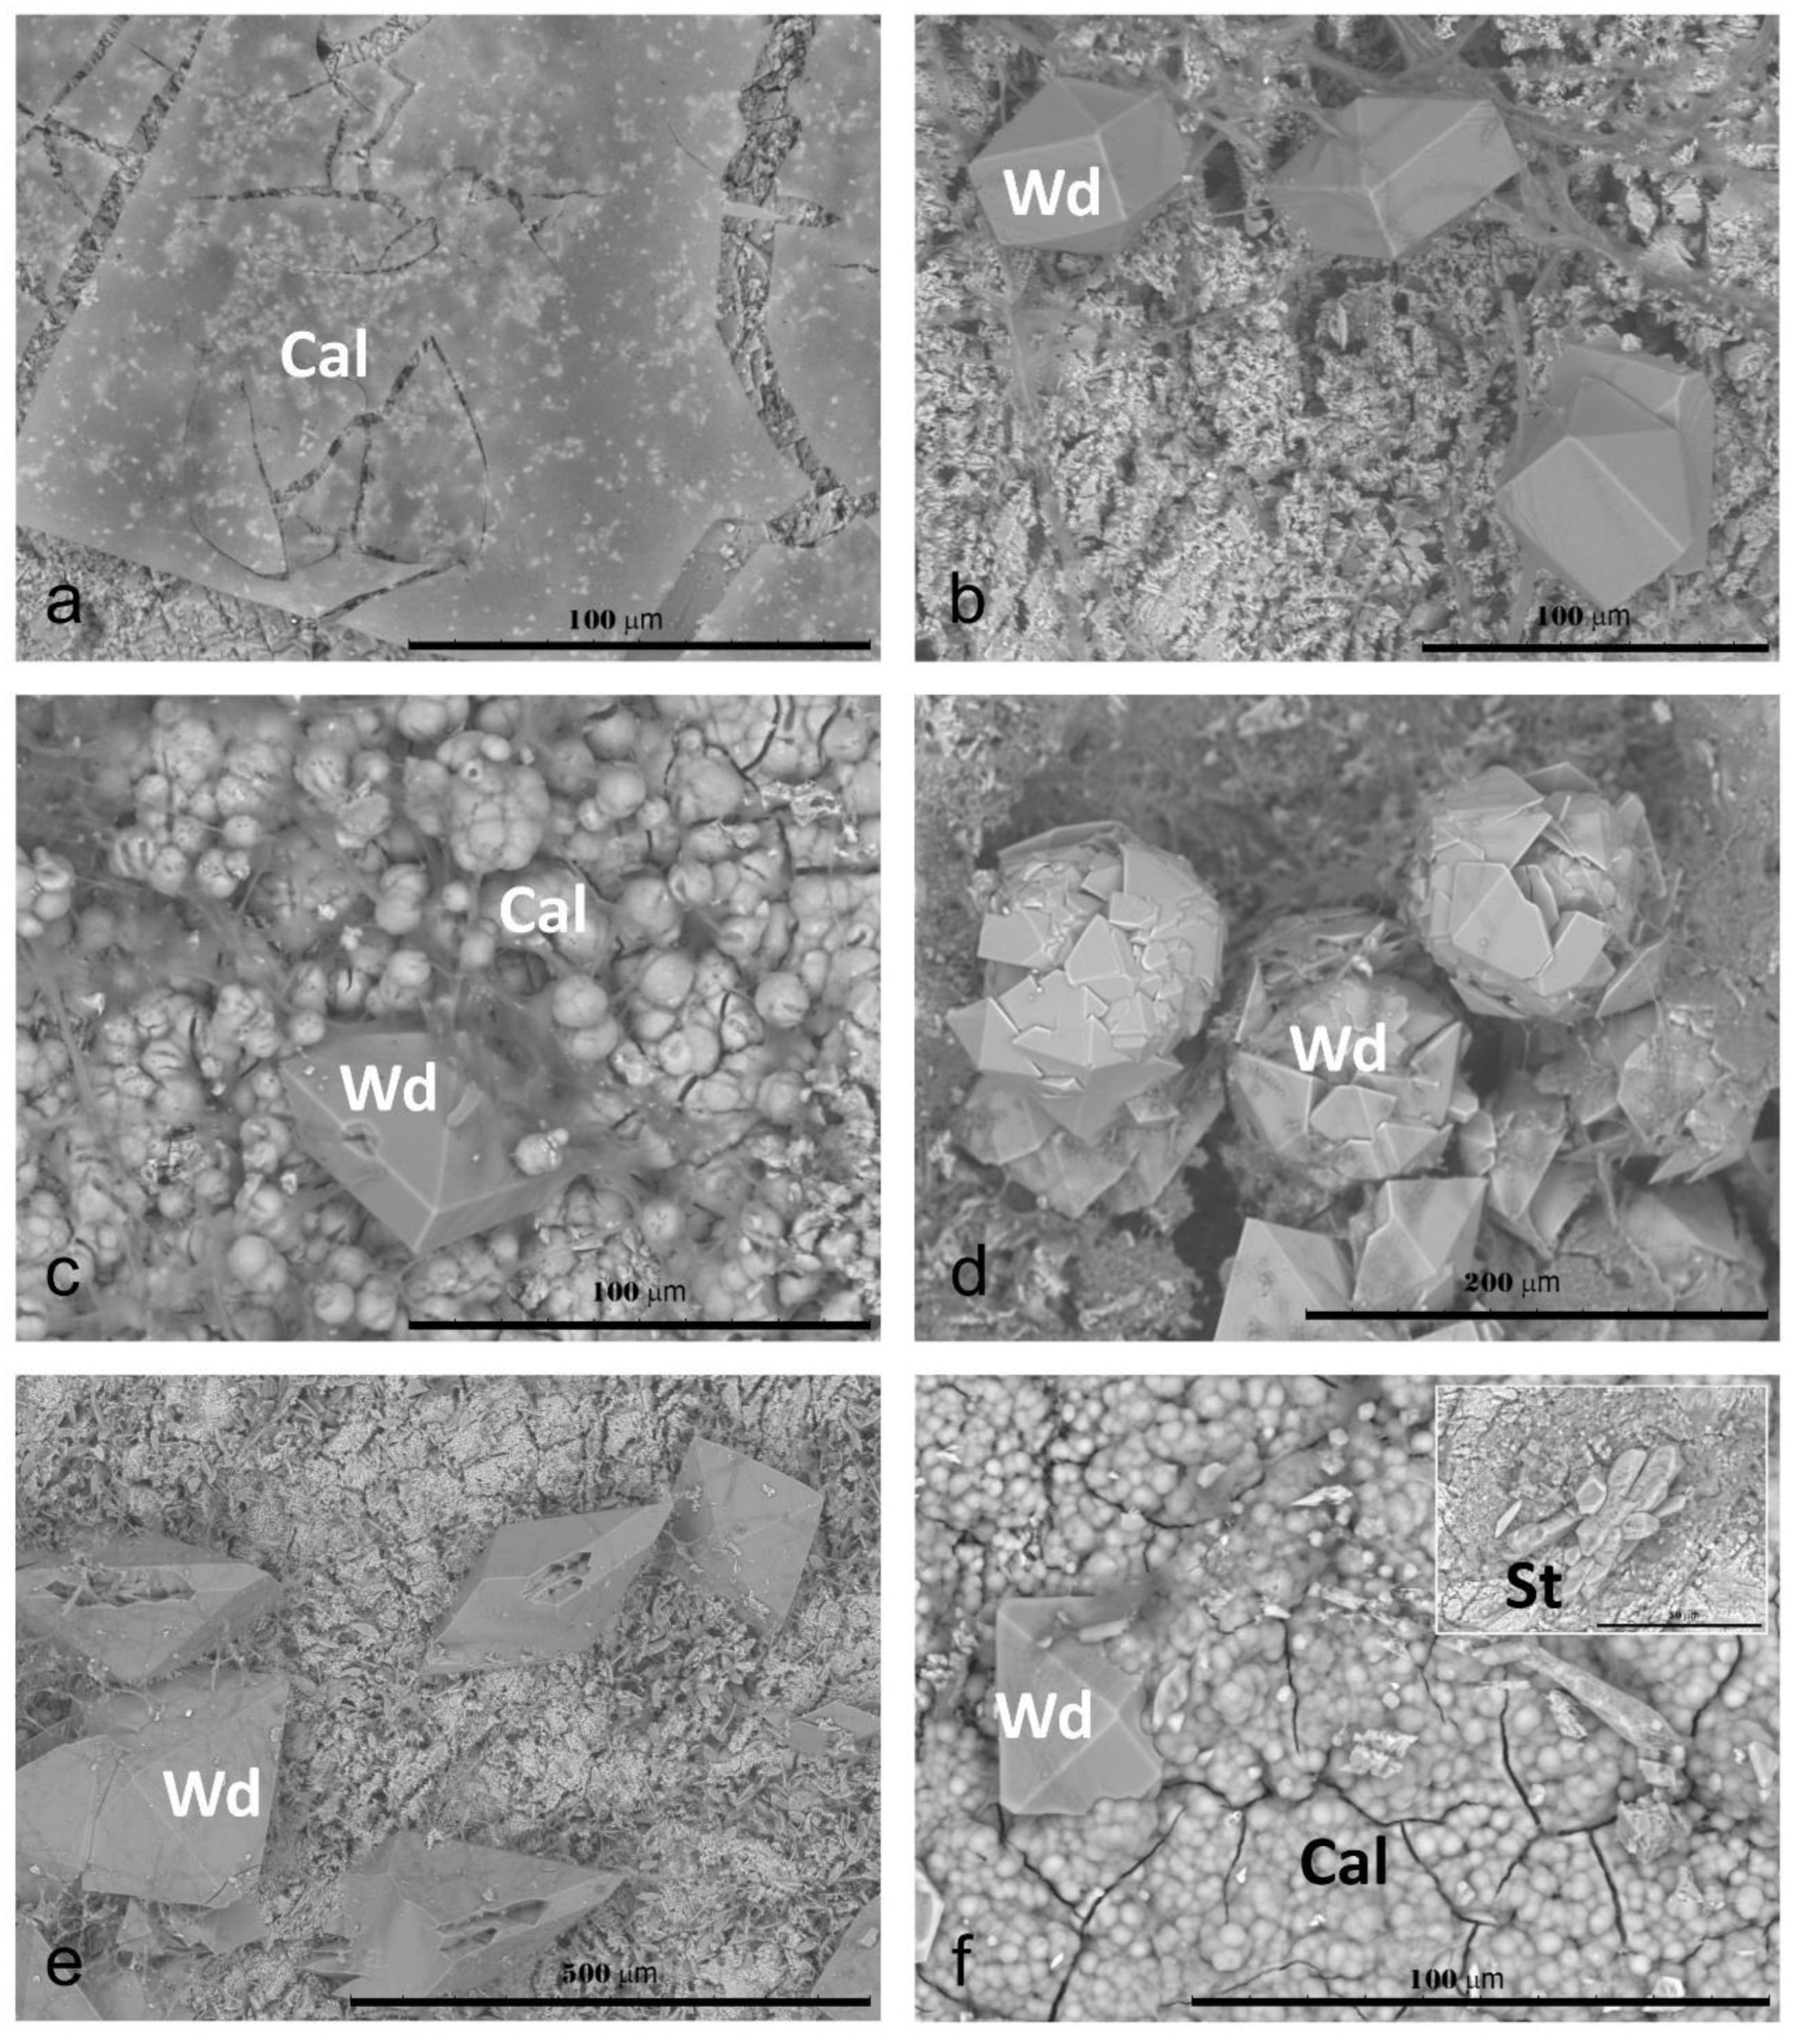
3.3. The Phase Composition and the Morphology of Crystals

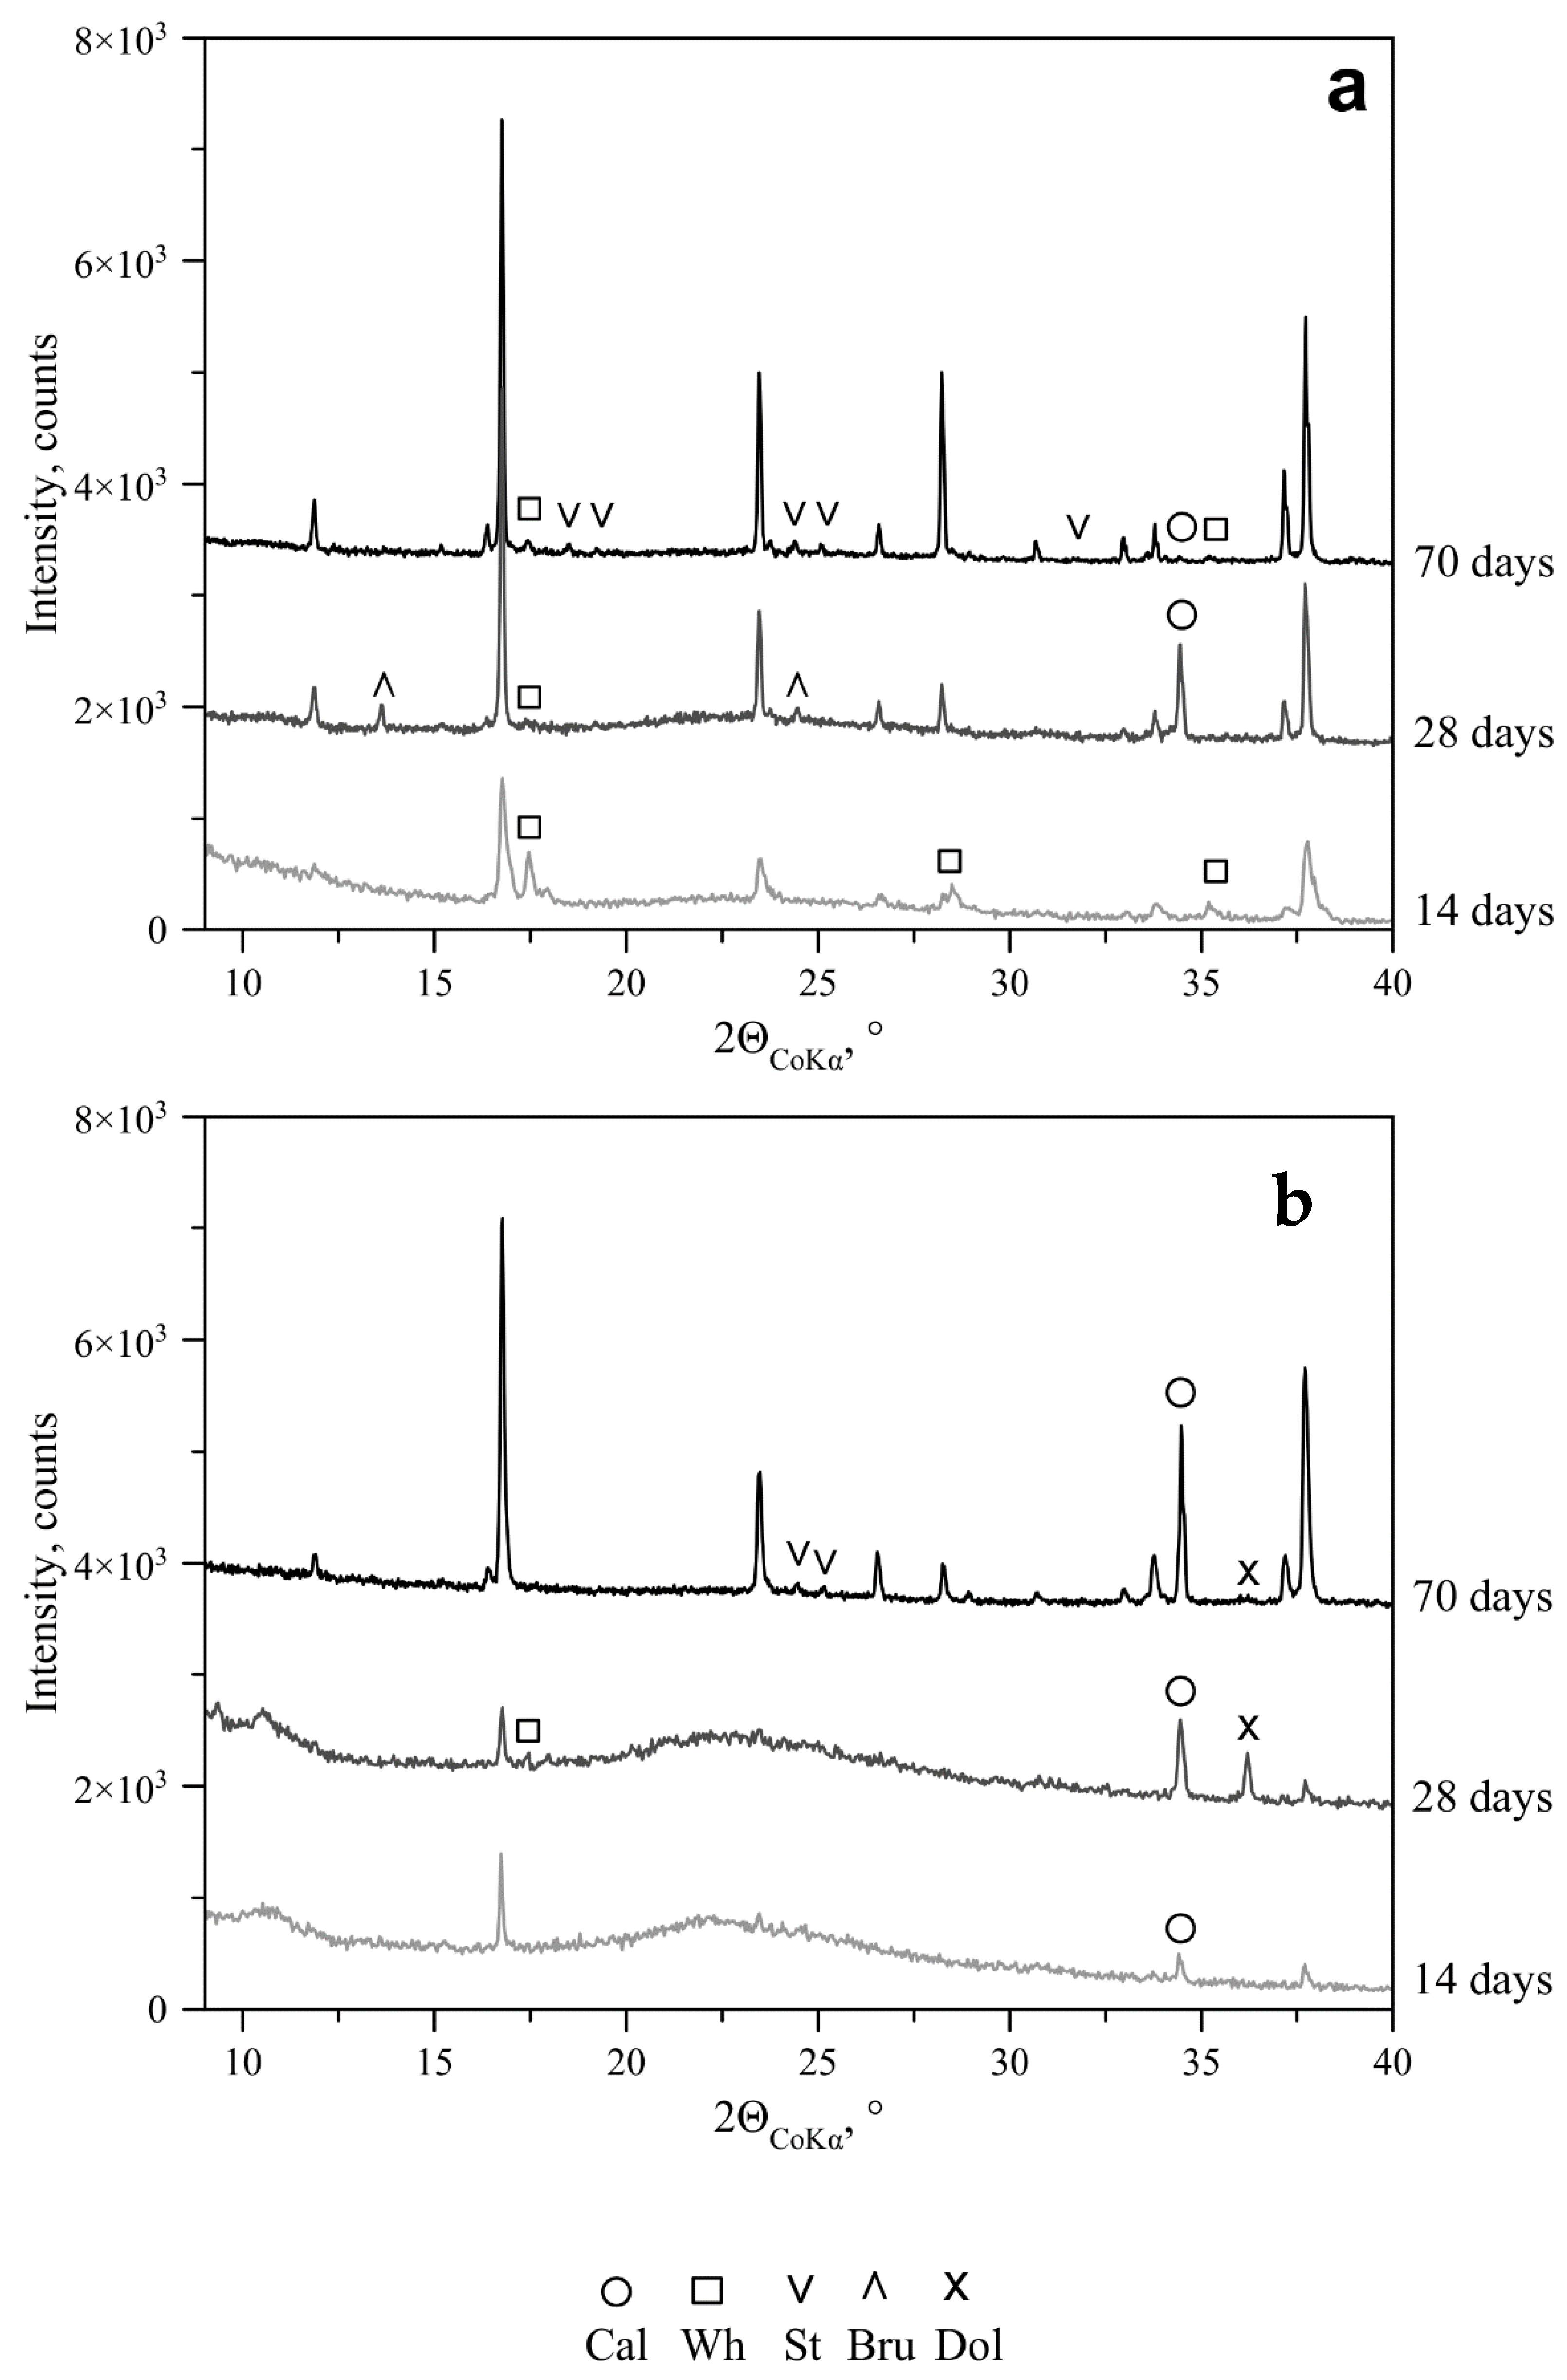
3.3.1. Experiments with P. chrysogenum
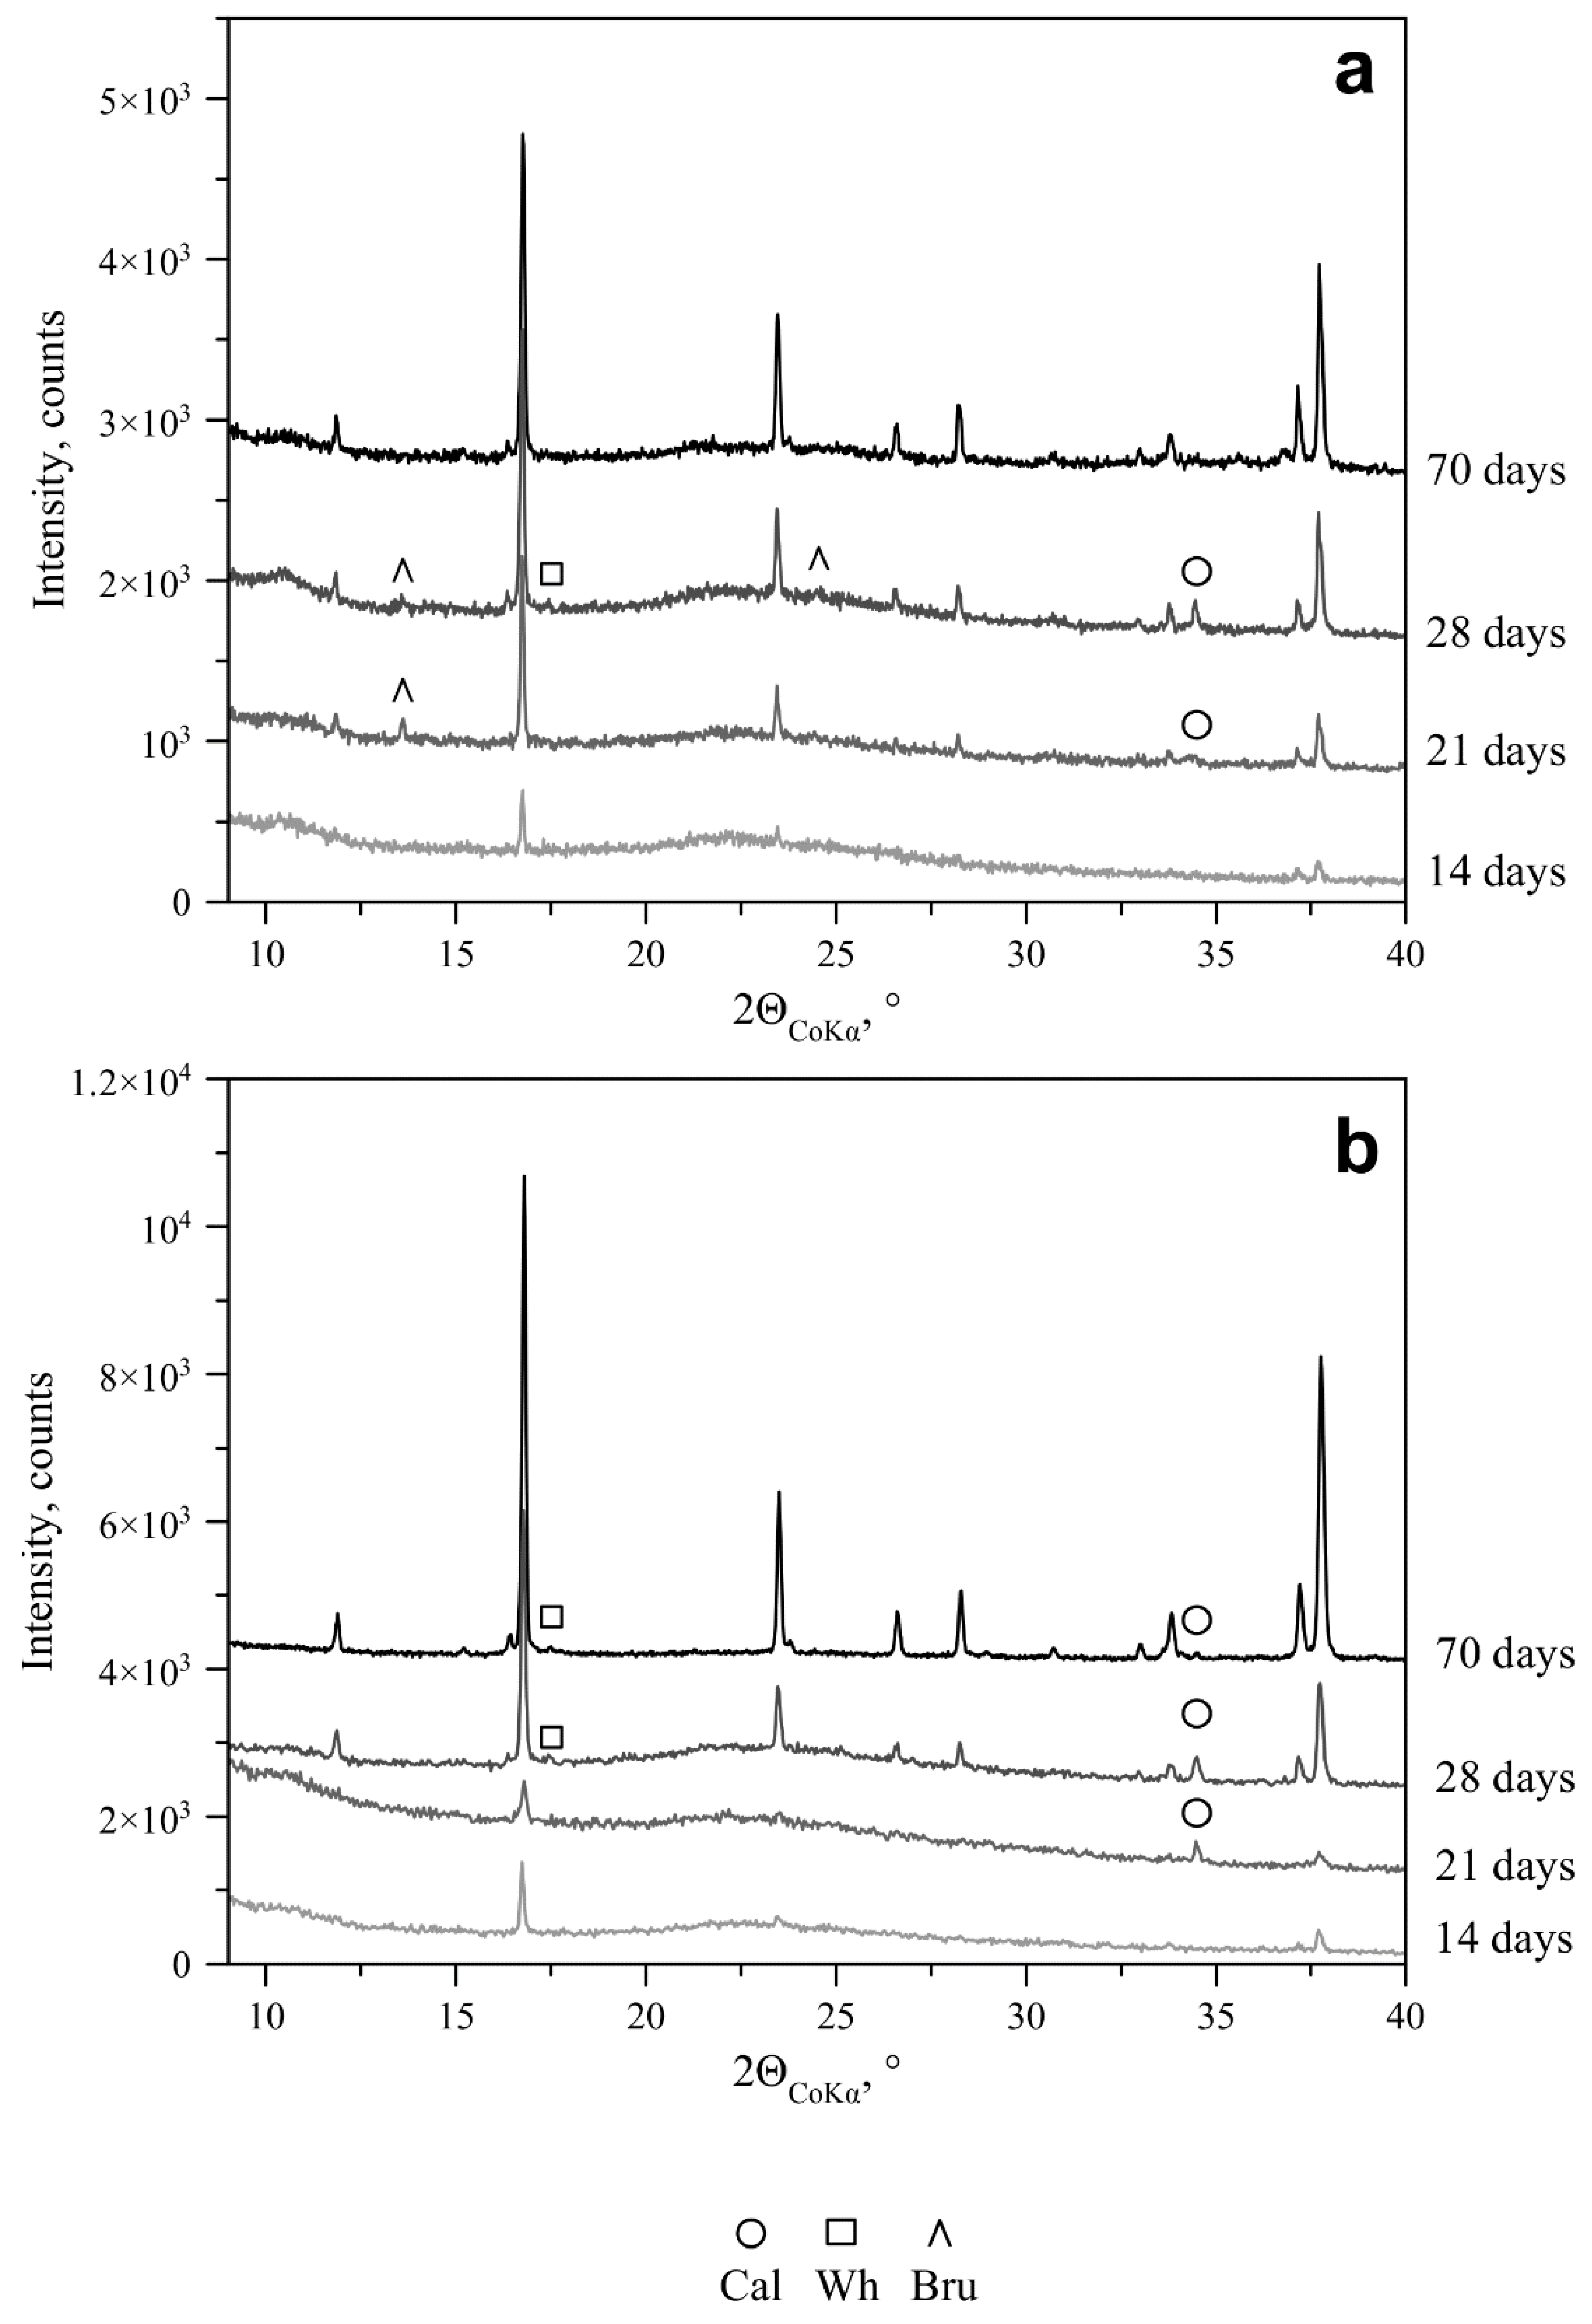
Under the action of the fungus P. chrysogenum, the dissolution of marble was observed throughout the whole experiment, which already became especially noticeable at a glucose content of 1 g/L on the 28th day. According to the results of the PXRD study, which were confirmed by the EDX data, at a glucose content of 1 g/L in the medium, in the mycelia growing on the marble surface, analogues of the following minerals were visible (Table 4): calcium phosphate brushite Ca(HPO4)·2H2O at pH = 6.5–6 (from 14 to 70 days, respectively), calcite at pH = 5.5–7 (on the 21st and 28th days) and calcium oxalate monohydrate whewellite CaC2O4·H2O at pH = 6 (on the 70th day, in small amounts). Brushite was also formed in the control experiment.
At a glucose content of 10 g/L, the phase composition of the crystals in the mycelium was much richer (Table 4, Figure 1a), which was supported by the SEM images as well (Figure 2). Calcium oxalates were observed throughout the experiment (from days 7 to 70) at pH = 6.25–5.5–6.5: calcium oxalate dihydrate weddellite CaC2O4·(2.5-x) H2O was observed in all experiments and whewellite (in a much smaller amounts) was observed only on the 14th, 28th and 70th days (Figure 2a).
In addition, the mycelium contained Mg-bearing calcite (Figure 2b,c), brushite and K-bearing magnesium and ammonium phosphate struvite (NH4, K) Mg(PO4)·6H2O (Figure 2d). The presence of magnesium in calcite and potassium in struvite was confirmed through EDX (inset in Figure 2d). According to PXRD, calcite was present in the mycelium on the 21st, 28th and 70th days at pH = 6, 5.5 and 6.5, respectively (Figure 1a), and, in the SEM images, a crust of calcite globules was visible only on the 28th and 70th days (Figure 2b,c).
Brushite was detected using a complex of methods on the 21st and 28th days of the experiment, and K-containing struvite was detected only on the 70th day.
At a glucose content of 30 g/L, the phase composition of the mycelium was very close to that observed at a glucose content of 10 g/L although the pH values differed significantly (up to 28 days lower and 70 days higher) (Table 4, Figure 1b). Weddellite and brushite were also common: they were recorded through PXRD from days 14 to 70 both in acidic and alkaline environments at pHs from 3.75 to 7 (Figure 2e). Additionally, whewellite (also at a significantly lower amount) was recorded only on the 28th day (at pH = 3.75). According to the PXRD data, calcite (as well as at a glucose content of 10 g/L) was detected in the mycelium on days 21, 28 and 70 at pHs from 3.75 to 7.0 (Table 4, Figure 1b), but the SEM images showed a calcite crust that was visible only on the 70th day of the experiment at pH = 7 (Figure 2f). Dolomite CaMg(CO3)2 was detected using the complex methods on the 28th and 70th days, and struvite –only on the 70th day (Figure 2f).
The morphology of the weddellite crystals and their sizes varied with the content of glucose in the medium and the duration of the experiment. At a concentration of glucose in the medium of 10 g/L, on the 14th day, the SEM images showed large dipyramidal crystals of weddellite (from 50 to 100 µm) and their intergrowths (Figure 2a); on the 21st day, the weddellite crystals had well-developed prism faces (the ratio of the prism faces to the pyramidal faces was ~1:1) and reached 50 μm. On the 70th day, both dipyramidal and dipyramidal–prismatic crystals of different generations (50–250 µm) were visible. The lamellar whewellite crystals present on the 14th, 21st and 28th days formed intergrowths ranging from 15 to 50 μm in size (Figure 2a).
The secondary calcite formed in the mycelium on the 28th day was represented by globules up to 5 µm in size which were aggregated into “crusts” and confined to the fungal hyphae (Figure 2b); on the 70th day, it became clear that the globules of the secondary calcite were spherical intergrowths of needle-like crystals (Figure 2c). Calcified fungal hyphae in the form of “tubes” were visible as well. Struvite, at this stage, was represented by large columnar crystals (Figure 2d). Brushite formed intergrowths of elongated tabular crystals (size of 50 to 250 μm).
At a glucose concentration of 30 g/L, the patterns of the changes in the morphology of the crystals over time were similar, but their evolution was faster. On the 14th day, weddellite crystals (50–60 µm in size) already had a very strongly developed prism face (the ratio of the prism face to the pyramid face was approximately 4 to 1 (Figure 2e)). On the 28th day, the large (up to 100 µm) dipyramidal–prismatic (pencil-like) crystals of weddellite in which the prism face was much more developed than the dipyramid face (the ratio was approximately 4 to 1), had signs of splitting. The crust of the secondary calcite globules on the 70th day of the experiment were thicker and denser (Figure 2f). Among the calcite globules, one could see crystals of weddellite and numerous intergrowths of columnar struvite crystals ranging in size from 10 to 30 µm (the size of an intergrowth reached 30–50 µm) (insert in Figure 2f).

3.3.2. Experiments with P. chrysogenumB. subtilis Association

The main difference between the phase composition of the mycelium formed on the surface of marble under the activity of the P. chrysogenumB. subtilis association and that which formed under the activity of the fungus P. chrysogenum manifested at a glucose concentration of 1 g/L: carbonates were formed in the case of the association rather than the oxalates formed in the case of monoculture (Table 5).
According to PXRD, calcite, at a glucose concentration of 1 g/L, was detected on days 14, 21 and 28 at pH = 6.5–7, respectively. The presence of a thin crust of secondary Mg-bearing calcite on day 14 was confirmed through SEM with the EDX data (Figure 3a). In addition, according to the PXRD data, brushite was found on days 7, 21 and 70, and struvite was found in a very small amount on day 21. At glucose concentrations of 10 and 30 g/L, the phase composition of the mycelium of the bacterial–fungal association in the range of 7 to 70 days (Figure 4) showed practically no differences compared to the composition of the mycelium in the monocultures of the fungus in the same time interval (Figure 2).
At a glucose content of 10 g/L, in the 7 to 70 day range, at pH = 5.5–8.0, weddellite was detected in all the experiments through XRPD and SEM (Figure 3b–d and Figure 4a), and whewellite was found in trace amounts on days 21 and 28. Calcite, according to the PXRD and SEM data, was found on days 21, 28 and 70 at pH of 6.5–8 (Figure 3c,d and Figure 4a); brushite was found from 14 to 28 days; and struvite, according to XRD (in a trace amounts), was found on day 70 (Figure 4a). At glucose concentrations of 30 g/L, the formation of oxalates began later (on the 14th day of the experiment) (Table 5, Figure 4b). Weddellite was present in the mycelium until the end of the experiment at pHs of 5.5–7.0, and whewellite was present in a smaller amount on days 14 (according to SEM), 21 and 28 (Figure 4b,e,f). Calcite was detected through PXRD on days 21, 28 and 70 (Figure 4b), but it was detected by SEM only on day 70 (Figure 3f). Brushite, according to SEM, was detected on the 21st and 70th days, and struvite was detected on the 70th day (inset in Figure 3f).
Weddellite was represented by dipyramidal–prismatic crystals of different generations (Figure 3b,c,e,f), which could grow on secondary calcite globules, forming composite spherical intergrowths (Figure 3d). The sizes of the weddellite crystals increased during growth and reached 250 µm on the 28th day at a glucose content of 30 g/L (Figure 3e). Starting at this moment, traces of dissolution were visible on the crystals. Whewellite crystallized in the form of small lamellar crystals (up to 25–30 µm). On the 70th day of the experiment, a very strong dissolution of the marble was seen as well as fungal hyphae encrusted with secondary calcite in the form of “tubes” (Figure 3f). Weddellite formed large and small, often split, crystals and intergrowths with traces of dissolution.

4. Discussion

4.1. The Effect of Trophic Conditions on the Growth and Metabolism of P. chrysogenum and the P. chrysogenum–B. subtilis Association

The results showed that the growth and metabolism of the fungus P. chrysogenum and the associations between P. chrysogenum and B. subtilis were significantly dependent on the trophic factor. The ability of P. chrysogenum to synthesize an EPS was revealed by us for the first time.
In both systems, as the glucose content increased from 1 to 30 g/L, the biomass, oxalic acid and the EPS increased (Table 1 and Table 2). Previously, we showed that, under the influence of a monoculture of B. subtilis, with an increase in the glucose content in the medium, the concentration of both the EPS and oxalic acid also increased (the EPS increased more intensively) [9]. Other organic acids (succinic, fumaric, malic, citric and gluconic acids) were extracted in both studied systems at glucose concentrations above 10 g/L and disappeared after cultivation for more than a month. The dynamics of the accumulation of these acids was consistent with the general patterns of the production of the organic acids by the fungi [23].
The weight of the P. chrysogenum biomass was lower than that of the P. chrysogenumB. subtilis association by no more than 25 wt%, highlighting the main role of the fungal mycelium in the biomass formation. The common regularity of the fungus and association was that, at significant glucose contents, the biomass practically stopped growing after ~20 days of cultivation. The phases of exponential and stationary growth were well pronounced with a sufficient glucose content, while they were practically absent in a glucose deficiency.

4.2. The Effect of the Microbial Metabolism on the pH

The line-up changes of the metabolites secreted by the bacteria and fungi (the oxalic acid and EPS concentrations) significantly affected the pH values of the cultivation medium (Table 1 and Table 2). In the monocultures of the fungus, during the month of cultivation (up to the moment of an abrupt increase in EPS), there was a significant inverse correlation between the pH values and the content of oxalic acid (Table 1, Figure 5a), which was not violated even due to the presence in the medium at a glucose content of 30 g/L, in addition to oxalic, of other organic acids. A slight alkalization at the beginning of the experiment (from 5.5 in the initial Czapek–Dox medium to 6.5 and 6.2 at 1 and 10 g/L of the glucose content, respectively) is typical for the fungi of the genus Penicilium and is probably associated with active ammonia secretion, which is the result of protease activation followed by the deamination of amino acids. Alkalinization of the medium, which occurred after ~1 month of cultivation at all the glucose contents but with different intensities, was accompanied by a slight decrease in the biomass, which indicated the beginning of autolysis processes. It is known that, in fungi, autolysis occurs at pH values between 6.8 and 8.2, and, generally, the protease activity increases during incubation [32]. This allowed us to make the assumption that the significant inverse correlation between the pH values and the concentrations of the EPS during the month of cultivation (Figure 5b) was due to the fact that the weakly alkaline environment was more favorable for the formation of the EPS by the microorganisms.
This assumption was supported by the fact that, as already mentioned above, when the processes of autolysis began after a month of cultivation, the EPS greatly increased (especially at a glucose content of 30 g/L) and alkalization of the medium occurred (pH increased) [10].
The analyzed dynamics of organic acid production and the related pH changes in the P. chrysogenum cultures were consistent with the previously obtained data on the general patterns of organic acid production by the fungi of the genus Penicillium [23,33] but differed from the dynamics of acid production and the pH changes in the A. niger cultures [9,19,23]. The dynamics of EPS production by this fungal species and its effect on pH have not been studied previously.
In the bacterial–fungal cocultures, the pH values were higher (Table 2). Maximum acidification of the medium (up to pH = 4.5) appeared only in the experiments with a glucose content of 30 g/L in which, in addition to oxalic acid, other organic acids were present (although their concentrations were no less than those in the fungus monocultures). In addition, in the association cultures, in contrast to the fungal monocultures, alkalization began earlier than after a month of cultivation and occurred at all the glucose contents. At a glucose content of 10 g/L, the pH increased as the content of oxalic acid increased in the medium (Figure 5c). As was shown earlier, the culture liquid of the B. subtilis monocultures became alkaline with the age of the cultures [9], which most likely affected the higher (compared to the monocultures of the fungus) pH values. At the same time, these experiments were characterized by a high content of the EPS.
The main difference between the metabolism in the cultures of P. chrysogenum and the P. chrysogenumB. subtilis association and the previously studied cultures of A. niger and the A. nigerB. subtilis association [9,19,23] lies in the fact that, in this experiment, the accumulation of the EPS occurred not only in the bacterial–fungal cocultures but also in the monocultures of the fungus. Unlike A. niger, P. chrysogenum did not acidify the medium that intensively: the pH of the culture liquid did not fall below 4, while A. niger was able to acidify the medium to pH values less than 3 [8,23]. Previously, it was shown that an acidic medium inhibited the formation of the EPS by the bacteria [9,25]. In the A. nigerB. subtilis association, under the influence of A. niger which intensively acidified the medium as the glucose content increased, the ability of the bacteria to produce the EPS was suppressed. The microorganisms of the studied association between P. chrysogenum and B. subtilis had a synergistic effect on the accumulation of the EPS since the fungus produced the EPS itself and promoted bacterial-induced processes, and, at the same time, it did not inhibit the release of the organic acids (primarily oxalic) by both organisms. As a result, under the action of the metabolic products of the P. chrysogenumB. subtilis association, as the glucose content and the cultivation time increased, a more alkaline medium accumulating both the EPS and oxalic acid was created.

4.3. The Effect of Trophic Conditions on the Crystallization by P. chrysogenum and the P. chrysogenum–B. subtilis Association on the Marble Surface

In the experiment, under the influence of the fungus P. chrysogenum and the association between P. chrysogenum and B. subtilis, the bioinspired analogs of the natural calcium oxalates (weddellite and whewellite), calcite and magnesium and ammonium phosphate (the struvite mineral) were obtained. The above-described influence of the trophic factor on the growth and metabolism of these organisms as well as the pH of the cultural liquid was reflected in the patterns of microbial crystallization (Figure 6).
The acidic medium in the cultures of P. chrysogenum (pH = 6.5–3.8) indicated conditions that were favorable for the formation of oxalates and unfavorable for the formation of carbonates during cultivation for a month (Table 4, Figure 6a).
At a glucose content of 1 g/L, the fungus culture grew slowly, and the necessary amounts of the biomass and oxalic acid for the start of oxalate crystallization and the formation of stable calcium oxalate monohydrate whewellite were created only after a month of cultivation when the pH = 6. It could be assumed that the absence of calcium oxalate dihydrate weddellite in the products of this synthesis was associated with a higher content of oxalic acid compared to calcium, which, as we showed earlier, led to the destabilization of weddellite [34]. With an increase in the glucose content to 10 g/L, similar amounts of the biomass and oxalic acid were already achieved on the 7th day. This led to earlier oxalate crystallization, which, at a glucose content of 10 g/L, occurred in a much narrower pH range (from 5.5 to 6.5) than it did at a glucose content of 30 g/L (from 3.75 to 7). The wide pH range in the syntheses at a glucose content of 30 g/L was well explained by the release of additional organic acids by the fungus in the syntheses from 7 to 28 days, which were no longer observed on the 70th day and which first led to a decrease in the pH to 3.8 and then to its increase to a neutral value.
In all the syntheses, calcium oxalate dihydrate weddellite was formed. The morphology of weddellite as the glucose content and the time of crystallization increased varied from dipyramidal to dipyramidal–prismatic (Figure 2a,e). The stabilization of this oxalate in the field of the stability of whewellite and an increase in the prism face of the weddellite crystals could be explained by an increase in the magnesium content in the crystallization medium, which came from the underlying rock [35]. In the syntheses at 30 g/L of glucose, this may also be due to the presence of additional organic acids, primarily citric acid [36].
In contrast to weddellite, whewellite was only sometimes observed in small quantities along with weddellite in the experiments with a glucose content of 10 g/L (Figure 2a). This could be explained by the successive processes of hydration and dehydration that often accompany the formation of oxalates in nature [37] and in model experiments with the participation of fungi [38].
The calcite detected through PXRD in the mycelium (Figure 1) was formed not only under the action of the fungus, but it also, partially, came from the underlying marble as a result of its dissolution. Therefore, we considered the biogenic (secondary) calcite found not only through PXRD but also in the SEM images in the shape of the characteristic globules and spherical intergrowths of calcite crystals that often encrust the fungal hyphae. The globules often merged into thin crusts, increasing in thickness with time (Figure 2b,c,f). Several calcite formations were registered through SEM at a glucose content of 10 g/L at slightly acidic pHs (5.5 and 6.5) at which calcite crystallization should not have occurred [9], as well as at a glucose content of 30 g/L at a neutral pH. The calcite formation in the syntheses with a glucose content of 10 g/L could be explained when assuming the heterogeneity of the medium in the cultures of the fungus, which could be neutral or slightly alkaline on the surface of the marble. That an acidic medium actually inhibited carbonate crystallization was clearly seen in the syntheses carried out at a glucose content of 30 g/L in which, during cultivation for a month, the medium was significantly acidified due to the release of the additional (in relation to oxalic) organic acids, and the formation of calcite did not occur.
A sharp increase in the EPS after a month of cultivation at a glucose content ≥ 10 g/L could be associated with the processes of mycelium autolysis at the late stages of growth accompanied by the deamination of amino acids and leading to the accumulation of ammonium. This assumption was confirmed by the formation at this stage and at pH = 6.5–7.0, together with calcite and calcium oxalates, of ammonium and magnesium phosphate as well as the analogue of the struvite mineral [39].
Generally, the experiments performed showed that, under the conditions closest to natural conditions (glucose content of 1 g/L), due to the effect of the fungus P. chrysogenum, oxalate crystallization occurred. Carbonate crystallization together with oxalate crystallization occurred at higher glucose concentrations and only those cases where fungi released only oxalic acid.
In experiments withthe bacterial-fungal association at different glucose concentration, the pH value changed from weakly acidic to weakly alkaline, which favored the formation of both oxalates and carbonates (Table 5, Figure 6b). Multidirectional changes in the pH with increasing oxalic acid contents (Figure 5c) were due to the different contributions of the bacteria and fungi to the crystallization processes at various glucose contents.
At a low glucose content (1 g/L), the effect of the bacterial metabolism prevailed. As the culture grew, the concentration of the EPS increased much faster than that of oxalic acid, which contributed to the creation of conditions that were favorable for carbonate crystallization (pH practically did not deviate from a neutral value) (Figure 3a). The lack of a phase formation at the end of the experiment (on day 70) could be explained by assuming that this was due to the local acidification of the environment, which contributed to the dissolution of calcite, and possibly to other phases.
With an increase in the glucose content, the situation changed: the contribution of the metabolism of the fungus to the crystallization processes increased, and they proceeded almost the same as in the fungus cultures. At the initial stages, in acidic media (at pH ≤ 6), calcium oxalates (mainly weddellite) were formed (Figure 3b,e). As the cultures grew, the media alkalized (Figure 5c), and, as soon as the pH became ≥ 6.5, calcite began to form along with oxalates (Figure 3c,d,f). At a glucose content of 30 g/L, it happened only on day 70 (Figure 3f), which was associated with the additional acidification of the medium by the malic, succinic, citric, gluconic and fumaric acids along with oxalic acid secreted by the fungus.
At the end of the experiment, with a glucose content of 10 g/L in a bacterial–fungal association culture, along with the typical globules of acicular calcite crystals, unusual spherical weddellite–calcite formations with core-shell structures on the marble surface were found. These composite formations represented pseudomorphosis of weddellite after the spherulite-like intergrowths of calcite crystals (Figure 3d). The presence of pseudomorphs suggested that, at some point, for an unknown reason, the composition of the metabolic products of the microbial association changed (for example, an intensive release of oxalic acid in B. subtilis began) and that the medium became acidic and unfavorable for carbonate crystallization (only weddellite was formed).
The favorable conditions for struvite formation in a bacterial–fungal association were not only at the late stages of the cultivation (at a glucose content ≥ 10 and 30 g/L) but also at a glucose content of 1 g/L. The question of what processes resulted in the formation of ammonium at this stage remains open.
The patterns of crystallization under the action of the P. chrysogenumB. subtilis association significantly differed from those studied by us earlier under the influence of the A. nigerB. subtilis association [9,19,23]. The association between P. chrysogenum and B. subtilis had a synergistic effect on EPS accumulation, which contributed to the alkalization of the medium and promoted carbonate crystallization. The replacement of the fungus P. chrysogenum with A. niger, an active producer of oxalic acid that is unable to release an EPS, led to a significant acidification of the medium with an increase in the glucose content, which suppressed the release of the EPS by the bacterium and, accordingly, carbonate crystallization.
Generally, the model experiments showed that the patterns of crystallization occurring on the marble under the influence of the fungus P. chrysogenum and the bacterial-fungal association between P. chrysogenum and B. subtilis were similar, but there were also fundamental differences (Figure 6). Under the action of the B. subtilis metabolism, the culture medium was alkalized, and more favorable conditions for carbonate crystallization were created. As a result, carbonate crystallization in the association cultures started at a lower glucose content compared with oxalate. At higher glucose concentrations, oxalate crystallization, like that in the fungal monocultures, preceded carbonate crystallization. However, compared to the fungal monoculture, it began at an earlier cultivation stage. In whole, in the bacterial–fungal associations, as the glucose content increased, the contribution of the bacterium to the crystallization processes became weaker compared to that of the fungus.

5. Conclusions

The experiments performed showed that the transition from the crystallization of oxalates to carbonates and vice versa (the simultaneous crystallization of oxalates and carbonates was also possible) could occur with a change in the species composition of the lithobiotic microbial community (in our case, during the transition from the monocultures of the fungus P. chrysogenum to the bacterial–fungal association P. chrysogenumB. subtilis) as well as when the nutritional value of the medium changed (in our case, when the glucose content changed).
Both in the P. chrysogenum fungus monocultures and in the P. chrysogenumB. subtilis bacterial–fungal association, the biomass, oxalic acid and EPS increased due to an increase in the glucose content and cultivation time. However, under the action of the bacterial–fungal association, the culture medium was alkalized, and more favorable conditions for carbonate crystallization were created. The results obtained could be used to reveal the role of fungi and bacteria in the oxalate–carbonate pathway.

Author Contributions

Conceptualization, D.Y.V., O.V.F.-K. and K.V.S.; investigation, K.V.S., M.S.Z., A.R.I. and A.V.K.; methodology, K.V.S., M.S.Z., D.Y.V. and O.V.F.-K.; visualization, A.R.I., M.S.Z. and A.V.K.; writing—original draft preparation, K.V.S. and M.S.Z.; writing—review and editing, A.V.K., D.Y.V. and O.V.F.-K. All authors have read and agreed to the published version of the manuscript.

Funding

The research was funded by the Russian Science Foundation (grant 19-17-00141).

Data Availability Statement

Not applicable.

Acknowledgments

The laboratory research was carried out in the Research Resource Centers of Saint Petersburg State University: the SEM and EDX investigations were carried out in the Resource Centers “Resource Centers Microscopy and Microanalysis” and “Nanotechnology”, and the XRD measurements were carried out in the X-ray Diffraction Centre.

Conflicts of Interest

The authors declare no conflict of interest.

References

  1. Rousk, J.; Bengtson, P. Microbial regulation of global biogeochemical cycles. Front. Microbiol. 2014, 5, 103. [Google Scholar] [CrossRef] [Green Version]
  2. Gadd, G.M. Metals, minerals and microbes: Geomicrobiology and bioremediation. Microbiology 2010, 156, 609–643. [Google Scholar] [CrossRef]
  3. Boniek, D.; MendesIsolda, I.C.; Abreu, C.M.; Abreu, O.C.; Show, O.; Stoianoff, M.A.R. Ecology and identification of environmental fungi and metabolic processes involved in the biodeterioration of Brazilian soapstone historical monuments. Lett. Appl. Microbiol. 2017, 65, 431–438. [Google Scholar] [CrossRef]
  4. Warscheid, T.; Braams, J. Biodeterioration of stone: A review. Int. Biodeterior. Biodegrad. 2000, 46, 343–368. [Google Scholar] [CrossRef]
  5. Bravo, D.; Martin, G.M.; Cailleau, G.; Verrecchia, E.; Junier, P. Identification of active oxalotrophic bacteria by Bromodeoxyuridine DNA-labeling in a microcosm soil experiments. FEMS Microbiol. Lett. 2013, 348, 103–111. [Google Scholar] [CrossRef] [Green Version]
  6. Syed, S.; Buddolla, V.; Lian, B. Oxalate Carbonate Pathway—Conversion and Fixation of Soil Carbon—A Potential Scenario for Sustainability. Front. Plant Sci. 2020, 11, 591297. [Google Scholar] [CrossRef]
  7. Verrecchia, E.P.; Braissant, O.; Cailleau, G. The oxalate–carbonate pathway in soil carbon storage: The role of fungi and oxalotrophic bacteria. In Fungi in Biogeochemical Cycles; Gadd, G.M., Ed.; Cambridge University Press: Cambridge, UK, 2006; pp. 289–310. [Google Scholar] [CrossRef]
  8. Gupta, A.; Gupta, R.; Singh, R.L. Microbes and Environment. Princ. Appl. Environ. Biotechnol. A Sustain. Future 2016, 15, 43–84. [Google Scholar] [CrossRef]
  9. Sazanova, K.V.; Frank-Kamenetskaya, O.V.; Vlasov, D.Y.; Zelenskaya, M.S.; Vlasov, A.D.; Rusakov, A.V.; Petrova, M.A. Carbonate and Oxalate Crystallization by Interaction of Calcite Marble with Bacillus subtilis and Bacillus subtilis–Aspergillus niger Association. Crystals 2020, 10, 756. [Google Scholar] [CrossRef]
  10. Konopka, A. What is microbial community ecology? ISME J. 2009, 3, 1223–1230. [Google Scholar] [CrossRef]
  11. Bengtsson-Palme, J. Microbial model communities: To understand complexity, harness the power of simplicity. Comput. Struct. Biotechnol. J. 2020, 18, 3987–4001. [Google Scholar] [CrossRef]
  12. Gralka, M.; Szabo, R.; Stocker, R.; Cordero, O.X. Trophic Interactions and the Drivers of Microbial Community Assembly. Curr. Biol. 2020, 30, 1176–1188. [Google Scholar] [CrossRef]
  13. Achal, V.; Mukherjee, A. A review of microbial precipitation for sustainable construction. Constr. Build. Mater. 2015, 93, 1224–1235. [Google Scholar] [CrossRef]
  14. Wang, R.; Qian, C. In situ restoration of the surface defects on cement-based materials by bacteria mineralization with spraying method. J. Wuhan Univ. Technol.-Mat. Sci. Ed. 2014, 29, 518–526. [Google Scholar] [CrossRef]
  15. Dejong, J.T.; Fritzges, M.B.; Nüsslein, K. Microbially induced cementation to control sand response to undrained shear. J. Geotech. Geoenviron. Eng. 2006, 132, 1381–1392. [Google Scholar] [CrossRef]
  16. Reeder, R.J.; Lamble, G.M.; Northrup, P.A. XAFS study of the coordination and local relaxation around Co2+, Zn2+, Pb2+, and Ba2+, trace elements in calcite. Am. Mineral. 1999, 84, 1049–1060. [Google Scholar] [CrossRef]
  17. Kumari, D.; Quan, X.-Y.; Pan, X.; Achal, V.; Li, Q.; Gadd, G.M. Microbially-induced Carbonate Precipitation for Immobilization of Toxic Metals. Adv. Appl. Microbiol. 2016, 94, 79–108. [Google Scholar] [CrossRef] [Green Version]
  18. Lin, W.; Huang, Z.; Li, X.; Liu, M.; Cheng, Y. Bio-remediation of acephate-Pb(II) Compound Contaminants by Bacillus Subtilis FZUL-33. J. Environ. Sci. 2016, 45, 94–99. [Google Scholar] [CrossRef]
  19. Sturm, E.V.; Frank-Kamenetskaya, O.V.; Vlasov, D.Y.; Zelenskaya, M.S.; Sazanova, K.V.; Rusakov, A.V.; Kniep, R. Crystallization of calcium oxalate hydrates by interaction of calcite marble with fungus Aspergillus niger. Am. Mineral. 2015, 100, 2559–2565. [Google Scholar] [CrossRef]
  20. Dutton, M.V.; Evants, C.S. Oxalate production by fungi: Its role in pathogenicity and ecology in the soil environment. Can. J. Microbiol. 1996, 42, 881–895. [Google Scholar] [CrossRef]
  21. Minir, E.; Yoon, J.; Tokimatsu, T.; Shimada, M. A physiological role for oxalic acid biosynthesis in the wood-rotting basidiomycete Fomitopsis palustris. Proc. Natl. Acad. Sci. USA 2001, 98, 11126–11130. [Google Scholar] [CrossRef] [Green Version]
  22. Schilling, J.S.; Jellison, J. Oxalate regulation by two brown rot fungi decaying oxalate-amended and non-amended wood. Holzforschung 2005, 59, 681–688. [Google Scholar] [CrossRef]
  23. Sazanova, K.V.; Vlasov, D.Y.; Osmolovskay, N.G.; Schiparev, S.M.; Rusakov, A.V. Significance and regulation of acids production by rock-inhabited fungi. In Biogenic-Abiogenic Interactions in Natural and Anthropogenic Systems; Frank-Kamenetskaya, O.V., Panova, E.G., Vlasov, D.Y., Eds.; Springer International Publishing: Cham, Switzerland, 2016; pp. 379–392. [Google Scholar] [CrossRef]
  24. Guggiari, M.; Bloque, R.; Aragno, M.; Verrecchia, E.; Job, D.; Junier, P. Experimental calcium-oxalate crystal production and dissolution by selected wood-rot fungi. Int. Biodeterior. Biodegrad. 2011, 65, 803–809. [Google Scholar] [CrossRef] [Green Version]
  25. Zhu, T.; Dittrich, M. Carbonate Precipitation through Microbial Activities in Natural environment, and Their Potential in Biotechnology: A Review. Front. Bioeng. Biotechnol. 2016, 4, 4. [Google Scholar] [CrossRef] [Green Version]
  26. Anbu, P.; Kang, C.-H.; Shin, Y.-J.; Socorresponding, J.-S. Formations of calcium carbonate minerals by bacteria and its multiple applications. Springerplus 2016, 5, 250. [Google Scholar] [CrossRef] [Green Version]
  27. Sazanova, K.; Osmolovskaya, N.; Schiparev, S.; Yakkonen, K.; Kuchaeva, L.; Vlasov, D. Organic acids induce tolerance to zinc- and copper-exposed fungi under various growth conditions. Curr. Microbiol. 2015, 70, 520–527. [Google Scholar] [CrossRef]
  28. Fang, C.; Kumari, D.; Zhu, X.; Achal, V. Role of fungal-mediated mineralization in biocementation of sand and its improved compressive strength. Int. Biodeterior. Biodegrad. 2018, 133, 216–220. [Google Scholar] [CrossRef]
  29. Mahapatra, S.; Banerjee, D. Fungal exopolysaccharide: Production, composition and applications. Microbiol. Insights 2013, 6, 1MBI-S10957. [Google Scholar] [CrossRef] [Green Version]
  30. Doyle, J.J.; Doyle, J.L. A rapid DNA isolation procedure for small quantities of fresh leaf tissue. Phytochem. Bull. 1987, 19, 11–15. [Google Scholar]
  31. White, T.J.; Bruns, T.; Lee, S.; Taylor, J. Amplification and direct sequencing of fungal ribosomal RNA genes for phylogenetics. In PCR Protocols: A Guide to Methods and Applications; Innis, M.A., Gelfand, D.H., Sninsky, J.J., White, T.J., Eds.; Academic Press: London, UK, 1990; pp. 315–322. [Google Scholar]
  32. Santamaria, F.; Reyes, F. Proteases produced during autolysis of filamentous fungi. Trans. Br. Mycol. Soc. 1988, 91, 217–220. [Google Scholar] [CrossRef]
  33. Ghorbani, Y.; Oliazadeh, M.; Shahvedi, A.; Roohi, R.; Pirayehgar, A. Use of some isolated fungi in biological Leaching of Aluminum from low grade bauxite. Afr. J. Biotechnol. 2007, 6, 1284–1288. [Google Scholar]
  34. Kuz’mina, M.A.; Rusakov, A.V.; Frank-Kamenetskaya, O.V.; Vlasov, D.Y. The influence of inorganic and organic components of biofilms with microscopic fungi on the phase composition and morphology of crystallizing calcium oxalates. Crystallogr. Rep. 2019, 64, 161–167. [Google Scholar] [CrossRef]
  35. Frank-Kamenetskaya, O.V.; Ivanyuk, G.Y.; Zelenskaya, M.S.; Izatulina, A.R.; Kalashnikov, A.O.; Vlasov, D.Y.; Polyanskaya, E.I. Calcium Oxalates in Lichens on Surface of Apatite-Nepheline Ore (Kola Peninsula, Russia). Minerals 2019, 9, 656. [Google Scholar] [CrossRef] [Green Version]
  36. Rusakov, A.; Kuzmina, M.; Frank-Kamenetskaya, O. Biofilm Medium Chemistry and Calcium Oxalate Morphogenesis. Molecules 2021, 26, 5030. [Google Scholar] [CrossRef]
  37. Frank-Kamenetskaya, O.V.; Zelenskaya, M.S.; Izatulina, A.R.; Vereshchagin, O.S.; Vlasov, D.Y.; Himelbrant, D.E.; Pankin, D.V. Copper oxalate formation by lichens and fungi. Sci. Rep. 2021, 11, 24239. [Google Scholar] [CrossRef]
  38. Frank-Kamenetskaya, O.V.; Zelenskaya, M.S.; Izatulina, A.R.; Gurzhiy, V.V.; Rusakov, A.V.; Vlasov, D.Y. Oxalate formation by Aspergillus niger on manganese ore minerals. Am. Mineral. 2022, 7, 100–109. [Google Scholar] [CrossRef]
  39. Alkan, N.; Espeso, E.A.; Prusky, D. Virulence Regulation of Phytopathogenic Fungi by pH. Antioxid. Redox Signal. 2013, 19, 1012–1025. [Google Scholar] [CrossRef]
Figure 1. Powder X-ray patterns of crystals in mycelium of P. chrysogenum formed on marble surface in experiments with various glucose contents: (a)—10 g/L—and (b)—30 g/L. Unmarked diffraction peaks belong to weddellite. Here and in Figure 2, Figure 3 and Figure 4: Dol—dolomite, Bru—brushite, St—struvite, Wd—weddellite, Wh—whewellite, and Cal—calcite.
Crystals 13 00094 g001
Figure 2. SEM images of crystals and their intergrowths formed on the surface of marble under the activity of P. chrysogenum in a liquid medium at different glucose contents: (a)—intergrowths of lamellar whewellite as well as crystals and dipyramidal crystals of weddellite (glucose content of 10 g/L, 14 days), (b)—globules of secondary calcite on fungal hyphae (glucose content of 10 g/L, 28 days), (c)—large spherical intergrowths of acicular calcite crystals and calcified fungal hyphae (glucose content of 10 g/L, 70 days), (d)—columnar struvite crystals (glucose content of 10 g/L, 70 days), (e)—numerous weddellite crystals with strongly developed prism faces (glucose content of 30 g/L, 14 days), (f)—a dense crust of secondary calcite globules containing weddellite crystals and intergrowths of struvite crystals (glucose content of 30 g/L, 70 days).
Crystals 13 00094 g002
Figure 3. SEM images of crystals and intergrowths formed on the marble surface under activity of P. chrysogenumB. subtilis association at different glucose contents: (a)—thin crust of globules of secondary calcite (glucose content of 1 g/L, 14 days), (b)—dipyramidal–prismatic crystals of weddellite (10 g/L, 14 days), (c)—crust of spherical globules of secondary calcite containing dipyramidal–prismatic crystals of weddellite (10 g/L, 21 days), (d)—split crystals of weddellite and calcite–weddellite spherical aggregates (10 g/L, 70 days), (e)—large weddellite crystals with traces of dissolution (30 g/L, 28 days); (f)—fungal hyphae encrusted with secondary calcite and numerous dipyramidal weddellite crystals of various sizes (30 g/L, 70 days).
Crystals 13 00094 g003
Figure 4. Powder X-ray diagrams of crystal phases in mycelium of P. chrysogenumB. subtilis association on marble surface in experiments with different glucose contents: (a)—10 g/L—and (b)—30 g/L. Unsigned diffraction peaks belong to weddellite.
Crystals 13 00094 g004
Figure 5. The correlations between pH and components of the cultivation medium: (a)—oxalic acid in P. chrysogenum, (b)—EPS in P. chrysogenum—and (c)—oxalic acid in P. chrysogenumB. subtilis association.
Crystals 13 00094 g005
Figure 6. pH variations and phase formations under the action of microorganisms: (a)—fungus P. chrysogenum—and (b)—P. chrysogenumB. subtilis association. Glucose content: blue—1, green—10—and red—30 g/L. Wd—weddellite, Wh—whewellite, St—struvite, Сal—calcite; Crystals 13 00094 i001—initial pH of Czapek–Dox medium.
Crystals 13 00094 g006
Table 1. Biomass, metabolic products and pH values of P. chrysogenum cultures in liquid medium at various glucose concentrations.
DaysGlucose Concentrations, g/L
11030
Biomass,
g/100 mL
EPS, μg/mLOxalic acid, μg/mLpHBiomass,
g/100 mL
EPS, μg/mLOxalic Acid, μg/mLpHBiomass,
g/100 mL
EPS, μg/mLOxalic Acid, μg/mLpH
70.03tracetrace6.50.28 trace32.4 ± 7.46.20.231080 ± 9664.1 ± 0.64.5
140.080.033.8 ± 0.46.50.41trace82.6 ± 9.26.00.501550 ± 62386.5 ± 12.94.2
210.160.055.8 ± 0.96.50.54510 ± 29153.3 ± 11.136.00.751680 ± 85452.6 ± 22.93.8
280.23220 ± 189.9 ± 0.66.00.56550 ± 35224.7 ± 9.05.50.8230,240 ± 2004474.8 ± 34.13.9
700.27388 ± 5838.4 ± 3.86.00.461183 ± 2083311.3 ± 27.06.50.7458,046 ± 4008436.0 ± 24.87.0
Table 2. Metabolic products, biomass and pH values of P. chrysogenumB. subtilis cultures in liquid medium at various glucose concentrations.
DaysGlucose Concentrations, g/L
11030
Biomass, g/100 mLEPS, μg/mLOxalic Acid, μg/mLpH Biomass, g/100 mLEPS, μg/mLOxalic Acid, μg/mLpHBiomass, g/100 mLEPS, μg/mLOxalic Acid, μg/mLpH
70.02330 ± 160.057.00.23690 ± 3744.6 ± 6.85.50.241180 ± 5474.1 ± 1.54.5
140.08360 ± 214.7 ± 0.76.50.48810 ± 5192.3 ± 7.95.70.582450 ± 71414.8 ± 18.15.5
210.09460 ± 286.3 ± 0.47.20.58950 ± 44184.2 ± 9.26.50.783930 ± 144464.1 ± 24.75.0
280.29570 ± 3310.2 ± 0.67.00.61870 ± 58286.2 ± 12.97.20.8355,400 ± 3008516.7 ± 38.86.2
700.30601 ± 5241.1 ± 8.57.00.581834 ± 178334.6 ± 18.88.00.8064,300 ± 8734480.1 ± 32.27.0
Table 3. Organic acids produced by P. chrysogenum and P. chrysogenumB. subtilis associations in liquid medium at glucose concentrations of 30 g/L (oxalic acid is presented above in Table 1 and is not shown here).
DaysCultureAcid Concentrations, μg/mL *
GluconicCitricFumaricMalicSuccinic
7P.chrysogenum90.1 ± 7.17.8 ± 0.41.2 ± 0.3trace3.4 ± 0.4
P. chrysogenumB. subtilis120.8 ± 9.19.4 ± 1.13.1 ± 0.4trace8.4 ± 0.9
14P.chrysogenum40.8 ± 3.420.8 ± 3.09.5 ± 0.81.8 ± 0.317.4 ± 1.1
P. chrysogenumB. subtilis64.4 ± 5.018.7 ± 4.414.8 ± 0.91.7 ± 0.332.5 ± 4.0
21P.chrysogenum0.21 ± 0.041.8 ± 0.041.8 ± 0.33.8 ± 0.43.3 ± 0.4
P. chrysogenumB. subtilis1.9 ± 0.35.2 ± 0.081.1 ± 0.23.4 ± 0.71.4 ± 0.2
28P.chrysogenum0.09 ± 0.021.3 ± 0.041.0 ± 0.14.0 ± 0.30.4 ± 0.07
P. chrysogenumB. subtilis0.14 ± 0.030.11 ± 0.020.3 ± 0.024.4 ± 0.50.13 ± 0.03
70P.chrysogenumnot foundnot foundnot foundnot foundnot found
P. chrysogenumB. subtilisnot foundnot foundnot foundnot foundnot found
* oxalic acid is presented above (Table 1) and not shown here.
Table 4. Phase composition of crystals in mycelium of P. chrysogenum formed on the surface of marble in vitro.
DaysGlucose Content, g/L
1 10 30
Phase CompositionpHPhase CompositionpHPhase CompositionpH
7not found6.5Wd6.25not found4.5
14Bru6.5Wd > Wh6Wd, Bru4.25
21Bru, Cal6.5Wd, Bru,
Cal (trace)
6.0Wd, Bru, Cal3.75
28Bru, Cal6.0Wd > Wh,
Cals, Bru
5.5Wd > Wh,
Bru (trace), Cal,
Dol
3.75
70Bru, Wh (trace)6.0Wd > Wh,
Cals, St
6.5Wd, Cals, Dol,
Bru, St
7.0
Notes: here and in Table 5, the following designations are Dol—dolomite, Bru—brushite, St—struvite, Wd—weddellite, Wh—whewellite, Cal—calcite—and Cals—secondary biogenic calcite.
Table 5. Phase composition of mycelium formed in vitro on the marble surface by P. chrysogenumB. subtilis association.
DaysGlucose Content, g/L
11030
Phase CompositionpHPhase CompositionpHPhase CompositionpH
7Br7.0Wd (trace)5.5Not found4.5
14Cals *6.5Wd, Bru5.75Wd > Wh *5.5
21Cals, Bru, St7.25Wd > Wh *, Bru, Cals (trace)6.5Wd, Bru, Cal (trace)5.0
28Cals7.0Wd > Wh,
Bru, Cals
7.25Wd > Wh,
Cals *
6.25
70Br7.0Wd, Cals *,
St (trace)
8.0Wd > Wh,
Cals (trace),
Bru, St (trace)
7.0
*—phases detected only by SEM method.
Disclaimer/Publisher’s Note: The statements, opinions and data contained in all publications are solely those of the individual author(s) and contributor(s) and not of MDPI and/or the editor(s). MDPI and/or the editor(s) disclaim responsibility for any injury to people or property resulting from any ideas, methods, instructions or products referred to in the content.

