Article

Nitrate Reduction Reaction on Zr-Doped TiO2 (101) Surfaces Investigated by First-Principles Calculations

1
Institute of Fuel Cells, School of Mechanical Engineering, Shanghai Jiao Tong University, Shanghai 200240, China
2
School of Materials Science & Engineering, Shanghai Jiao Tong University, Shanghai 200240, China
*
Authors to whom correspondence should be addressed.
Crystals 2023, 13(12), 1640; https://doi.org/10.3390/cryst13121640
Submission received: 8 November 2023 / Revised: 22 November 2023 / Accepted: 25 November 2023 / Published: 27 November 2023

Abstract

:
Electrochemical nitrate reduction to ammonia is an efficient strategy for nitrate removal and ammonia production in ambient conditions. TiO2 is a promising electrocatalyst for such a reaction, but chemical doping is still needed to further improve the electrocatalytic properties of TiO2. Here, we investigated the effect of Zr-doping on the nitrate reduction reaction processes on the (101) surface of anatase TiO2 using first-principles calculations. Two models with different Zr-doping levels were built. The reaction pathways and the potential-determining steps were established based on a thorough investigation of the variation in Gibbs free energy of each possible elementary step. The results show that a high level of Zr doping was effective to lower the Gibbs free energy for nitrate adsorption; however, Zr doping may promote the competing hydrogen evolution reaction (HER) by reducing the adsorption Gibbs free energy of H. Moreover, Zr doping also increases the adsorption Gibbs free energies for the intermediate products NO2 and NO, which may result in an earlier termination of the reaction, by releasing the intermediates as the final products without producing ammonia. Therefore, Zr doping may decrease the Faradaic efficiency and selectivity of TiO2 for the reaction and should be treated with caution experimentally.

1. Introduction

Electrochemical nitrate reduction to ammonia at ambient temperature and pressure is an energy-efficient and environmental-friendly strategy for converting the harmful pollutant in water into a valuable feedstock for industry and agriculture [1,2,3]. However, as the reduction of nitrate to ammonia is a complex process that involves an eight-electron transfer reaction and contains multiple intermediates [4], it is urgent to develop electrocatalysts with high activity, high selectivity, and affordable cost [5]. To date, numerous efforts have been devoted to exploring earth-abundant compounds as electrocatalysts for nitrate-to-ammonia conversion, among which TiO2 has attracted much attention due to its abundance, nontoxicity, and excellent stability [6,7].
Previous studies have shown that the electrocatalytic properties of TiO2 for nitrate-to-ammonia conversion can be improved by introducing oxygen vacancies and chemical doping [8,9,10,11,12]. For example, Jia et al. [8] prepared TiO2 nanotubes with rich oxygen vacancies through electrochemical anodization of a Ti foil, followed by high-temperature annealing in hydrogen, and reported enhanced electrocatalytic performance, including a better Faradaic efficiency, selectivity, conversion, and ammonia yield than untreated TiO2. An improvement in performance using the oxygen vacancy in undoped TiO2 was also reported by Wei et al. [9] and Wang et al. [10]. On the other hand, chemical doping of transition metals such as Fe and Co has also been reported as effective for boosting nitrate-to-ammonia conversion. For example, Chen et al. [11] prepared Fe-doped TiO2 nanoribbon arrays using a three-step processing method, including hydrothermal derivation of Na-titanate on a Ti plate, cation exchange of Na+ and Fe3+, and annealing in argon. Compared to undoped TiO2, Fe-doped TiO2 had a superior ammonia yield and Faradaic efficiency, owing to the improved electronic conductivity and optimized adsorption of reactive species on the surface. Zhao et al. [12] synthesized Co-doped TiO2 using the same method and also found improved electrocatalytic properties over undoped TiO2. By performing theoretical calculations, the authors revealed that the enhanced properties originated from the formation of oxygen vacancies induced by Co doping.
Although progress has been made in understanding the electrocatalytic performance of undoped and doped TiO2 for electrochemical nitrate-to-ammonia conversion, the following questions remain to be addressed: (1) Whether doping element is effective if no oxygen vacancy is generated? Doping TiO2 with transition metal ions such as Fe and Co introduces oxygen vacancies due to their lower oxidation states than Ti. Consequently, it is difficult to differentiate the effect from the doping element, oxygen vacancy, or their synergy; (2) What is the reaction pathway of nitrate-to-ammonia on the undoped and doped TiO2 surface? Due to the complexity of the nitrate reduction reaction, it can be challenging to reveal the reaction pathway through experimental studies. Density functional theory (DFT) calculations have proven an efficient tool for facilitating understanding of the reaction pathway on different surfaces under various conditions and to save the workload of experiments. For example, Hu et al. [13] clarified the reaction pathway for the nitrate-to-ammonia conversion process on Cu surfaces using DFT and revealed different pathways on (111), (100), and (110) surfaces under different pH values, which not only rationalized the experimental observations but also provided guidelines for catalyst selection and design. DFT calculations have also been employed to understand or predict the role of crystal structure and different types of defects in the electrocatalytic properties of TiO2 for electrochemical nitrate reduction reaction [9,11,12].
Based on the above considerations, here, we selected Zr as the doping element for investigation. First, Zr doping does not introduce any oxygen vacancies to TiO2, as Zr and Ti have the same oxidation state (+4). Second, Zr has a high solubility in TiO2 (~30% [14]) and a larger ionic radius than Ti (r(Zr4+, 6-fold) = 0.84 Å, r(Ti4+, 6-fold) = 0.605 Å [15]). Therefore, this provides an ideal system for discussing the effect of the doping element and doping level without any influence from oxygen vacancies. DFT calculations were employed to clarify the effect of iso-valent doping and doping level on the free energy variation during the nitrate reduction reaction and to clarify the reaction pathway on undoped and Zr-doped surfaces. Possible impacts from the competing hydrogen evolution reaction (HER) and adsorption of intermediate reaction products were also investigated. The results of this work provide useful information for selecting proper dopants for TiO2, to improve its electrocatalytic performance for electrochemical nitrate-to-ammonia conversion.

2. Computational Methods

DFT calculations were performed using the Vienna Ab initio Simulation Package (VASP) [16]. The projector augmented-wave (PAW) pseudopotentials were used to deal with ion–electron interaction [17,18]. The Perdew–Burke–Ernzerhof (PBE) functional within the generalized gradient approximation (GGA) was used to describe the exchange–correlation interaction [19]. Considering the on-site coulomb correlation of the localized d electrons for transition metals Ti and Zr, the DFT + U method with Ueff = 2.58 eV for Ti [8] and Ueff = 5.0 eV for Zr [20] was adopted. The thermodynamic corrections for the solvation effect were calculated using VASPsol [21]. The long-range van der Waals interactions were considered using the DFT-D3 method [22]. The kinetic energy cut-off was set to 500 eV. The convergence threshold for the iteration in the self-consist field (SCF) was set as 10−5 eV. The geometry optimization using the conjugate gradient method was performed with forces on each atom of <0.03 eV/Å. The Brillouin zone was sampled using a k-point mesh of 2 × 2 × 1.
The crystal structure of anatase TiO2 was used as the starting model, as anatase phase has a higher Faradaic efficient and selectivity [9] than rutile. The optimized lattice parameters (a = b = 3.832 Å, c = 9.619 Å) agreed with the values reported in the literature [23]. The (101) surface was selected for investigation, as it is thermodynamically stable and the predominantly exposed surface for anatase TiO2 [24,25]. To build the surface model, the optimized unit cell was enlarged into a 1 × 3 supercell to minimize the effect of the periodic image along the x and y directions, and a 15 Å-thick vacuum layer was applied to the top surface layer to avoid periodic image interactions along the z direction. The Zr-doped models were built using two methods: (1) The Zr-TiO2-S model, where one Ti atom on the top surface layer was replaced by one Zr atom. This model represented a low Zr-doping level of ~2.8%. (2) The Zr-TiO2-B model, where the equivalent positions of a selected Ti atom in the supercell were replaced by Zr atoms. This model represented a high Zr-doping level of ~25%. The supercell models and their top views are displayed in Figure 1.
The Gibbs free energy (G) for each gaseous and adsorbed species was calculated according to
G = E DFT + E ZPE T S
where EDFT and EZPE represent the calculated total energy and the zero-pint energy, respectively, and TS is the entropy contribution at 298.15 K. The S values of free molecules were obtained from a database [26]. The calculated EDFT, EZPE, TS, and G of the free gas molecules are listed in Table S1. The formation energy of HNO3(g) calculated from the free energies of H2(g), N2(g), O2(g) and HNO3(g) was −1.875 eV, and the experimental value was −0.77 eV [27]. Therefore, a correction of 1.105 eV was applied to HNO3(g). The correction value is close to those reported by previous studies, i.e., 1.12 eV [28] and 1.08 eV [29]. The adsorption Gibbs free energy of nitrate ions was obtained from a thermodynamic cycle (Figure S1), to avoid calculating the negatively charged species in the periodic DFT calculations [28]. Details of the gas phase correction and calculation of the adsorption Gibbs free energy of nitrate are given in the Supplementary Information.

3. Results and Discussion

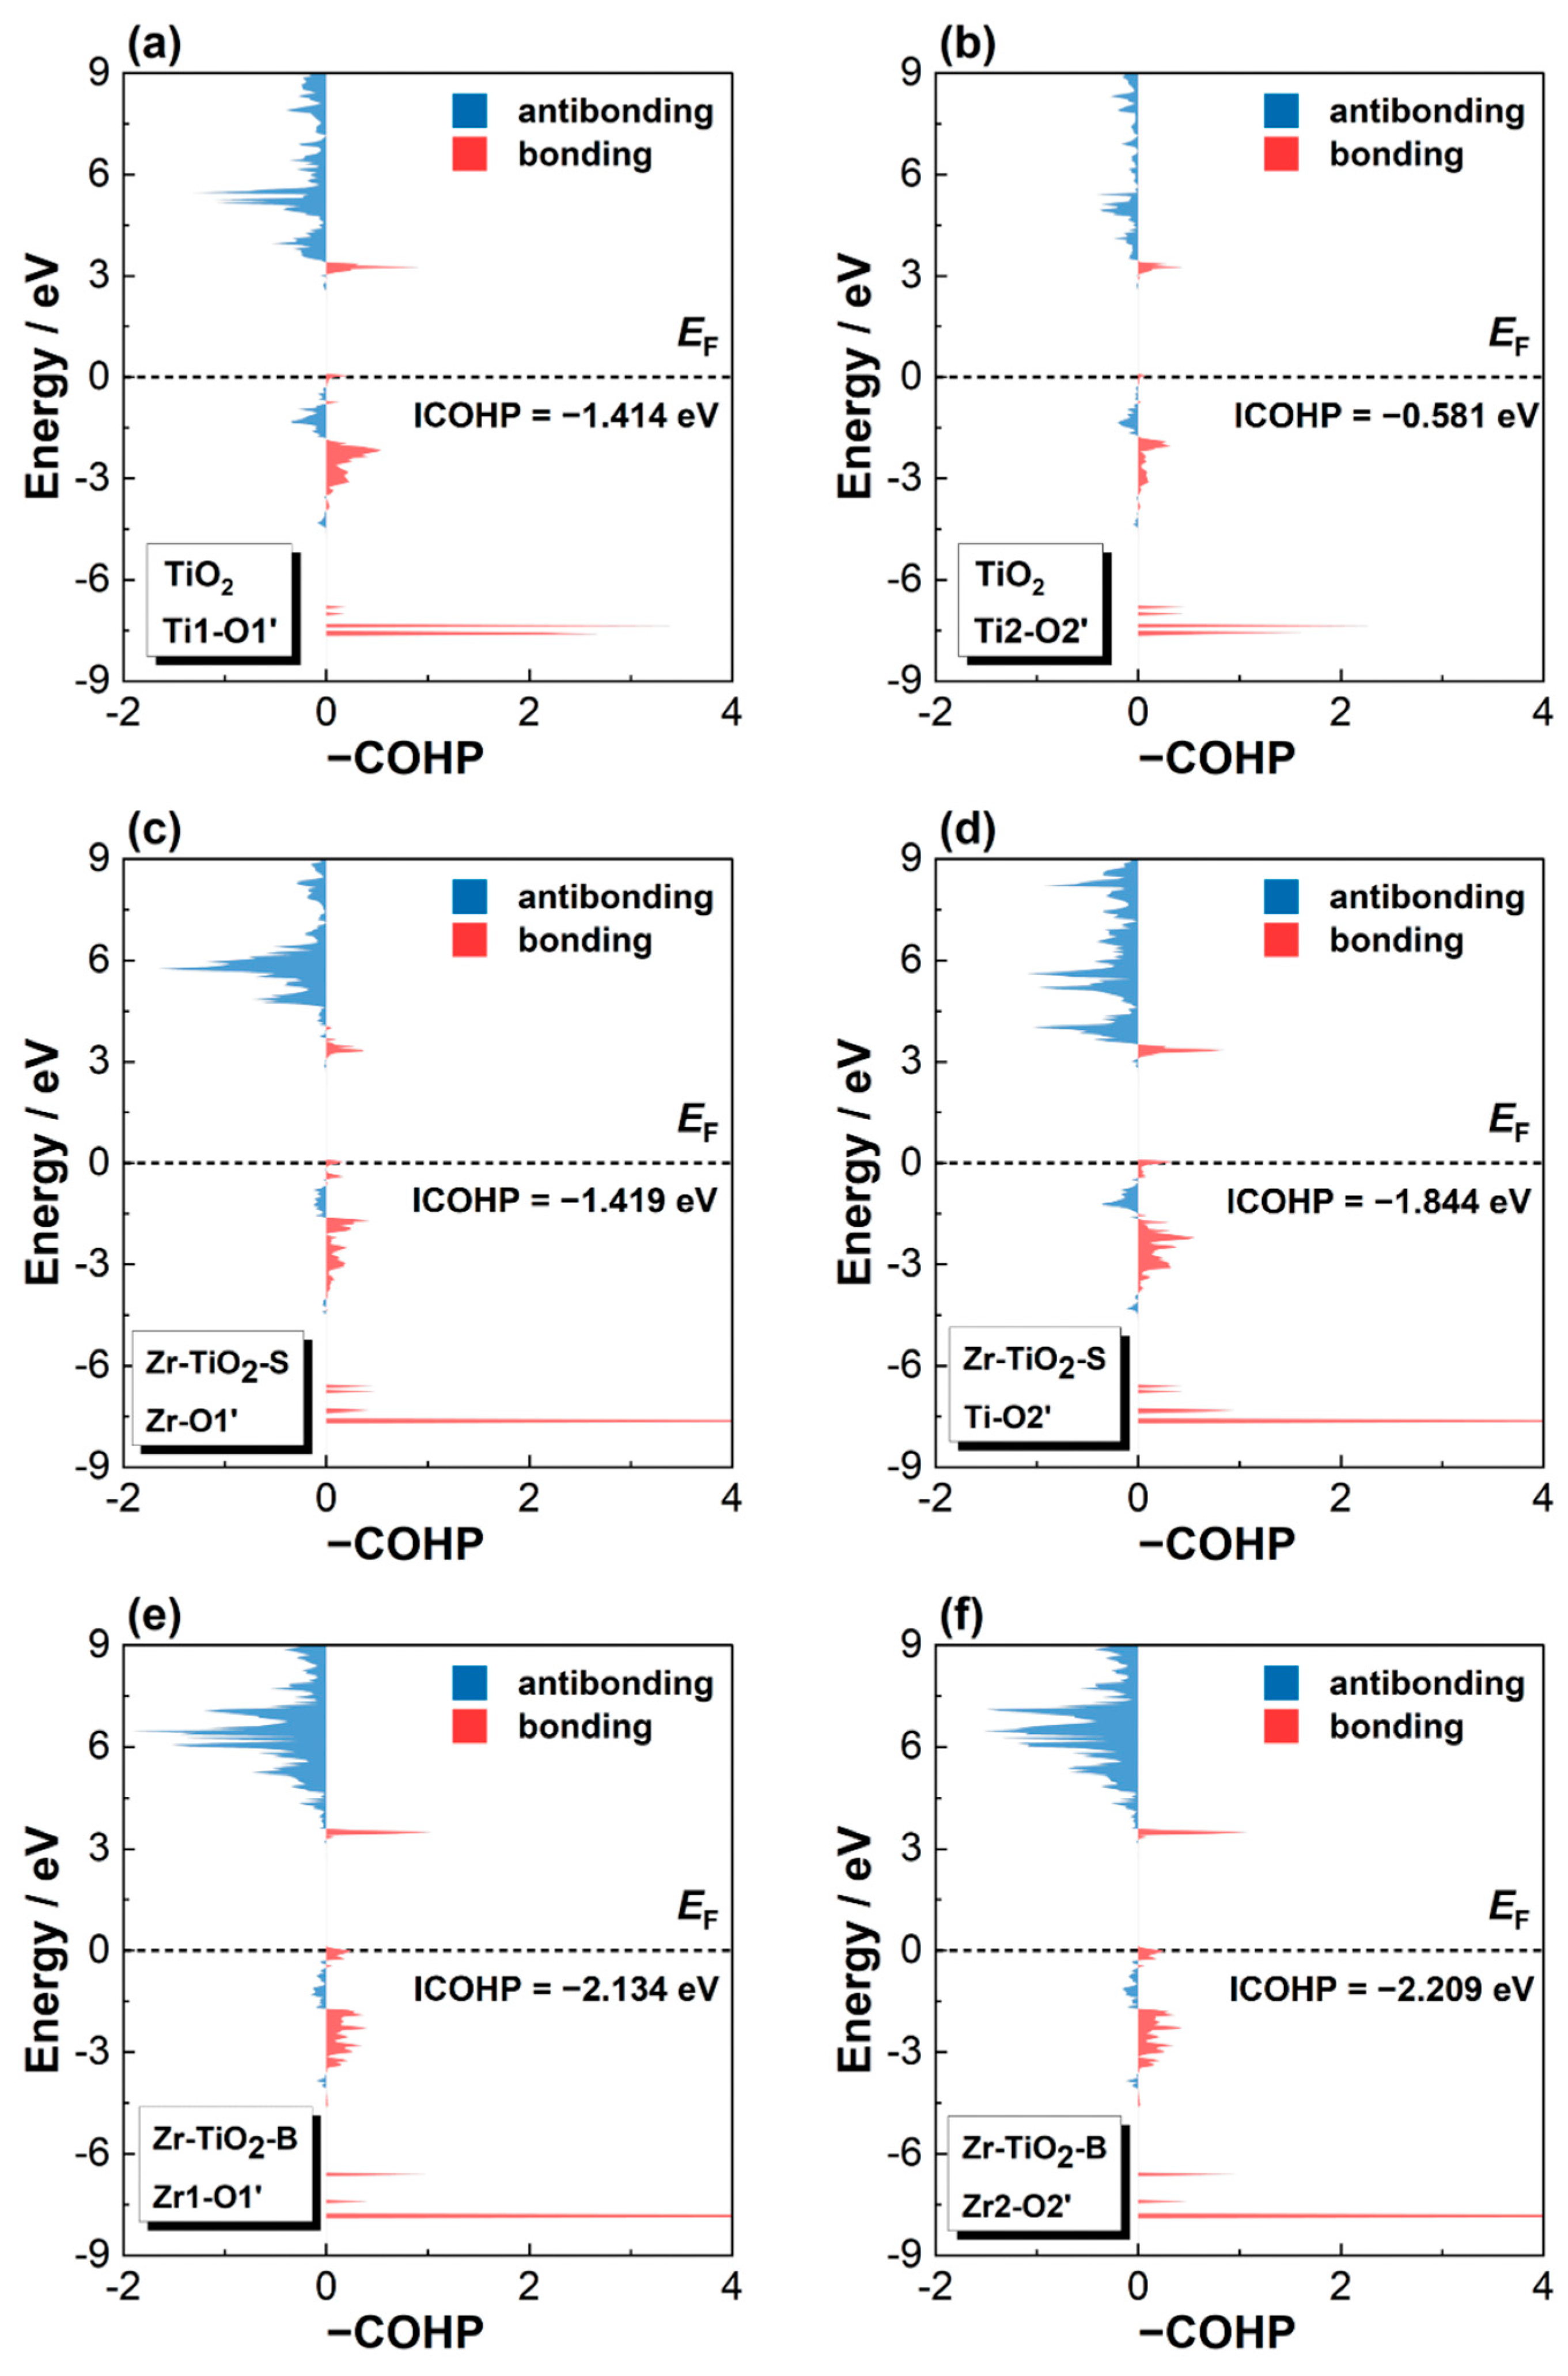
3.1. Electronic Structure

The projected density of states (PDOS) of the three models are shown in Figure S2, and detailed descriptions of PDOS are provided in the Supplementary Information (Section 3). Comparison of the total DOS for the three models shows that Zr-doping did not introduce any additional energy to the forbidden band nor change the band gap. All three models showed identical band gap values of ~2.15 eV. Therefore, it was expected that Zr-doped TiO2 was semiconducting with a similar electrical conductivity as undoped TiO2.

3.2. Adsorption and Charge Transfer of Nitrate

As the starting step for nitrate reduction reaction, the adsorption of nitrate on the surface plays a critical role. As shown by the calculated molecular orbital (MO) of nitrate in Figure S3, the highest occupied molecular orbital (HOMO) of nitrate was the non-bonding orbital 1a2′, and the lowest unoccupied molecular orbital (LUMO) was an anti-bonding orbital with high energy level. Such a high LUMO energy of nitrate makes it very difficult for charge injections, thus the adsorption process of nitrate is always accompanied by a high adsorption energy [30]. For NO 3 adsorption on active sites, there are two possible adsorption configurations, including the monodentate nitrate mode (M-O-NO2) and the bridging nitrate (M-O)2 = NO mode. As suggested by previous studies, the bridging configuration is the preferential mode for nitrate adsorption [31,32], and therefore, it was adopted as the starting configuration for the calculations. To avoid artificial local energy minimization caused by symmetric configuration of NO 3 on the surface, i.e., O1′ and O2′ had the same distance to their adsorbed sites, asymmetric configuration was used as the starting structure. The starting bond lengths (BLs) for M-O1′ and M-O2′ (M = Ti or Zr) are listed in Table 1.
The nitrate adsorption configurations after optimization and the associated charge density difference (CCD) for the three models are visualized in Figure 2, and the BLs for M-O1′ and M-O2′ are listed in Table 1. For undoped TiO2, the adsorbed NO 3 showed notable tilting towards Ti1 with a much smaller BL for Ti1-O1′ than that for Ti1-O2′. For the Zr-TiO2-S model, the adsorbed NO 3 was tilted towards Ti, with a larger distance between Zr and O1′ than between Ti and O2′. Unlike the above two models, the adsorbed NO 3 showed symmetric configuration on the surface of Zr-TiO2-B, with very similar BL values for Zr1-O1′ and Zr2-O2′. The above results show that the asymmetric configuration of NO 3 had a lower energy than the symmetric configuration on the surfaces of undoped TiO2 and Zr-TiO2-S, which was opposite to the situation for Zr-TiO2-B.
The charge density difference (CDD) in Figure 2 shows that the nitrate adsorbed on the surface had both charge depletion (as indicated by the navy electronic cloud) and charge accumulation (as indicated by the red electronic cloud), suggesting the occurrence of a charge exchange between nitrate and surface, which was also observed in another work [33].
To further investigate the charge transfer at the surface, the QATIM atomic basin charge of the active sites before and after nitrate adsorption was calculated. The results are listed in Table 1. Apart from Ti in the Zr-TiO2-S model, all the active sites showed charge accumulation after nitrate adsorption. The Zr-TiO2-B model had the highest level of charge accumulation, which may have benefited the charge transfer in the nitrate reduction process [34].
Furthermore, the crystal orbital Hamilton population (COHP) [35,36] was calculated, to evaluate the bonding between the nitrate and the surface, as shown in Figure 3, where the following information can be extracted: (1) For the TiO2 and the Zr-TiO2-S models, the asymmetric nitrate adsorption configurations resulted in dramatically different values of the integrated overlap populations up to the Fermi level (ICOHP) for the two active sites. The active site with shorter bond length with O’ from nitrate had a more negative value. For the Zr-TiO2-B model, the nearly symmetric nitrate adsorption configuration resulted in close ICOHP values for the two active sites. (2) With Zr doping, the ICOHP values were more negative than those for undoped TiO2. The Zr-TiO2-B model had larger negative ICOHP values than the other two models, suggesting that the bonding between nitrate and the surface was improved by Zr doping. As a result, the adsorption energy for nitrate on the three surfaces decreased with increasing Zr doping level, from 0.934 eV for TiO2 to 0.796 eV for Zr-TiO2-S and to 0.693 eV for Zr-TiO2-B.

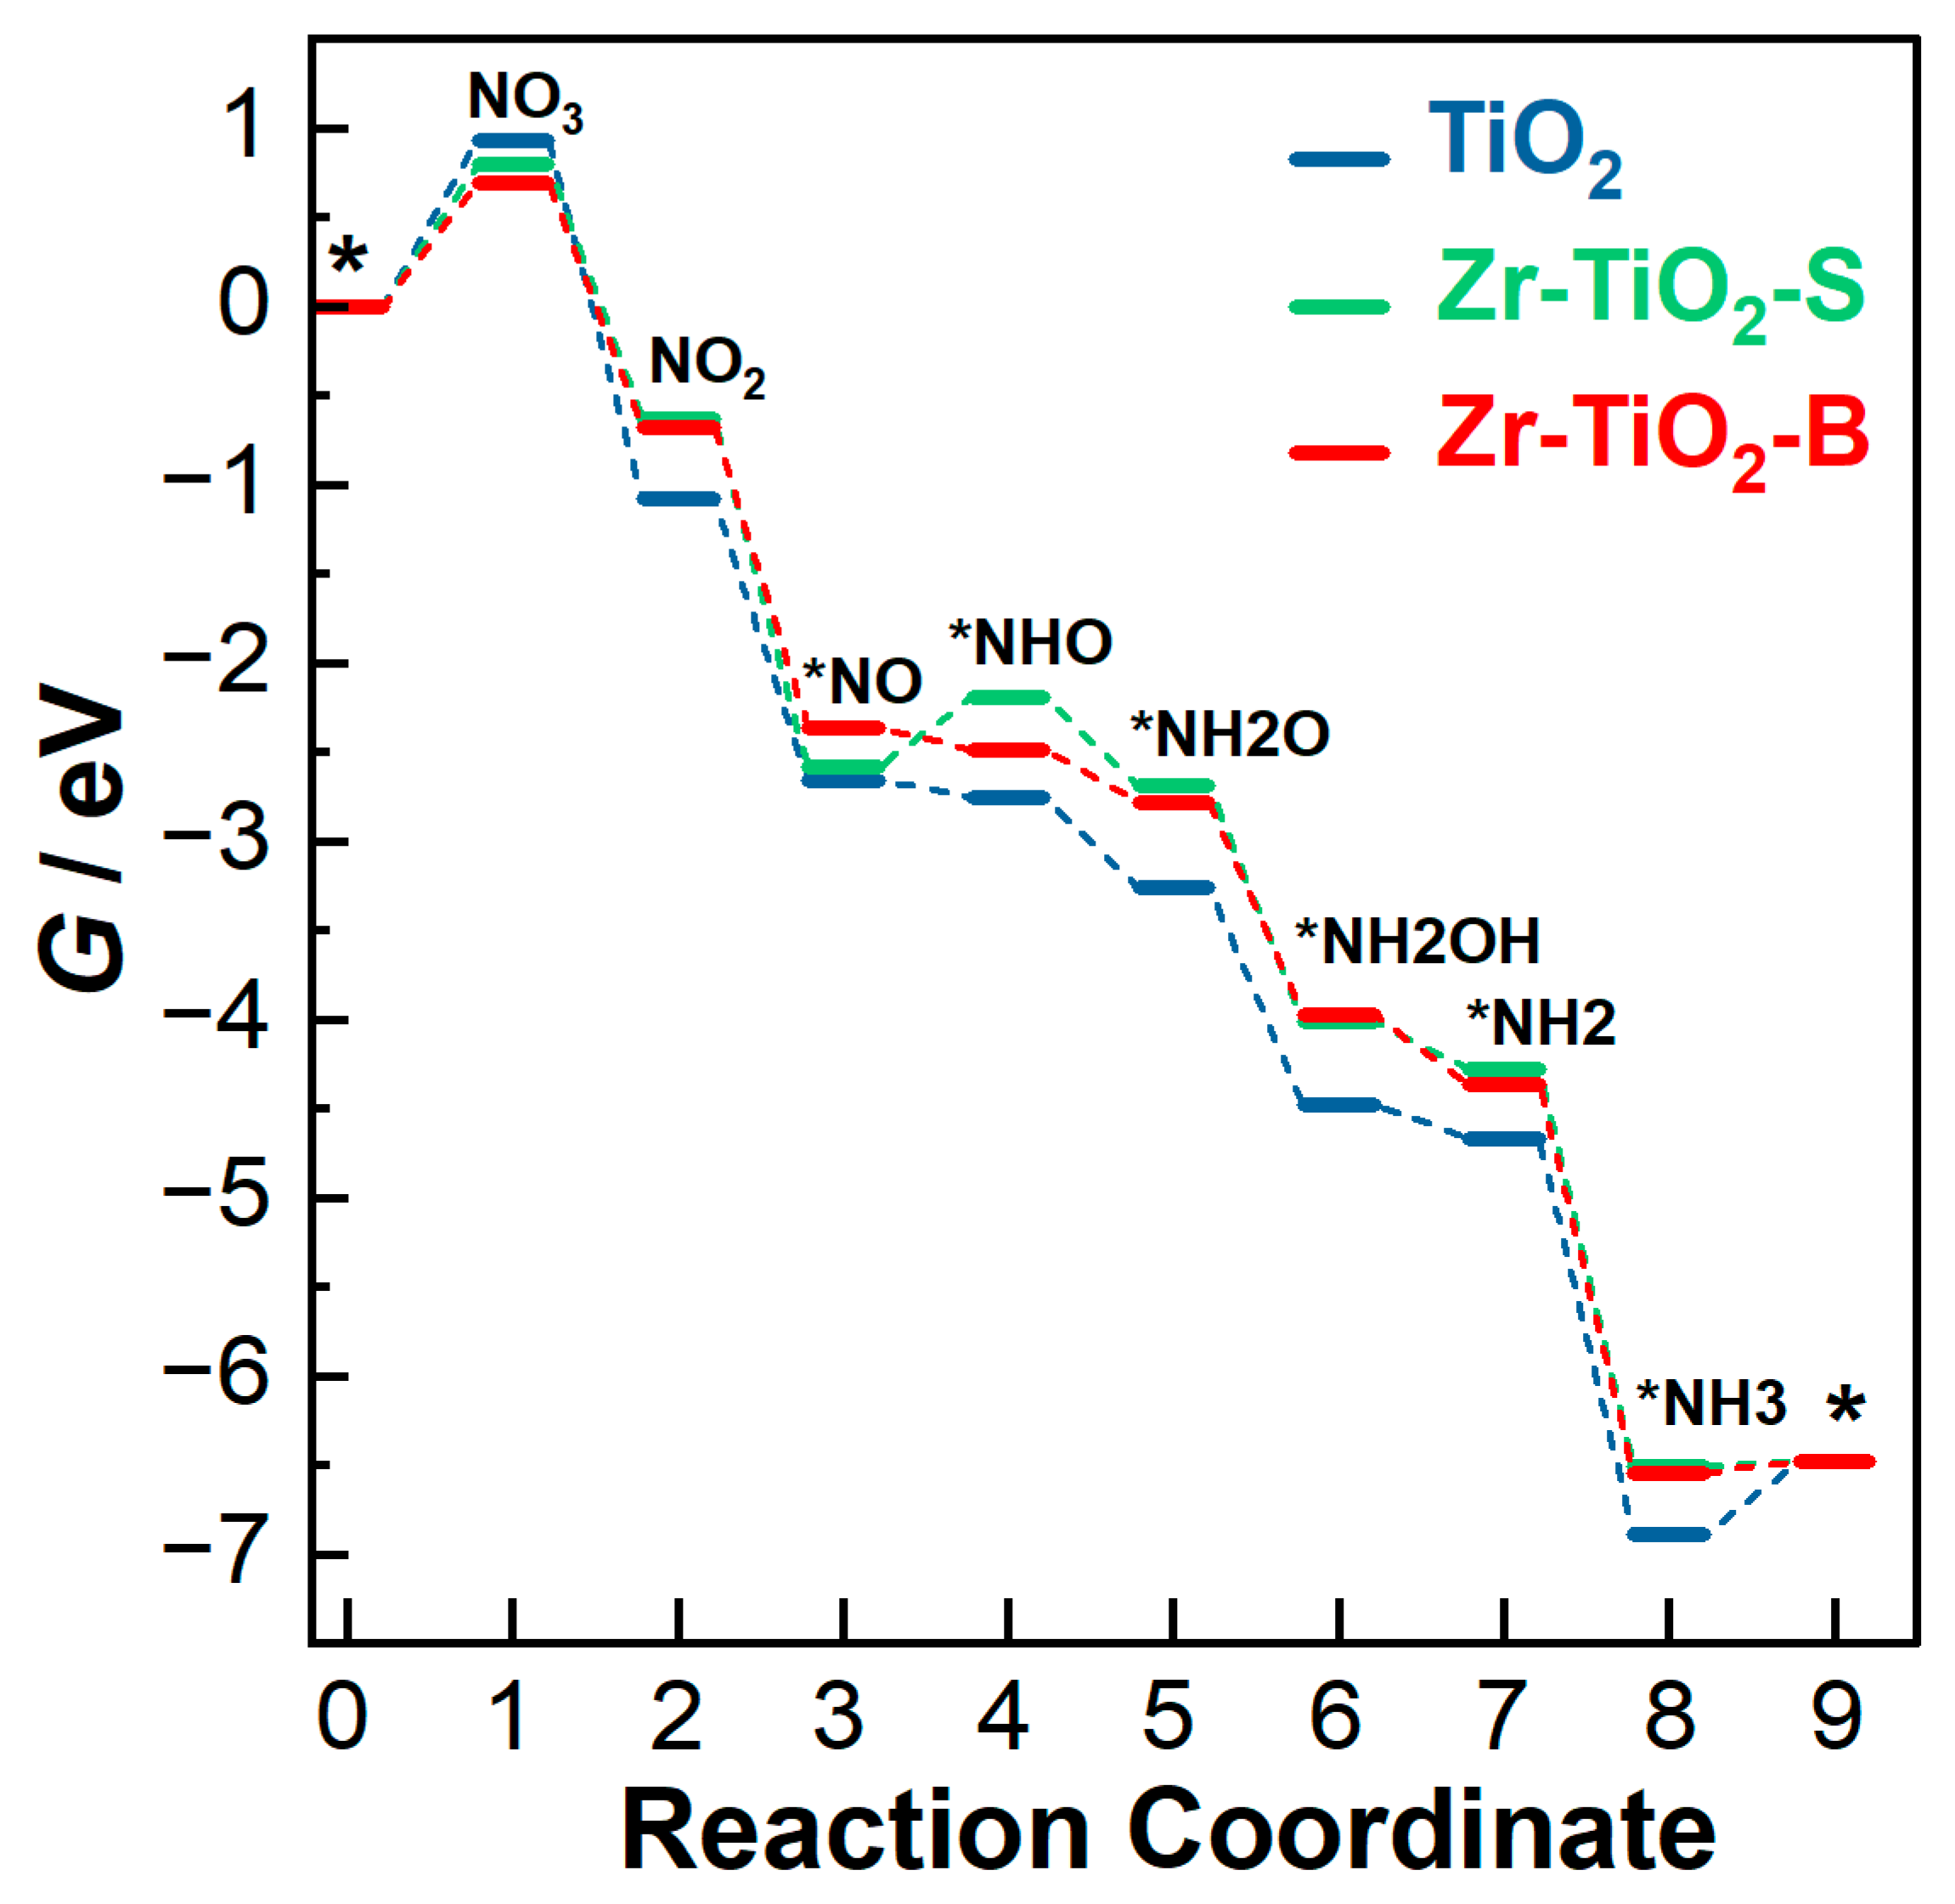
3.3. Reaction Pathways

To further understand the effect of Zr on the nitrate reduction process on the TiO2 (101) surface, possible reaction pathways were established and the associated Gibbs free energy for each elemental step was calculated, as presented and discussed below.

3.3.1. Undoped TiO2 Model

Possible nitrate reduction pathways on the undoped TiO2 (101) surface are shown in Figure 4a. The reaction started with adsorption of NO3 on the surface with the optimized bridging configuration, followed by removal of the unbonded oxygen far away from the surface (O3′) to form NO2. The subsequent step can be divided into two possible pathways; i.e., the N-end pathway and the O-end pathway.
(1) The N-end pathway. After one oxygen is removed from NO2, N from the resultant NO adsorbs on the surface (labelled as *NO). This route can be further divided into two sub-routes (N-end1 and N-end2). In the N-end1 route, N from *NO accepts H to form *NHO and *NH2O. After that, O from *NH2O starts to accept H to form *NH2OH. The subsequent hydrogenation step results in the formation and release of H2O to form *NH2 on the surface, which further accepts H to form *NH3. In the N-end2 route, O from *NO is hydrogenated to form *NOH first and then releases H2O to form *N. Subsequently, *N accepts H to form *NH, *NH2, and *NH3 in sequence. The reaction completes with the release of NH3 to expose the original surface.
(2) The O-end pathway. After one oxygen is removed from NO2, O from the resultant NO adsorbs on the surface (labelled as *ON). N in *ON keeps accepting H to form *ONH, *ONH, and *ONH3 in sequence. After that, NH3 is released from the surface. The remaining *O accepts H to form *OH and H2O to expose the original surface.
The variation in the Gibbs free energy (G) of each step described in the abovementioned pathways is shown in Figure 4b, and the G values are listed in Table S2. Adsorption of NO3 on the TiO2 (101) surface is non-spontaneous and requires a high energy of 0.934 eV. Once adsorption is completed, the remaining steps before desorption of NH3 in the N-end1 route are all spontaneous. The potential determining step (PDS) is the adsorption of NO3. For the N-end2 route, the hydrogenation step (*NO→*NHO) and the subsequent water removal step (*NHO→*N) are accompanied by an apparent energy increment. *NHO→*N with an energy jump of 0.989 eV becomes the PDS. The O-end pathway only shows a slight energy increase for the *ONH3→*OH step (0.179 eV) after nitrate adsorption. Therefore, nitrate adsorption is the PDS for the O-end pathway.
The above analysis shows that the N-end1 and O-end pathways have the same PDS, and the energies required for the subsequent nonspontaneous steps are relatively small, which can be overcome by the applied potential during electrocatalysis. Consequently, it can be concluded that both N-end1 and O-end are thermodynamically favored pathways for the nitrate reduction reaction.

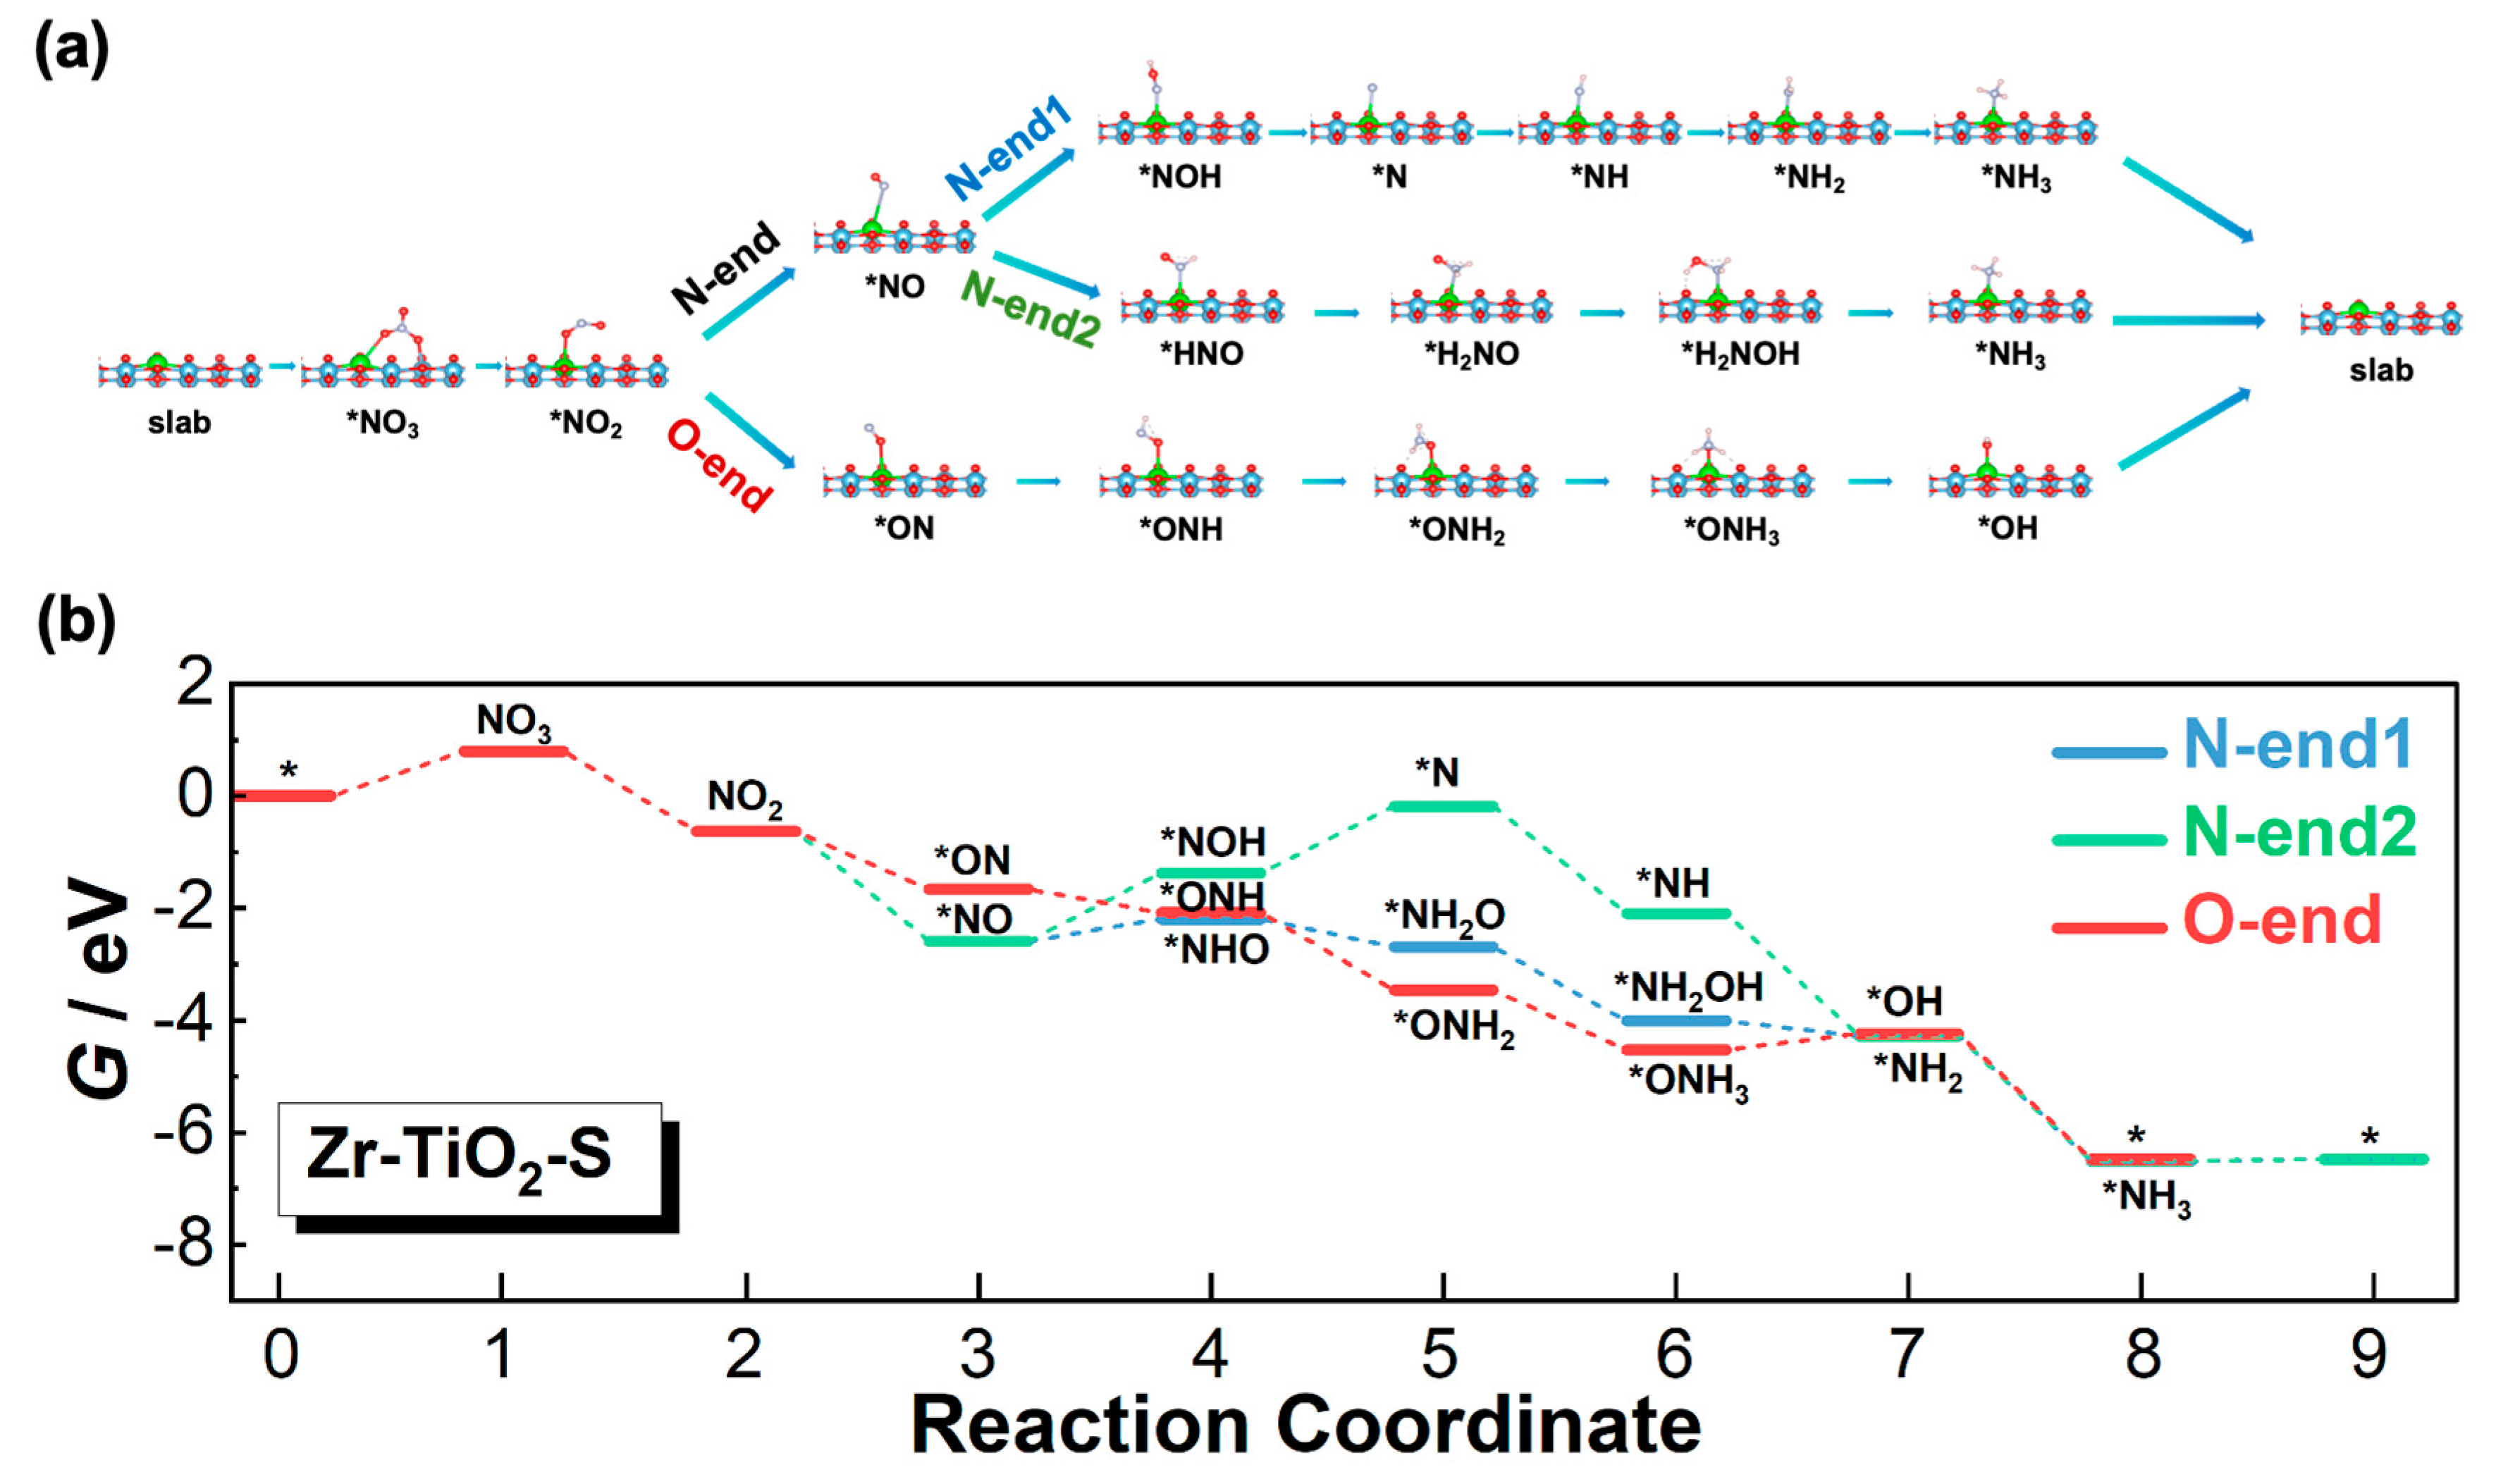
3.3.2. Zr-TiO2-S Model

Possible nitrate reduction pathways on the (101) surface of the Zr-TiO2-S model are shown in Figure 5a. Here, nitrate adsorbs on the surface in a bridging configuration with O1′ on Zr and O2′ on Ti. The subsequent removal of O3′ is accompanied by a break of the O2′-Ti bond. As Zr-O has a higher bond strength (801 kJ/mol [37]) than Ti-O (672 kJ/mol [37]), and the Zr-Ti distance (3.885 Å) is much larger than the O1′-O2′ distance in nitrite (2.216 Å), one-site adsorption of nitrite on Zr is a more favorable configuration. Similarly to the situation in undoped TiO2, the follow-up reaction can be divided into N-end1, N-end2, and O-end pathways.
The variation in the Gibbs free energy (G) of each step in the three possible pathways is shown in Figure 6b, and the G values are listed in Table S3. Adsorption of nitrate on the surface of Zr-TiO2-S requires an energy of 0.798 eV. In the N-end1 route, only the *NO→*NHO step is non-spontaneous, which requires a moderate energy of 0.396 eV. Therefore, adsorption of nitrate is the PDS. In the N-end2 route, *NO→*NOH and the subsequent*NOH→*N require high energies of 1.214 eV and 1.190 eV, respectively. The PDS changes from adsorption of nitrate to *NO→*NOH in this route. In the O-end pathway, only a small energy increase of 0.289 eV occurs at *ONH3→*OH. Adsorption of nitrate is the PDS. Among the three, both the N-end1 and the O-end are possible reaction pathways. Considering the Gibbs energy for *ON is 0.92 eV higher than that for *NO, it is thermodynamically favored that the reaction follows the N-end1 route.

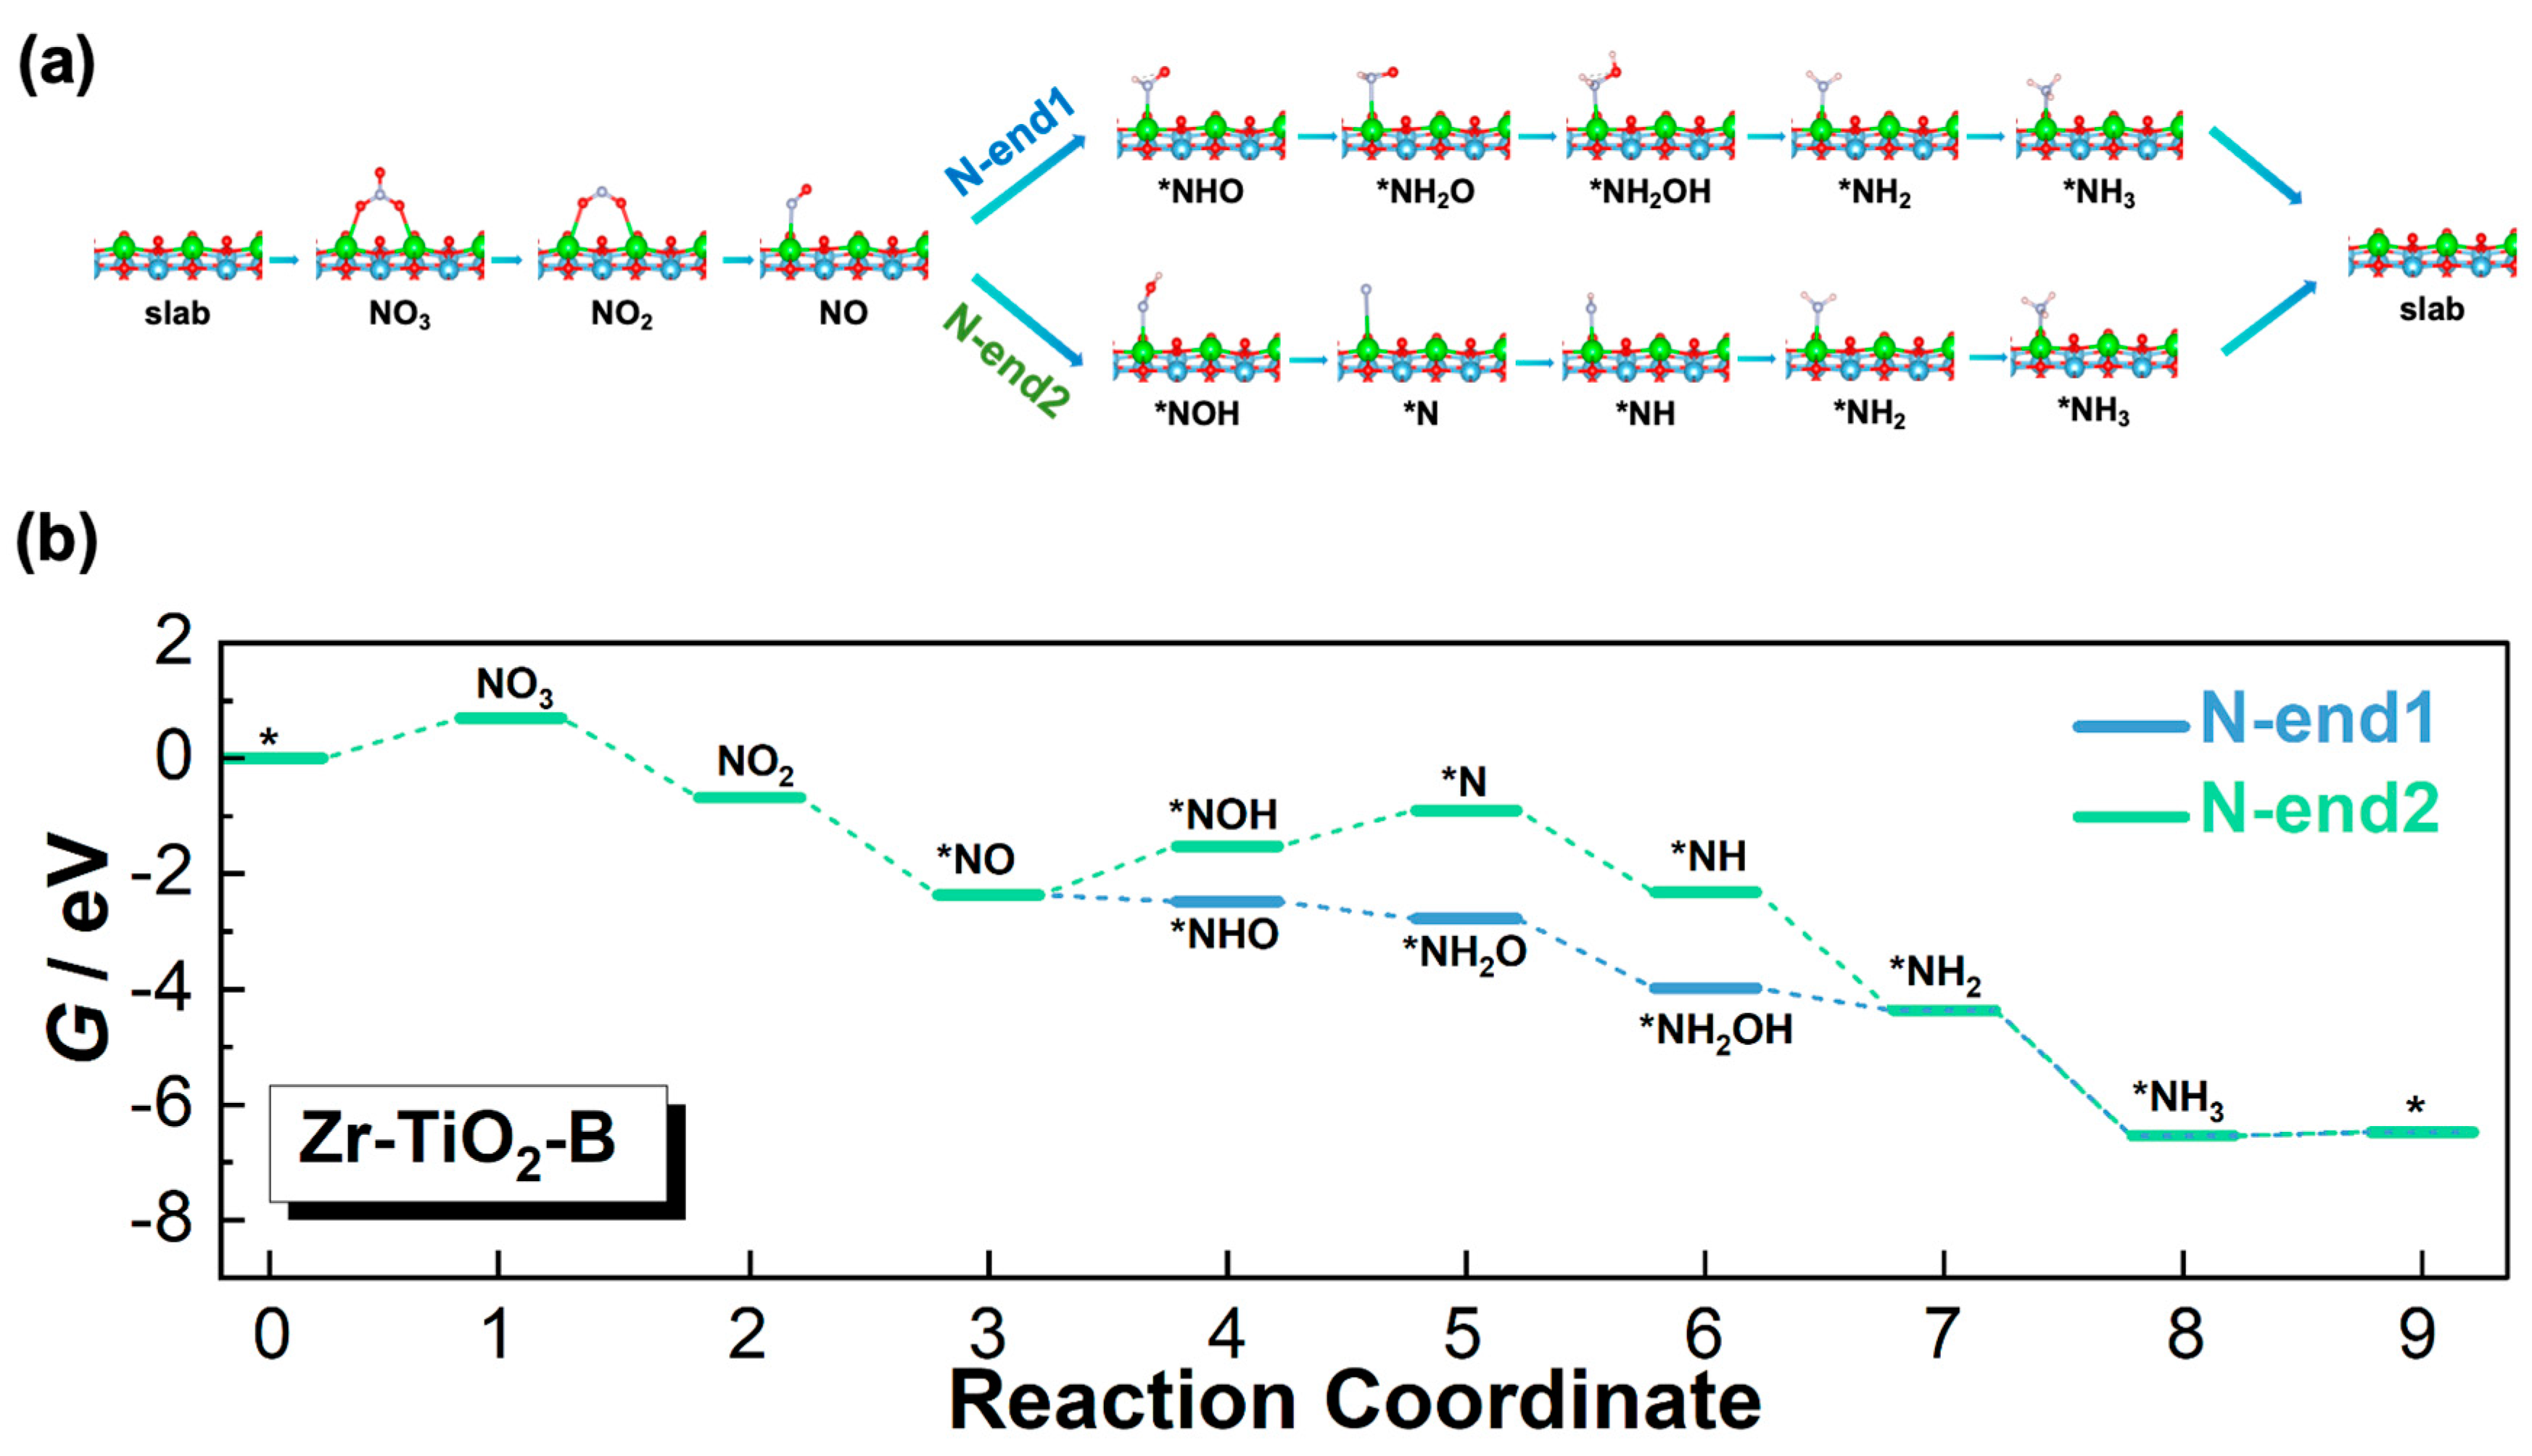
3.3.3. Zr-TiO2-B Model

Possible nitrate reduction pathways on the (101) surface of the Zr-TiO2-B model are shown in Figure 6a. Unlike the undoped TiO2 and Zr-TiO2-S models, the O-end pathway is not presented here because the *ON configuration was found to be unstable on the surface. Structure optimization using the *ON configuration shows detachment of NO from the surface. No charge transfer or bonding between NO and the surface can be established. Consequently, only the N-end configuration *NO is considered in the Zr-TiO2-B model. The follow-up reactions are divided into the N-end1 and N-end2 routes. The associated Gibbs free energy for each step is shown in Figure 6b, and the G values are listed in Table S4. For the N-end1 route, adsorption of nitrate on the surface has to overcome an energy barrier of 0.693 eV. The subsequent steps are all spontaneous, apart from a very small energy barrier of 0.067 eV for desorption of NH3. The PDS for the N-end1 route is adsorption of nitrate. On the contrary, the N-end2 shows large energy increments at *NO→*NOH (0.847 eV) and the subsequent *NOH→*N steps (0.618 eV). Therefore, the N-end1 route is the thermodynamically favored reaction pathway for nitrate reduction reaction on the surface of Zr-TiO2-B.
The above analysis shows that the N-end2 pathway for all the three models displays a large energy increment at the *NO→*NOH step (in contrast to a small energy increase at the *NO→*NHO step in the N-end1 pathway), which makes the N-end2 pathway undesirable for the nitrate reduction reaction. To explain the energy increase for this step, the molecular orbitals (MO) of *NO, *NOH, and *NHO were calculated and compared. The molecular orbitals were first calculated using VASP to obtain their energies and degeneracy, and then further determined using the same method as adopted by Sun et al. [38]. As shown in Figure 7a, both the LUMO and HOMO in *NO are the degenerated anti-bond 2π orbitals. The extra electron on the anti-bond 2π orbital is highly active with delocalization characteristics. When *NO is further hydrogenated to form *NOH, the electron from the newly added H binds with the electrons from O atom. The bonding orbitals of *NOH are mainly located on the oxygen atom (Figure 7b). In this case, the two unequal energy levels in the N atom make it very difficult for *NOH to interact with the surface, resulting in a large energy uplift at this step. On the contrary, when *NO is hydrogenated to form *NHO, as shown in Figure 7c, an electron from the newly added H atom pairs directly with the unpaired electrons from the N atom. No unpaired single electron is presented for *NHO. When *NHO interacts with the surface, it can provide electrons in pairs for better bonding, to reduce the energy barrier. Therefore, *NO→*NHO is a more thermodynamically favored route for the nitrate reduction reaction.
Based on the above analysis, it can be concluded that the N-end1 pathway is the thermodynamically favored reaction pathway for undoped and Zr-doped TiO2 models. A comparison of the Gibbs free energy variation in each step in the N-end1 pathway on the (101) surfaces of the three models is presented in Figure 8, and the G values are listed in Table S5. It can be seen that the most prominent effect from Zr-doping is the decreased energy barriers for nitrate adsorption and ammonia desorption, which are the first and the last step for nitrate-to-ammonia conversion, respectively. The doping level should be sufficiently high to avoid the energy increment at the *NO→*NHO step, as in the Zr-TiO2-S model.

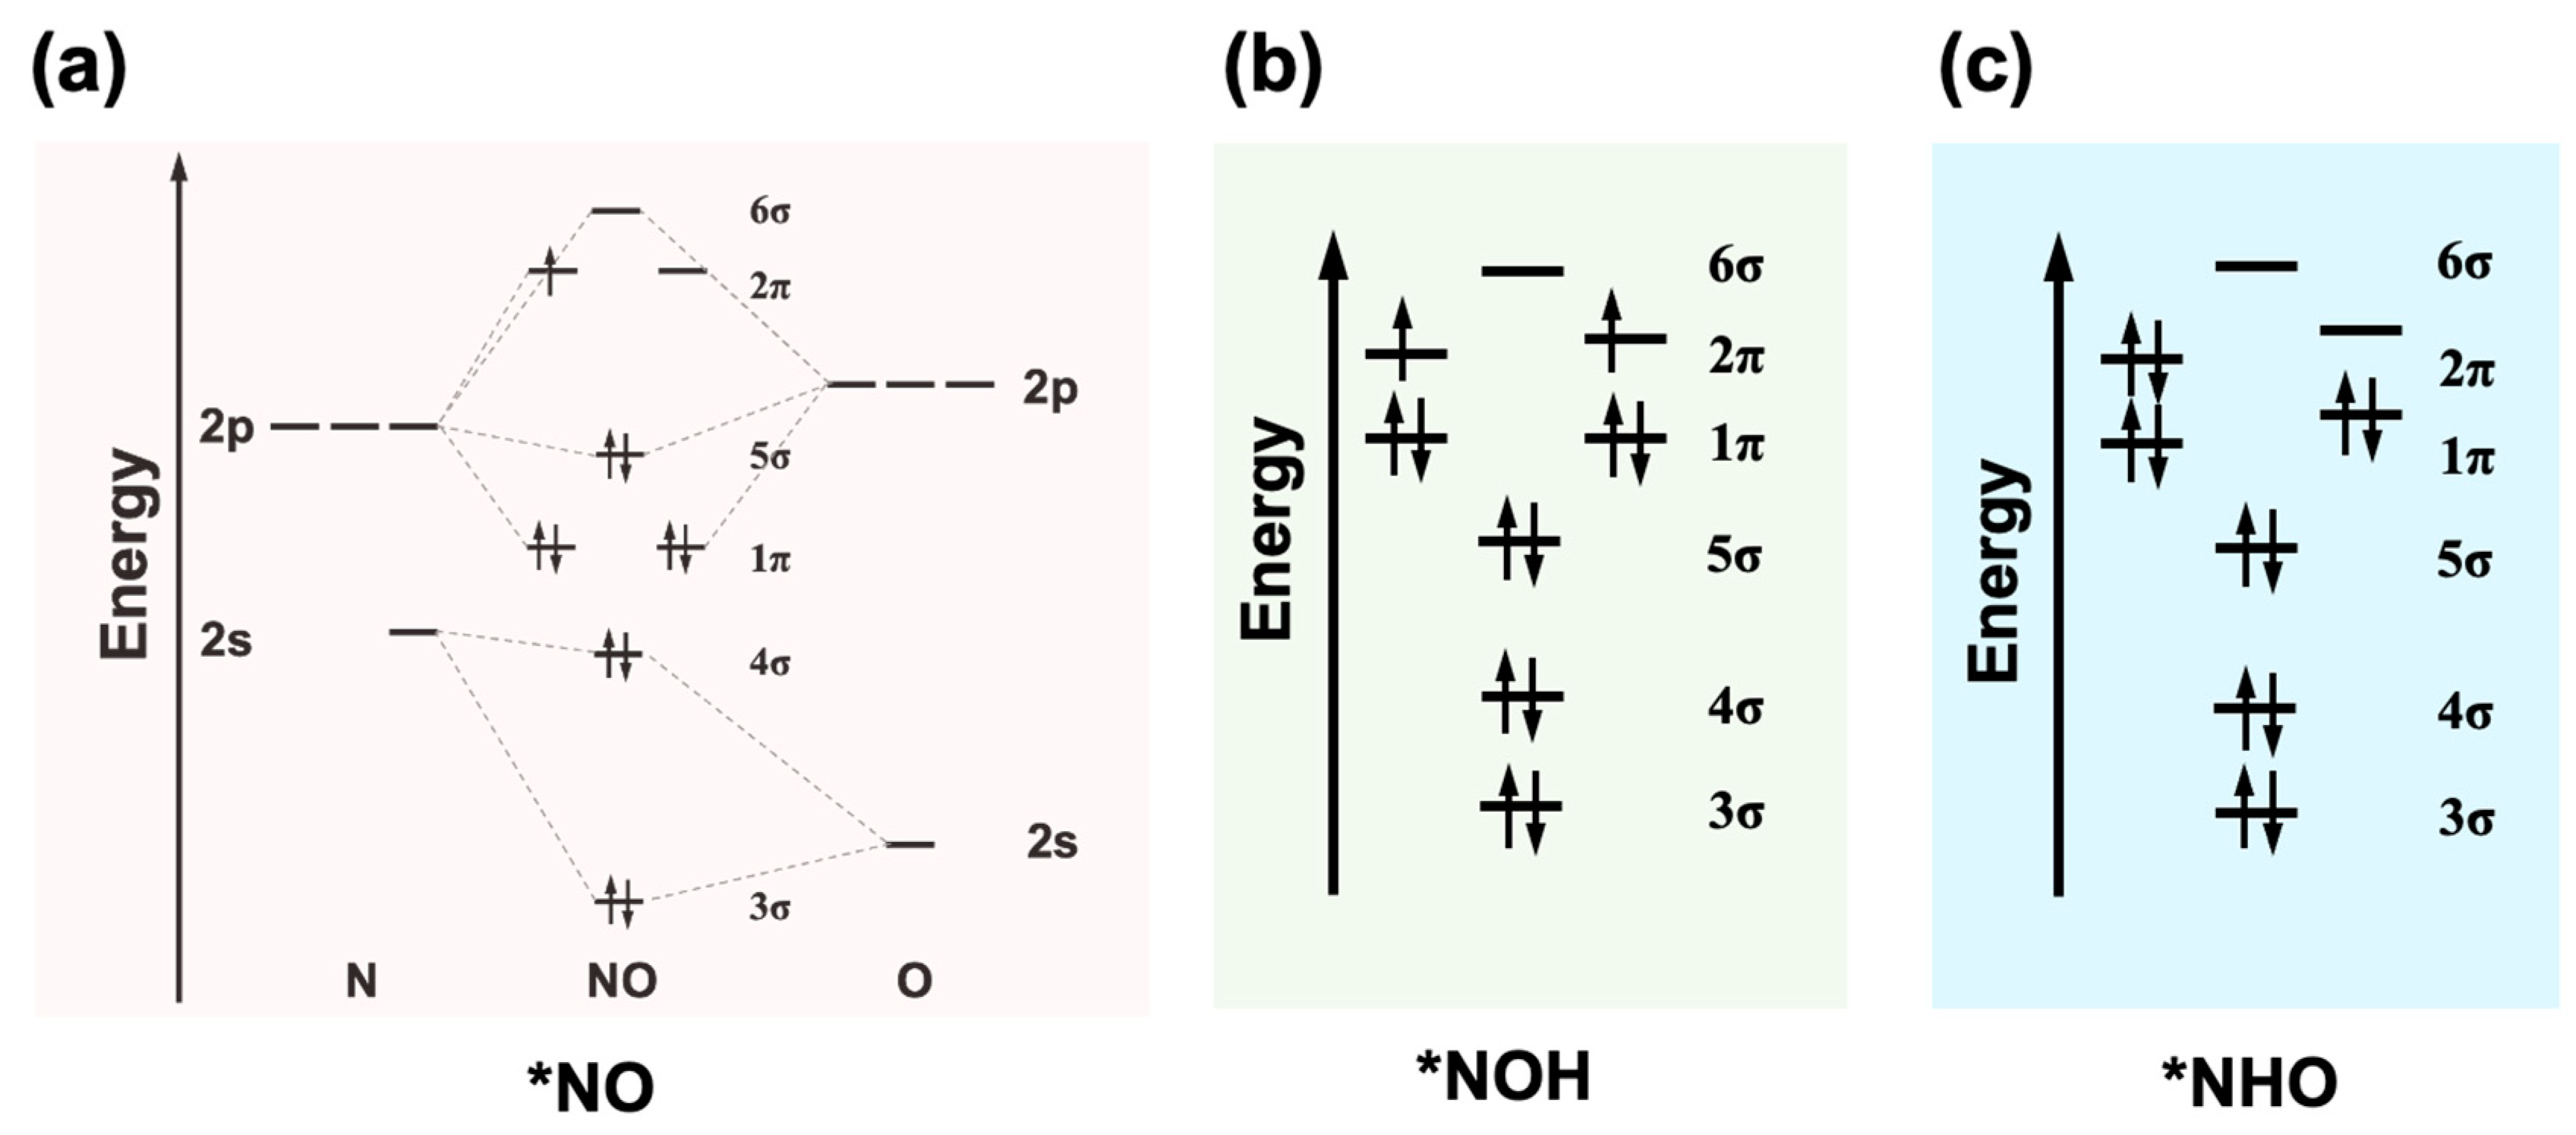
3.4. Adsorption of Intermediates and Hydrogen

During nitrate reduction reaction, byproducts such as NO2 and NO can be also formed in addition to the preferred product ammonia, to affect the selectivity of the catalyst. Therefore, the adsorption Gibbs free energies for NO2 and NO were also calculated. As shown in Table 2, the adsorption Gibbs free energies for NO2 and NO significantly increased after Zr doping. The positive adsorption energies suggest that NO2 and NO have a strong tendency to desorb from the surface. To suppress such a tendency, extra overpotential is required for the reaction to proceed. Otherwise, the reaction may terminate by releasing the intermediates as the final products, without producing ammonia.
Furthermore, the adsorption Gibbs free energies for H on the surfaces were also calculated, to evaluate the possible effect of Zr doping on the competing HER reaction in acid media. Our calculation shows that H prefers to adsorb on the O atoms near the active sites, rather than on Zr or Ti atoms directly. As also listed in Table 2, the H adsorption Gibbs free energy is reduced with the presence of Zr, implying that Zr doping can promote HER, which will decrease the yield efficiency of ammonia.

4. Conclusions

The reduction process of nitrate on the (101) surfaces of Zr-doped TiO2 was investigated using first-principles calculations. Possible reaction pathways for the reaction on undoped and doped surfaces were evaluated. The results showed that Zr doping can effectively lower the Gibbs free energy for nitrate adsorption on the surface, which may benefit the nitrate reduction reaction. The PDS was reduced from 0.934 eV for undoped TiO2 to 0.898 eV for surface Zr-doped TiO2 (Zr-TiO2-S, low doping level, ~2.8%), and to 0.693 eV for bulk Zr-doped TiO2 (Zr-TiO2-B, high doping level, ~25%). However, Zr doping also decreased the Gibbs free energy for H adsorption and therefore promoted the competing HER in acid media. Moreover, Zr doping increased the adsorption Gibbs free energies for the intermediate products NO2 and NO, which may have resulted in an earlier termination of the reaction, by releasing the intermediates as the final products without producing ammonia. Based on the calculation results, it can be concluded that Zr doping may decrease the Faradaic efficiency and selectivity of TiO2 for the nitrate reduction reaction, and experimental attempts to use Zr-doped TiO2 as an electrocatalyst should be treated with caution.

Supplementary Materials

The following supporting information can be downloaded at: https://www.mdpi.com/article/10.3390/cryst13121640/s1. (1) Free energies for gas molecules and gas phase correction; (2) Calculation of the Gibbs free energy for nitrate adsorption by a thermodynamic cycle; (3) Electronic structure of undoped and Zr-doped TiO2; (4) the molecular orbital (MO) of nitrate; (5) Gibbs free energy (G) for each elementary step on the (101) surfaces of TiO2, Zr-TiO2-S and Zr-TiO2-B; (6) Comparison of the Gibbs free energy (G) in the thermodynamically favored reaction pathways on the (101) surfaces of TiO2, Zr-TiO2-S and Zr-TiO2-B models.

Author Contributions

Conceptualization, F.Y. and J.Z.; methodology, F.Y. and X.H.; software, X.H.; validation, F.Y., Q.H. and J.Z.; formal analysis, X.H.; investigation, X.H.; resources, F.Y., Q.H. and J.Z.; data curation, X.H. and F.Y.; writing—original draft preparation, X.H. and F.Y.; writing—review and editing, F.Y., Q.H. and J.Z.; visualization, X.H. and F.Y.; supervision, F.Y., Q.H. and J.Z.; project administration, F.Y., J.Y. and J.Z.; funding acquisition, F.Y. and Q.H. All authors have read and agreed to the published version of the manuscript.

Funding

This research was funded by [National Natural Science Foundation of China] grant number [52374391], [52234010].

Conflicts of Interest

The authors declare no conflict of interest.

References

  1. Rosca, V.; Duca, M.; de Groot, M.T.; Koper, M.T.M. Nitrogen Cycle Electrocatalysis. Chem. Rev. 2009, 109, 2209–2244. [Google Scholar] [CrossRef] [PubMed]
  2. Comer, B.M.; Fuentes, P.; Dimkpa, C.O.; Liu, Y.-H.; Fernandez, C.A.; Arora, P.; Realff, M.; Singh, U.; Hatzell, M.C.; Medford, A.J. Prospects and Challenges for Solar Fertilizers. Joule 2019, 3, 1578–1605. [Google Scholar] [CrossRef]
  3. Martínez, J.; Ortiz, A.; Ortiz, I. State-of-the-art and perspectives of the catalytic and electrocatalytic reduction of aqueous nitrates. Appl. Catal. B Environ. 2017, 207, 42–59. [Google Scholar] [CrossRef]
  4. Bae, S.-E.; Stewart, K.L.; Gewirth, A.A. Nitrate Adsorption and Reduction on Cu(100) in Acidic Solution. J. Am. Chem. Soc. 2007, 129, 10171–10180. [Google Scholar] [CrossRef] [PubMed]
  5. Zhao, X.; Li, Z.; Gao, S.; Sun, X.; Zhu, S. CoS2@TiO2 nanoarray: A heterostructured electrocatalyst for high-efficiency nitrate reduction to ammonia. Chem. Commun. 2022, 58, 12995–12998. [Google Scholar] [CrossRef]
  6. Xu, T.; Zheng, H.; Zhang, P.; Lin, W.; Sekiguchi, Y. Hydrothermal preparation of nanoporous TiO2 films with exposed {001} facets and superior photocatalytic activity. J. Mater. Chem. A 2015, 3, 19115–19122. [Google Scholar] [CrossRef]
  7. Carp, O.; Huisman, C.L.; Reller, A. Photoinduced reactivity of titanium dioxide. Prog. Solid State Chem. 2004, 32, 33–177. [Google Scholar] [CrossRef]
  8. Jia, R.; Wang, Y.; Wang, C.; Ling, Y.; Yu, Y.; Zhang, B. Boosting selective nitrate electroreduction to ammonium by constructing oxygen vacancies in TiO2. ACS Catal. 2020, 10, 3533–3540. [Google Scholar] [CrossRef]
  9. Wei, Z.; Niu, X.; Yin, H.; Yu, S.; Li, J. Synergistic effect of oxygen defects and hetero-phase junctions of TiO2 for selective nitrate electroreduction to ammonia. Appl. Catal. A Gen. 2022, 636, 118596. [Google Scholar] [CrossRef]
  10. Wang, C.; Ge, X.; Fan, H.; Yang, F.; Hu, Q.; Li, J. Simultaneous tuning of particle size and phase composition of TiO2- nanoparticles by a simple liquid immiscibility strategy. J. Mater. Sci. Technol. 2023, 145, 1–6. [Google Scholar] [CrossRef]
  11. Chen, J.; He, X.; Zhao, D.; Li, J.; Sun, S.; Luo, Y.; Zheng, D.; Li, T.; Liu, Q.; Xie, L.; et al. Greatly enhanced electrochemical nitrate-to-ammonia conversion over an Fe-doped TiO2 nanoribbon array. Green Chem. 2022, 24, 7913–7917. [Google Scholar] [CrossRef]
  12. Zhao, D.; Ma, C.; Li, J.; Li, R.; Fan, X.; Zhang, L.; Dong, K.; Luo, Y.; Zheng, D.; Sun, S.; et al. Direct eight-electron NO3-to-NH3 conversion: Using a Co-doped TiO2 nanoribbon array as a high-efficiency electrocatalyst. Inorg. Chem. Front. 2022, 9, 6412–6417. [Google Scholar] [CrossRef]
  13. Hu, T.; Wang, C.; Wang, M.; Li, C.M.; Guo, C. Theoretical insights into superior nitrate reduction to ammonia performance of copper catalysts. ACS Catal. 2021, 11, 14417–14427. [Google Scholar] [CrossRef]
  14. Gao, B.; Lim, T.M.; Subagio, P.; Lim, T. Zr-doped TiO2 for enhanced photocatalytic degradation of bisphenol A. Appl. Catal. A Gen. 2010, 375, 107–115. [Google Scholar] [CrossRef]
  15. Shannon, R.D. Revised effective ionic radii and systematic studies of interatomic distances in halides and chalcogenides. Acta Crystallogr. Sect. A 1976, 31, 751–767. [Google Scholar] [CrossRef]
  16. Kresse, G.; Furthmüller, J. Efficiency of ab-initio total energy calculations for metals and semiconductors using a plane-wave basis set. Comput. Mater. Sci. 1996, 6, 15–50. [Google Scholar] [CrossRef]
  17. Kresse, G.; Joubert, D. From ultrasoft pseudopotentials to the projector augmented-wave method. Phys. Rev. B 1999, 59, 1758–1775. [Google Scholar] [CrossRef]
  18. Blöchl, P.E. Projector augmented-wave method. Phys. Rev. B 1994, 50, 17953–17979. [Google Scholar] [CrossRef]
  19. Perdew, J.P.; Burke, K.; Ernzerhof, M. Generalized gradient approximation made simple. Phys. Rev. Lett. 1996, 77, 3865–3868. [Google Scholar] [CrossRef]
  20. Xu, H.; Cheng, D.; Cao, D.; Zeng, X.C. A universal principle for a rational design of single-atom electrocatalysts. Nat. Catal. 2018, 1, 339–348. [Google Scholar] [CrossRef]
  21. Mathew, K.; Sundararaman, R.; Letchworth-Weaver, K.; Arias, T.A.; Hennig, R.G. Implicit solvation model for density-functional study of nanocrystal surfaces and reaction pathways. J. Chem. Phys. 2014, 140, 084106. [Google Scholar] [CrossRef] [PubMed]
  22. Grimme, S.; Ehrlich, S.; Goerigk, L. Effect of the damping function in dispersion corrected density functional theory. J. Comput. Chem. 2011, 32, 1456–1465. [Google Scholar] [CrossRef] [PubMed]
  23. Weirich, T.E.; Winterer, M.; Seifried, S.; Mayer, J. Sturcture of nanocrystalline anatase solved and refined from electron powder data. Acta Crystallogr. Sect. A 2002, 58, 308–315. [Google Scholar] [CrossRef] [PubMed]
  24. Guo, Q.; Zhou, C.; Ma, Z.; Ren, Z.; Fan, H.; Yang, X. Elementary photocatalytic chemistry on TiO2 surfaces. Chem. Soc. Rev. 2016, 45, 3701–3730. [Google Scholar] [CrossRef] [PubMed]
  25. Li, H.; Sun, W.; Bi, Z.; Yuan, X.; Zhang, J.; Wu, Y. First-principles study of methanol adsorption and dissociation reactivity on the anatase TiO2 (101) surface: The effect of Co doping and oxygen vacancy. Catal. Lett. 2023, 153, 104–113. [Google Scholar] [CrossRef]
  26. Lide, D.R. (Ed.) CRC Handbook of Chemistry and Physics, 90th ed.; (CD-ROM Version 2010); CRC Press/Taylor and Francis: Boca Raton, FL, USA, 2010. [Google Scholar]
  27. Chase, M.W. NIST-JANAF Thermochemical Tables; 2 Volume-Set, Journal of Physical and Chemical Reference Data Monographs; American Institute of Physics: Melville, NY, USA, 1998. [Google Scholar]
  28. Guo, Y.; Cai, X.; Shen, S.; Wang, G.; Zhang, J. Computational prediction and experimental evaluation of nitrate reduction to ammonia on rhodium. J. Catal. 2021, 402, 1–9. [Google Scholar] [CrossRef]
  29. Calle-Vallejo, F.; Huang, M.; Henry, J.B.; Koper, M.T.M.; Bandarenka, A.S. Theoretical design and experimental implementation of Ag/Au electrodes for the electrochemical reduction of nitrate. Phys. Chem. Chem. Phys. 2013, 15, 3196–3202. [Google Scholar] [CrossRef]
  30. Chen, W.; Yang, X.; Chen, Z.; Ou, Z.; Hu, J.; Xu, Y.; Li, Y.; Ren, X.; Ye, S.; Qiu, J.; et al. Emerging Applications, developments, prospects, and challenges of electrochemical nitrate-to-ammonia conversion. Adv. Funct. Mater. 2023, 33, 2300512. [Google Scholar] [CrossRef]
  31. Qin, J.; Liu, N.; Wei, Y.; Lu, Y.; Huang, Y.; Zhao, Q.; Ye, Z. The mechanism of efficient photoreduction nitrate over anatase TiO2 in simulated sunlight. Chemosphere 2022, 307, 135921. [Google Scholar] [CrossRef]
  32. Wang, K.; Gong, Z.; Luo, H.; Jin, K.; Hua, Y.; Wu, W. DRIFT study of the adsorption of NH3 and NOx over rare earth concentrate enriched from Bayan Obo Tailings. Combust. Sci. Technol. 2018, 190, 770–783. [Google Scholar] [CrossRef]
  33. Chen, G.-F.; Yuan, Y.; Jiang, H.; Ren, S.-Y.; Ding, L.-X.; Ma, L.; Wu, T.; Lu, J.; Wang, H. Electrochemical reduction of nitrate to ammonia via direct eight-electron transfer using a copper–molecular solid catalyst. Nat. Energy 2020, 5, 605–613. [Google Scholar] [CrossRef]
  34. Zhang, Q.; Li, Y.; Geng, M.; Zhu, J.; Sun, H.; Jiang, B. Defect-engineered TiO2 nanotube cathode for nitrate reduction to ammonia and upcycling into (NH4)2SO4 in the paired electrolysis system. Appl. Catal. B Environ. 2023, 330, 122658. [Google Scholar] [CrossRef]
  35. Hoffman, R. Solids and Surfaces: A Chemist’s View of Bonding in Extended Structures; VCH Publishers, Inc.: New York, NY, USA, 1988. [Google Scholar]
  36. Hughbanks, T.; Hoffmann, R. Chains of trans-edge-sharing molybdenum octahedra: Metal-metal bonding in extended systems. J. Am. Chem. Soc. 1983, 105, 3528–3537. [Google Scholar] [CrossRef]
  37. Luo, Y.R. Compressive Handbook of Chemical Bond Energies; CRC Press: Boca Raton, FL, USA, 2017. [Google Scholar]
  38. Sun, Y.; Ren, X.; Sun, S.; Liu, Z.; Xi, S.; Xu, Z.J. Engineering high-spin state cobalt cations in spinel zinc cobalt oxide for spin channel propagation and active site enhancement in water oxidation. Angew. Chem. Int. Ed. 2021, 60, 14536–14544. [Google Scholar] [CrossRef]
Figure 1. Optimized configurations for DFT calculations: (ac) supercell models for undoped TiO2, Zr-doping on TiO2 (101) surface (labelled as Zr-TiO2-S), and Zr-doping on bulk TiO2 (labelled as Zr-TiO2-B), respectively; (df) top views of the surfaces of the above three models. The Zr-doping levels for Zr-TiO2-S and Zr-TiO2-B were 2.8% and 25%, respectively.
Crystals 13 01640 g001
Figure 2. The charge density difference (CDD) when nitrate adsorbed on the (101) surfaces of (a) undoped TiO2; (b) Zr-TiO2-S and (c) Zr-TiO2-B. The navy electronic cloud indicates charge depletion and the red electronic cloud indicates charge accumulation. The isosurfaces are 0.005 eV/Å3.
Crystals 13 01640 g002
Figure 3. The −COHP between oxygen and active sites. (a,b) Ti1-O1′ and Ti2-O2′ in the undoped TiO2 model, respectively; (c,d) Zr-O1′ and Ti-O2′ in the Zr-TiO2-S model, respectively; (e,f) Zr1-O1′ and Zr2-O2′ in the Zr-TiO2-B model, respectively. ICOHP values are indicated in each figure.
Crystals 13 01640 g003
Figure 4. (a) Possible reduction pathways on the (101) surface of undoped TiO2; (b) the corresponding Gibbs free energy variation in each pathway. The symbol * stands for an active site on the surface.
Crystals 13 01640 g004
Figure 5. (a) Possible reduction pathways on the (101) surface of Zr-TiO2-S; (b) the corresponding Gibbs free energy variations in each pathway. The symbol * stands for an active site on the surface.
Crystals 13 01640 g005
Figure 6. (a) Possible reduction pathways on the (101) surface of Zr-TiO2-B; (b) the corresponding Gibbs energy variation in each pathway. The symbol * stands for an active site on the surface.
Crystals 13 01640 g006
Figure 7. Molecular orbitals for (a) *NO, (b) *NOH and (c) *NHO. 3σ, 5σ and 1π are bonding orbitals, while 4σ, 6σ and 2π are anti-bonding orbitals.
Crystals 13 01640 g007
Figure 8. Comparison of the Gibbs free energy variation in each step in the thermodynamically favored reaction pathway on the (101) surfaces of TiO2, Zr-TiO2-S and Zr-TiO2-B models. The symbol * stands for an active site on the surface.
Crystals 13 01640 g008
Table 1. Bond length and QATIM atomic basin charge before and after nitrate adsorption.
ModelActive SiteM-O Bond Length/ÅQATIM Atomic Basin Charge
BeforeAfterBeforeAfterVariation
TiO2Ti12.662.327.7247.7580.034
Ti22.852.737.7247.7410.017
Zr-TiO2-SZr2.252.629.0589.0900.032
Ti2.262.217.7447.735−0.009
Zr-TiO2-BZr11.512.399.1009.1660.066
Zr21.682.419.1029.1640.062
Table 2. Adsorption Gibbs free energy of NO2, NO, and H on the (101) surfaces of the TiO2, Zr-TiO2-S, and Zr-TiO2-B models.
ModelAdsorption Gibbs Free Energy/eV
NO2NOH
TiO20.5950.3310.603
Zr-TiO2-S1.0430.4050.352
Zr-TiO2-B0.9980.6270.300
Disclaimer/Publisher’s Note: The statements, opinions and data contained in all publications are solely those of the individual author(s) and contributor(s) and not of MDPI and/or the editor(s). MDPI and/or the editor(s) disclaim responsibility for any injury to people or property resulting from any ideas, methods, instructions or products referred to in the content.

