
Construction of Oxygen Vacancies of Zr-Doped CeO2 with Enhanced Dye Adsorption Performance


Abstract
:1. Introduction
2. Materials and Methods
2.1. Materials
2.2. Synthesis of Zr Doping of Nano-CeO2 Nanoparticles
2.3. Characterization
2.4. Batch Adsorption Study
3. Results
3.1. Phase Analysis
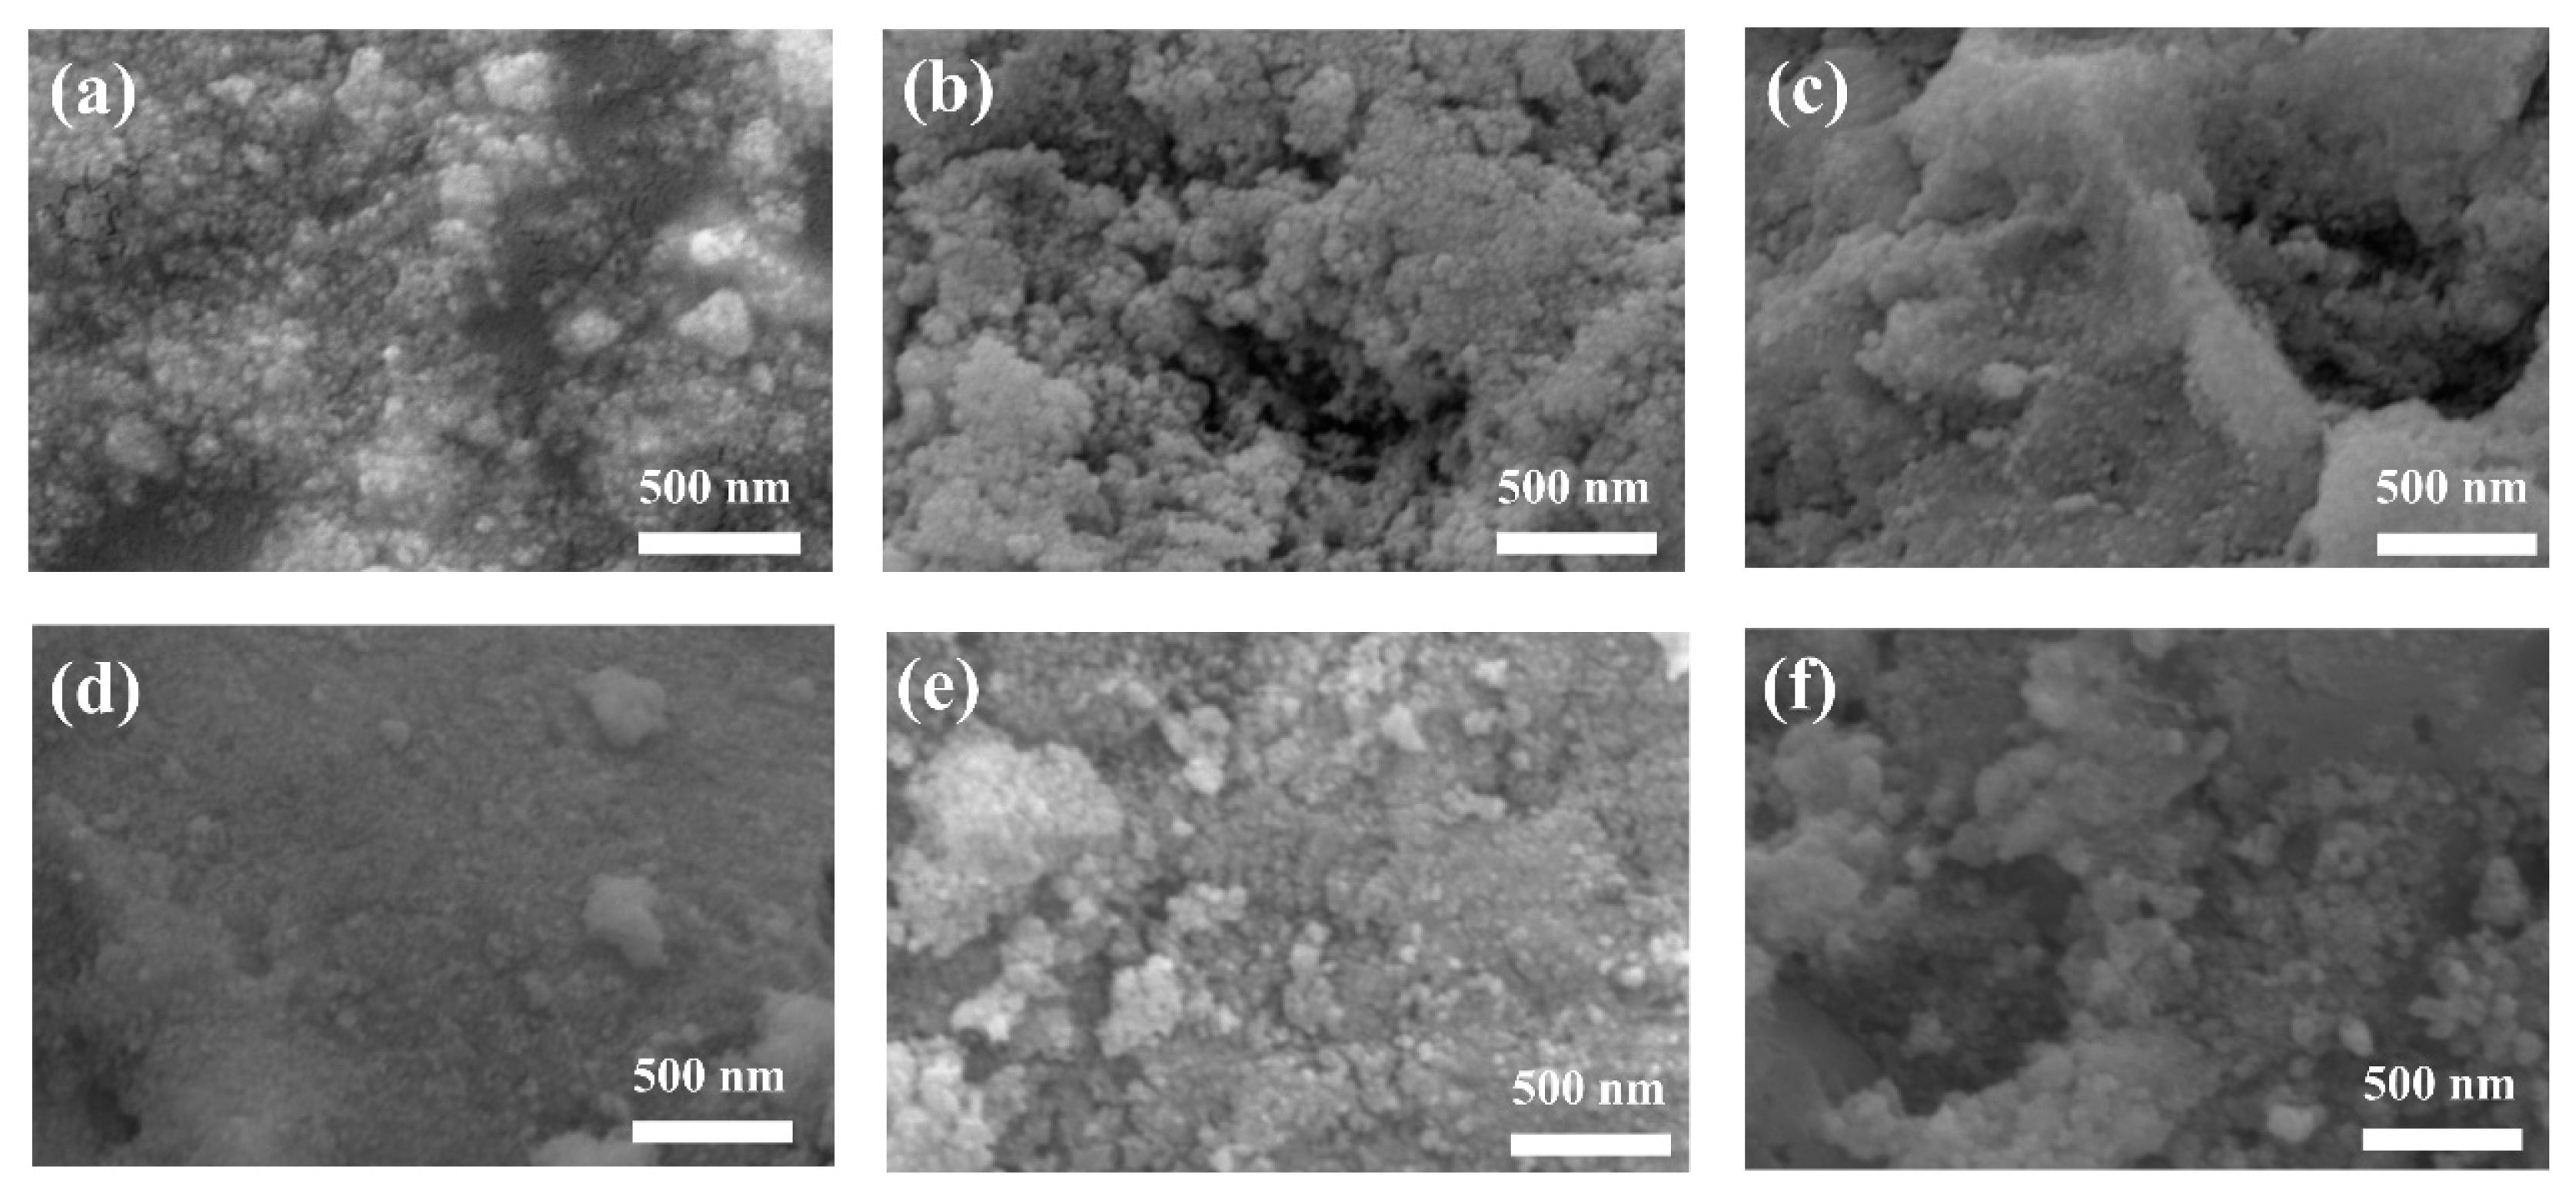
3.2. SEM Analysis
3.3. TEM Analysis
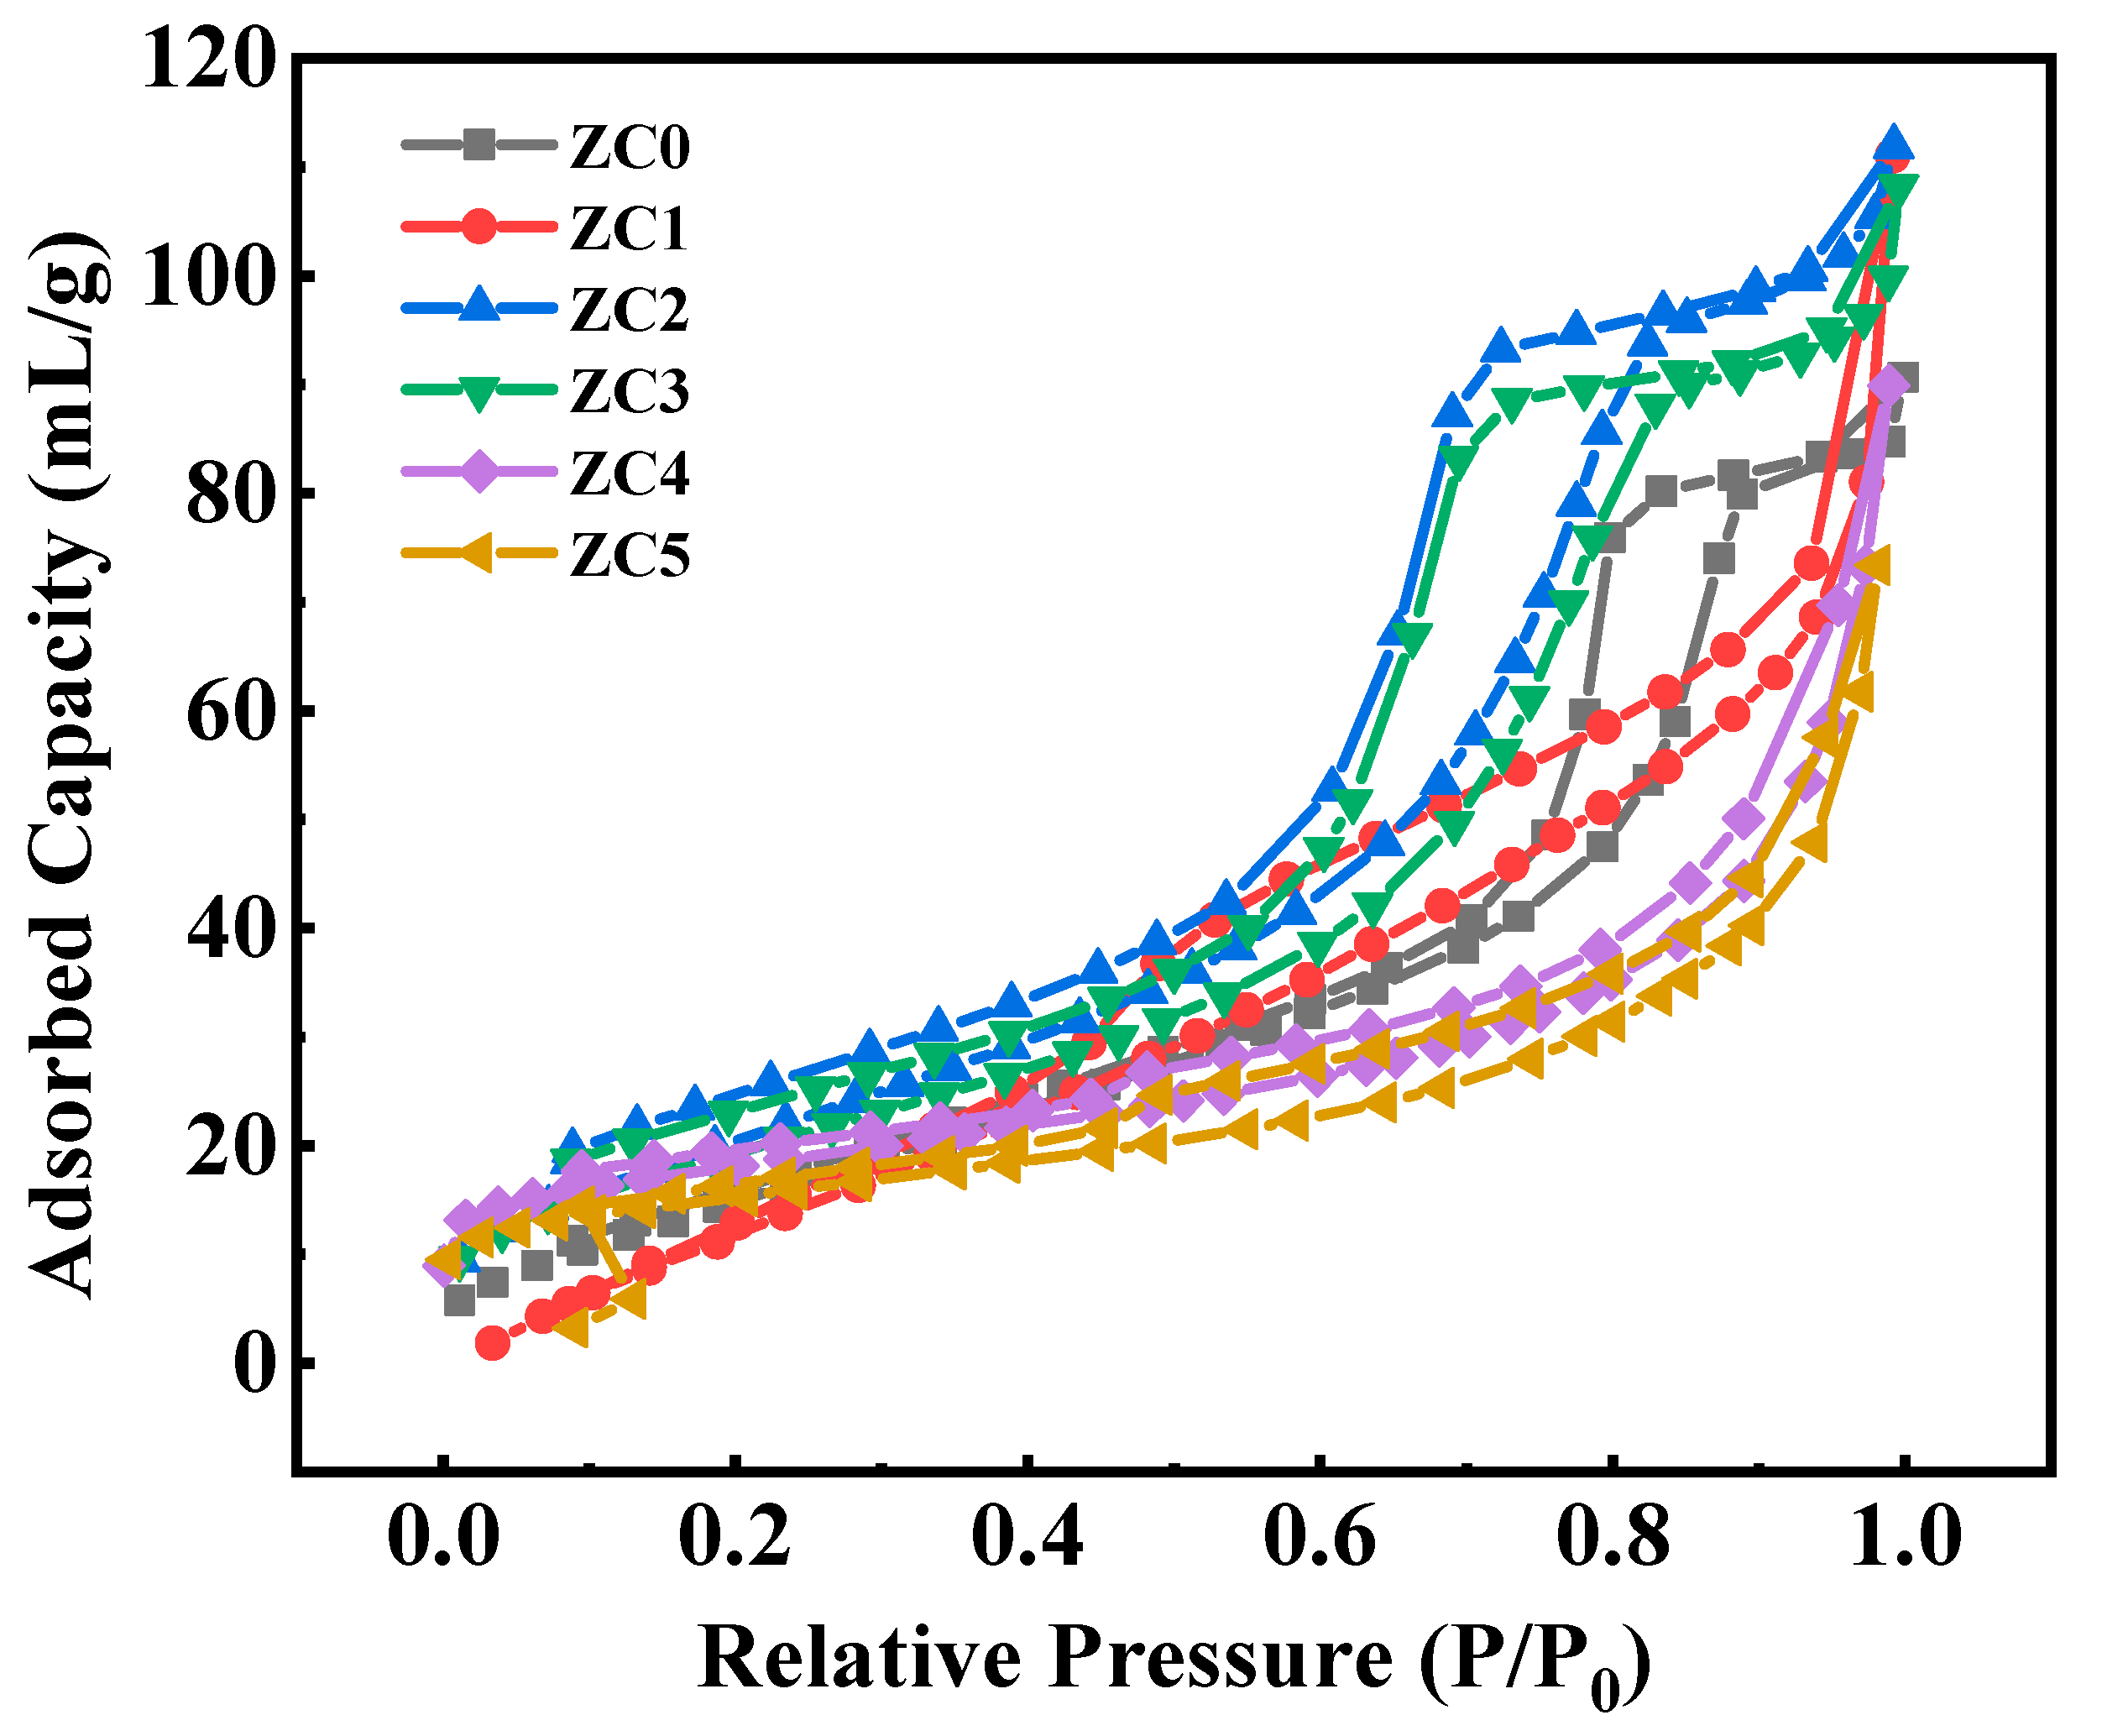
3.4. BET Analysis
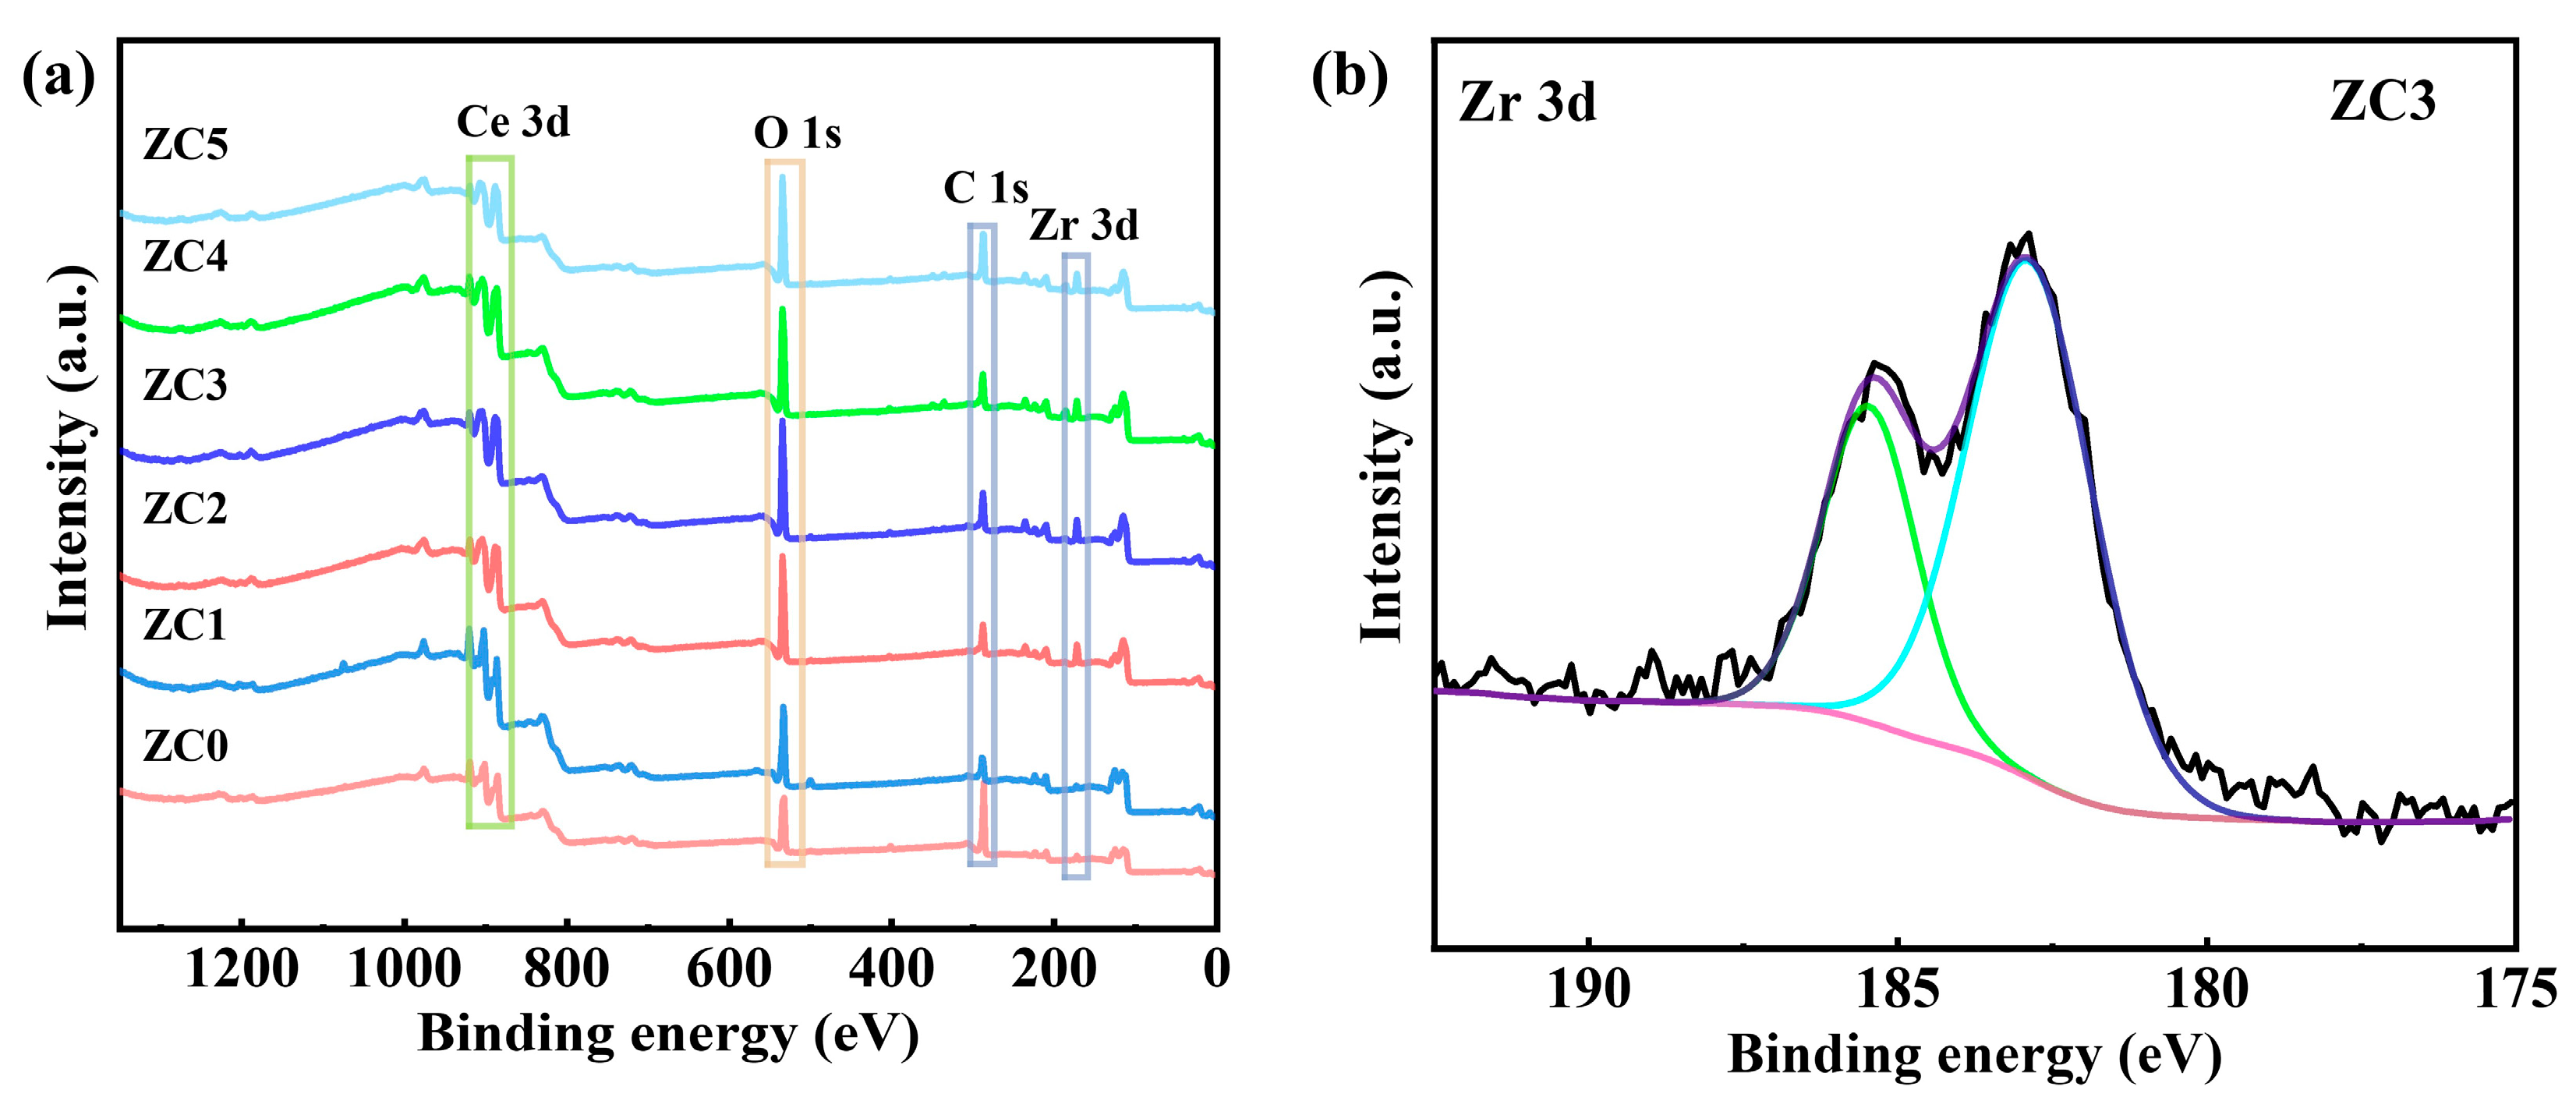
3.5. X-ray Photoelectron Spectroscopy
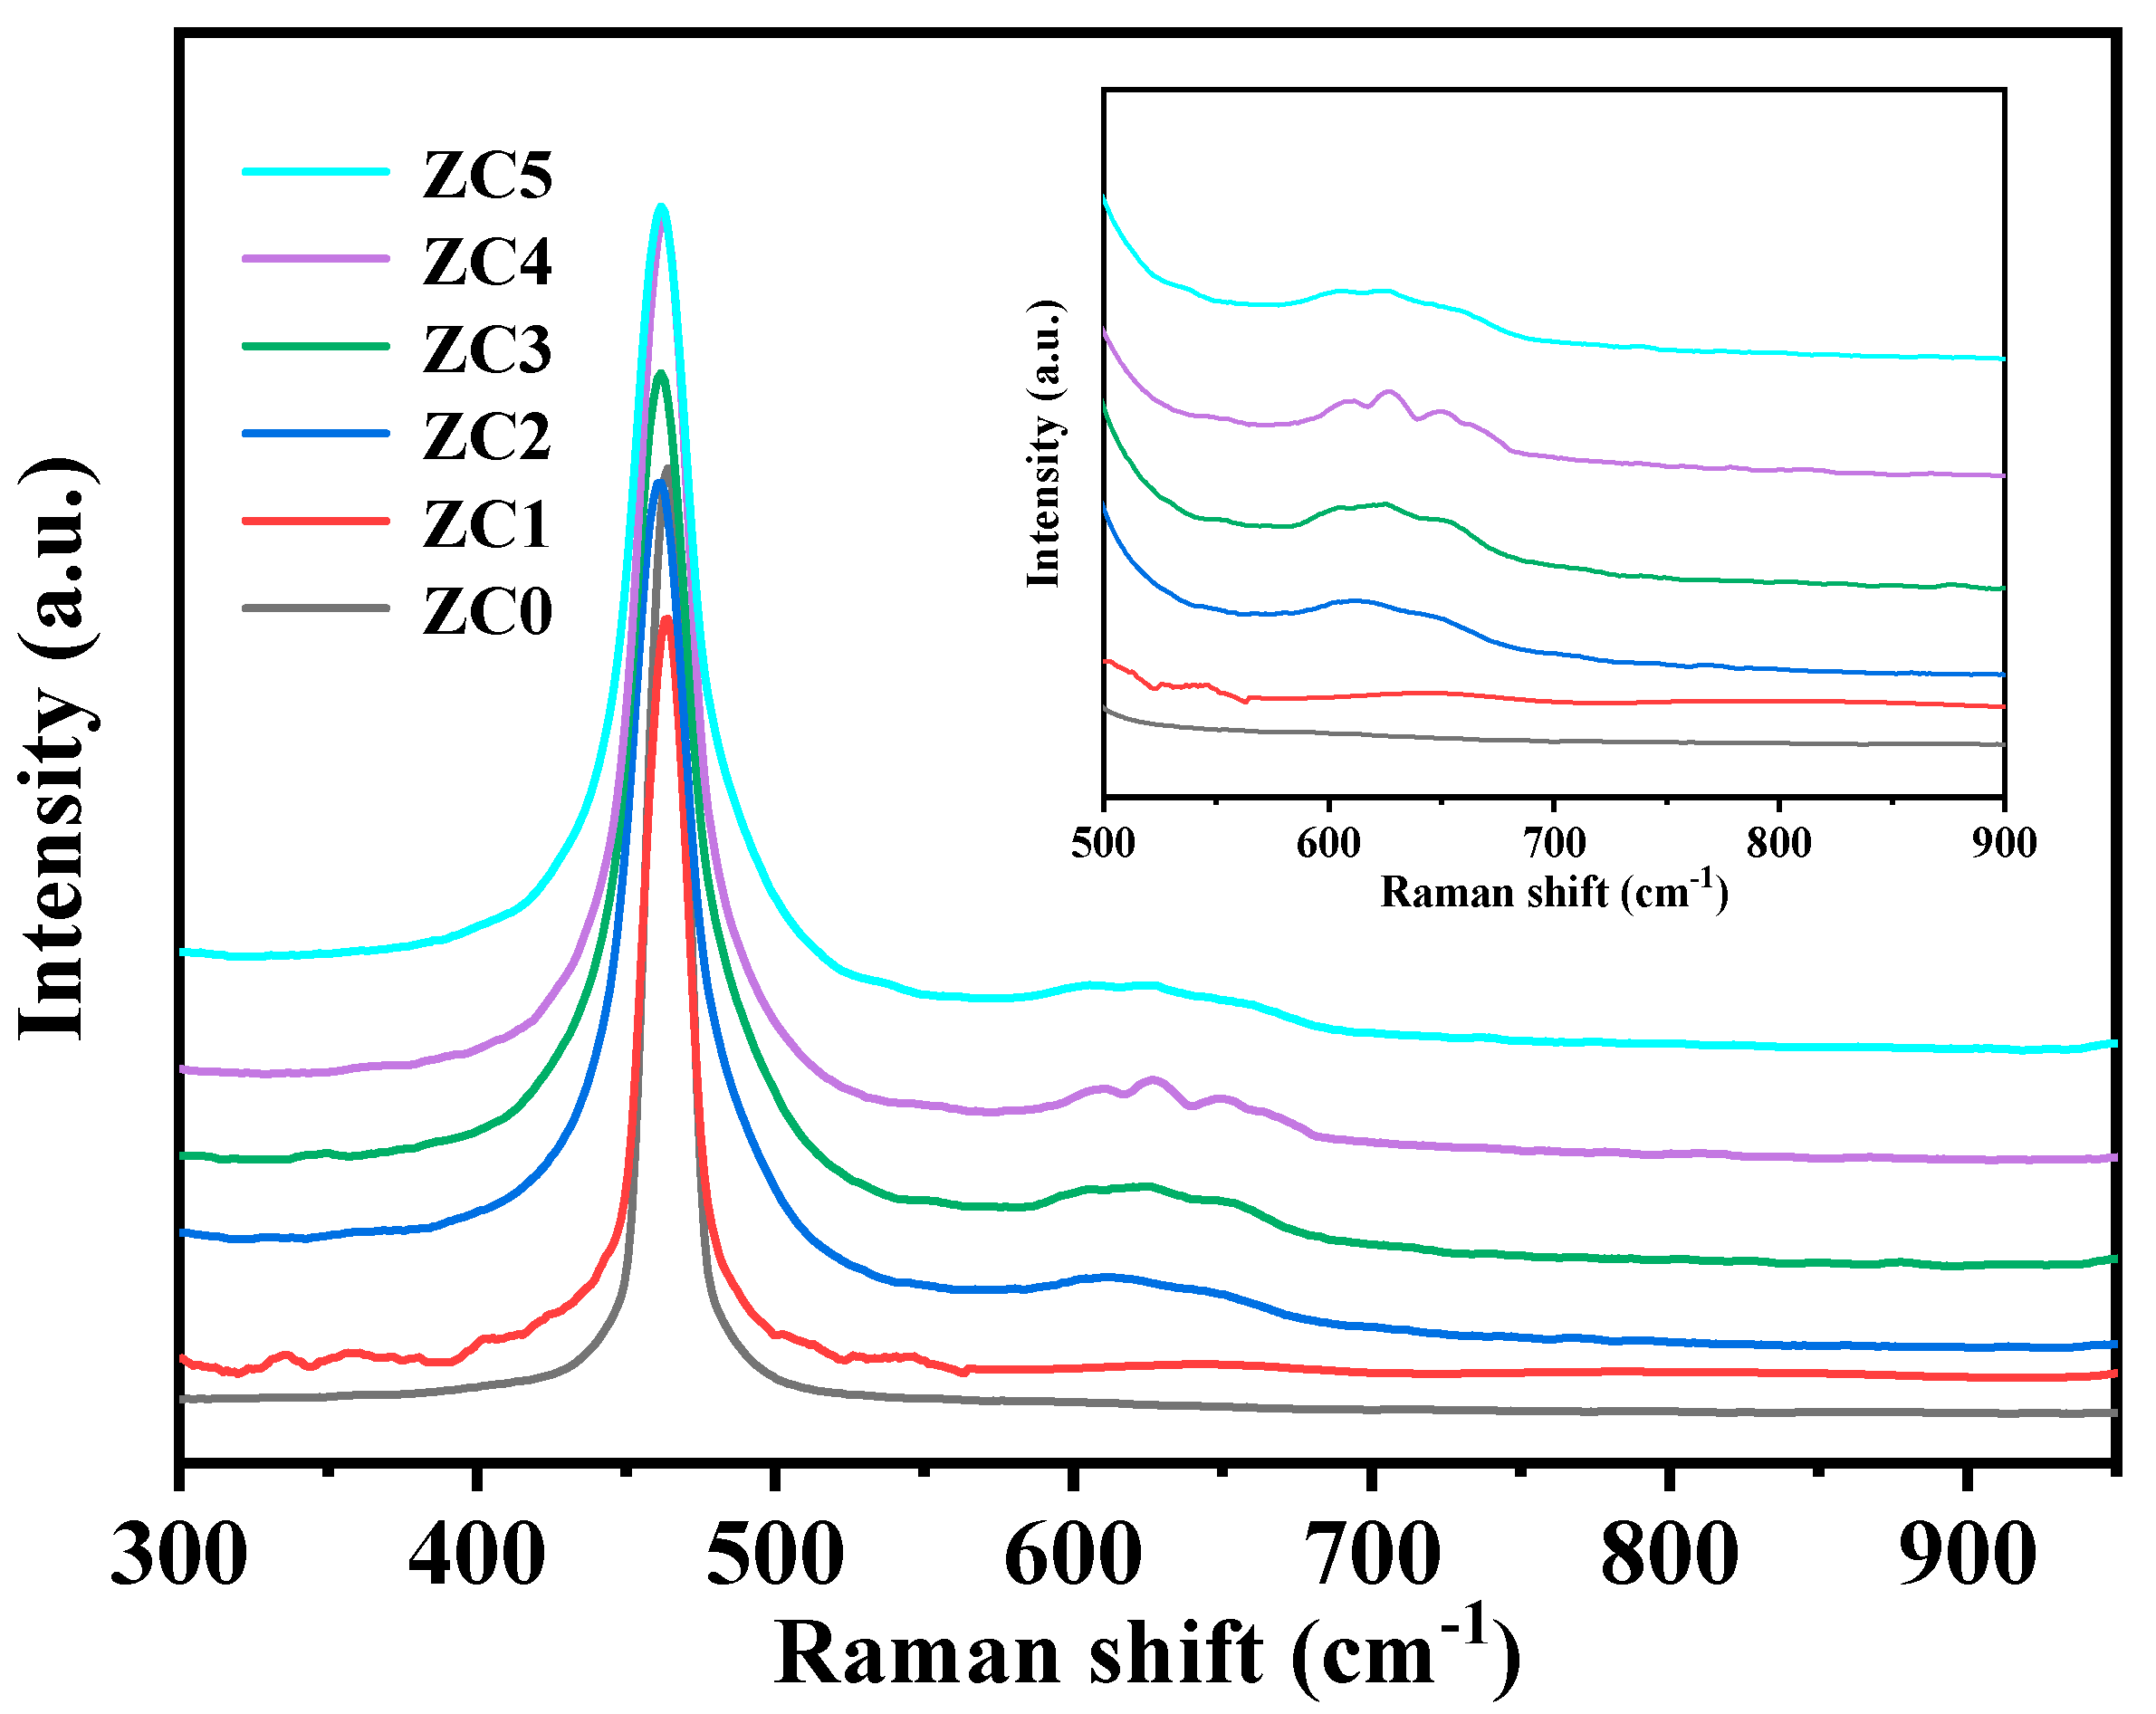
3.6. Raman Analysis
3.7. Adsorption of CR
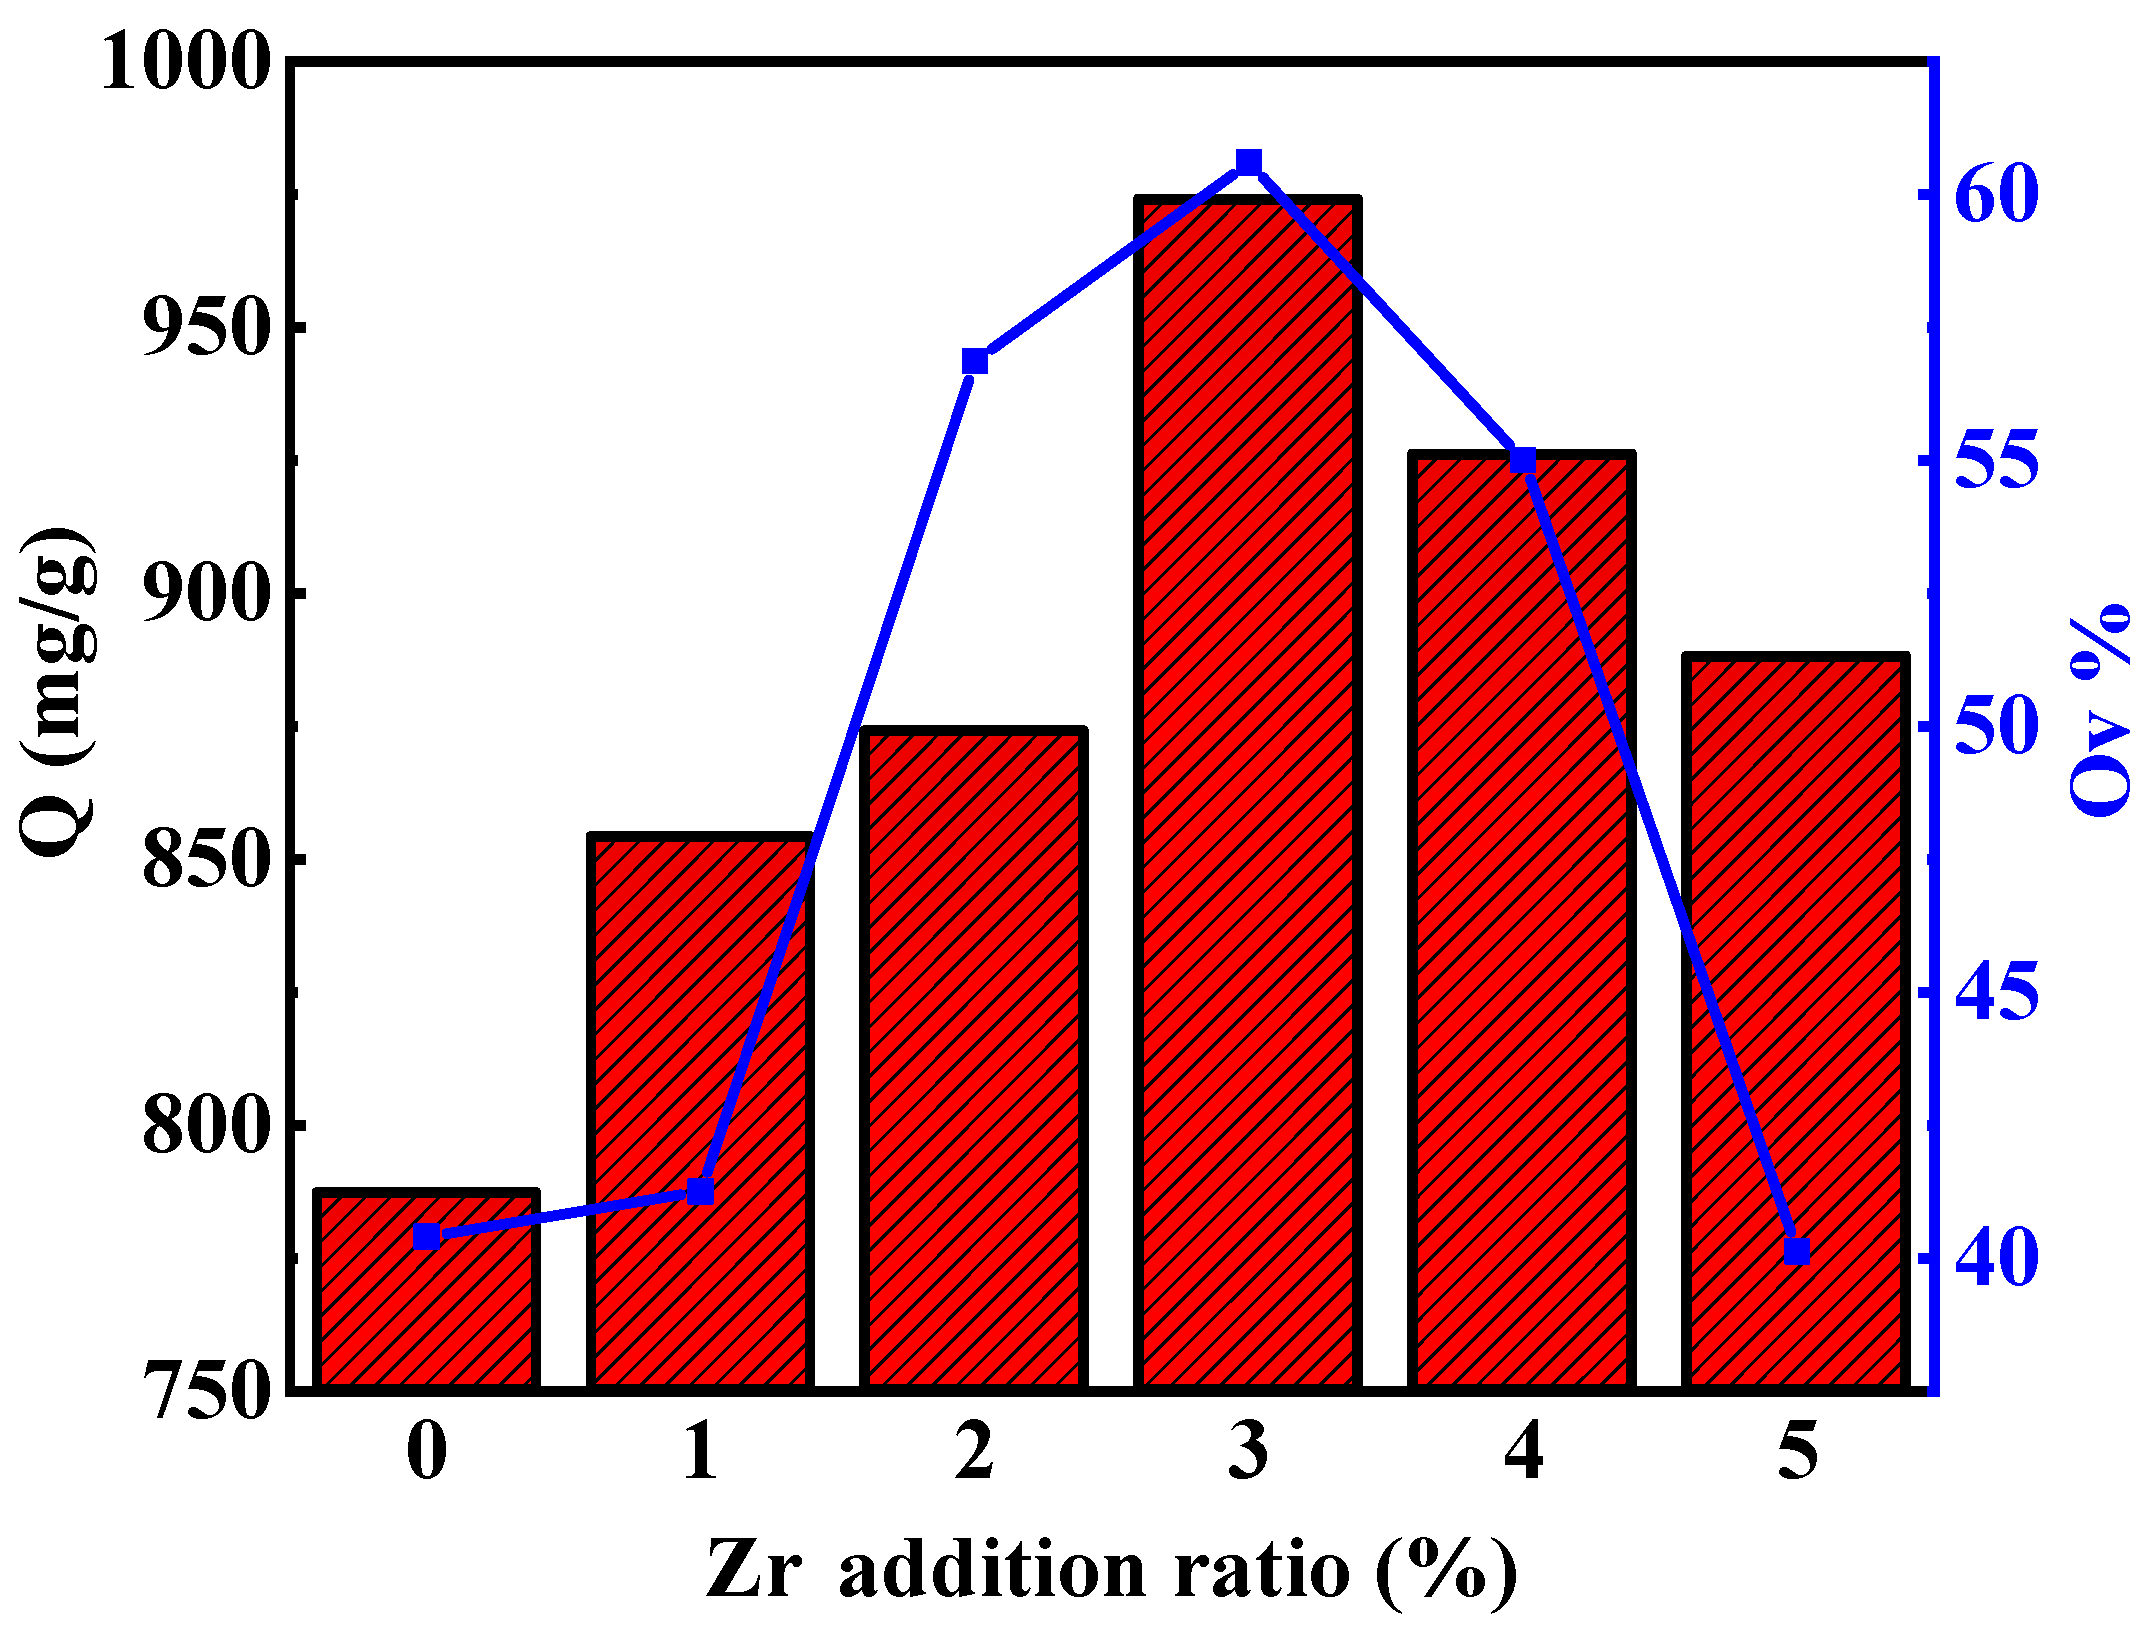
3.7.1. Effect of Zr Doping Amount on Adsorption Properties
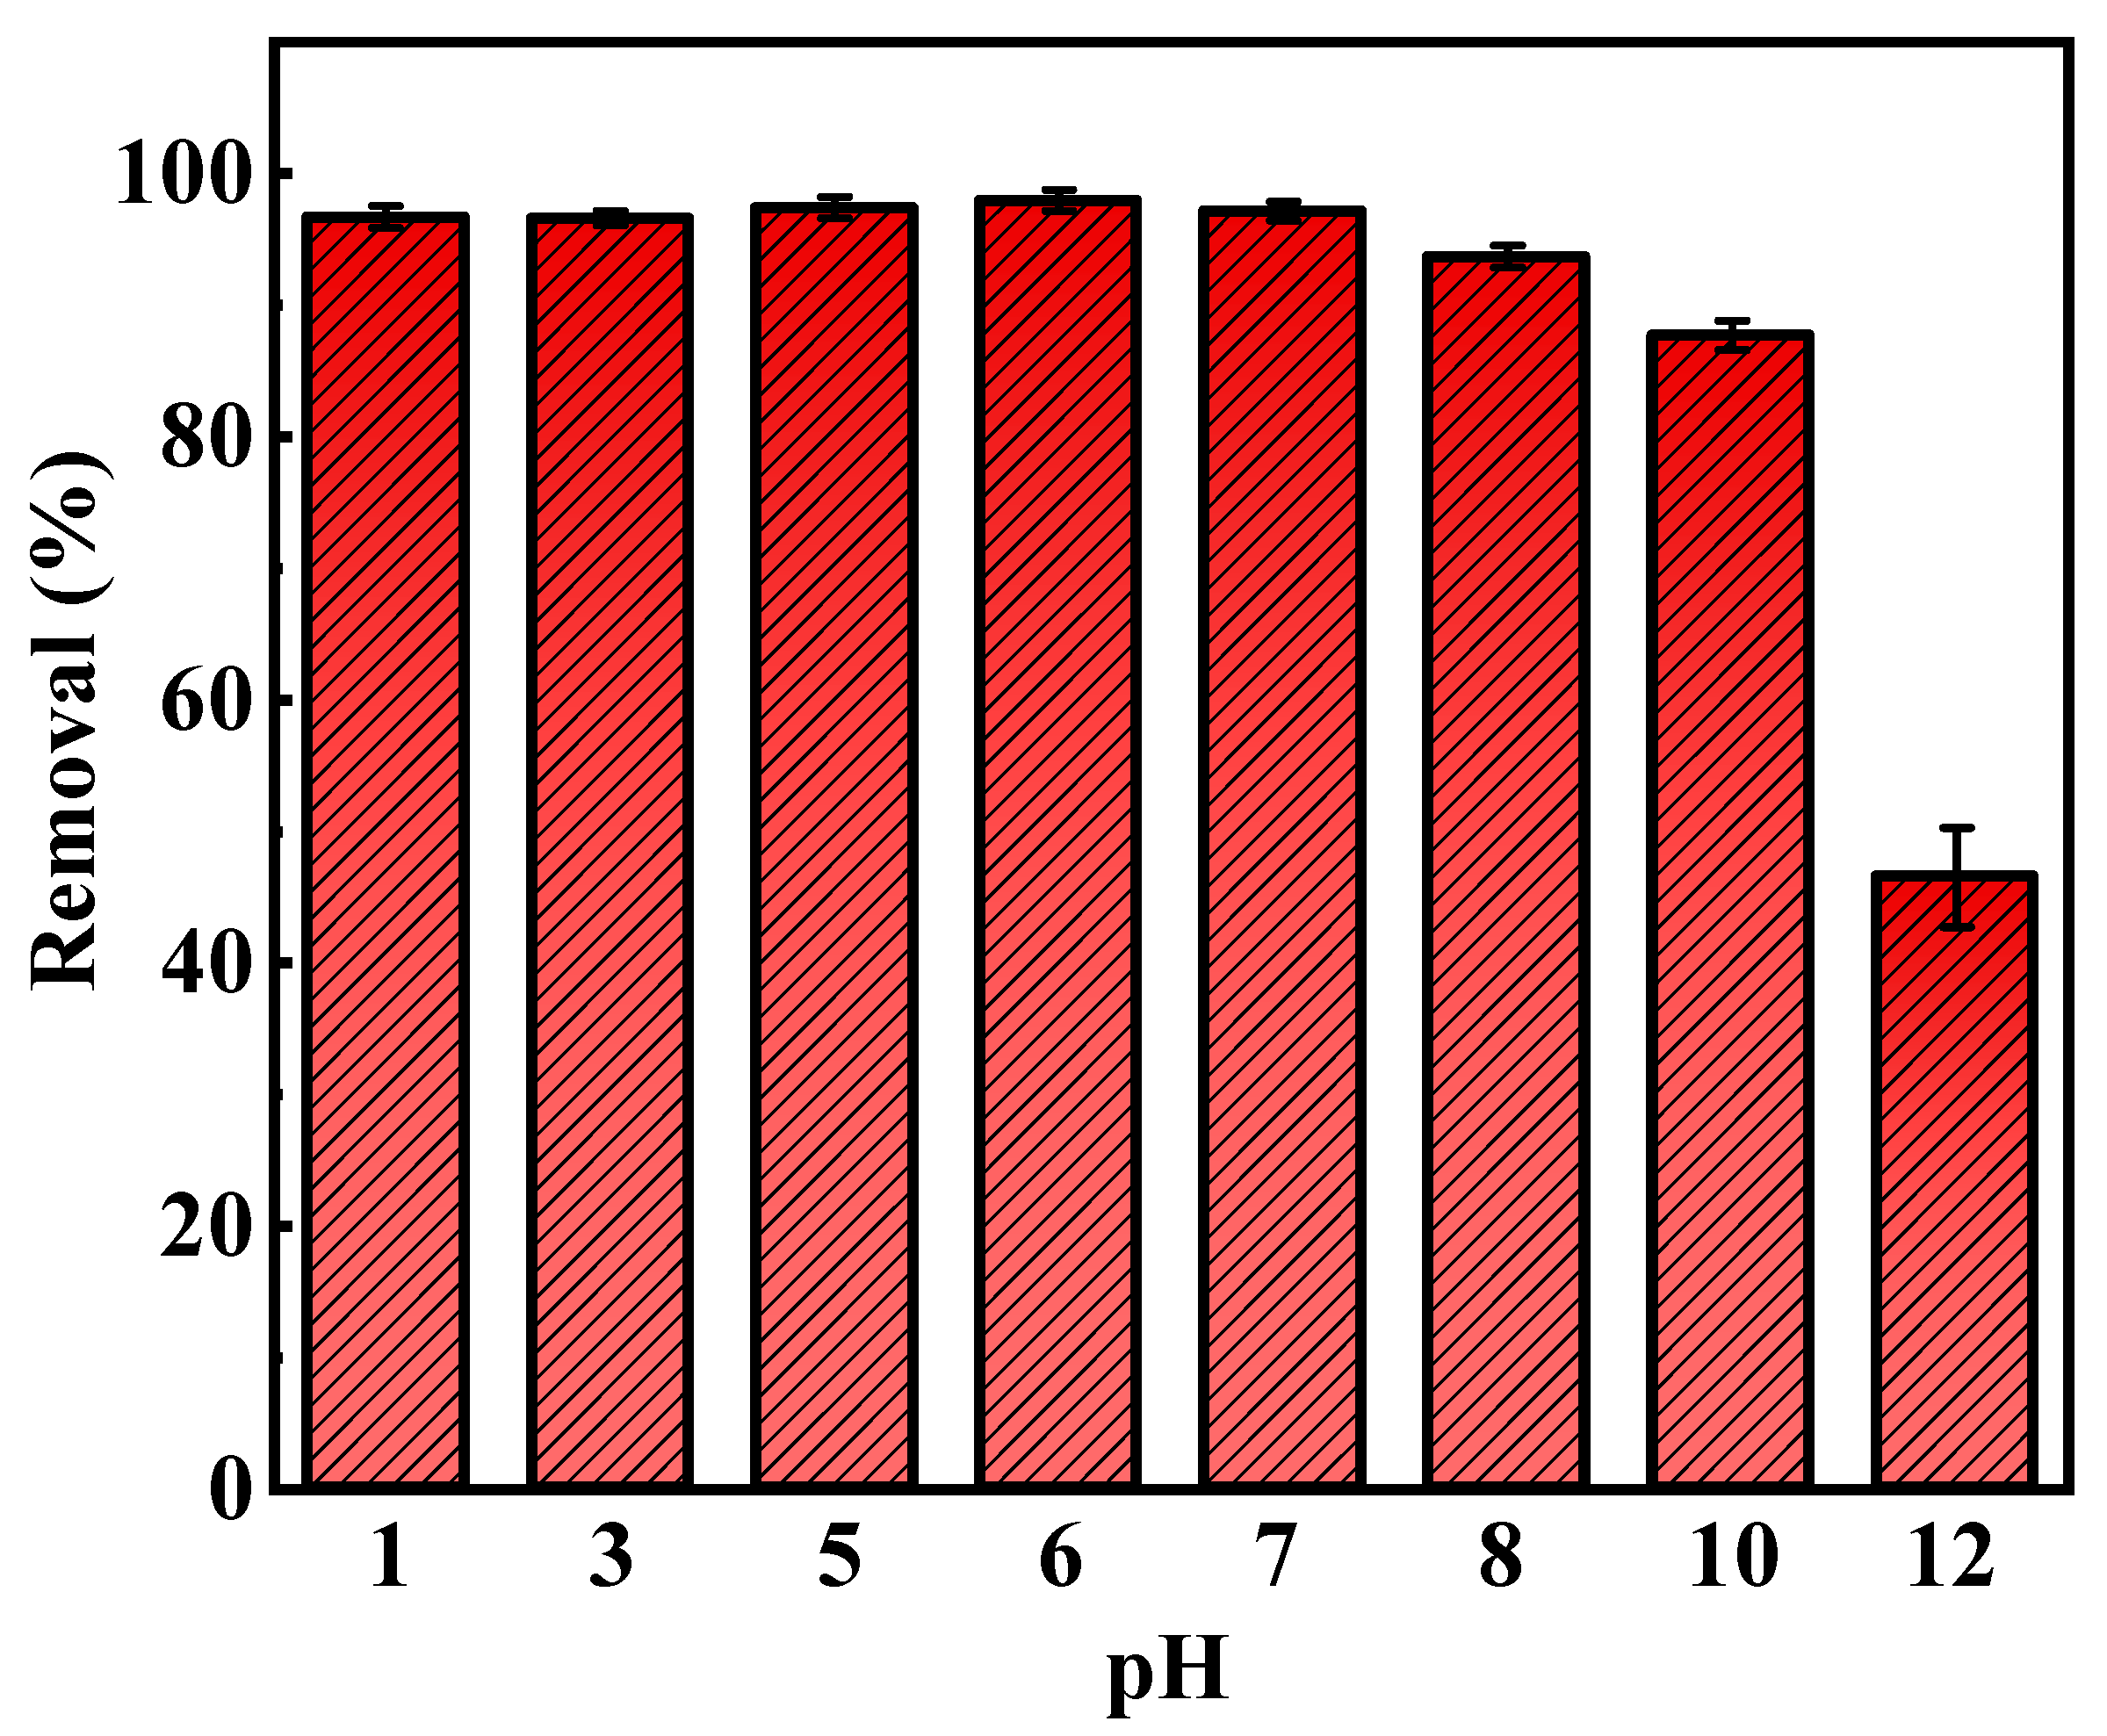
3.7.2. Effect of pH
3.7.3. Effect of Contact Time
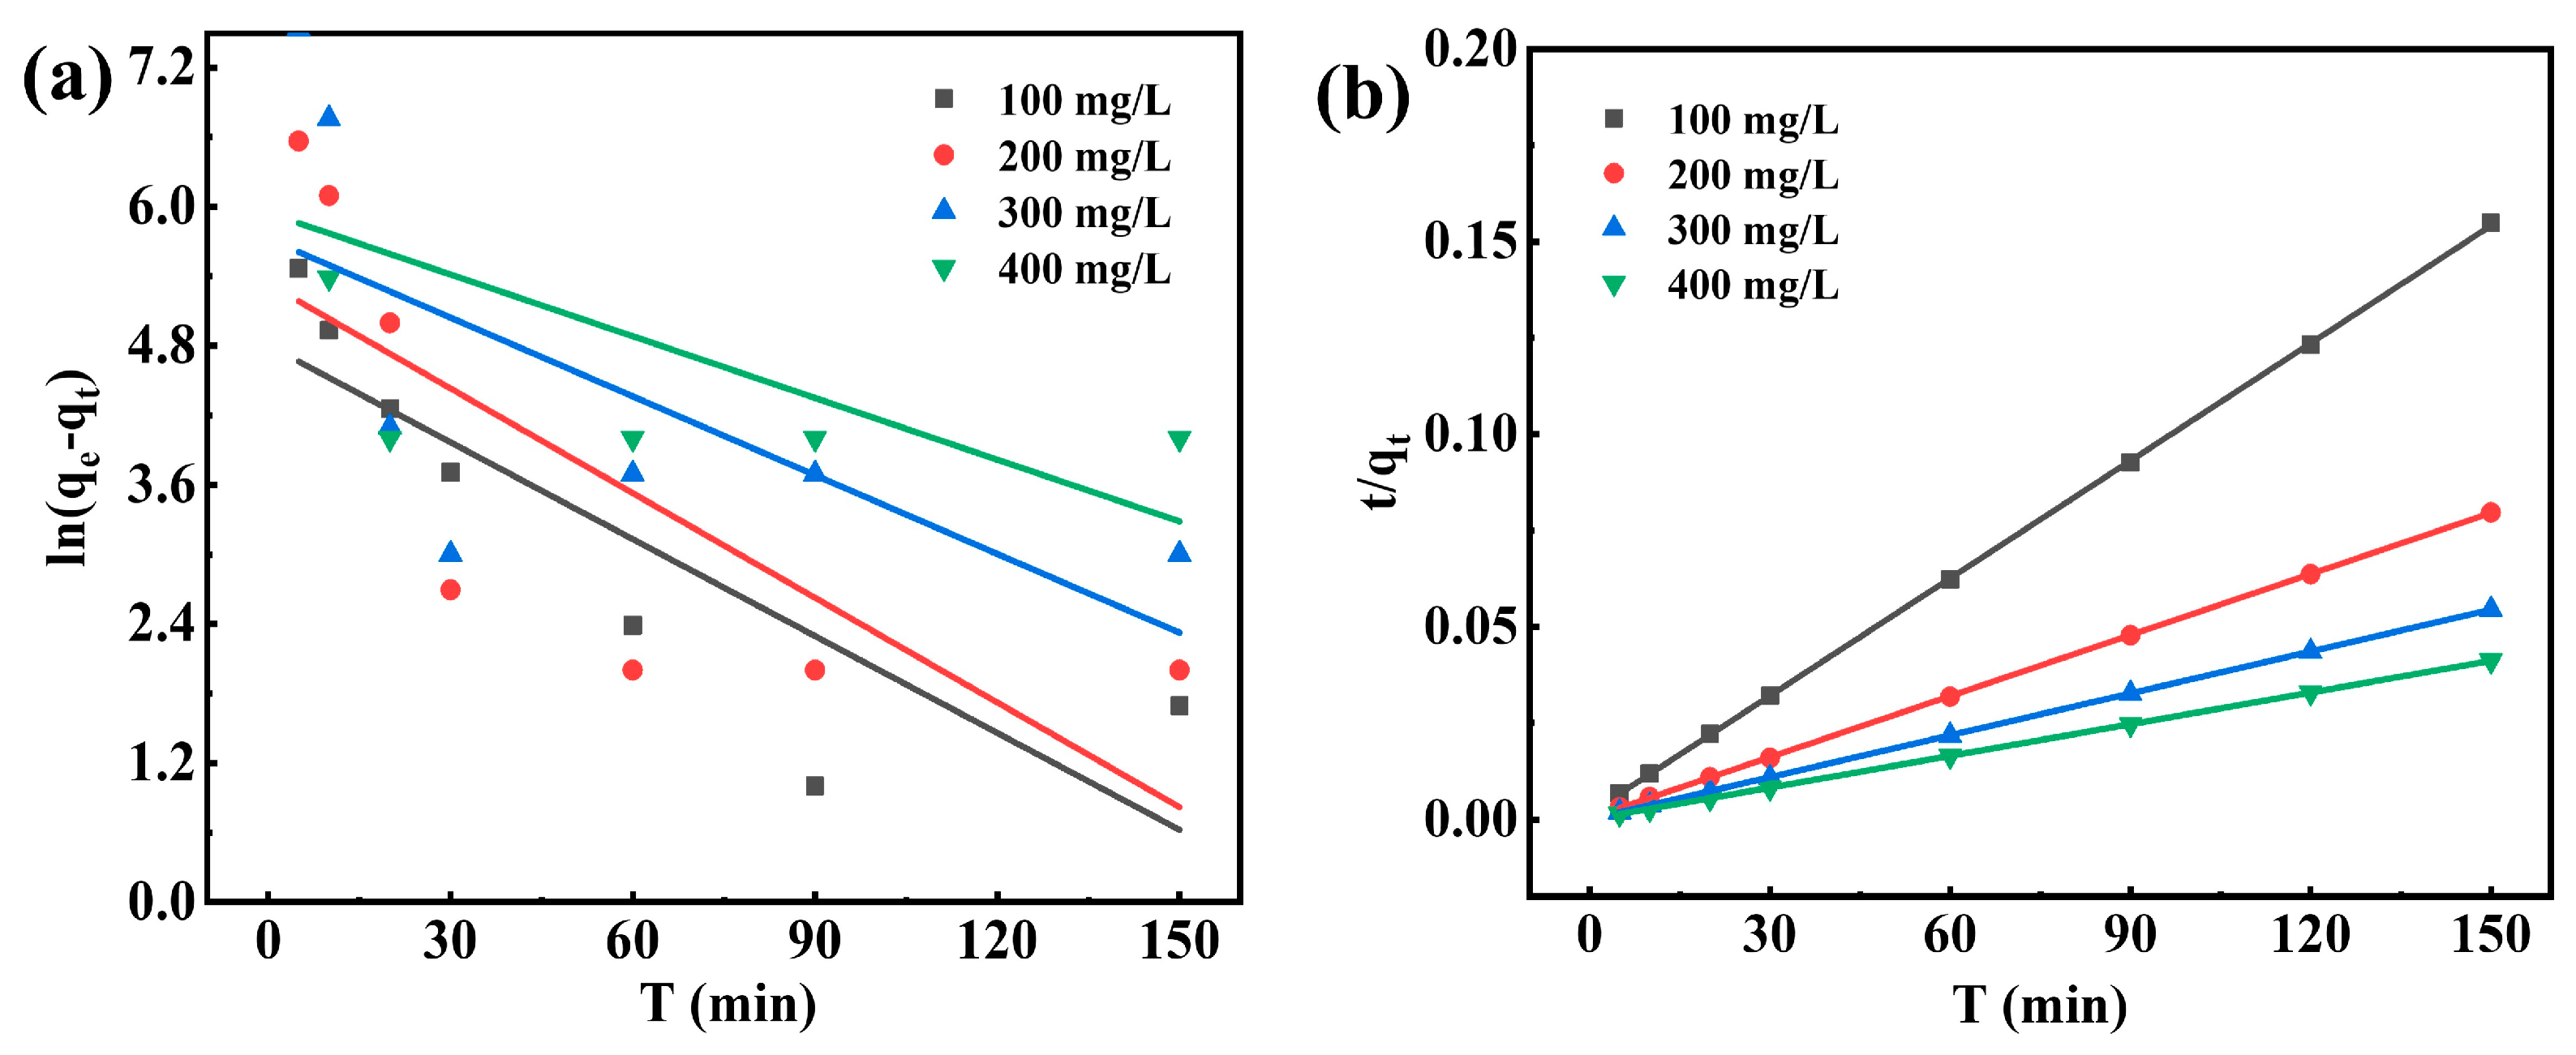
3.7.4. Adsorption Kinetics
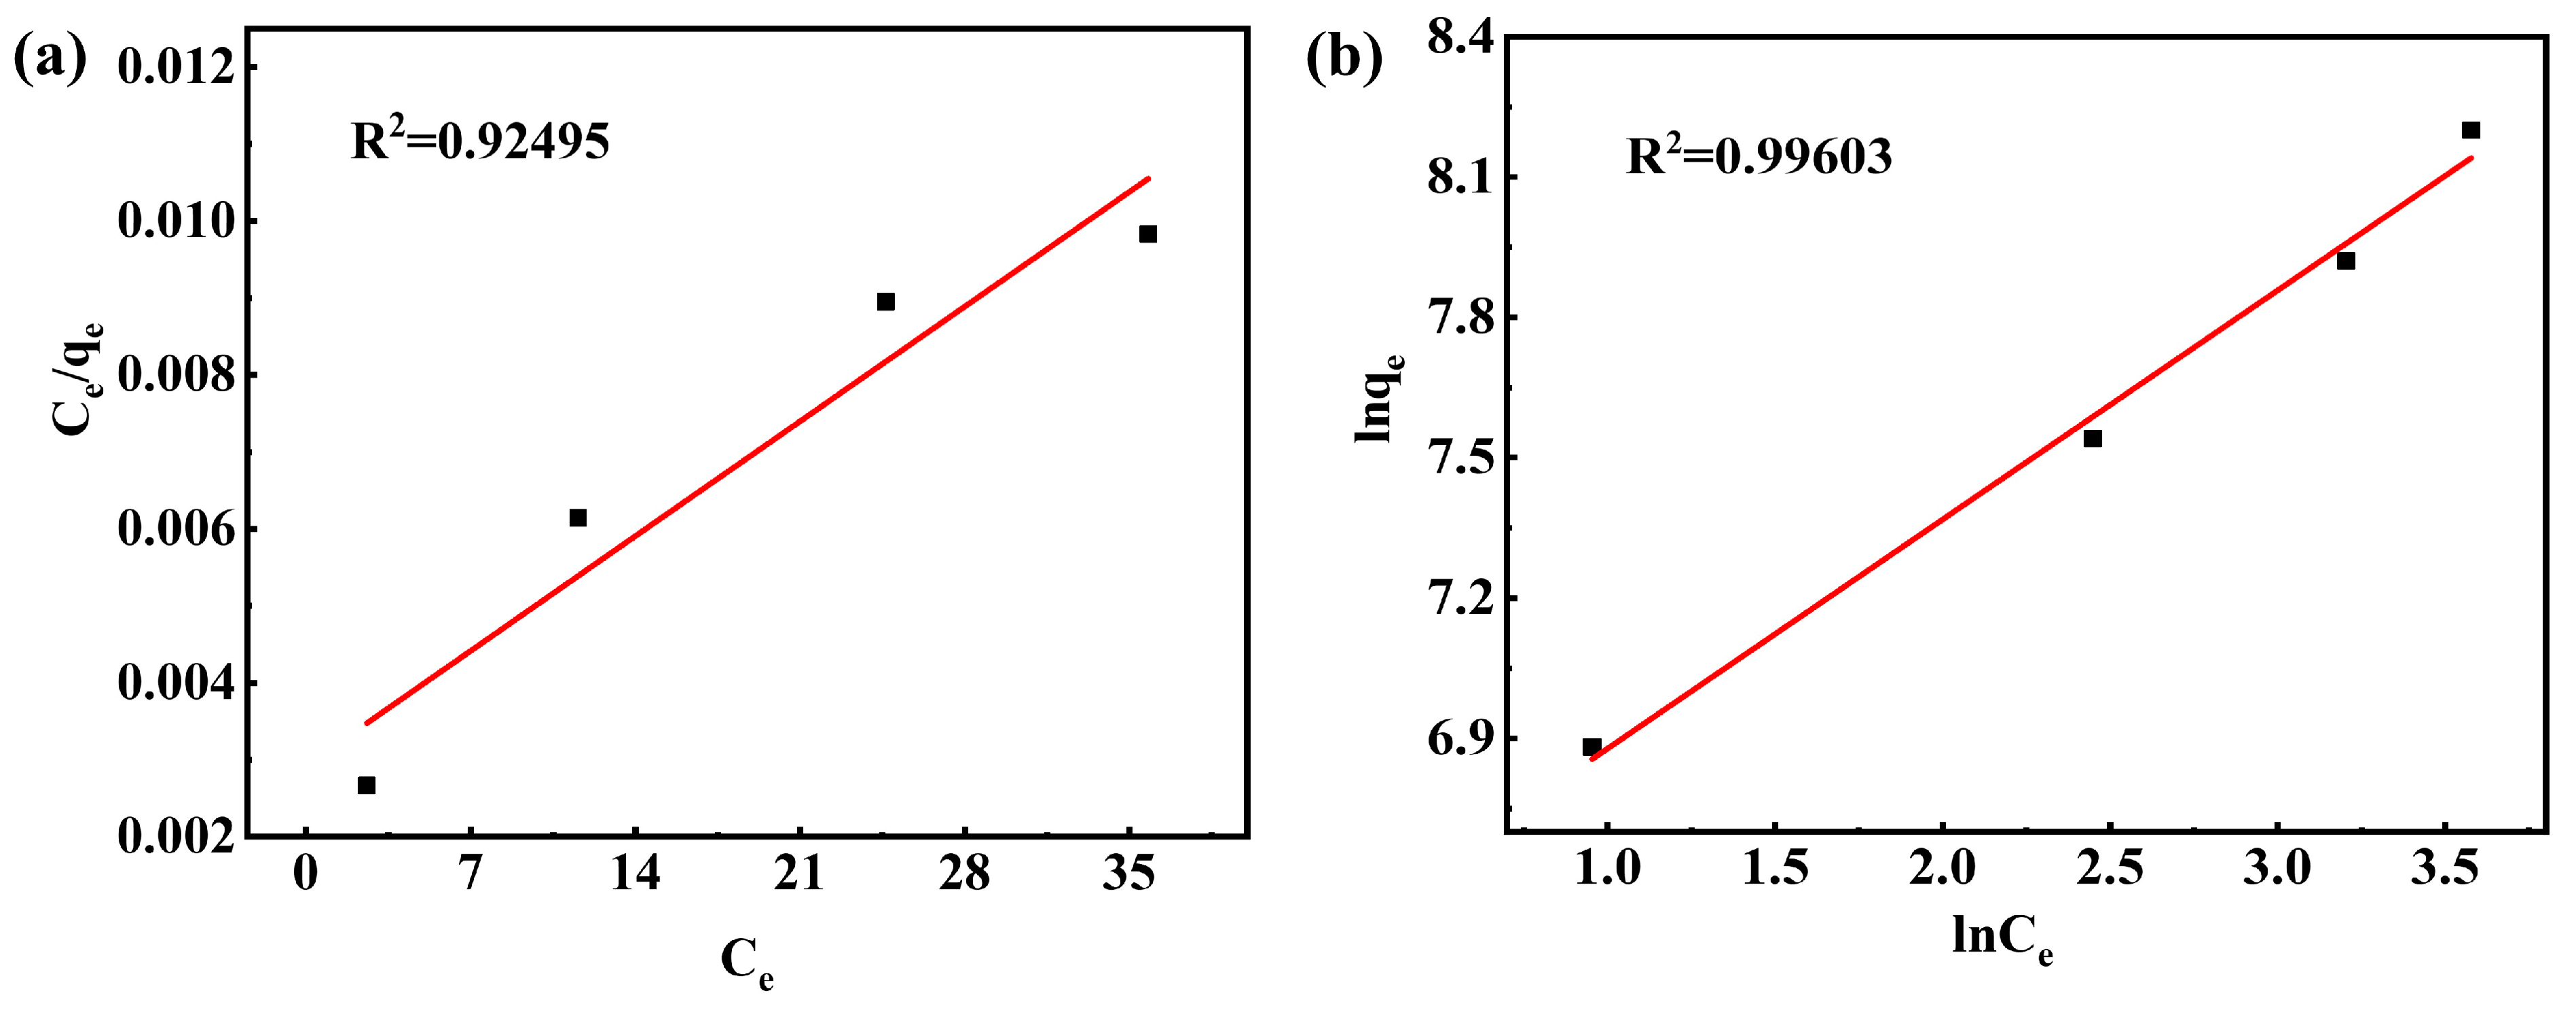
3.7.5. Adsorption Isotherm
4. Conclusions
Supplementary Materials
Author Contributions
Funding
Data Availability Statement
Acknowledgments
Conflicts of Interest
References
- Liu, Z.; Zhang, J.; Zhang, L.; Guan, Y.; Ji, H.; Zhang, Y.; Gao, H. Efficient removal of Congo red and methylene blue using biochar from Medulla Tetrapanacis modified by potassium carbonate. Bioresour. Technol. 2023, 376, 128912. [Google Scholar] [CrossRef] [PubMed]
- Praveen, S.; Jegan, J.; Bhagavathi Pushpa, T.; Gokulan, R.; Bulgariu, L. Biochar for removal of dyes in contaminated water: An overview. Biochar 2022, 4, 10. [Google Scholar] [CrossRef]
- Liu, Z.; Hu, Y.; Zhang, J.; Guan, Y.; Zhang, L.; Ye, P.; Zhang, T.; Huang, X.; Wang, M.; Gao, H. Enhanced adsorption of Congo red from urea/calcium chloride co-modified biochar: Performance, mechanisms and toxicity assessment. Bioresour. Technol. 2023, 388, 129783. [Google Scholar] [CrossRef] [PubMed]
- Cho, S.-H.; Jung, S.; Park, J.; Lee, S.; Kim, Y.; Lee, J.; Fai Tsang, Y.; Kwon, E.E. Strategic use of crop residue biochars for removal of hazardous compounds in wastewater. Bioresour. Technol. 2023, 387, 129658. [Google Scholar] [CrossRef] [PubMed]
- Kloster, G.A.; Mosiewicki, M.A.; Marcovich, N.E. Chitosan/iron oxide nanocomposite films: Effect of the composition and preparation methods on the adsorption of congo red. Carbohydr. Polym. 2019, 221, 186–194. [Google Scholar] [CrossRef] [PubMed]
- Zheng, Y.; Cheng, B.; Fan, J.; Yu, J.; Ho, W. Review on nickel-based adsorption materials for Congo red. J. Hazard. Mater. 2021, 403, 123559. [Google Scholar] [CrossRef]
- Poornima, P.V.; Parimaladevi, R.; Sathe, V.; Mahalingam, U. Graphene boosted silver nanoparticles as surface enhanced Raman spectroscopic sensors and photocatalysts for removal of standard and industrial dye contaminants. Sens. Actuat. B 2019, 281, 679–688. [Google Scholar] [CrossRef]
- Shaban, M.; Abukhadra, M.R.; Shahien, M.G.; Ibrahim, S.S. Novel bentonite/zeolite-NaP composite efficiently removes methylene blue and Congo red dyes. Environ. Chem. Lett. 2018, 16, 275–280. [Google Scholar] [CrossRef]
- Hussain, Z.; Chang, N.; Sun, J.; Xiang, S.; Ayaz, T.; Zhang, H.; Wang, H. Modification of coal fly ash and its use as low-cost adsorbent for the removal of directive, acid and reactive dyes. J. Hazard. Mater. 2022, 422, 126778. [Google Scholar] [CrossRef]
- Tochetto, G.A.; Simão, L.; de Oliveira, D.; Hotza, D.; Immich, A.P.S. Porous geopolymers as dye adsorbents: Review and perspectives. J. Clean. Prod. 2022, 374, 133982. [Google Scholar] [CrossRef]
- Liu, J.; Wang, Z.; Li, H.; Hu, C.; Raymer, P.; Huang, Q. Effect of solid state fermentation of peanut shell on its dye adsorption performance. Bioresour. Technol. 2018, 249, 307–314. [Google Scholar] [CrossRef] [PubMed]
- Stanciu, M.C.; Nichifor, M. Influence of dextran hydrogel characteristics on adsorption capacity for anionic dyes. Carbohydr. Polym. 2018, 199, 75–83. [Google Scholar] [CrossRef] [PubMed]
- Yan, S.; Pan, Y.; Wang, L.; Liu, J.; Zhang, Z.; Huo, W.; Yang, J.; Huang, Y. Synthesis of low-cost porous ceramic microspheres from waste gangue for dye adsorption. J. Adv. Ceram. 2018, 7, 30–40. [Google Scholar] [CrossRef]
- Panchu, S.E.; Sekar, S.; Kolanthai, E.; Sridharan, M.B.; Subbaraya, N.K. Extremely fast and efficient removal of Congo Red using cationic-incorporated hydroxyapatite nanoparticles (HAp: X (X = Fe, Ni, Zn, Co, and Ag)). Crystals 2023, 13, 209. [Google Scholar] [CrossRef]
- Schmitt, R.; Nenning, A.; Kraynis, O.; Korobko, R.; Frenkel, A.I.; Lubomirsky, I.; Haile, S.M.; Rupp, J.L.M. A review of defect structure and chemistry in ceria and its solid solutions. Chem. Soc. Rev. 2020, 49, 554–592. [Google Scholar] [CrossRef]
- Kim, Y.G.; Lee, Y.; Lee, N.; Soh, M.; Kim, D.; Hyeon, T. Ceria-based therapeutic antioxidants for biomedical applications. Adv. Mater. 2022, 10, 819. [Google Scholar] [CrossRef] [PubMed]
- Olivera, S.; Chaitra, K.; Venkatesh, K.; Muralidhara, H.B.; Inamuddin; Asiri, A.M.; Ahamed, M.I. Cerium dioxide and composites for the removal of toxic metal ions. Environ. Chem. Lett. 2018, 16, 1233–1246. [Google Scholar] [CrossRef]
- Gupta, K.; Joshi, P.; Gusain, R.; Khatri, O.P. Recent advances in adsorptive removal of heavy metal and metalloid ions by metal oxide-based nanomaterials. Coord. Chem. Rev. 2021, 445, 214100. [Google Scholar] [CrossRef]
- Mallakpour, S.; Radfar, Z.; Feiz, M. Chitosan/tannic acid/ZnFe layered double hydroxides and mixed metal oxides nanocomposite for the adsorption of reactive dyes. Carbohydr. Polym. 2023, 305, 120528. [Google Scholar] [CrossRef]
- Gusain, R.; Gupta, K.; Joshi, P.; Khatri, O.P. Adsorptive removal and photocatalytic degradation of organic pollutants using metal oxides and their composites: A comprehensive review. Adv. Colloid Interface Sci. 2019, 272, 102009. [Google Scholar] [CrossRef]
- Suresh Kumar, P.; Korving, L.; Keesman, K.J.; van Loosdrecht, M.C.M.; Witkamp, G.-J. Effect of pore size distribution and particle size of porous metal oxides on phosphate adsorption capacity and kinetics. Chem. Eng. J. 2019, 358, 160–169. [Google Scholar] [CrossRef]
- Xiao, W.; Garba, Z.N.; Sun, S.; Lawan, I.; Wang, L.; Lin, M.; Yuan, Z. Preparation and evaluation of an effective activated carbon from white sugar for the adsorption of rhodamine B dye. J. Clean. Prod. 2020, 253, 119989. [Google Scholar] [CrossRef]
- Zhang, Y.; Wang, P.; Hussain, Z.; Zhang, H.; Wang, H.; Chang, N.; Li, F. Modification and characterization of hydrogel beads and its used as environmentally friendly adsorbent for the removal of reactive dyes. J. Clean. Prod. 2022, 342, 130789. [Google Scholar] [CrossRef]
- Sachin; Singh, N.; Shah, K.; Pramanik, B.K. Synthesis and application of manganese-doped zinc oxide as a potential adsorbent for removal of Congo red dye from wastewater. Environ. Res. 2023, 233, 116484. [Google Scholar] [CrossRef] [PubMed]
- Yahyaei, B.; Azizian, S. Rapid adsorption of anionic dyes by ordered nanoporous alumina. Chem. Eng. J. 2012, 209, 589–596. [Google Scholar] [CrossRef]
- Sun, C.; Li, H.; Chen, L. Nanostructured ceria-based materials: Synthesis, properties, and applications. Energy Environ. Sci. 2012, 5, 8475–8505. [Google Scholar] [CrossRef]
- Zhao, S.; Wen, Y.; Du, C.; Tang, T.; Kang, D. Introduction of vacancy capture mechanism into defective alumina microspheres for enhanced adsorption of organic dyes. Chem. Eng. J. 2020, 402, 126180. [Google Scholar] [CrossRef]
- Thangamani, K.S.; Muthulakshmi Andal, N.; Ranjith Kumar, E.; Saravanabhavan, M. Utilization of magnetic nano cobalt ferrite doped Capra aegagrus hircus dung activated carbon composite for the adsorption of anionic dyes. J. Environ. Chem. Eng. 2017, 5, 2820–2829. [Google Scholar] [CrossRef]
- Joshy, D.; Chakko, S.; Ismail, Y.A.; Periyat, P. Surface basicity mediated rapid and selective adsorptive removal of Congo red over nanocrystalline mesoporous CeO2. Nanoscale Adv. 2021, 3, 6704–6718. [Google Scholar] [CrossRef]
- Su, Y.-Q.; Zhang, L.; Muravev, V.; Hensen, E.J.M. Lattice oxygen activation in transition metal doped ceria. Chin. J. Catal. 2020, 41, 977–984. [Google Scholar] [CrossRef]
- Mei, Z.; Li, Y.; Fan, M.; Zhao, L.; Zhao, J. Effect of the interactions between Pt species and ceria on Pt/ceria catalysts for water gas shift: The XPS studies. Chem. Eng. J. 2015, 259, 293–302. [Google Scholar] [CrossRef]
- Massardo, S.; Pani, M.; Carnasciali, M.M.; Presto, S.; Viviani, M.; Artini, C. Defect chemistry of (Nd,Tm)- and (Nd,Dy)-doped ceria as revealed by Raman and electrochemical impedance spectroscopy. Solid State Ion. 2023, 403, 116403. [Google Scholar] [CrossRef]
- Yatoo, M.A.; Skinner, S.J. Oxygen transport in higher-order ruddlesden-popper phase materials. ECS Trans. 2023, 111, 2405. [Google Scholar] [CrossRef]
- Yatoo, M.A.; Seymour, I.D.; Skinner, S.J. Neutron diffraction and DFT studies of oxygen defect and transport in higher-order Ruddlesden–Popper phase materials. RSC. Adv. 2023, 13, 13786–13797. [Google Scholar] [CrossRef] [PubMed]
- Phoka, S.; Laokul, P.; Swatsitang, E.; Promarak, V.; Seraphin, S.; Maensiri, S. Synthesis, structural and optical properties of CeO2 nanoparticles synthesized by a simple polyvinyl pyrrolidone (PVP) solution route. Mater. Chem. Phys. 2009, 115, 423–428. [Google Scholar] [CrossRef]
- Kumaresan, N.; Ramamurthi, K.; Ramesh Babu, R.; Sethuraman, K.; Moorthy Babu, S. Hydrothermally grown ZnO nanoparticles for effective photocatalytic activity. Appl. Surf. Sci. 2017, 418, 138–146. [Google Scholar] [CrossRef]
- Ranjan, P.; Kumar, L.S.; Suematsu, H.; Chakravarthy, S.R.; Jayaganthan, R.; Sarathi, R. Thermodynamic analysis of ZnO nanoparticle formation by wire explosion process and characterization. Ceram. Int. 2017, 43, 6709–6720. [Google Scholar] [CrossRef]
- Piumetti, M.; van der Linden, B.; Makkee, M.; Miceli, P.; Fino, D.; Russo, N.; Bensaid, S. Contact dynamics for a solid–solid reaction mediated by gas-phase oxygen: Study on the soot oxidation over ceria-based catalysts. Appl. Catal. B 2016, 199, 96–107. [Google Scholar] [CrossRef]
- Zhang, F.; Liu, Z.; Chen, X.; Rui, N.; Betancourt, L.E.; Lin, L.; Xu, W.; Sun, C.-j.; Abeykoon, A.M.M.; Rodriguez, J.A.; et al. Effects of Zr doping into ceria for the dry reforming of methane over Ni/CeZrO2 catalysts: In situ studies with XRD, XAFS, and AP-XPS. ACS Catal. 2020, 10, 3274–3284. [Google Scholar] [CrossRef]
- Sun, M.; Li, Z.; Li, H.; Wu, Z.; Shen, W.; Fu, Y.Q. Mesoporous Zr-doped CeO2 nanostructures as superior supercapacitor electrode with significantly enhanced specific capacity and excellent cycling stability. Electrochim. Acta 2020, 331, 135366. [Google Scholar] [CrossRef]
- Zhao, H.; Dong, Y.; Jiang, P.; Wang, G.; Zhang, J. Highly dispersed CeO2 on TiO2 nanotube: A synergistic nanocomposite with superior peroxidase-like activity. ACS. Appl. Mater. Int. 2015, 7, 6451–6461. [Google Scholar] [CrossRef] [PubMed]
- Janoš, P.; Hladík, T.; Kormunda, M.; Ederer, J.; Šťastný, M. Thermal treatment of cerium oxide and its properties: Adsorption ability versus degradation efficiency. Adv. Mater. Sci. Eng. 2014, 2014, 706041. [Google Scholar] [CrossRef]
- Ma, F.; Yao, J.; Zhang, Y.; Wei, Y. Oxygen vacancy promoting adsorption property of BiOI microspheres modified with SDS. Chin. Chem. Lett. 2018, 29, 1689–1691. [Google Scholar] [CrossRef]
- Yao, X.; Yu, Q.; Ji, Z.; Lv, Y.; Cao, Y.; Tang, C.; Gao, F.; Dong, L.; Chen, Y. A comparative study of different doped metal cations on the reduction, adsorption and activity of CuO/Ce0.67M0.33O2 (M=Zr4+, Sn4+, Ti4+) catalysts for NO+CO reaction. Appl. Catal. B 2013, 130–131, 293–304. [Google Scholar] [CrossRef]
- Prasad, D.H.; Park, S.Y.; Ji, H.I.; Kim, H.R.; Son, J.W.; Kim, B.K.; Lee, H.W.; Lee, J.H. Structural characterization and catalytic activity of Ce0.65Zr0.25RE0.1O2−δ nanocrystalline powders synthesized by the glycine-nitrate process. J. Phy. Chem. C 2012, 116, 3467–3476. [Google Scholar] [CrossRef]
- Sudarsanam, P.; Mallesham, B.; Reddy, P.S.; Großmann, D.; Grünert, W.; Reddy, B.M. Nano-Au/CeO2 catalysts for CO oxidation: Influence of dopants (Fe, La and Zr) on the physicochemical properties and catalytic activity. Appl. Catal. B 2014, 144, 900–908. [Google Scholar] [CrossRef]
- Wu, Z.; Li, M.; Howe, J.; Meyer, H.M., III; Overbury, S.H. Probing defect sites on CeO2 nanocrystals with well-defined surface planes by Raman spectroscopy and O2 adsorption. Langmuir 2010, 26, 16595–16606. [Google Scholar] [CrossRef]
- Li, M.; Tumuluri, U.; Wu, Z.; Dai, S. Effect of dopants on the adsorption of carbon dioxide on ceria surfaces. ChemSusChem 2015, 8, 3651–3660. [Google Scholar] [CrossRef]
- Cao, N.; Zhao, X.; Gao, M.; Li, Z.; Ding, X.; Li, C.; Liu, K.; Du, X.; Li, W.; Feng, J.; et al. Superior selective adsorption of MgO with abundant oxygen vacancies to removal and recycle reactive dyes. Sep. Purif. Technol. 2021, 275, 119236. [Google Scholar] [CrossRef]
- Wang, H.; Zhong, Y.; Yu, H.; Aprea, P.; Hao, S. High-efficiency adsorption for acid dyes over CeO2·xH2O synthesized by a facile method. J. Alloys Compd. 2019, 776, 96–104. [Google Scholar] [CrossRef]
- Ren, P.; Ren, X.; Xu, J.; Li, H.; Zheng, Y.; Hong, Y.; Lin, Y.; Zhou, Y.; Chen, Y.; Zhang, W. Excellent adsorption property and mechanism of oxygen vacancies-assisted hexagonal MoO3 nanosheets for methylene blue and rhodamine b dyes. Appl. Surf. Sci. 2022, 597, 153699. [Google Scholar] [CrossRef]
- Zhang, S.; Yang, H.; Huang, H.; Gao, H.; Wang, X.; Cao, R.; Li, J.; Xu, X.; Wang, X. Unexpected ultrafast and high adsorption capacity of oxygen vacancy-rich WOx/C nanowire networks for aqueous Pb2+ and methylene blue removal. J. Mater. Chem. A 2017, 5, 15913–15922. [Google Scholar] [CrossRef]
- Wang, R.; Liu, L.; Subhan, S.; Muhammad, Y.; Hu, Y.; Huang, M.; Peng, Y.; Zhao, Z.; Zhao, Z. Engineering pH-switchable UiO-66 via in-situ amino acid doping for highly selective adsorption of anionic dyes. Chem. Eng. J. 2020, 395, 124958. [Google Scholar] [CrossRef]
- Wu, F.-C.; Tseng, R.-L.; Juang, R.-S. Kinetic modeling of liquid-phase adsorption of reactive dyes and metal ions on chitosan. Water. Res. 2001, 35, 613–618. [Google Scholar] [CrossRef]
- Liu, Z.; He, X.; Yang, X.; Ding, H.; Wang, D.; Ma, D.; Feng, Q. Synthesis of mesoporous carbon nitride by molten salt-assisted silica aerogel for Rhodamine B adsorption and photocatalytic degradation. J. Mater. Sci. 2021, 56, 11248–11265. [Google Scholar] [CrossRef]
- Nayak, B.; Samant, A.; Patel, R.; Misra, P.K. Comprehensive understanding of the kinetics and mechanism of fluoride removal over a potent nanocrystalline hydroxyapatite surface. ACS Omega 2017, 2, 8118–8128. [Google Scholar] [CrossRef]
- Mutahir, S.; Yaqoob, F.; Khan, M.A.; Alsuhaibani, A.M.; Abouzied, A.S.; Refat, M.S.; Huwaimel, B. Schiff-based modified bentonite clay composites for wastewater treatment: Experimental and DFT-based analysis. Crystals 2023, 13, 806. [Google Scholar] [CrossRef]
- Ghaedi, M.; Biyareh, M.N.; Kokhdan, S.N.; Shamsaldini, S.; Sahraei, R.; Daneshfar, A.; Shahriyar, S. Comparison of the efficiency of palladium and silver nanoparticles loaded on activated carbon and zinc oxide nanorods loaded on activated carbon as new adsorbents for removal of Congo red from aqueous solution: Kinetic and isotherm study. Mater. Sci. Eng. C 2012, 32, 725–734. [Google Scholar] [CrossRef]
- Su, Y.; Cui, M.; Zhu, J.; Wu, Y.; Wei, Y.; Bian, S. A facile synthesis of nanosheet-structured barium carbonate spheres with a superior adsorption capacity for Cr(VI) removal. J. Mater. Sci. 2018, 53, 4078–4088. [Google Scholar] [CrossRef]
- Ouyang, X.; Li, W.; Xie, S.; Zhai, T.; Yu, M.; Gan, J.; Lu, X. Hierarchical CeO2 nanospheres as highly-efficient adsorbents for dye removal. New J. Chem. 2013, 37, 585–588. [Google Scholar] [CrossRef]
- Zheng, N.-C.; Wang, Z.; Long, J.-Y.; Kong, L.-J.; Chen, D.-Y.; Liu, Z.-Q. Shape-dependent adsorption of CeO2 nanostructures for superior organic dye removal. J. Colloid Interface Sci. 2018, 525, 225–233. [Google Scholar] [CrossRef]
- Bao, H.; Qian, K.; Chen, X.; Fang, J.; Huang, W. Spectroscopic study of microstructure-reducibility relation of CexZr1−xO2 solid solutions. Appl. Surf. Sci. 2019, 467–468, 361–369. [Google Scholar] [CrossRef]
- Bello, O.S.; Akinwale, F.T.; Agboola, O.S.; Ibrahim, A.O.; Adesina, O.O. Liquid-phase adsorption of Congo red dye using modified spear grass (Imperata cylindrica) root as adsorbent. Biomass Convers. Biorefin. 2022, 2190, 6823. [Google Scholar] [CrossRef]
- Liu, Y.; Qiu, G.; Liu, Y.; Niu, Y.; Qu, R.; Ji, C.; Wang, Y.; Zhang, Y.; Sun, C. Fabrication of CoFe-MOF materials by different methods and adsorption properties for Congo red. J. Mol. Liq. 2022, 360, 119405. [Google Scholar] [CrossRef]
- Wu, J.; Wang, J.; Du, Y.; Li, H.; Jia, X. Adsorption mechanism and kinetics of azo dye chemicals on oxide nanotubes: A case study using porous CeO2 nanotubes. J. Nanopart. Res. 2016, 18, 191. [Google Scholar] [CrossRef]
- Bai, Z.; Zheng, Y.; Zhang, Z. One-pot synthesis of highly efficient MgO for the removal of Congo red in aqueous solution. J. Mater. Chem. A 2017, 5, 6630–6637. [Google Scholar] [CrossRef]
- He, Z.; Wu, F.; Guan, S.; Liu, L.; Li, J.; Huang, Y. Polyamide amine/aramid nanofiber composite aerogels as an ultra-high capacity adsorbent for Congo red removal. J. Mater. Chem. A 2021, 9, 13320–13331. [Google Scholar] [CrossRef]
- Feng, Y.; Wang, H.; Xu, J.; Du, X.; Cheng, X.; Du, Z.; Wang, H. Fabrication of MXene/PEI functionalized sodium alginate aerogel and its excellent adsorption behavior for Cr(VI) and Congo Red from aqueous solution. J. Hazard. Mater. 2021, 416, 125777. [Google Scholar] [CrossRef]
- Zhang, P.; Ma, X.; Guo, Y.; Cheng, Q.; Yang, L. Size-controlled synthesis of hierarchical NiO hollow microspheres and the adsorption for Congo red in water. Chem. Eng. J. 2012, 189–190, 188–195. [Google Scholar] [CrossRef]
- Zhang, X.; Tran, H.N.; Liu, Y.; Yang, C.; Zhang, T.; Guo, J.; Zhu, W.; Ahmad, M.; Xiao, H.; Song, J. Nitrogen-doped magnetic biochar made with K3[Fe(C2O4)3] to adsorb dyes: Experimental approach and density functional theory modeling. J. Clean. Prod. 2023, 383, 135527. [Google Scholar] [CrossRef]
- Wang, C.; Liu, K.; Wang, D.; Wang, G.; Chu, P.K.; Meng, Z.; Wang, X. Hierarchical CuO–ZnO/SiO2 Fibrous Membranes for Efficient Removal of Congo Red and 4-Nitrophenol from Water. Adv. Fiber Mater. 2022, 4, 1069–1080. [Google Scholar] [CrossRef]
- Hou, Z.; Lan, H.; Zhu, K.; An, X.; Liu, H.; Qu, J. Hierarchically porous carbon derived from pore remodeling of waste polymeric membranes for high-efficiency adsorption applications. Resour. Conserv. Recycl. 2023, 190, 106845. [Google Scholar] [CrossRef]


| Sample | SBET (m2/g) | DBJH (nm) |
|---|---|---|
| ZC0 | 65.31 | 8.05 |
| ZC1 | 73.90 | 5.87 |
| ZC2 | 88.07 | 6.76 |
| ZC3 | 82.38 | 8.45 |
| ZC4 | 68.23 | 9.08 |
| ZC5 | 62.47 | 9.70 |
| Sample | OL% | OV% | OS% |
|---|---|---|---|
| ZC0 | 50.95 | 40.40 | 1.81 |
| ZC1 | 50.92 | 41.25 | 4.08 |
| ZC2 | 36.12 | 56.86 | 3.30 |
| ZC3 | 34.86 | 60.69 | 2.64 |
| ZC4 | 39.00 | 55.23 | 3.20 |
| ZC5 | 27.20 | 40.12 | 36.28 |
| C0 (mg/L) | qe, exp (mg/g) | Pseudo-First-Order | Pseudo-Second-Order | ||||
|---|---|---|---|---|---|---|---|
| K1 | qe | R2 | K2 | qe | R2 | ||
| 100 | 974.31 | 0.02786 | 121.51 | 0.751 | 6.50 × 10⁻⁴ | 980.39 | 0.9994 |
| 200 | 1884.23 | 0.03010 | 207.30 | 0.594 | 8.18 × 10⁻⁴ | 1893.08 | 0.9997 |
| 300 | 2753.61 | 0.02265 | 305.46 | 0.421 | 12.48 × 10⁻⁴ | 2758.39 | 0.9999 |
| 400 | 3642.05 | 0.01775 | 382.58 | 0.329 | 29.56 × 10⁻⁴ | 3644.31 | 0.9999 |
| T(K) | Langmuir Isotherm | Freundlich Isotherm | ||||
|---|---|---|---|---|---|---|
| qm | b | R2 | Kf | 1/n | R2 | |
| 298 | 3642.05 | 1.2893 | 0.92495 | 544.57 | 0.4899 | 0.99603 |
| Adsorbents | Dyes | Dosages (g) | Concentrations | qe (mg/g) | Removal (%) | Ref. |
|---|---|---|---|---|---|---|
| CeO2·xH2O | AR14 | 0.04 | 40 mL, 250 mg/L | 540 | / | [50] |
| CeO2 nanospheres | CR | 0.005 | 50 mL, 100 mg/L | 942.7 | 94.27 | [60] |
| Spindle CeO2 | CR | 0.05 | 50 mL, 200 mg/L | 162.4 | 81.2 | [61] |
| CexZr1−xO2 solid solution | MO | 0.06 | 40 mL, 40 mg/L | 21.7 | 82.2 | [62] |
| ZC0 | CR | 0.01 | 100 mL, 200 mg/L | 1289.49 | 64.47 | This work |
| ZC3 | CR | 0.01 | 100 mL, 400 mg/L | 3642.05 | 91.05 | This work |
Disclaimer/Publisher’s Note: The statements, opinions and data contained in all publications are solely those of the individual author(s) and contributor(s) and not of MDPI and/or the editor(s). MDPI and/or the editor(s) disclaim responsibility for any injury to people or property resulting from any ideas, methods, instructions or products referred to in the content. |
© 2023 by the authors. Licensee MDPI, Basel, Switzerland. This article is an open access article distributed under the terms and conditions of the Creative Commons Attribution (CC BY) license (https://creativecommons.org/licenses/by/4.0/).
Share and Cite
Luo, N.; Fan, L.; Chen, Y.; Lan, W. Construction of Oxygen Vacancies of Zr-Doped CeO2 with Enhanced Dye Adsorption Performance. Crystals 2023, 13, 1641. https://doi.org/10.3390/cryst13121641
Luo N, Fan L, Chen Y, Lan W. Construction of Oxygen Vacancies of Zr-Doped CeO2 with Enhanced Dye Adsorption Performance. Crystals. 2023; 13(12):1641. https://doi.org/10.3390/cryst13121641
Chicago/Turabian StyleLuo, NingTao, Lei Fan, YunQiang Chen, and WeiGuang Lan. 2023. "Construction of Oxygen Vacancies of Zr-Doped CeO2 with Enhanced Dye Adsorption Performance" Crystals 13, no. 12: 1641. https://doi.org/10.3390/cryst13121641
APA StyleLuo, N., Fan, L., Chen, Y., & Lan, W. (2023). Construction of Oxygen Vacancies of Zr-Doped CeO2 with Enhanced Dye Adsorption Performance. Crystals, 13(12), 1641. https://doi.org/10.3390/cryst13121641