Abstract
In the present study, three chemical compounds, Li2WO4, Li0.5Na1.5WO4, and Li1.5Na0.5WO4, are produced using the solid–solid method. Unlike the compound Li0.5Na1.5WO4, which crystallizes in the orthorhombic system with the space group Pmmm, both compounds Li2WO4 and Li1.5Na0.5WO4 crystallize in the monoclinic system with the space group P2/m. A morphological analysis reveals that all three compounds have a compact structure with some porosity present. An EDX analysis confirms the chemical composition of the three samples. The optical measurements provide information on the optical gaps and Urbach energies of the materials under consideration. Their dielectric characteristics are investigated in a frequency range of 100–106 Hz and at temperatures ranging from 300 to 600 K. Moreover, this research enables us to determine the ferroelectric transition as well as the type of dielectric material. In this study, an investigation of electrical conductivity was conducted for well-defined temperature and frequency values; which provided us with information about the mechanism of conduction and charge carrier transport models.
1. Introduction
In an effort to find new materials with a wide range of commercial uses, several ceramics, single crystals, and thin films of various structural families have been synthesized and described during the past few years, utilizing a variety of experimental techniques [1,2,3,4,5,6,7,8,9,10,11,12,13,14,15,16,17,18,19,20,21,22,23,24]. In this regard, research projects carried out in the last several years have shown a great deal of interest in tungsten-based materials [3,4,5,6]. There is constant innovation in this subject because tungsten has so many attractive characteristics. In fact, the use of tungsten-based materials is popular in a variety of fields, including photoluminescence [1,2], magnetic characteristics [3], supercapacitors [4,5], laser hosts [6,7], gas sensing [8,9], catalysts [10,11], photocatalysts [12,13,14], scintillator materials [15,16], humidity sensors [17,18], microwave applications [19,20], fiber optics [21,22], lithium batteries [23,24], etc. Because of their high specific capacity, good operating voltage, large reserves, and environmental friendliness, these materials have proven beneficial for electrochemical energy storage. With a melting temperature of roughly 3380 °C and a boiling point of roughly 5900 °C, tungsten is a thermally stable substance. Furthermore, because of its excellent coloration efficiency, strong reversibility ratio, rapid colorization bleaching speed, and lengthy cyclic stability, it is recyclable and not considered a health hazard [25,26]. These characteristics help explain tungsten’s remarkable success in a variety of applications. In fact, the literature mentions a number of tungsten-based compounds such as ABWO4 and A2WO4 (A, B = Li, Na, K, etc.), which were discovered to have a variety of structures [27,28], substantial phase transitions [29,30], and considerable electrical [31,32] and ferroelectric properties [33]. Li2WO4 and Na2WO4 compounds, for instance, have been the topic of numerous prior investigations employing various techniques of production. Both compounds show a ferroelectric transition, at Tc = 278 K for Li2WO4 and at Tc = 300 K for Na2WO4 [5,6]. Ferroelectric and ferroelastic transitions are mainly found in tungsten forms containing either a monovalent element alone or a monovalent element coupled with a bivalent element. Moreover, the samples containing mainly bivalent elements are unlikely to exhibit ferroelectric transitions. The XRD, EDF, and SEM analyses of Li2-xNaxWO4 (x = 0, 0.5, and 1.5), which have been realized and published by Krimi et al. confirm the purity and the stoichiometry of these materials [6,34,35]. The samples Li2WO4 and Li1.5Na0.5WO4 crystallize in the monoclinic system (space group: P2/m), while the other compounds, Na2WO4 and Li0.5Na1.5WO4, crystallize in the orthorhombic system (space groups: Pbca for Na2WO4 and Pmmm for Li0.5Na1.5WO4) [6,34,35]. In fact, a simple comparison of the obtained results leads us to the conclusion that a rise in the sodium rate is accompanied by an increase in the volume of the unit cell, which is expected given that the radius of the sodium atom is larger than that of the lithium atom.
The purpose of the present research is to examine the thermal, optical, and electrical characteristics of the compound Li2−xNaxWO4, as well as the effect of substituting lithium for sodium. Such findings are evaluated in light of the parent chemicals’ characteristics.
2. Materials and Methods
2.1. Synthesis
The solid–solid method was used to synthesize three compounds: Li2WO4, Li0.5Na1.5WO4, and Li1.5Na0.5WO4. For this, well-calculated stoichiometric quantities of the precursors Li2CO3, Na2CO3, and WO3 were mixed and then pulverized. They were initially annealed at 723 K to ensure the discharge of undesired chemicals, particularly carbon. They were then ground again, pelletized, and reheated at 823 K to ensure the compactness of the precursors and reduce the size of the grains.
2.2. Equipment
The purity of the samples was determined using the X-ray diffraction powder “Siemens D5000” with CuKα radiation (λ = 1.5406 Å). The powder morphology was examined using scanning electron microscopy (SEM) in secondary-electron mode at a voltage of 15 kV, the microscope used was the DSM960A ZEISS type (Zeiss, Oberkochen, Germany). The SEM was coupled with a Vega&Tescan energy dispersive X-ray spectrometry (EDS) analyzer (Zeiss, Oberkochen, Germany).
To determine the optical band gap and Urbach energy, a UV-Vis measurement was made at room temperature using a spectrophotometer (Shimadzu, Kyoto, Japan, UV-3101PC), while an electric measurement was carried out as a function of frequency in the 10–160 kHz range at temperatures ranging from 458 K to 623 K using a TEGAM 3550 impedance analyzer driven by a microcomputer.
The phase transition in different samples was first detected using a calorimetric study. This was later carried out in a Mettler–Toledo DSC822 apparatus under an Argon atmosphere, at temperatures ranging from 300 to 450 K and at a heating rate of 10 K/min. The annealing of different samples was also performed in the DSC under a 20 mL/min Ar flow.
3. Results
3.1. Structural and Morphological Studies
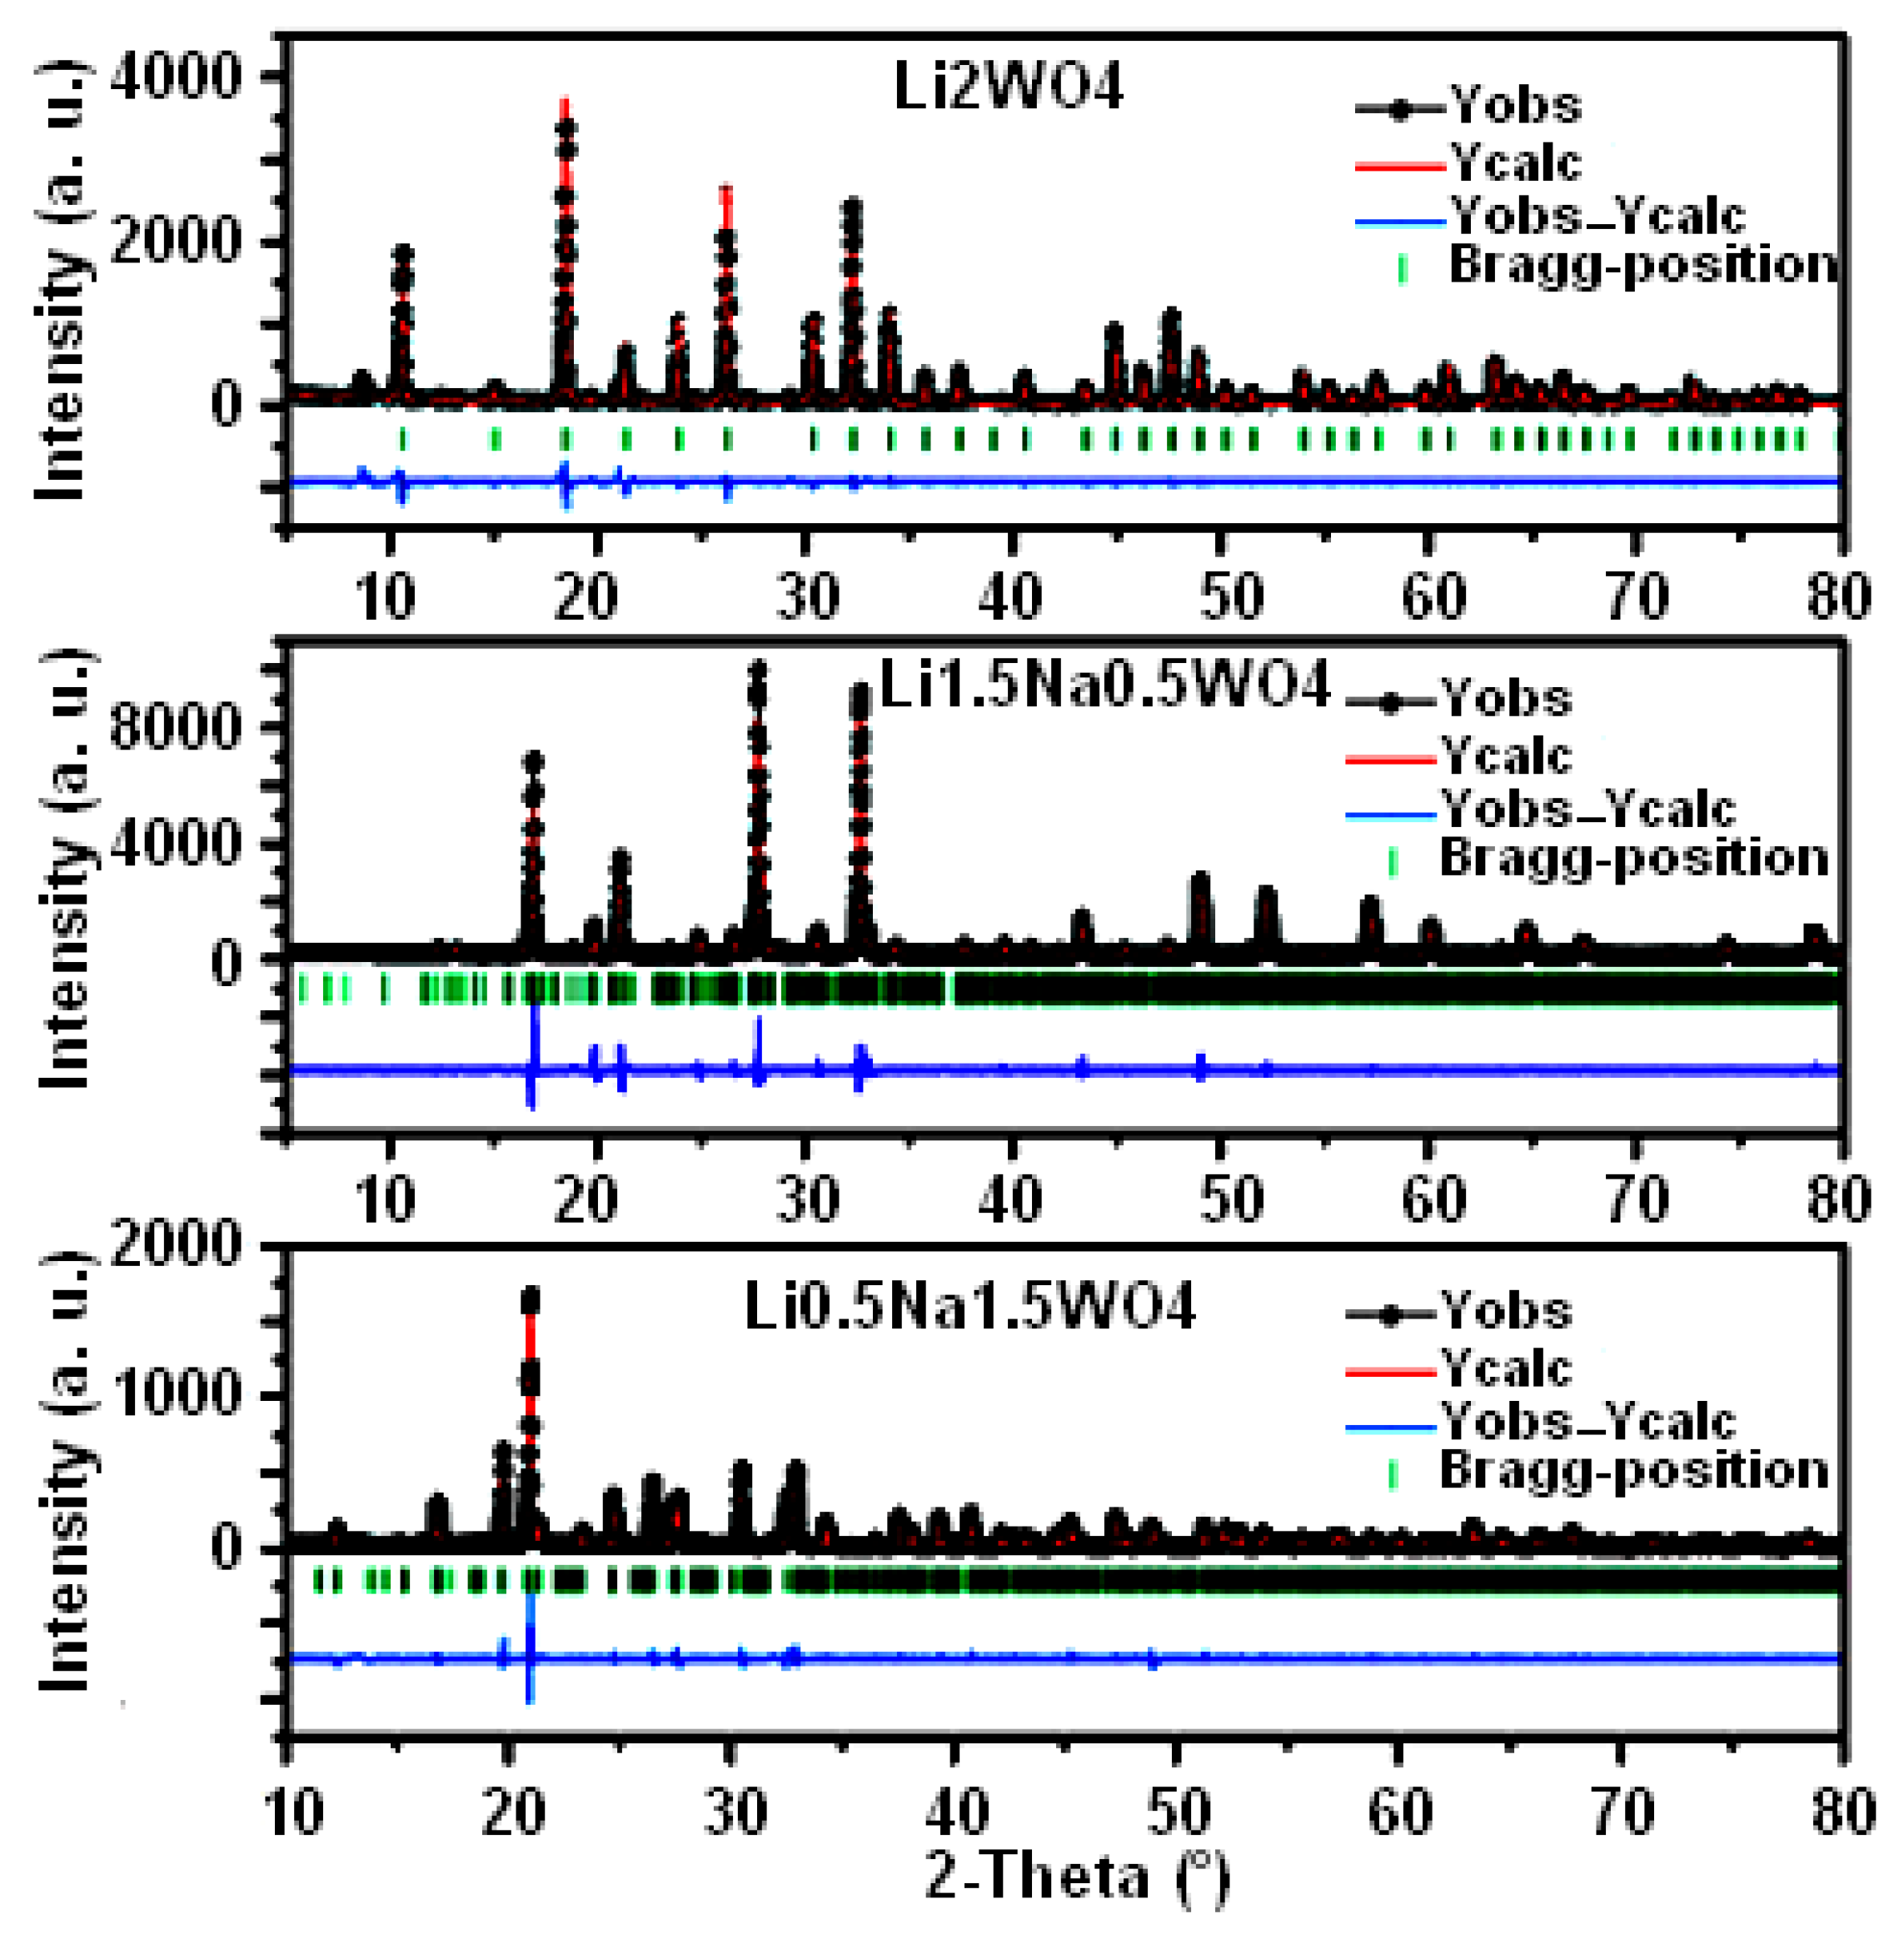
Figure 1 depicts the XRD patterns of the synthesized compounds: Li0.5Na1.5WO4, Li1.5Na0.5WO4, and Li2WO4. Each diffractogram shows the following: the experimental points (black circles), the calculated curve (red line), the difference between the experimental and calculated profiles (blue line), and the Bragg positions (green line). We have been careful to follow the known sequence of steps in order to release different crystallographic parameters during the structural refining process of the three samples [36]. This confirms the refinement’s stability when all the parameters become available. As shown, there is a good level of agreement between the calculated and experimental diagrams. The structural study demonstrates that the compound Li0.5Na1.5WO4 crystallizes in the orthorhombic system with the space group Pmmm (a = 22.42 Å, b = 15.21 Å, c = 7.18 Å) [35]. As long as the compounds Li1.5Na0.5WO4 and Li2WO4 crystallize in the monoclinic system with the space group P2/m, the lattice parameters of the compound Li1.5Na0.5WO4 are as follows: a = 15.92 Å, b = 7.19 Å, c = 7.18 Å, α = γ = 90°, and β = 114.31°, while those of the compound Li2WO4 are a = 7.49 Å, b = 8.31 Å, c = 5.92 Å, α = γ = 90°, and β = 96.81° [6,34]. It may be observed that the volume of the elementary unit of the crystal lattice increases as the Na proportion rises.
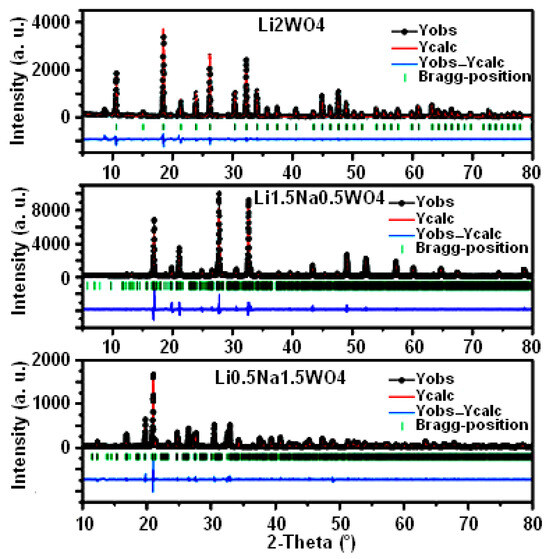
Figure 1.
XRD patterns and Rietveld refinements for samples of Li0.5Na1.5WO4, Li1.5Na0.5WO4, and Li2WO4 [6,34,35].
On the other hand, several methods have been developed to separate the microstructural parameters including the Williamson–Hall [37] and Halder–Wagner [38] methods. Crystallite size and lattice distortions yield to line broadening. Thus, the total line broadening β can be expressed as [39]
where D is the crystallite size and ε is the lattice strain. The first term in the right-hand part of Equation (1) is the size contribution and the second term is the lattice distortion. If the peak broadening is due solely to a finite crystallite size, it is assumed that β = kλ/(<D>cosθ), where k is close to 1 [40]; this is known as the Scherrer equation [41].
Using the model of Equation (1), the average crystallite size for each studied sample was determined in the current study. This model contains a distinct component for predicting peak broadening related to the crystallite microstrain and uses diffraction peak broadening from at least four diffraction peaks as a foundation for calculating the crystallite size. Equation (1) is a linear equation that considers the isotropic character of the crystals. The inverse of the average crystallite size <D> can be found from the intercept, and the lattice microstrain (ε) can be found from the slope straight line of the plot made with (4.sinθ) along the x-axis and (β.cos θ) along the y-axis for the three samples. The average particle sizes for Li0.5Na1.5WO4, Li1.5Na0.5WO4, and Li2WO4 samples were found to be approximately 200, 150, and 100 nm, respectively. The size of a crystallite, which is not always the same as the particle size, is thought to be the size of a coherently diffracting domain. The samples Li0.5Na1.5WO4, Li1.5Na0.5WO4, and Li2WO4 are expected to have lattice strain values of approximately 0.017, 0.035, and 0.043%, respectively. The lattice contraction or expansion in the crystallites, which is the source of the lattice microstrain, is mostly caused by the arrangement of atoms within the crystal lattice. On the other hand, many structural defects (point defects like vacancies, stacking faults, grain boundaries, etc.) are also created in the lattice structure as a result of size refinement and internal–external stresses that result in lattice strain [42,43]. The theoretical estimations of crystallite size derived from the Rietveld refinement for the samples Li0.5Na1.5WO4, Li1.5Na0.5WO4, and Li2WO4 were roughly 27% less than the estimated average crystallite size for the three samples.
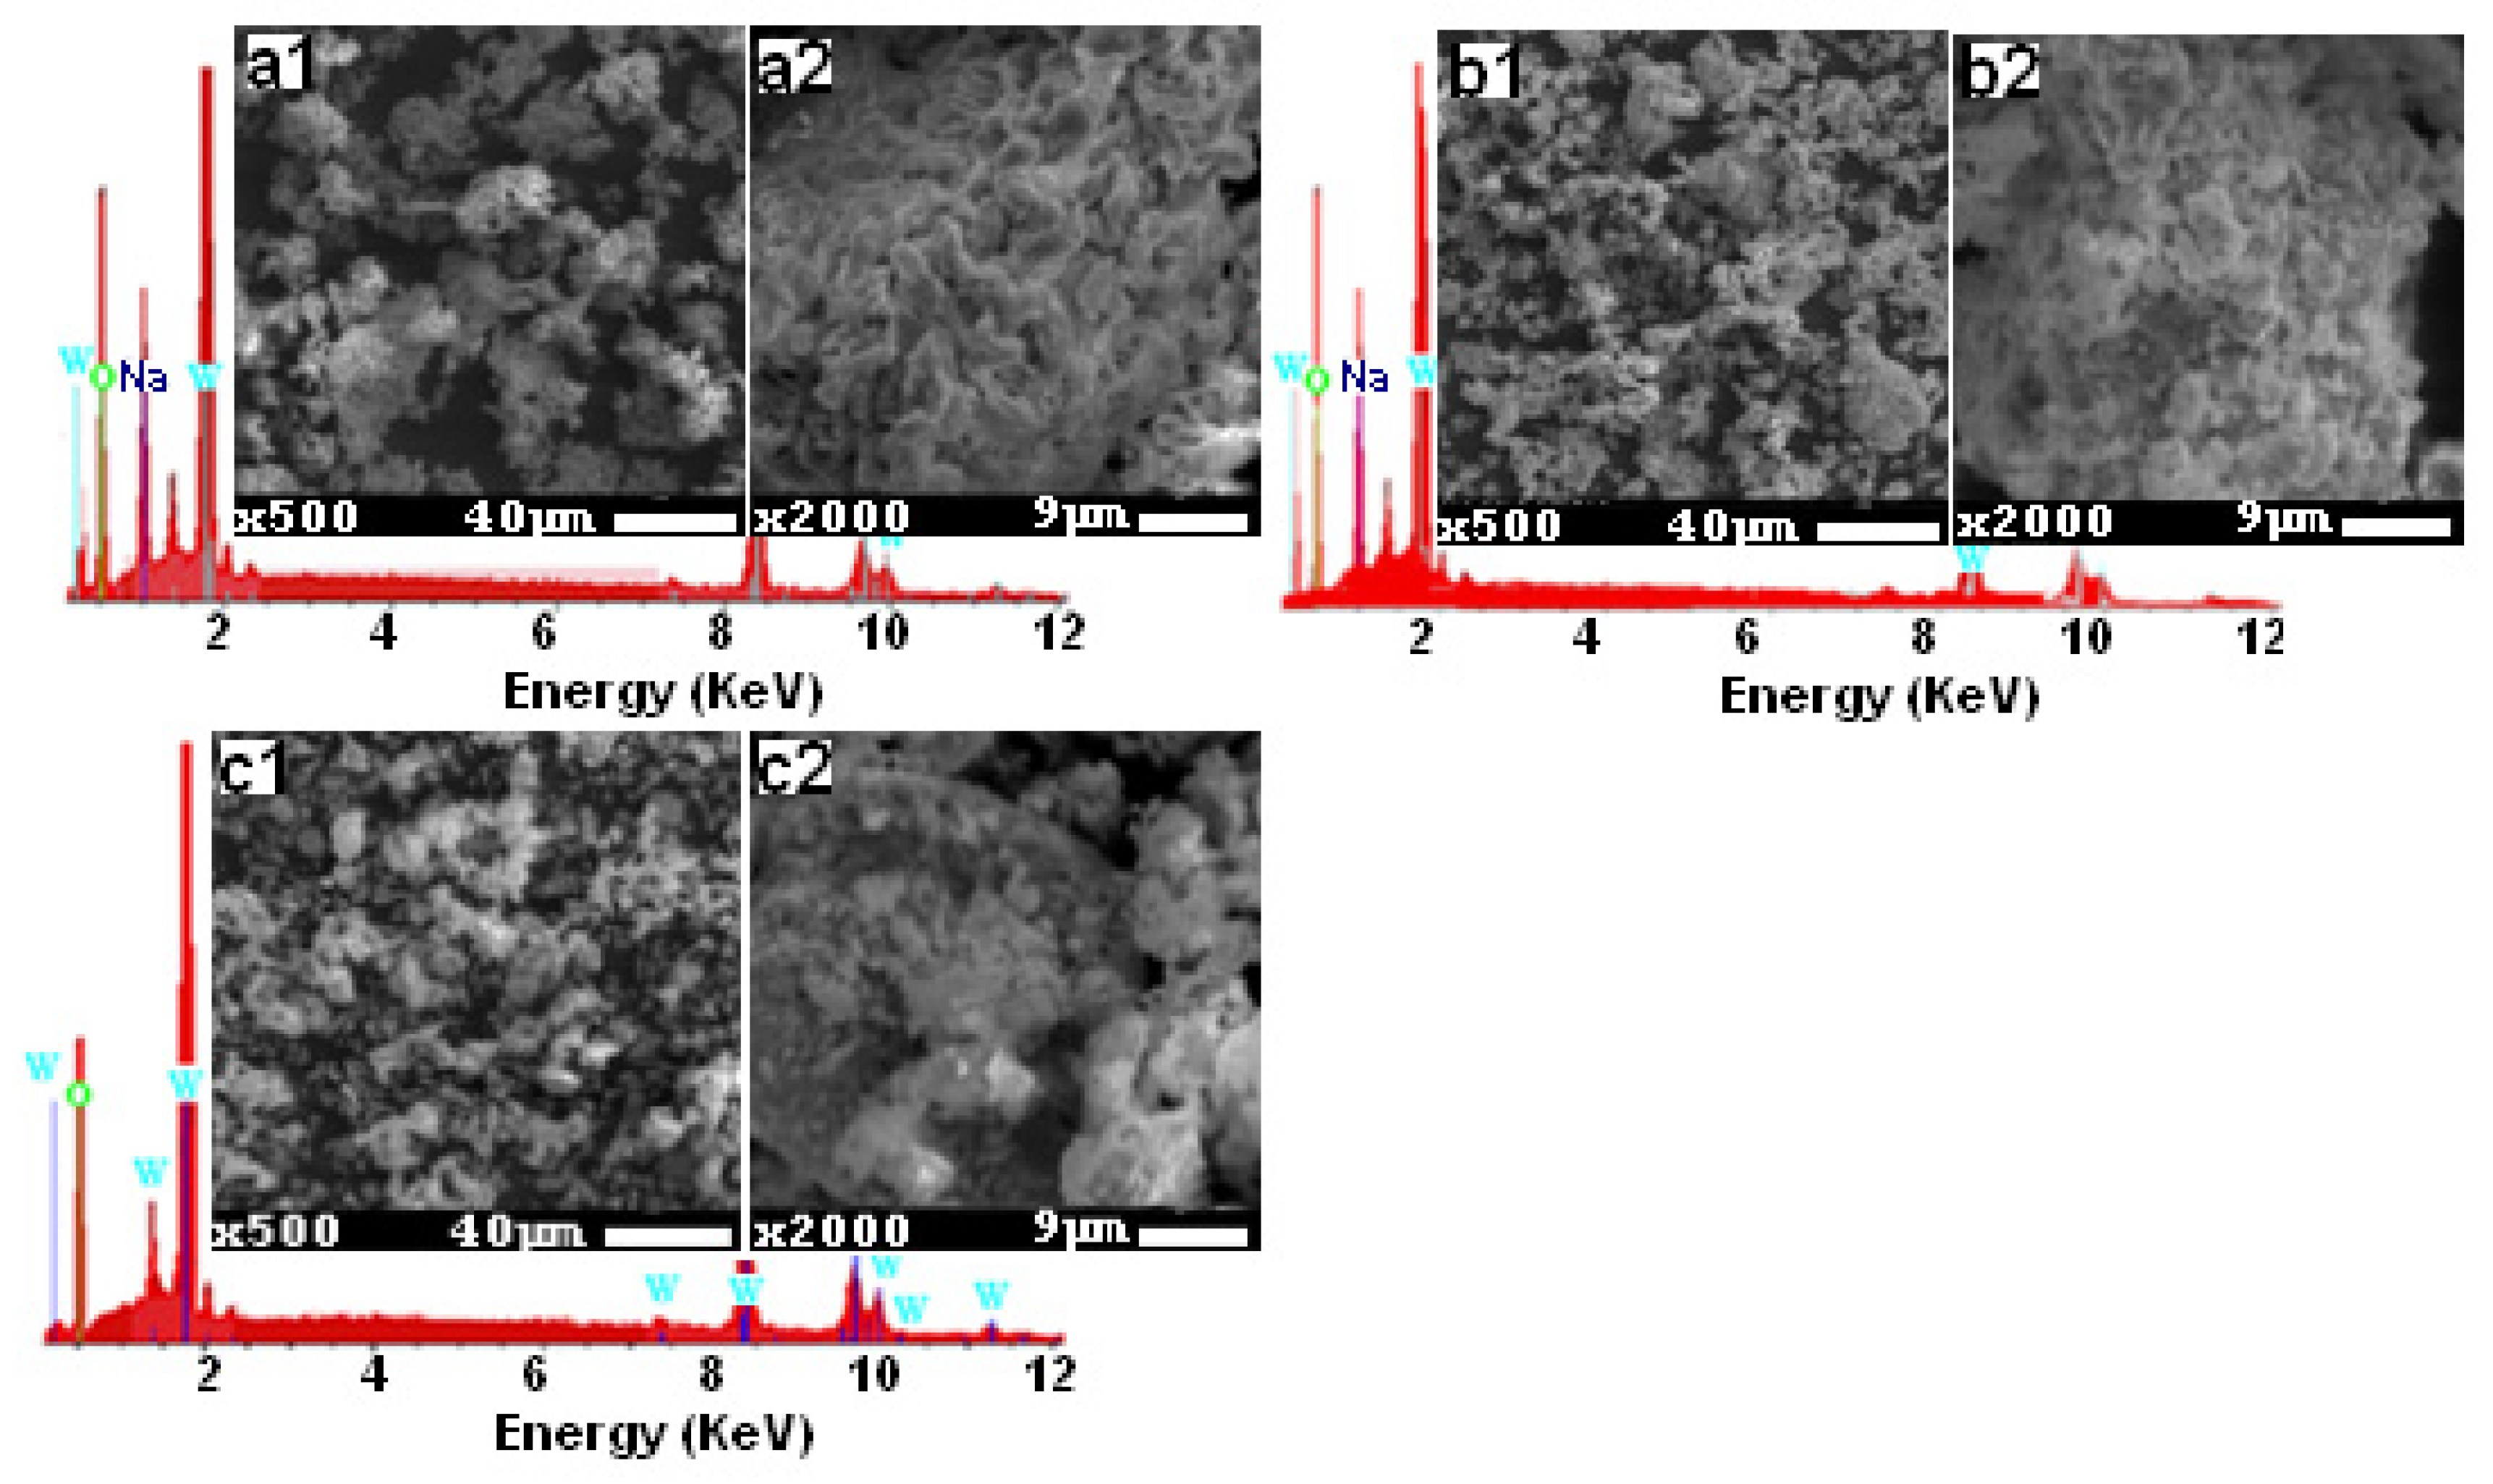
Figure 2 gives the SEM images, with resolutions of 9 μm and 40 μm, and the EDX spectra of the three studied compounds. We were able to verify the presence of Na, O, and W elements, as indicated in the EDX spectra. Lithium is the only component that is lacking, and this is because of its low Z = 1 value, which prevents it from emitting X-ray radiation. The SEM images clearly show that the three compounds have a compact structure with just a few pores and a tendency for clustering together because of the humid environment that lithium creates. Also, these images demonstrate a homogeneous distribution of grains with sizes around 5 [36], 2.6, and 4 µm [35] for the three compositions Li0.5Na1.5WO4, Li1.5Na0.5WO4, and Li2WO4, respectively.
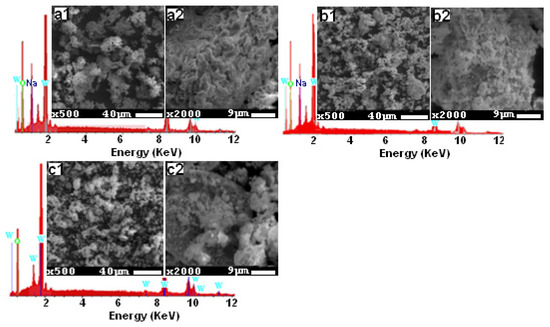
Figure 2.
SEM micrographs for the studied samples: (a1,a2) Li0.5Na1.5WO4, (b1,b2) Li1.5Na0.5WO4, and (c1,c2) Li2WO4, and the corresponding EDX spectra.
3.2. Optical Characterization
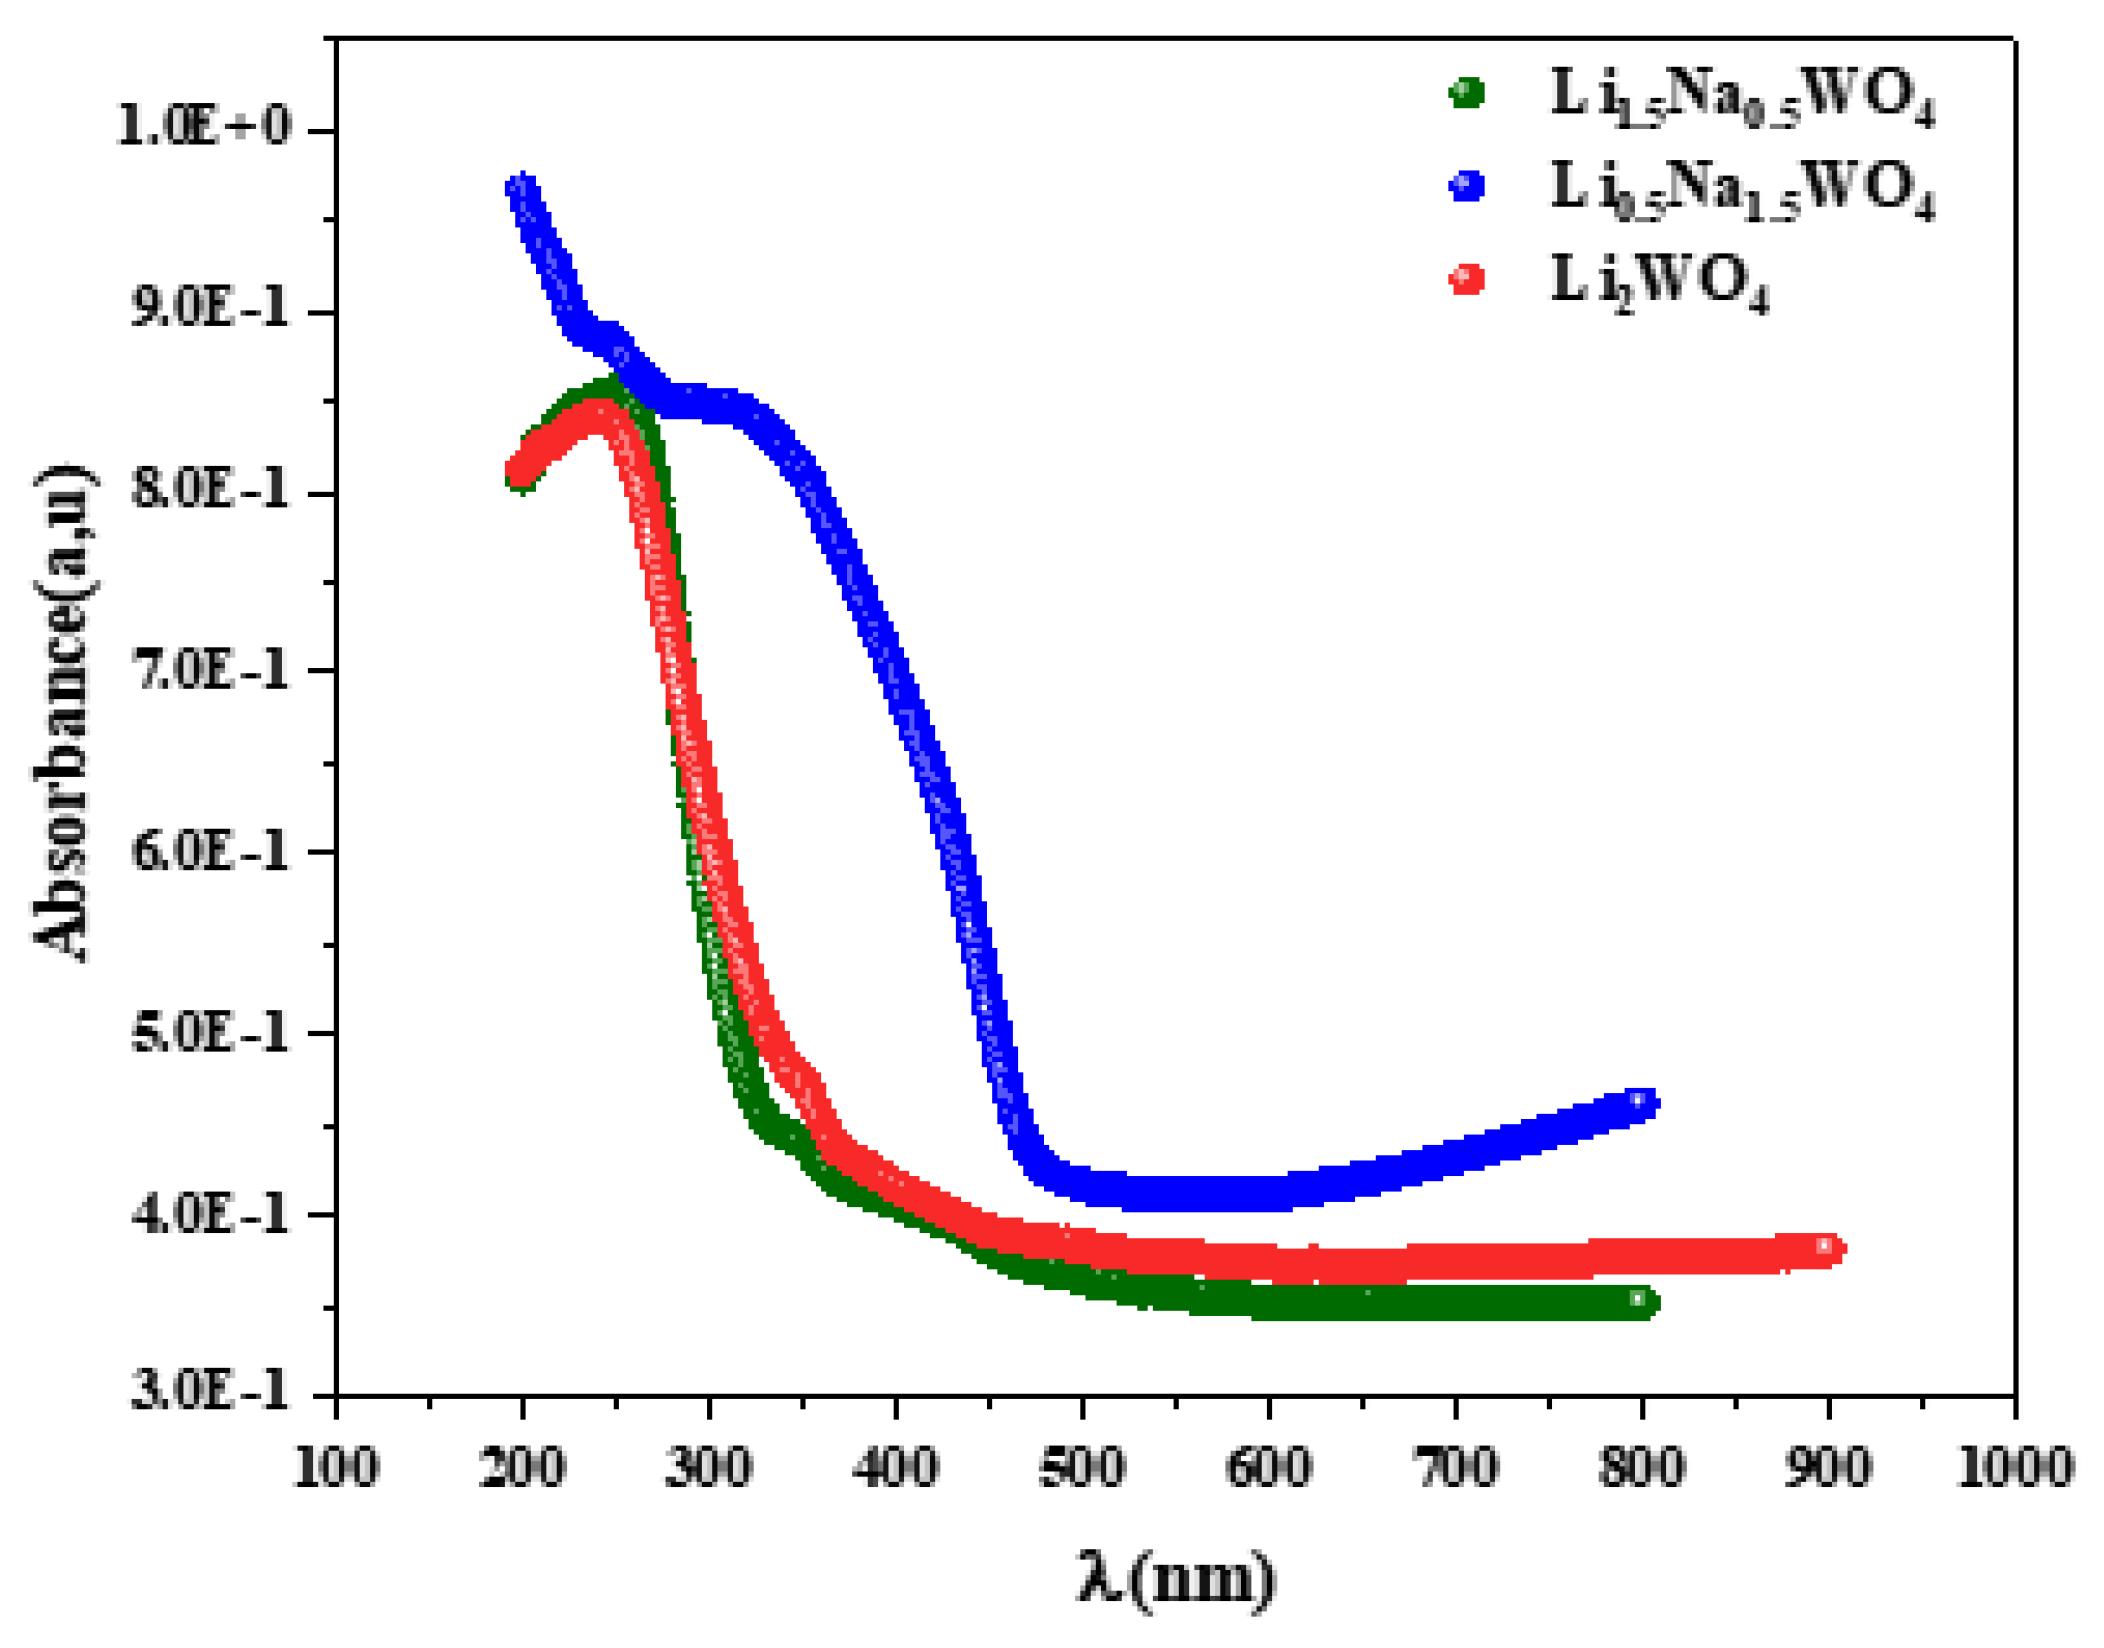
Considering the significance of optical characteristics in establishing light efficiency, the gap energy was examined using UV-Vis spectroscopy. The gap energy (Eg) is a crucial parameter for the description of materials in the solid state because it links disordered materials to either a direct or indirect transition through an optical forbidden band and the absorption coefficient (α). It takes note of the presence of broad bands rather than peaks in the spectrum. This demonstrates that these molecules contain energetically realized transitions. The investigation of such a spectrum leads to the calculation of the greatest absorption, and thus, based on the literature, the attribution of these bands can be determined. In the spectra presented in Figure 3, one can observe a broad band around 244 nm for the molecule Li2WO4 and a broad band around 246 nm for the complex Li1.5Na0.5WO4. These bands are attributed to the electronic transition from the 2p state of oxygen to the 5d state of tungsten in the (WO)−2 group [8]. The compound Li0.5Na1.5WO4 shows a similar transition at a wavelength of roughly 300 nm. It can be seen that the structural change reported for this molecule may be the cause of the wavelength change. Indeed, a change in symmetry (from monoclinic to orthorhombic) results in a shift in the atoms’ locations and sites.
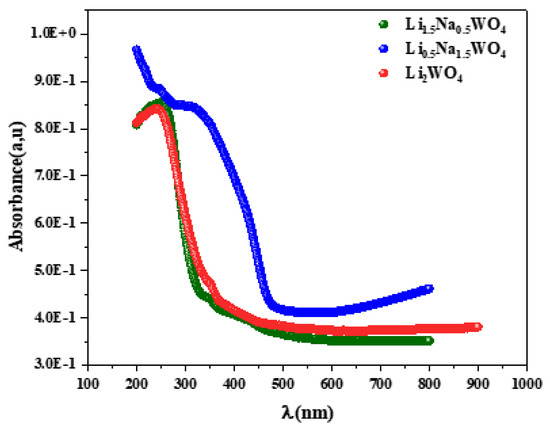
Figure 3.
Absorbance spectra for the studied compounds.
The Kubelka–Munk method is used to calculate the Eg on the basis of Equation (1) [44,45]:
where e is the compound’s thickness (e = 1 mm), R is its reflectance, and (F(R))/e is proportional to the absorption coefficient (α). Thus, a modified Kubelka–Munk equation was employed to determine the Eg by multiplying F(R) by hν and applying the corresponding coefficient (n), which is linked to an electronic transition, as shown by [46]
in which n = 1/2 represents a direct permitted transition (plotted as α(hν)2 versus E) and n = 2 represents an indirect permitted transition (plotted as α(hν)1/2 versus E).
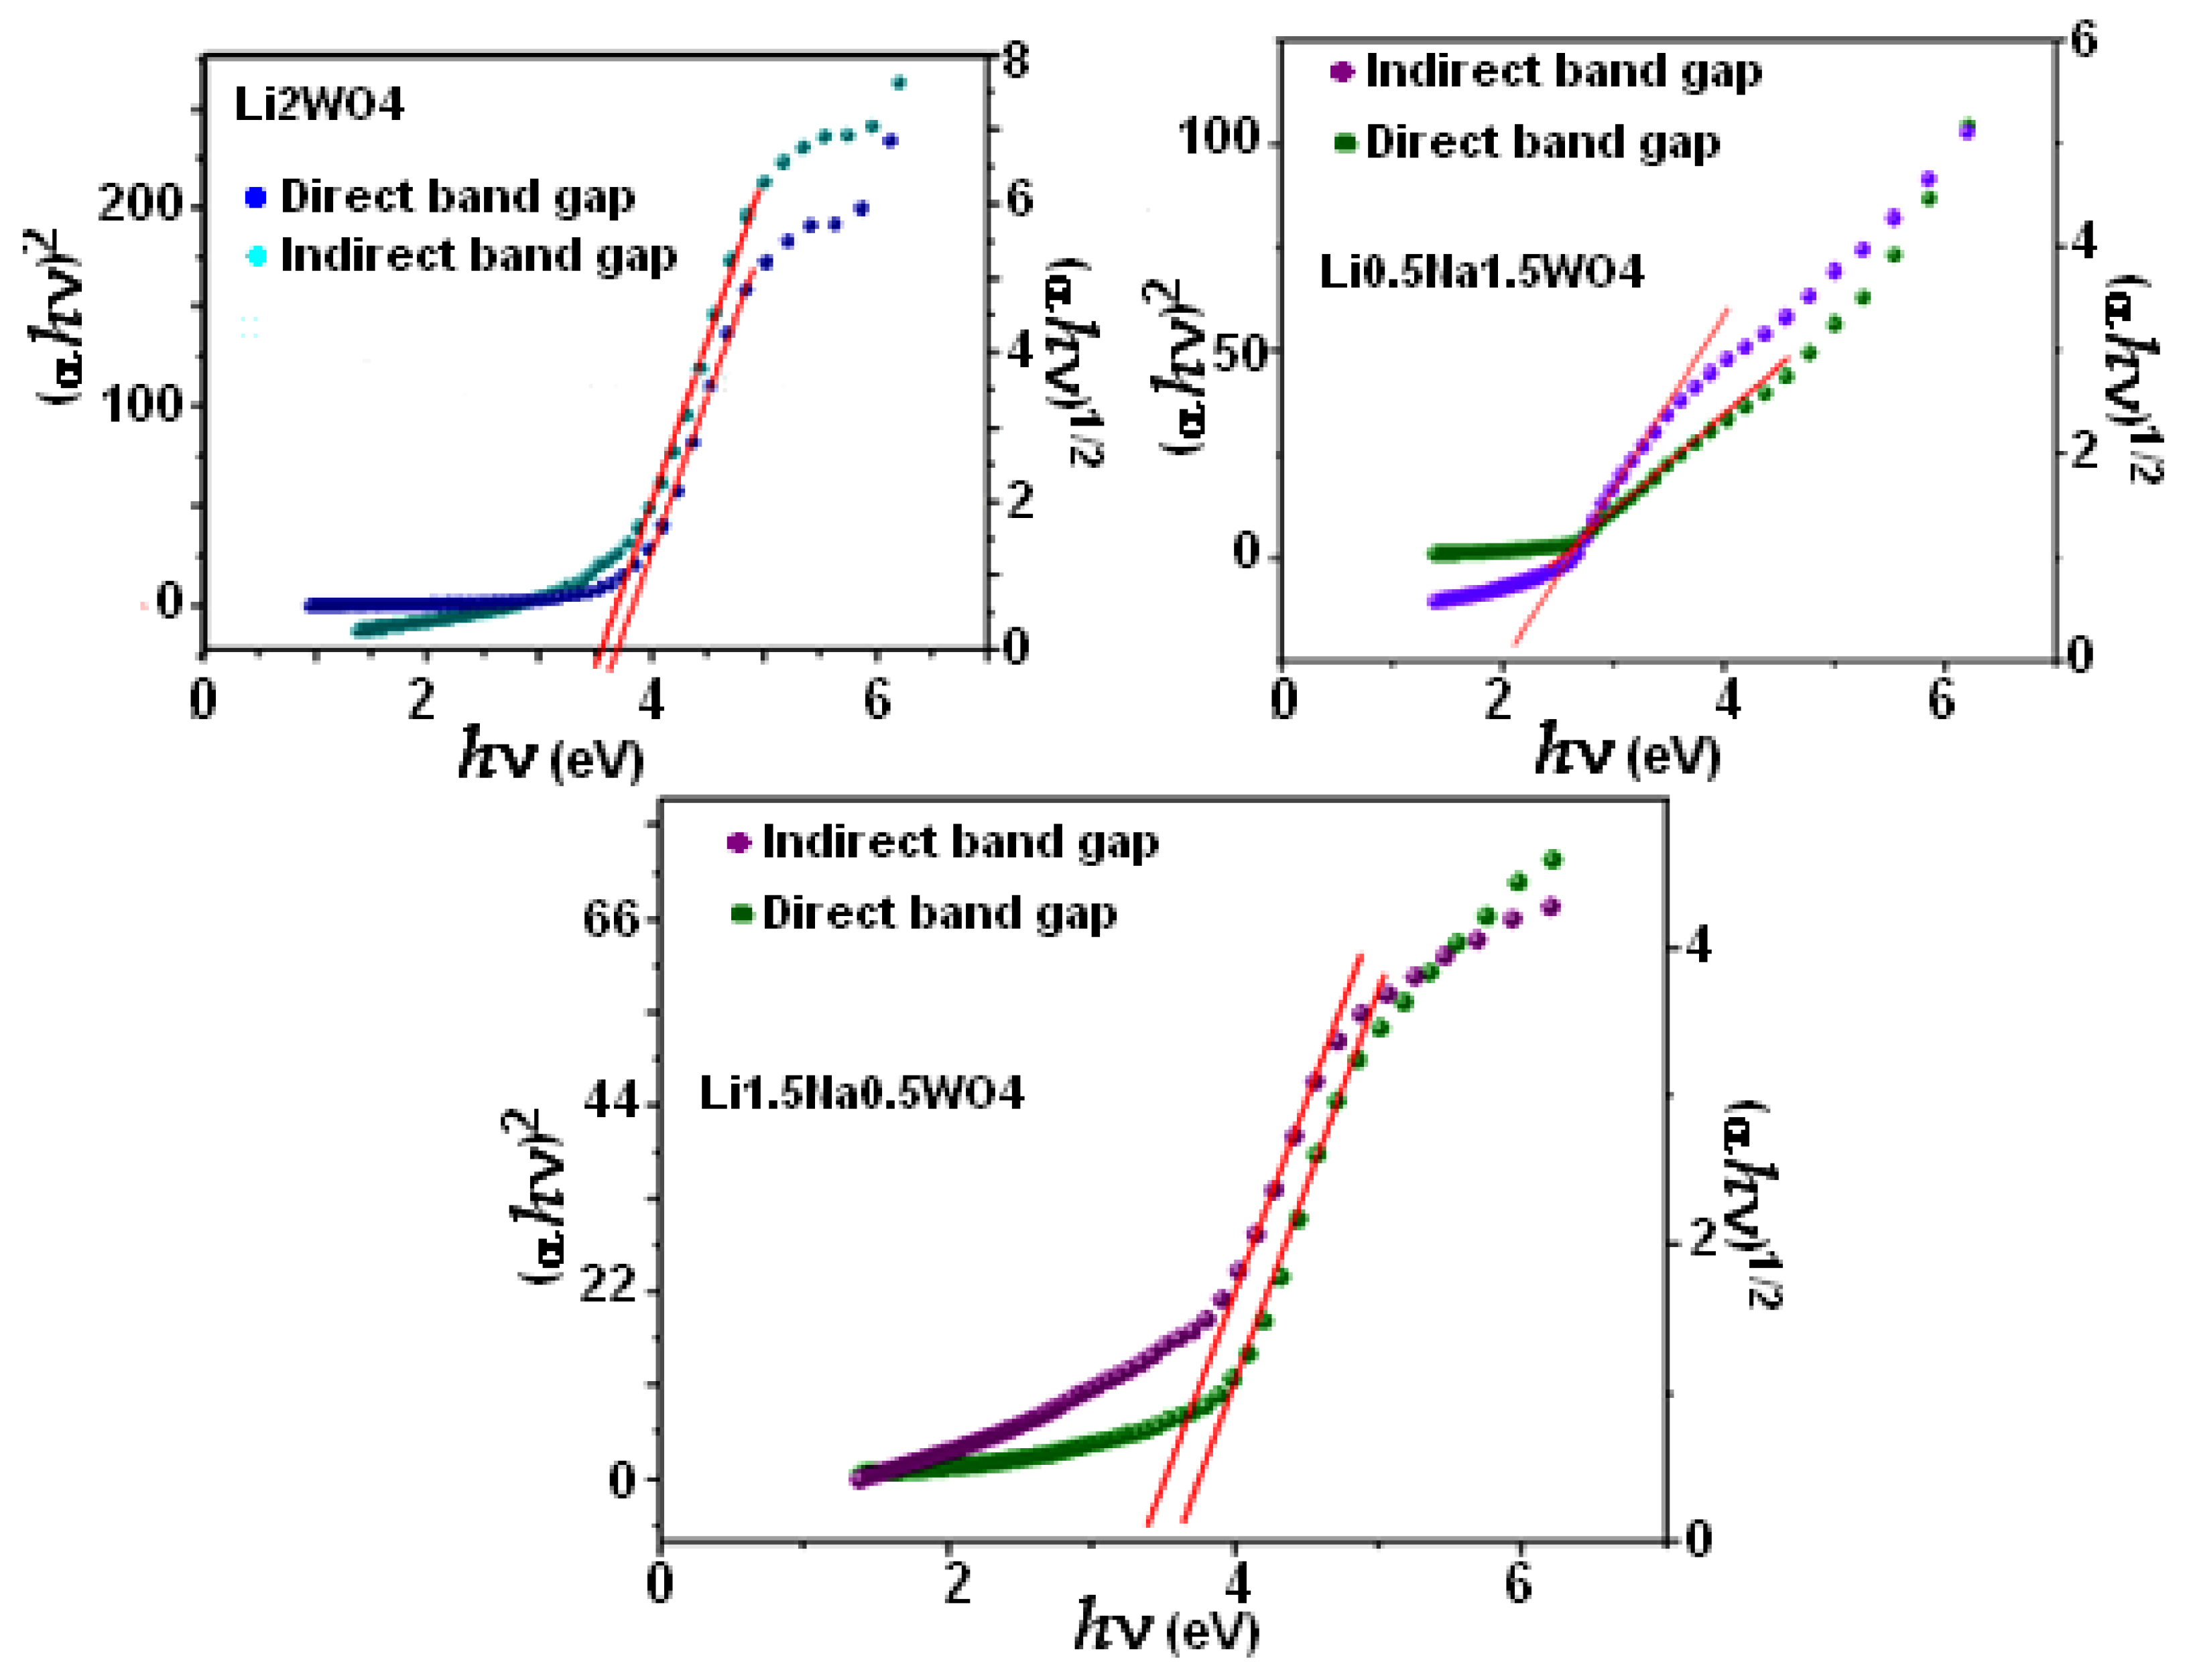
For our compound, the Eg was calculated for both types of transitions (Figure 4). To determine the band gap (shown by the red line), we actually extrapolate the curves in the linear section to zero. The band gap values for both the directly permitted transition and the indirectly permitted transition are shown in Table 1. These values clearly show that increased Li levels are associated with rising direct and indirect Eg, given the variations in the absorption band wavelength and symmetry.
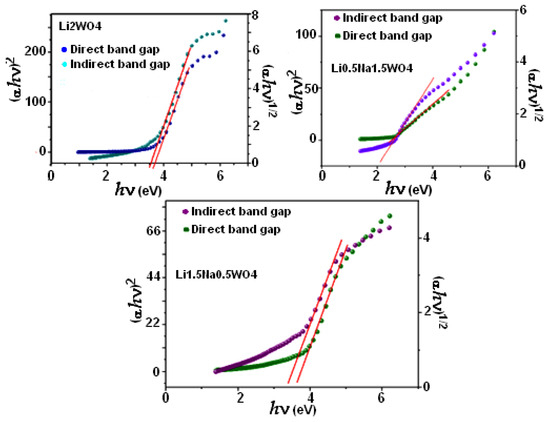
Figure 4.
Direct and indirect band gaps for the studied compounds.

Table 1.
Calculated values of gap energies for the studied compounds.
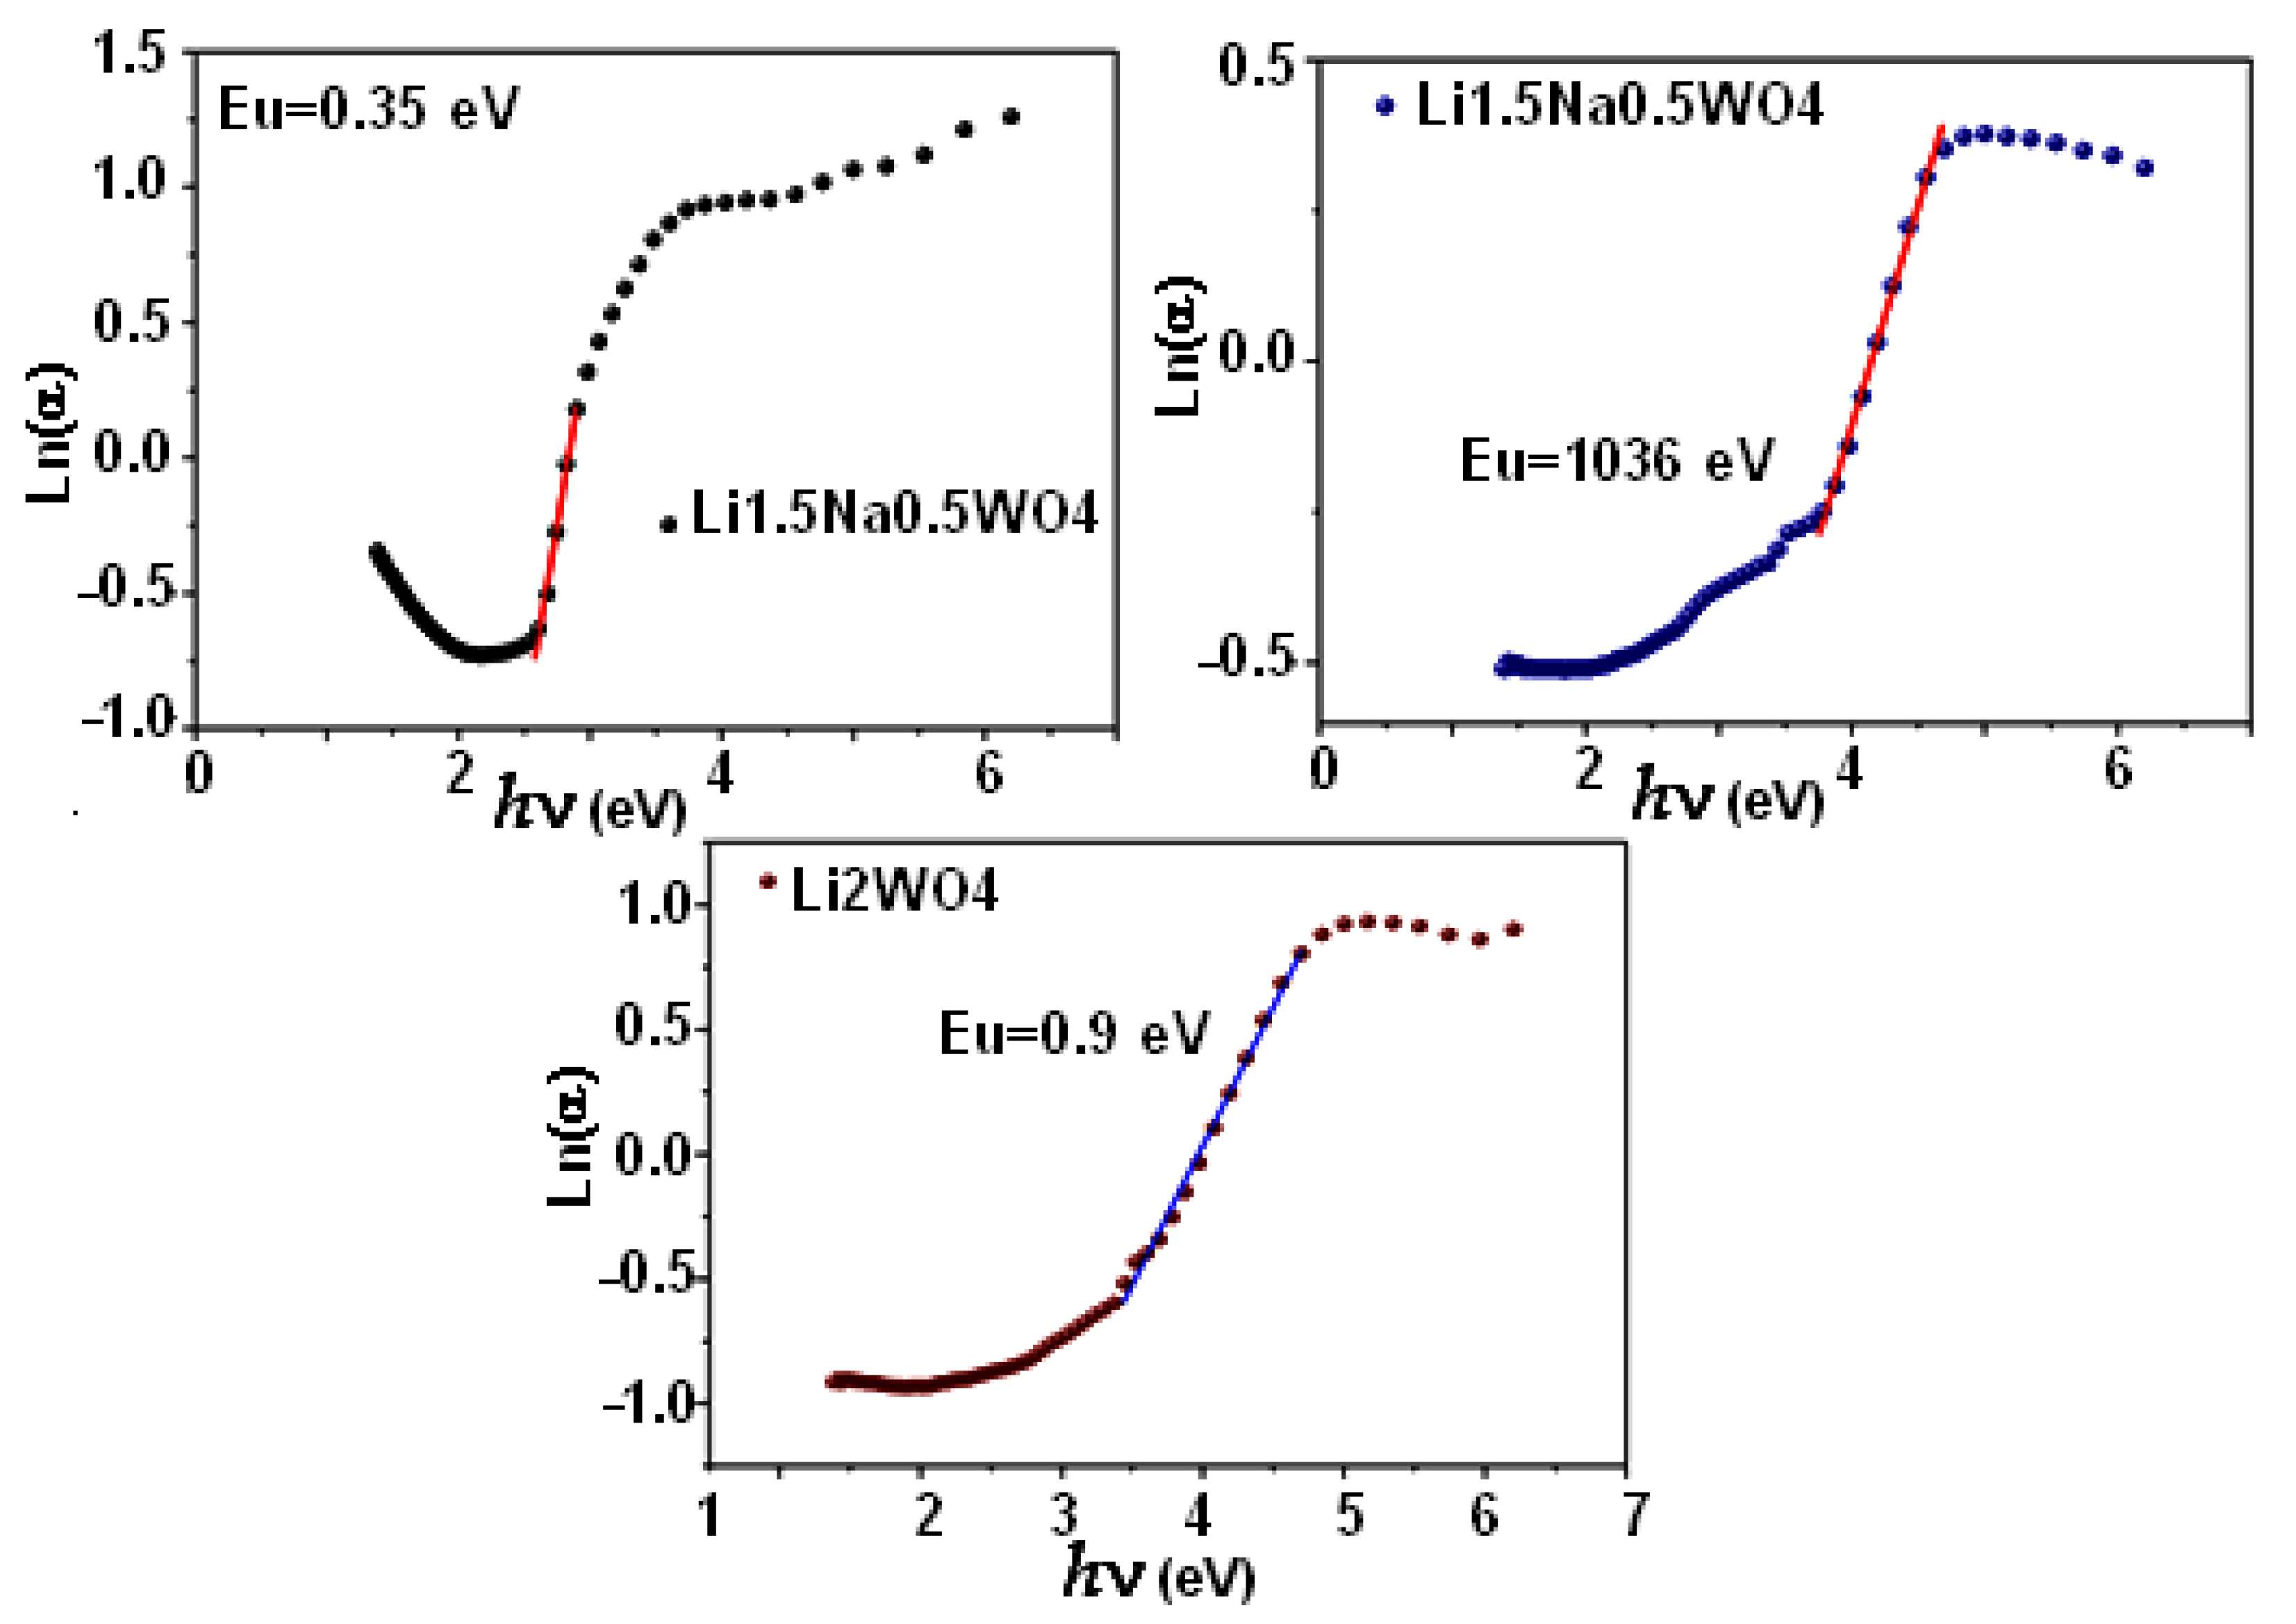
Thus, in order to further investigate this pattern, we computed the Urbach Eu energy, which is associated with the changes from the valence band’s stretched states to the conduction band’s restricted states. On the other hand, the Urbach Eu energy causes the formation of localized states at the tail of the band, near the forbidden band’s limits, bounded by the valence and conduction bands. It also describes the compound’s disorder [47]. Then, the following empirical formula [46] expresses the relationship between the Urbach energy and the disorder:
Furthermore, when plotting the variation in ln(α) as a function of energy (hν), we notice that the following expression governs this curve:
where α0 is a constant and Eu is the Urbach energy, which is equal to 0.9 eV, 1.36 eV, and 0.35 eV for the Li2WO4, Li1.5Na0.5WO4, and Li0.5Na1.5WO4 compounds, respectively. In fact, as shown in Figure 5, these values are actually determined by taking the inverse of the curves’ slopes. Then, Table 2 shows the computed Urbach energy values. Therefore, based on the above-mentioned results, we can conclude that the compound Li1.5Na0.5WO4 is the most disordered of the tested compounds. Moreover, an examination of the values of the Urbach energy in relation to the gap one revealed the existence of a harmony in variation, which indicates that the larger the disorder, the wider the gap will be. This suggests that the latter is affected by disorder in our materials.
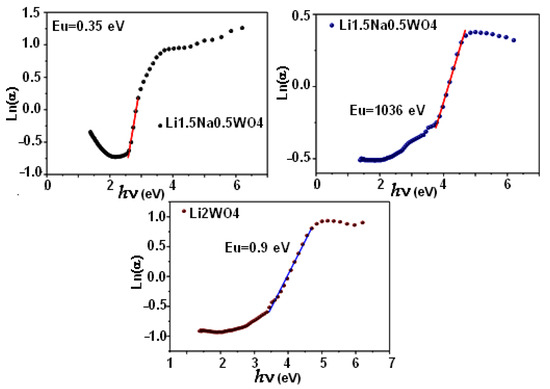
Figure 5.
Urbach energy for the three compounds.

Table 2.
Densities of localized states and the values of Urbach energy for the studied compounds.
3.3. Thermal Analysis
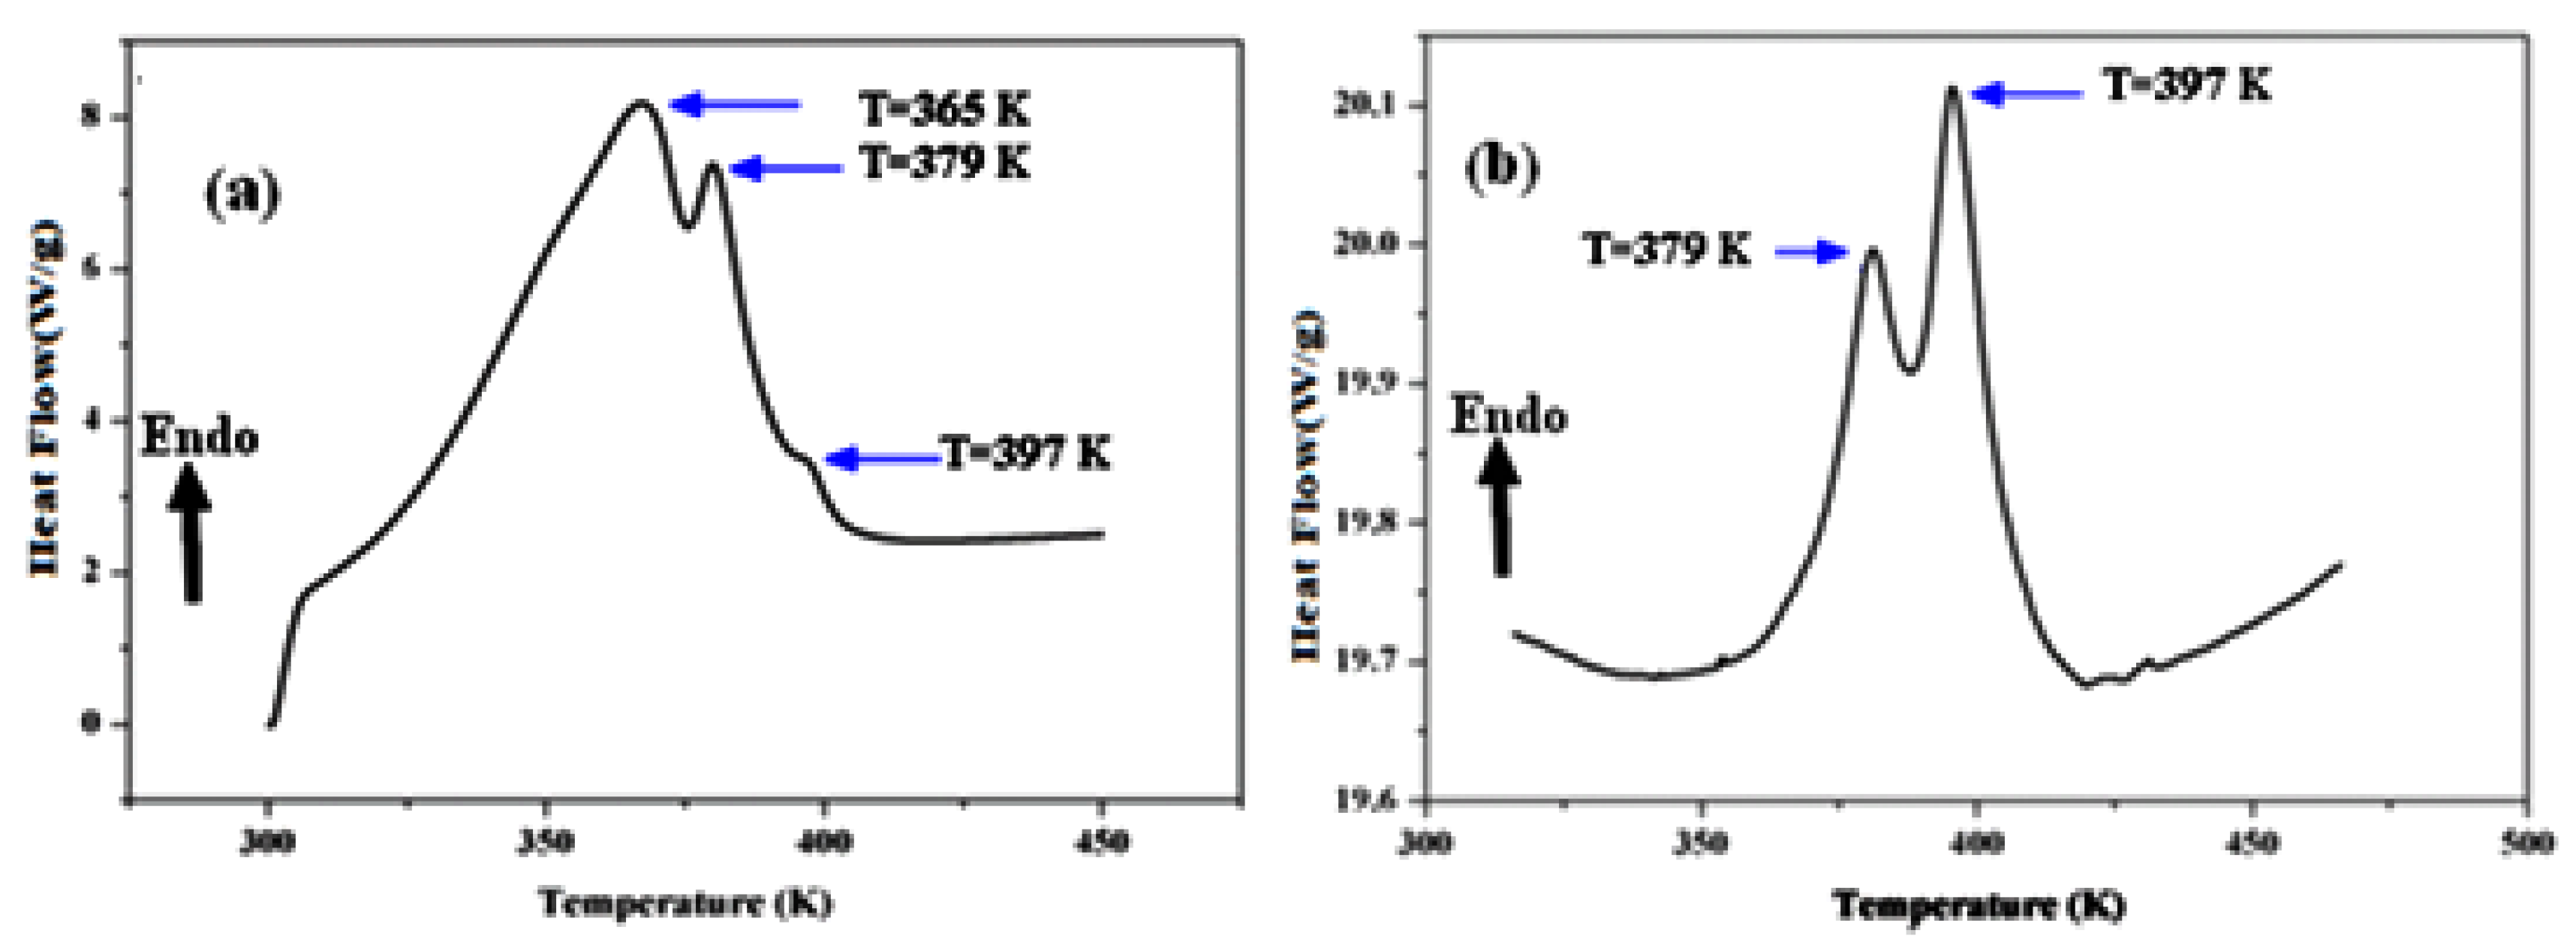
A differential scanning calorimetric analysis is commonly used to analyze a material’s thermal change, such as melting, glass transition, crystallization, and so on. Therefore, to avoid reactivity with the atmosphere, this analysis was carried out in the presence of an argon atmosphere. The thermal investigations were carried out in a temperature range of ambient temperature to 450 K with a scan rate of 5 C°/min. The obtained thermograms are shown in Figure 6. As shown, the compound Li1.5Na0.5WO4 has three endothermic peaks, at T = 365 K, T = 379 K, and T = 397 K (Figure 6a) [6], whereas Li0.5Na1.5WO4 has just two endothermic peaks, at T = 379 K and T = 397 K (Figure 6b) [35].
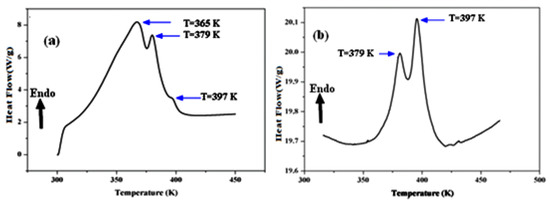
Figure 6.
Differential scanning calorimetric of (a) Li1.5Na0.5WO4 and (b) Li0.5Na1.5WO4 [36,38].
The thermal examination of the parent compounds Li2WO4 and Na2WO4 revealed the presence of a peak at 373 K, which was attributed to the ferroelectric/paraelectric transition and confirmed by the dielectric research [5,6]. The broad peak at 365 K may be due to the progressive release of H2O absorbed by the material at ambient temperature, which shows that this material has a hydroscopic character. Based on Ref. [6] and the impact of the composition difference, we can credit the peak found at T = 397 K for both compounds to the ferroelectric–paraelectric transition. In addition, to verify this result we investigated the dielectric characteristics of the compounds Li1.5Na0.5WO4 and Li0.5Na1.5WO4.
3.4. Dielectric Studies
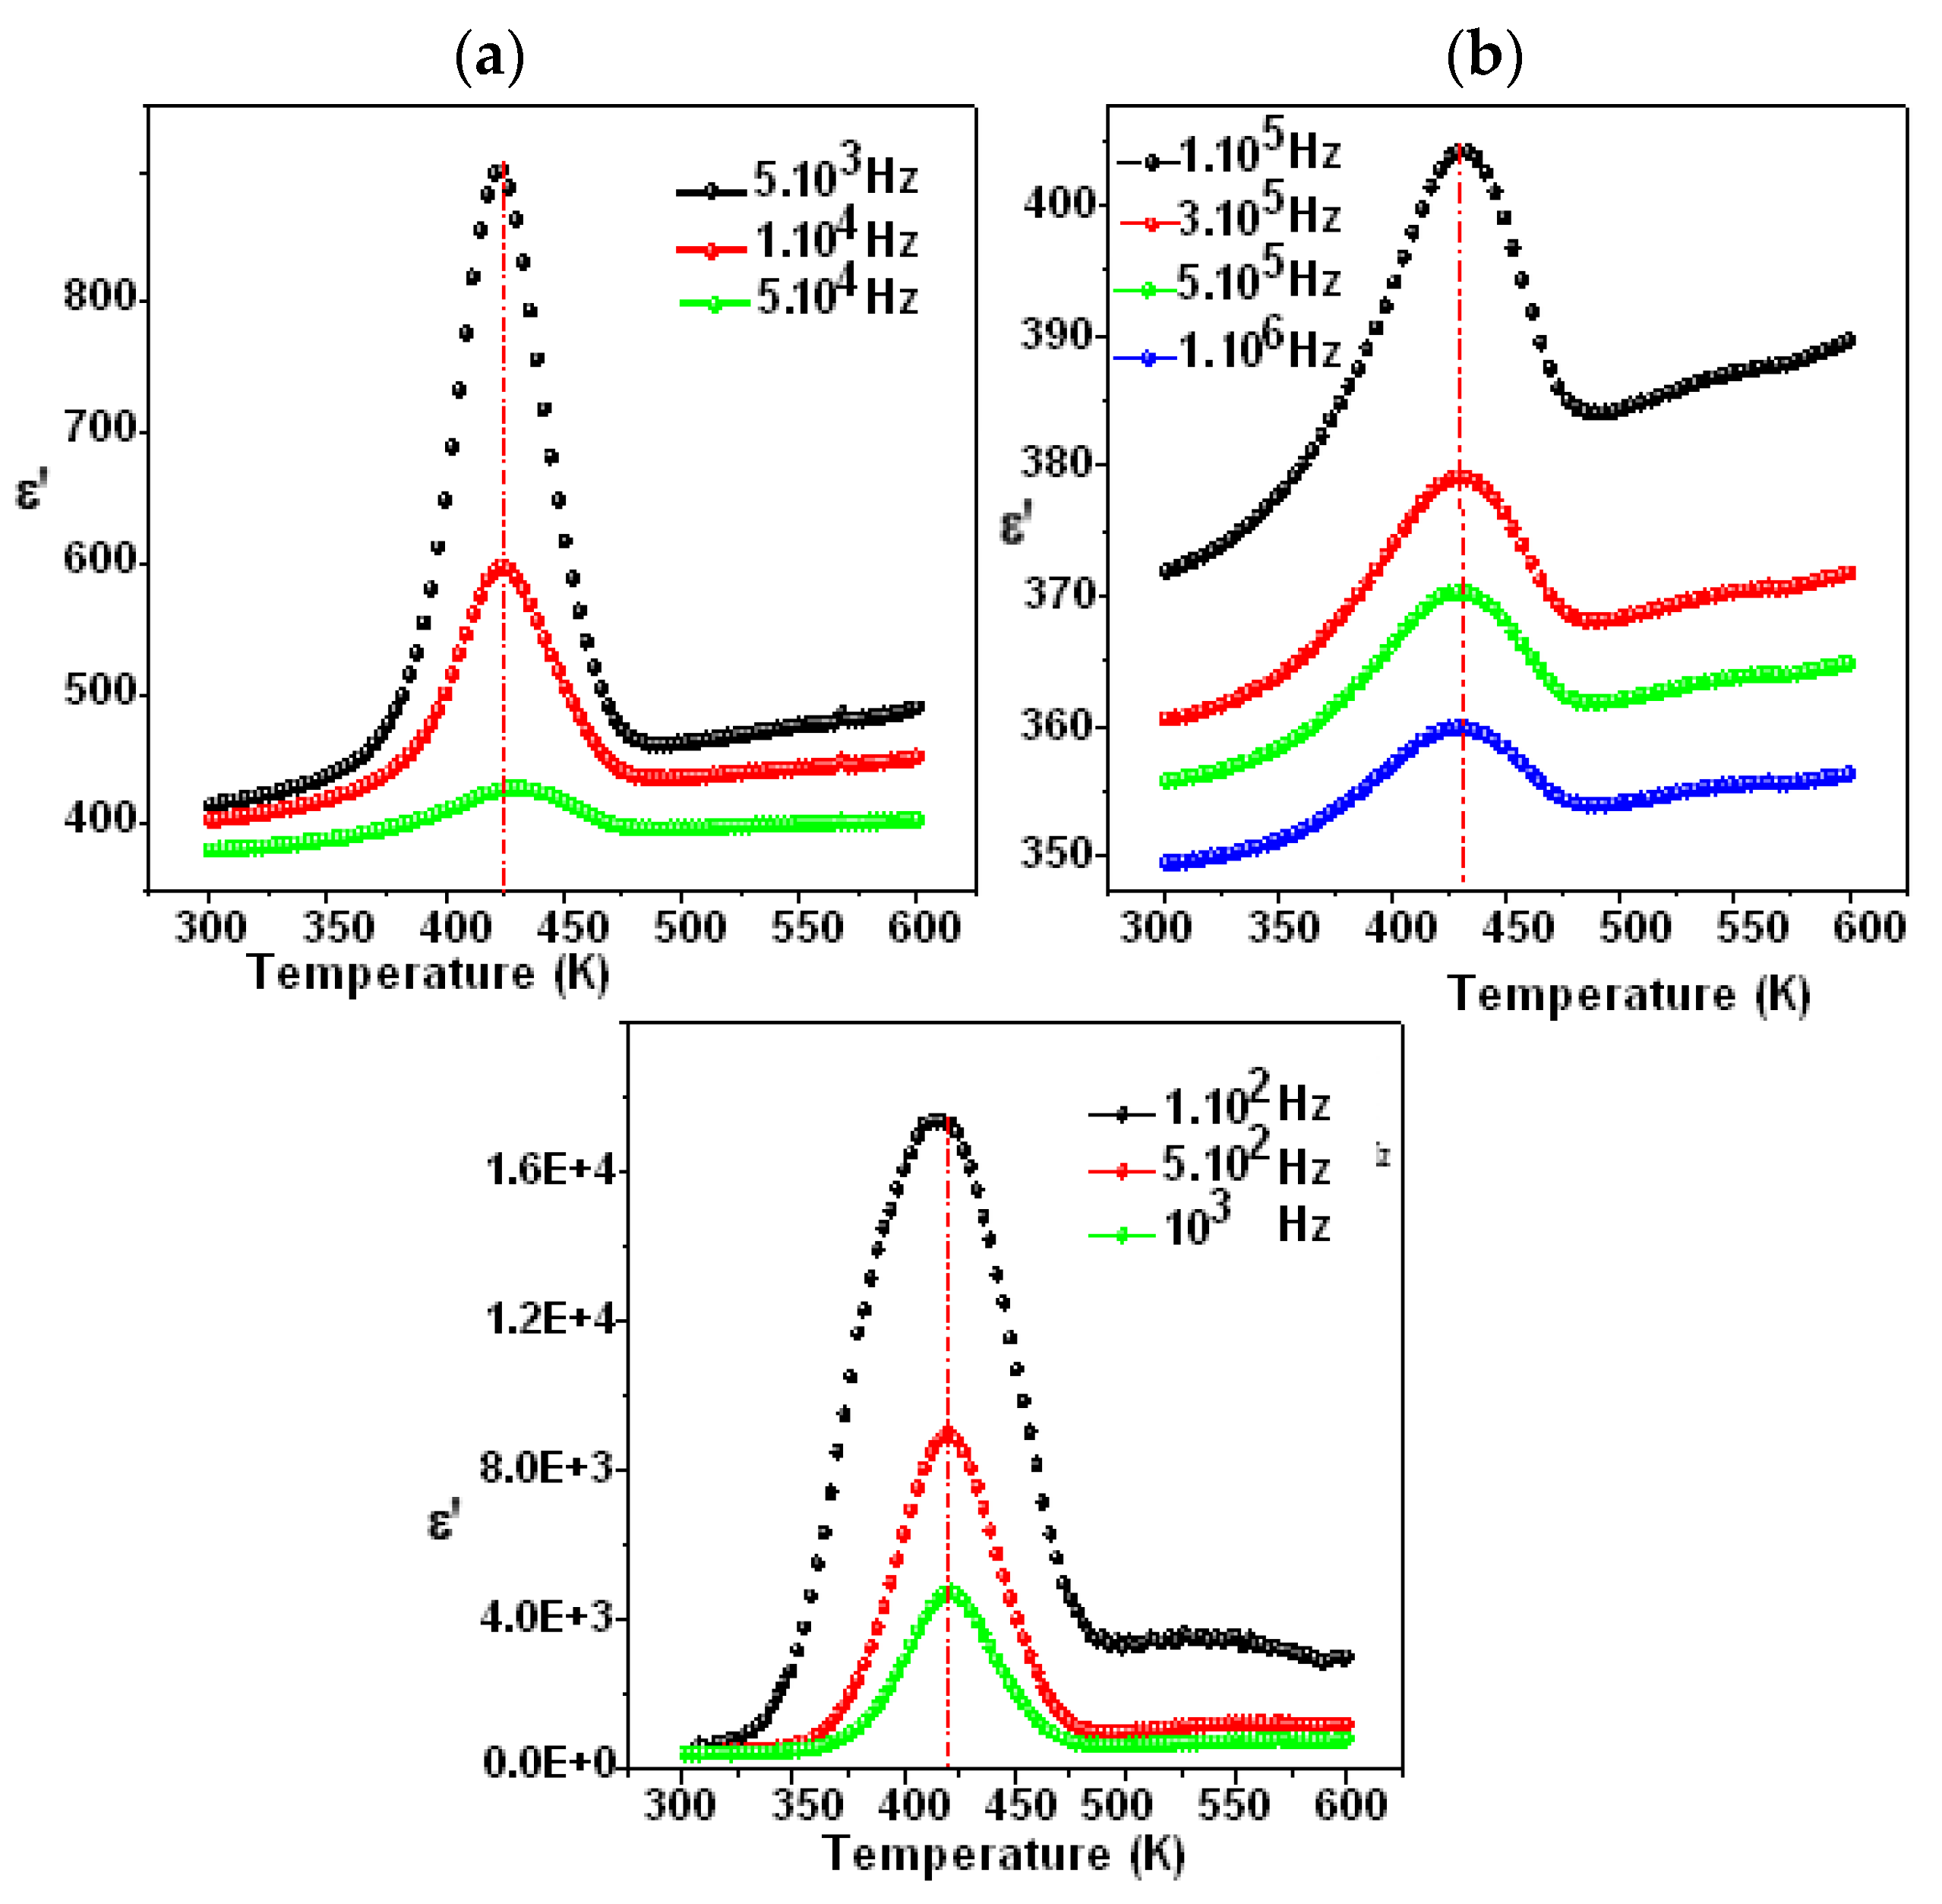
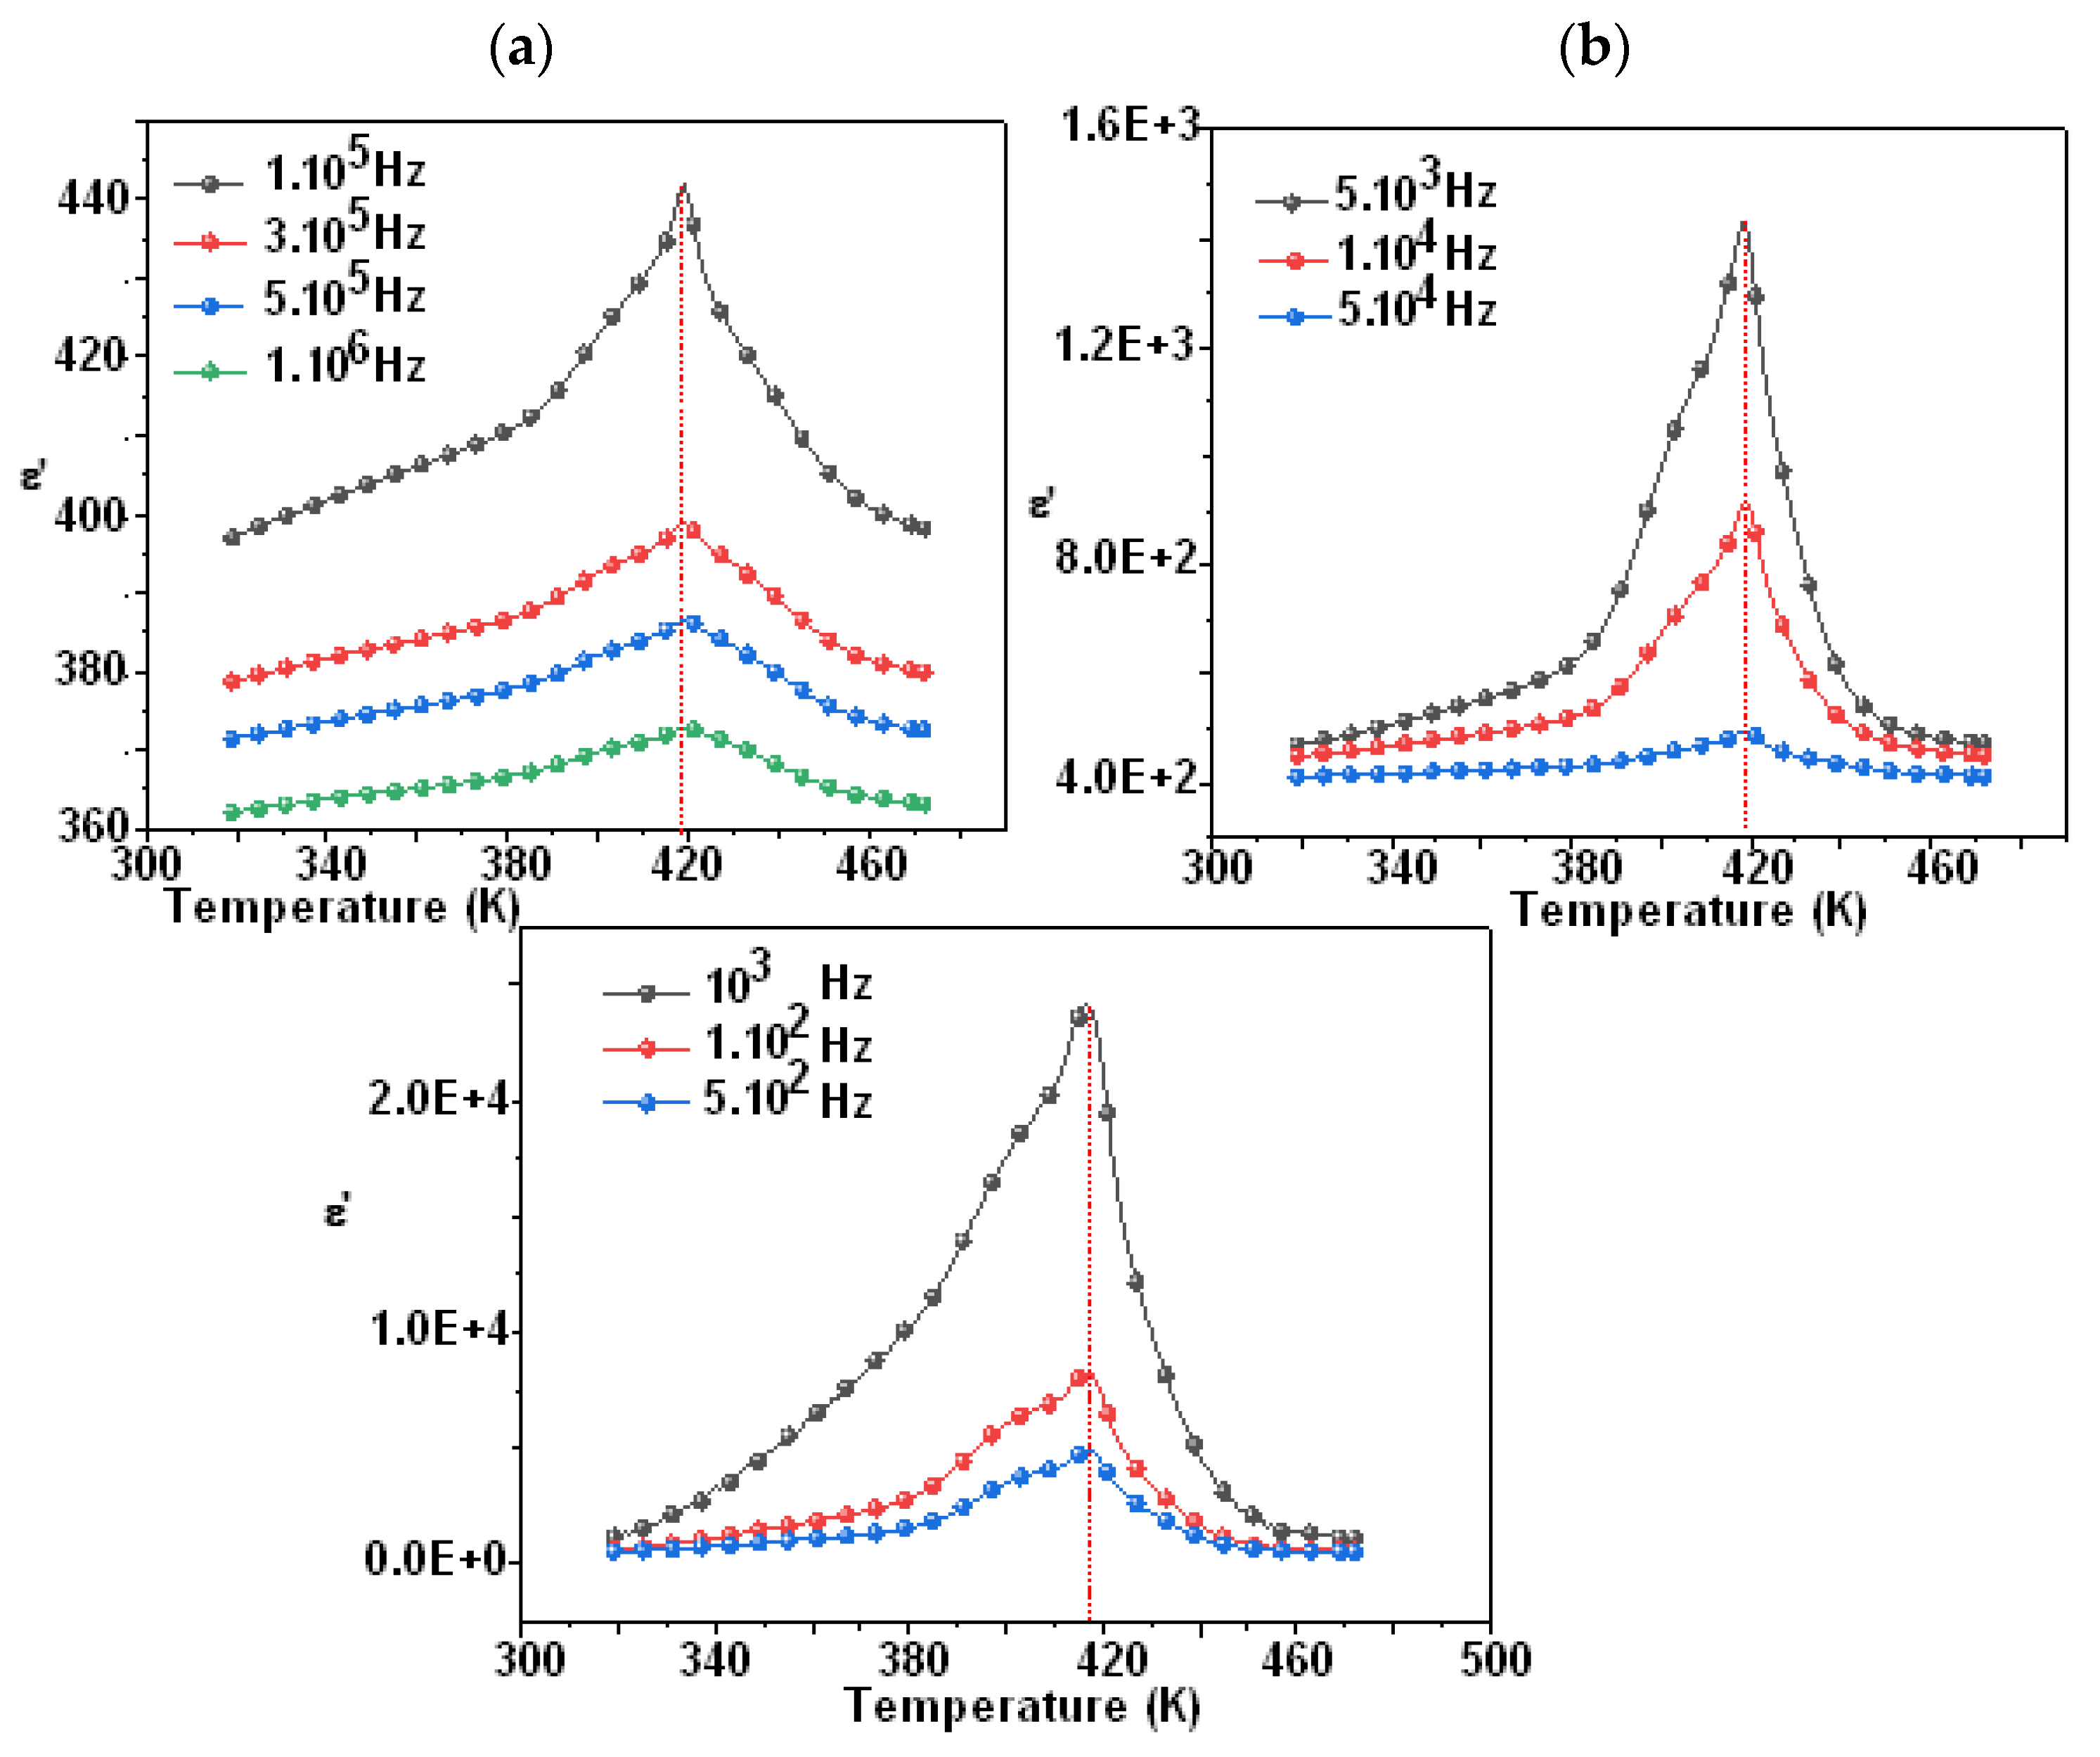
Figure 7 and Figure 8 show the temperature dependency of the dielectric constant for the compounds Li0.5Na1.5WO4 and Li1.5Na0.5WO4. The study of dielectric characteristics is, therefore, essential in order to detect the changes in the phases, the properties, and the behavior of the examined substance when an electric field is applied. This investigation is undertaken in the present case as a function of temperature in the range of 300–650 K, and in a frequency range of 100 Hz to 1 MHz. In fact, Figure 7a,b and Figure 8a,b show the temperature dependence of the relative dielectric constant with a fixed frequency for the compounds Li0.5Na1.5WO4 and Li1.5Na0.5WO4 [34], respectively.
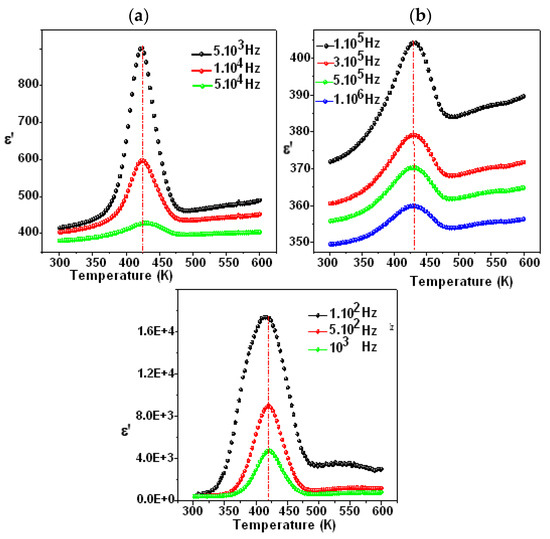
Figure 7.
Variation in ε′ as a function of temperature for Li1.5Na0.5WO4 ((a) frequency from 100 Hz to 10,000 Hz and (b) frequency from 100.000 to 1000,000 Hz) [36].
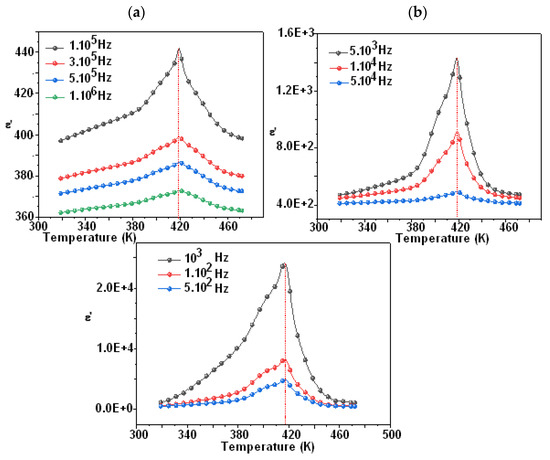
Figure 8.
Variation in ε′ as function temperature of Li0.5Na1.5WO4 ((a) frequency from 100 Hz to 10,000 Hz and (b) frequency from 100.000 to 1000,000 Hz).
We can see a dielectric relaxation of about 421 K for the compound Li1.5Na0.5WO4 and 418 K for the compound Li1.5Na0.5WO4. Therefore, a para–ferroelectric phase transition may be related to this large dielectric peak at Tc. Its maximum does not change (Tc remains constant at different frequencies), but its magnitude diminishes as the frequency increases. This relaxation is also observed for the parent molecule at about 373 K [5,6]. This shift in transition temperature could be attributed to a change in symmetry caused by the composition change. Actually, a qualitative study of these curves revealed that Tc remained constant when the frequency was varied, confirming the examined compound’s traditional characteristic [48]. Hence, in order to verify the nature of classic or relaxer ferroelectrics, Uchino and Nomura [49] proposed a more general expression of the Curie–Weiss law by introducing the degree of relaxation γ:
where C is the Curie–Weiss constant, ε′max is the real dielectric constant at T = TC, and γ (1 < γ< 2) denotes the degree of relaxation. The diffuse nature of the transition is translated by the component γ. However, the γ value is close to 1 for classical ferroelectrics and should equal 2 for perfect relaxer ferroelectrics [50,51].
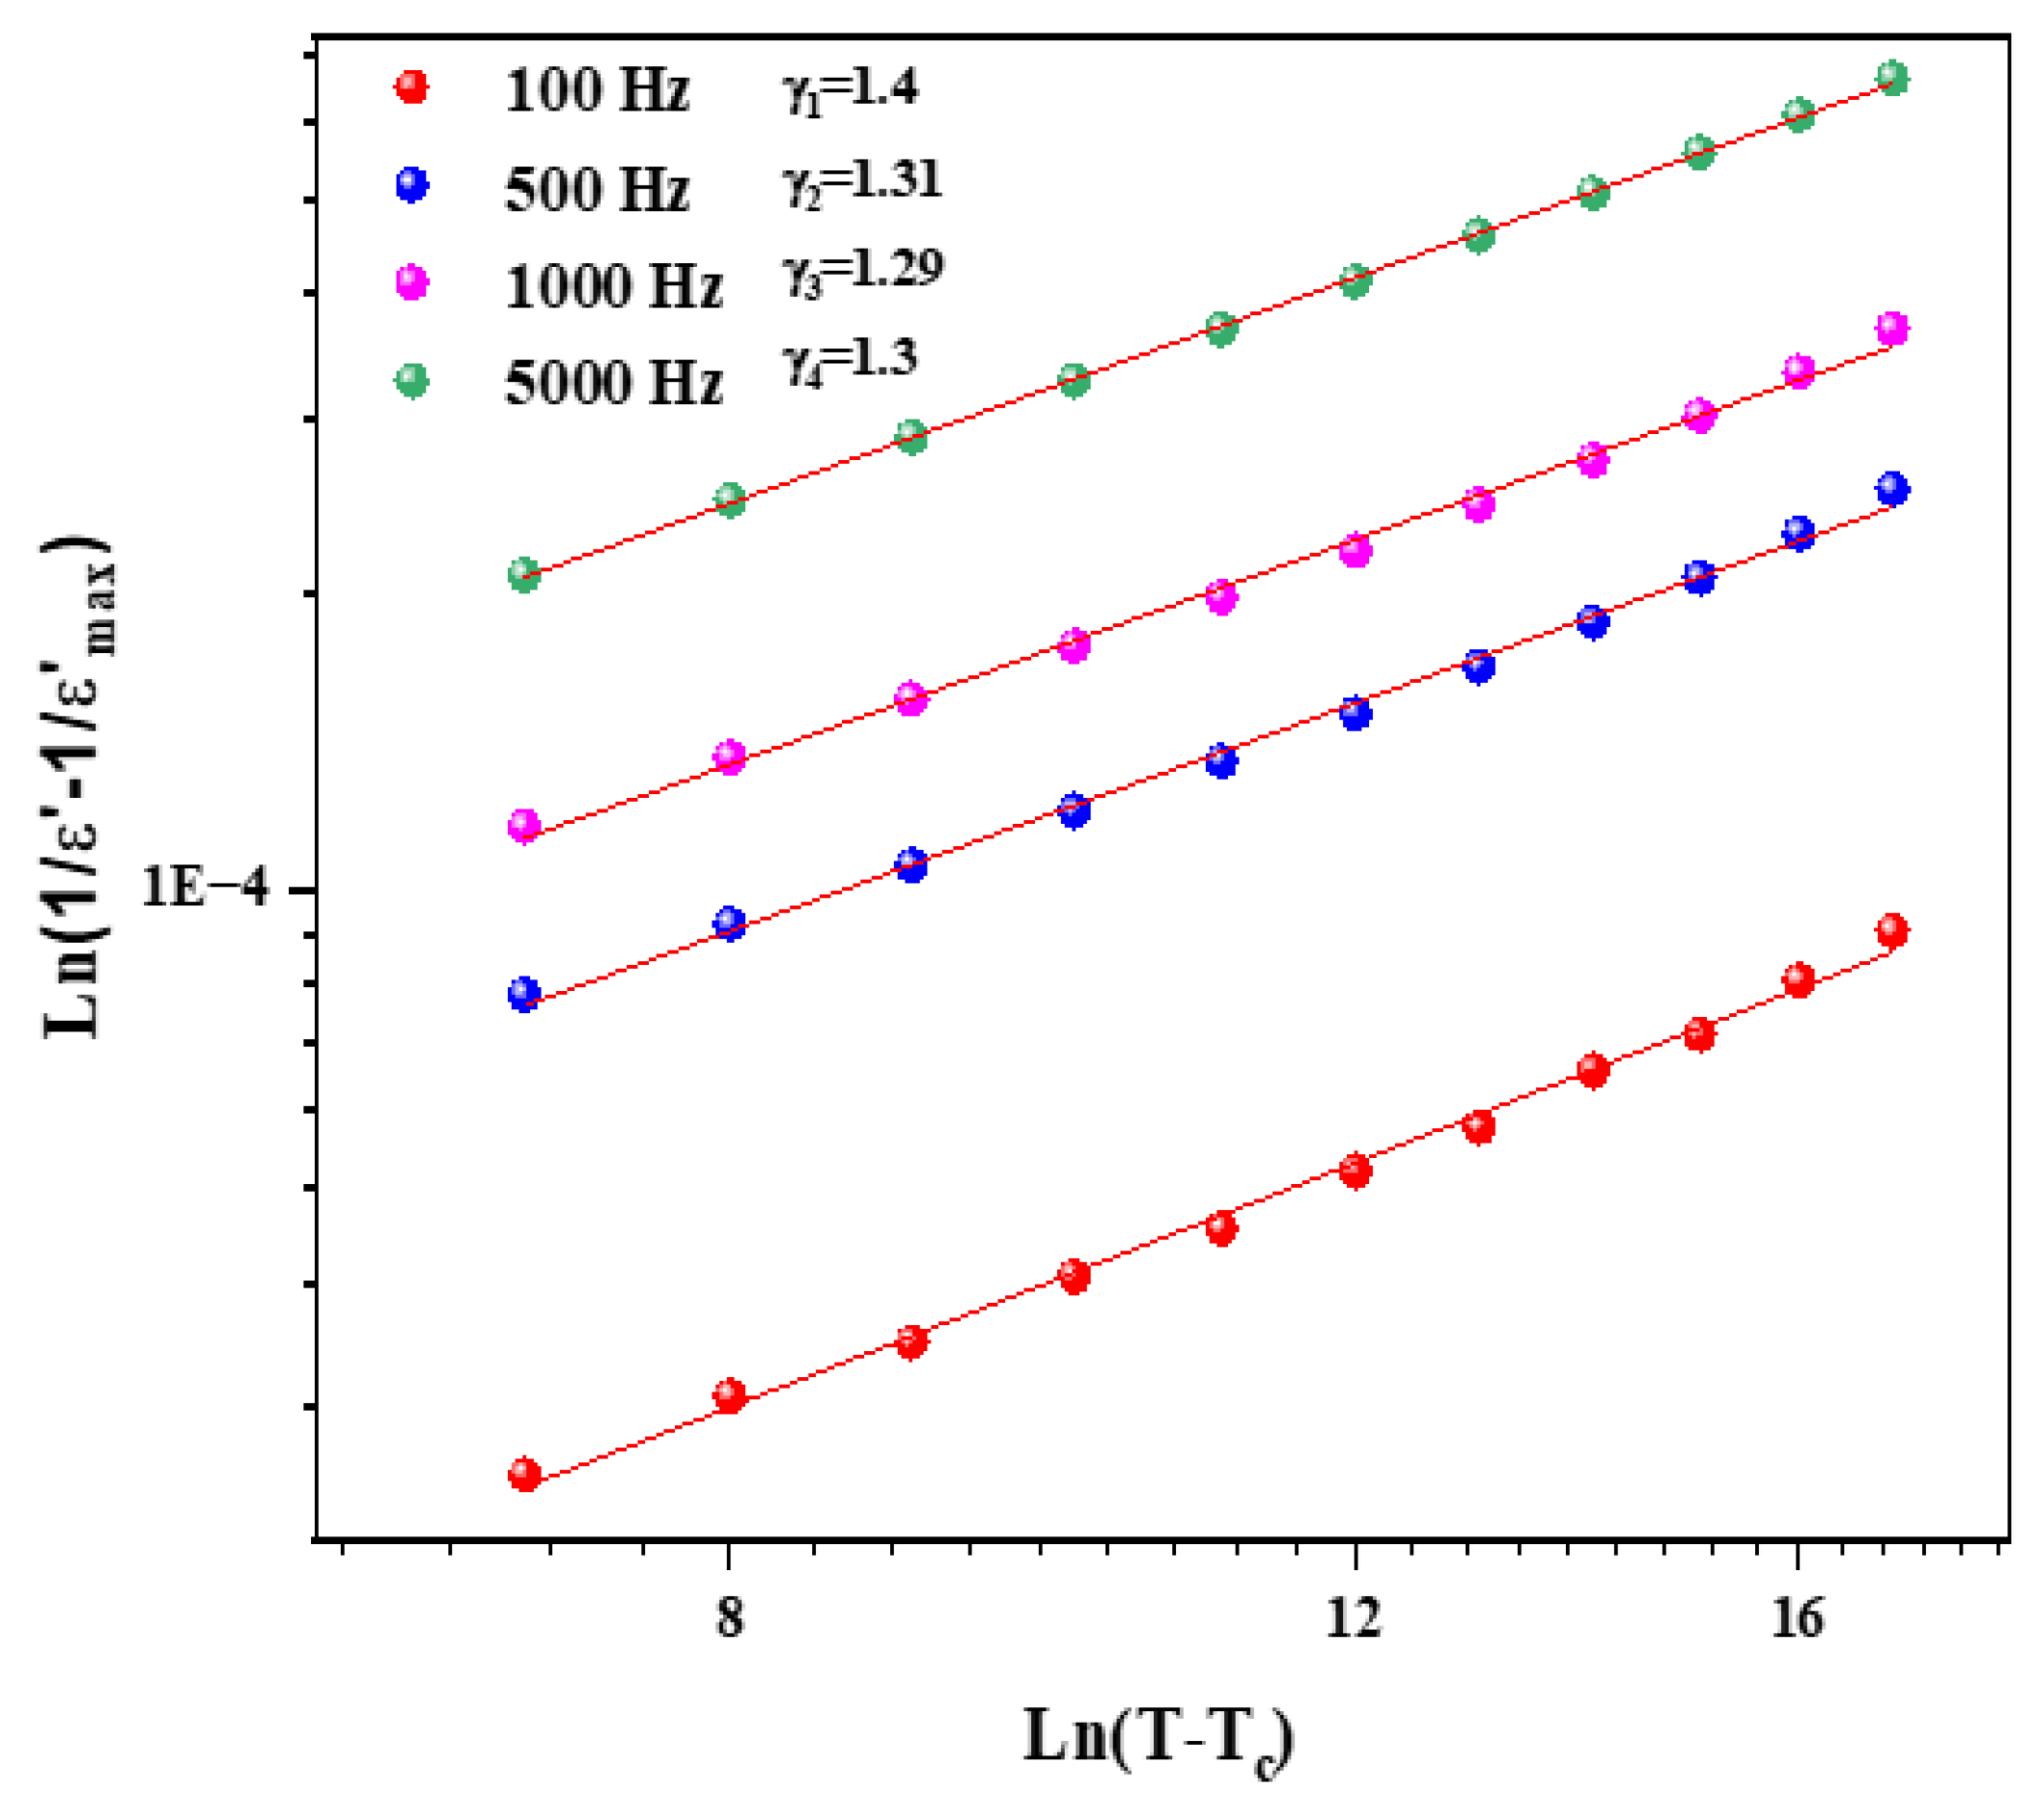
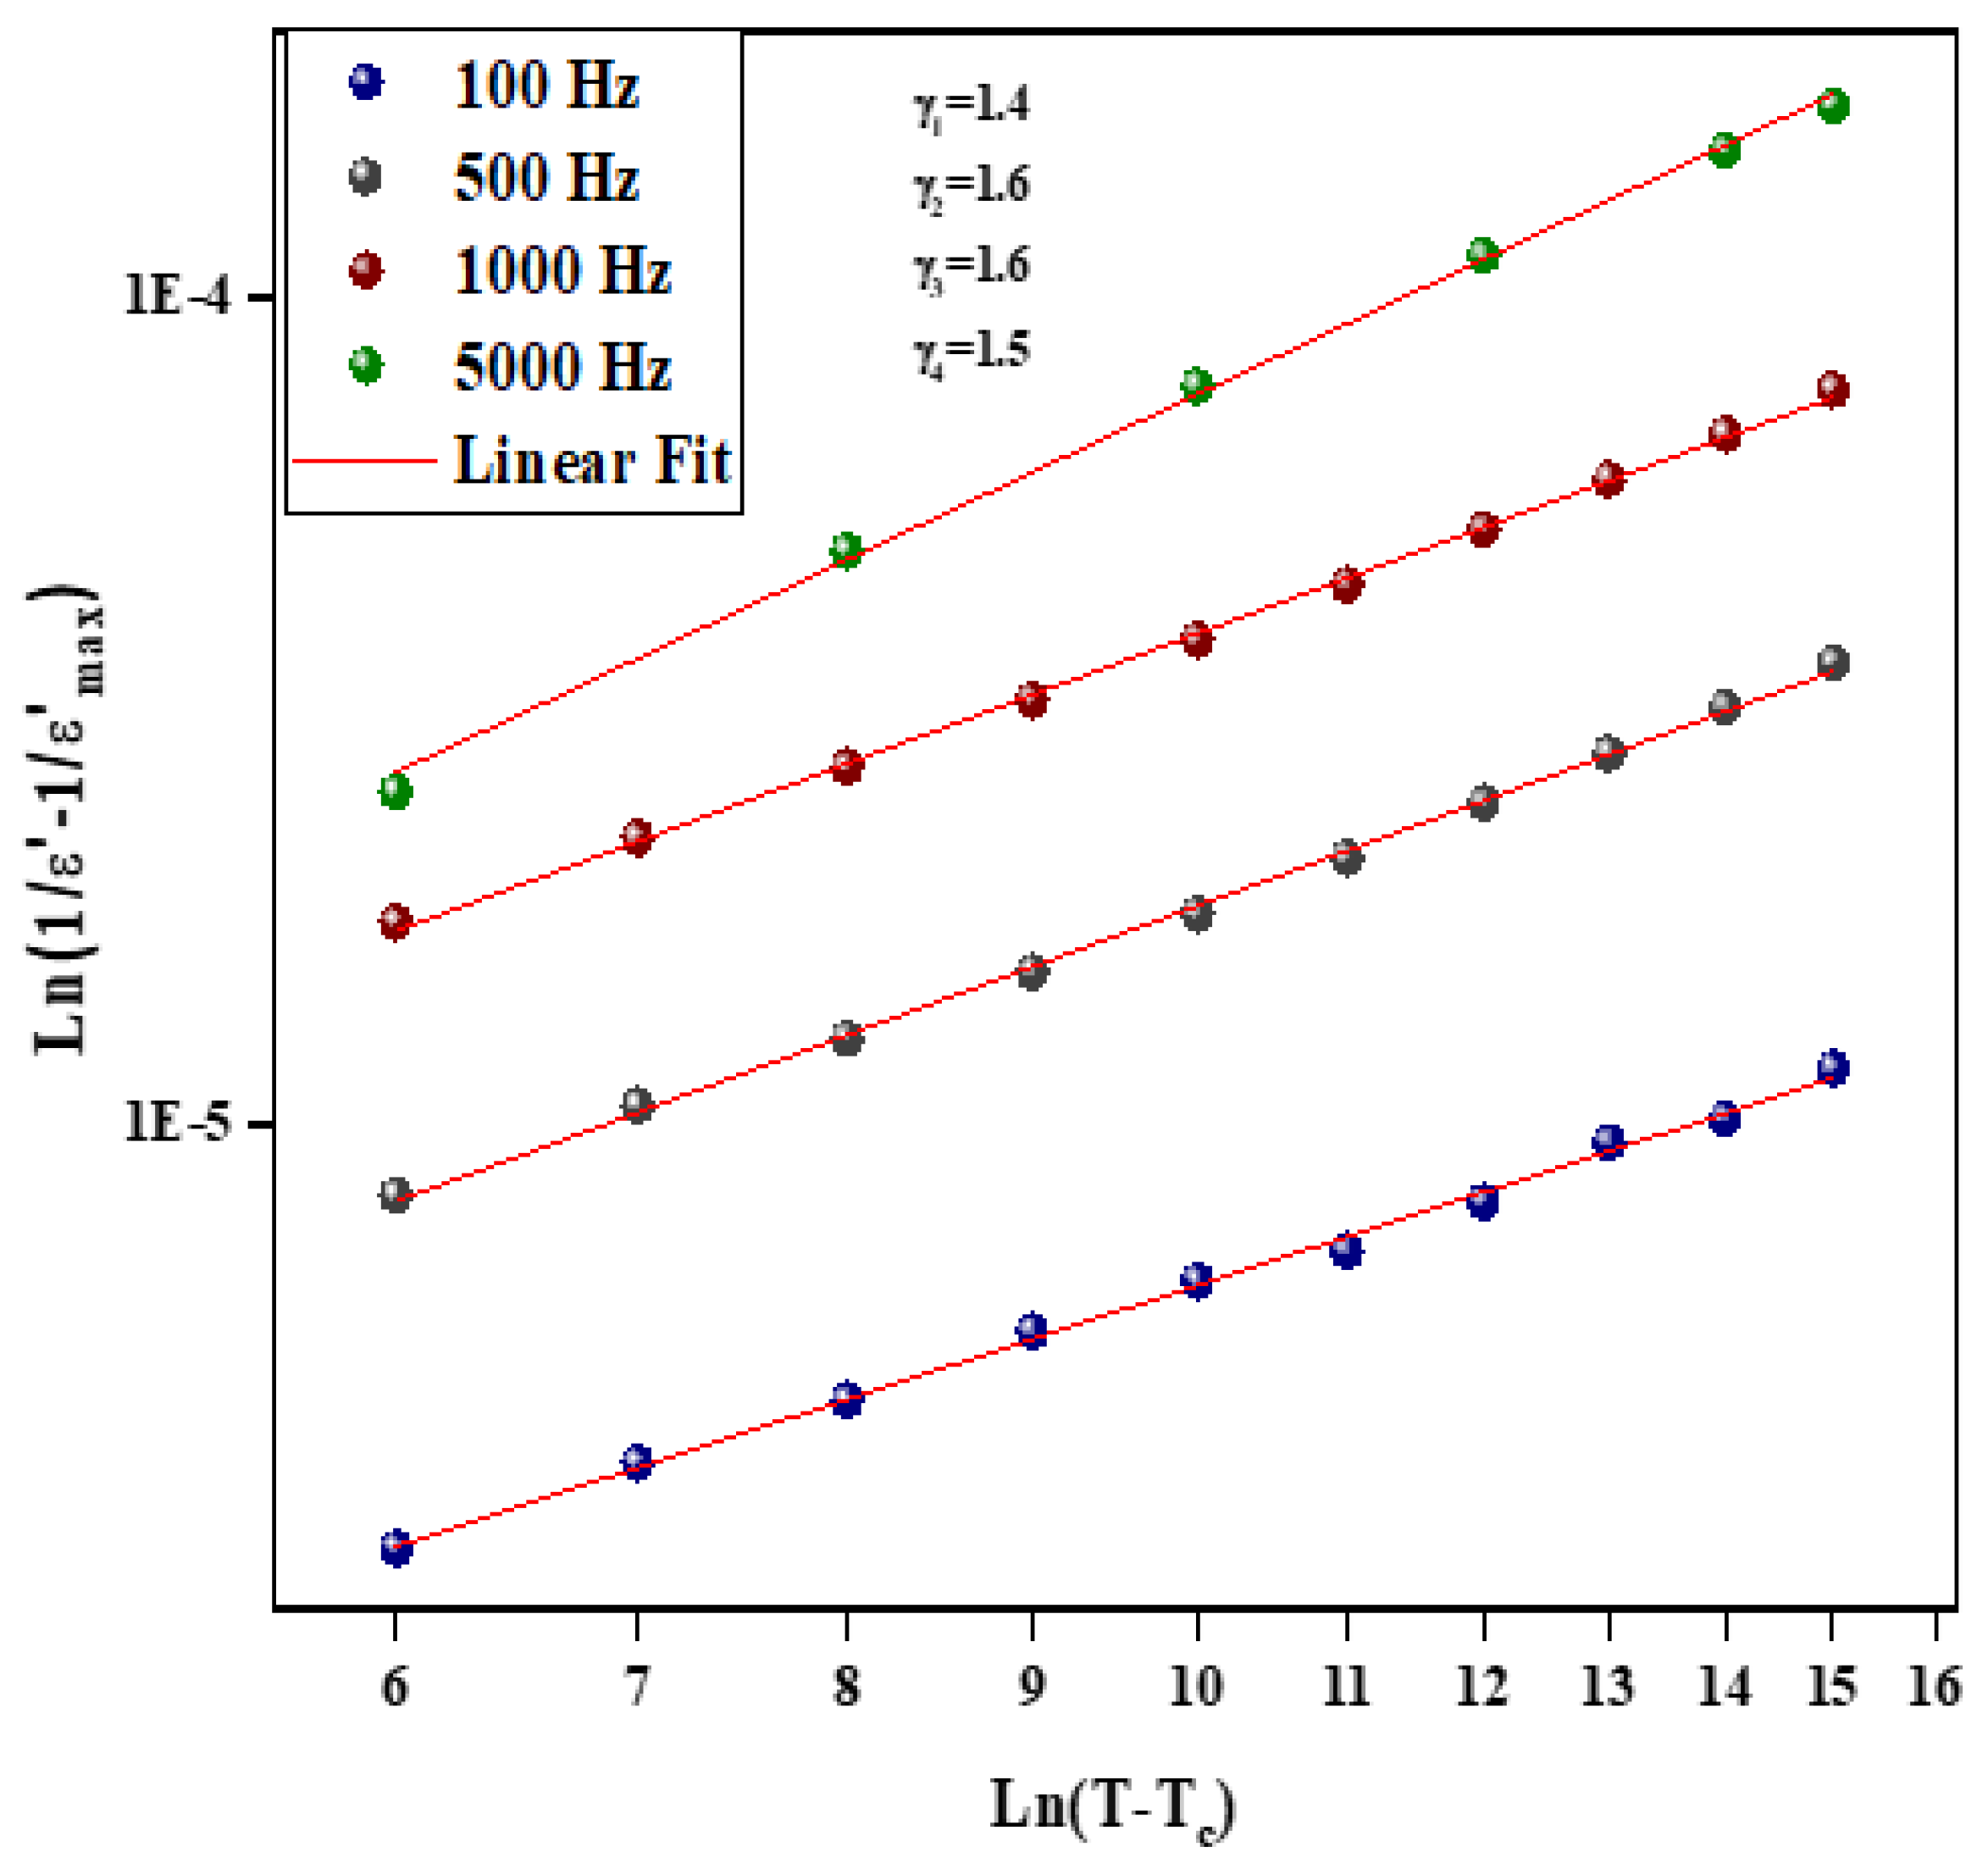
Figure 9 and Figure 10 illustrate the logarithmic charts of Equation (5) at various frequencies (the curve fitted to the modified Curie–Weiss law is indicated by the solid red lines).
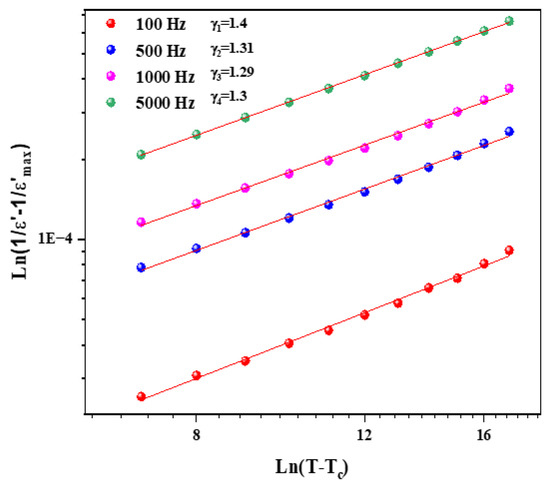
Figure 9.
as function of for different frequencies for Li1.5Na0.5WO4 compound.
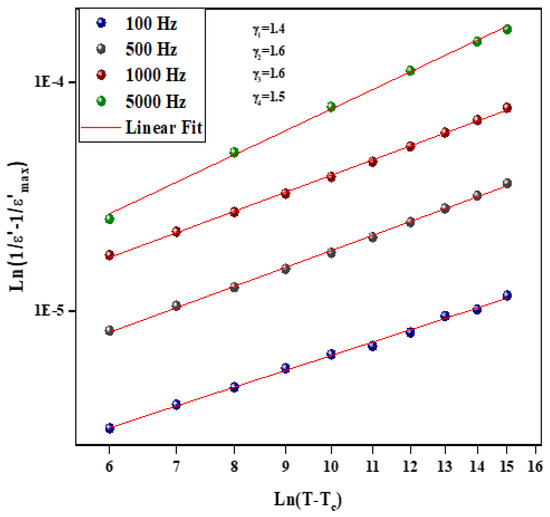
Figure 10.
as function of for different frequency for Li0.5Na1.5WO4 compound.
The obtained values for the Li1.5Na0.5WO4 and Li0.5Na1.5WO4 compounds are around 1.3 [34] and 1.5, respectively. This finding demonstrates that our sample is a typical ferroelectric compound. The dielectric measurements in the paraelectric state match the Curie–Weiss law rather well, as stated by the following relation:
where C and T0 are the Curie–Weiss constant and temperature, respectively.
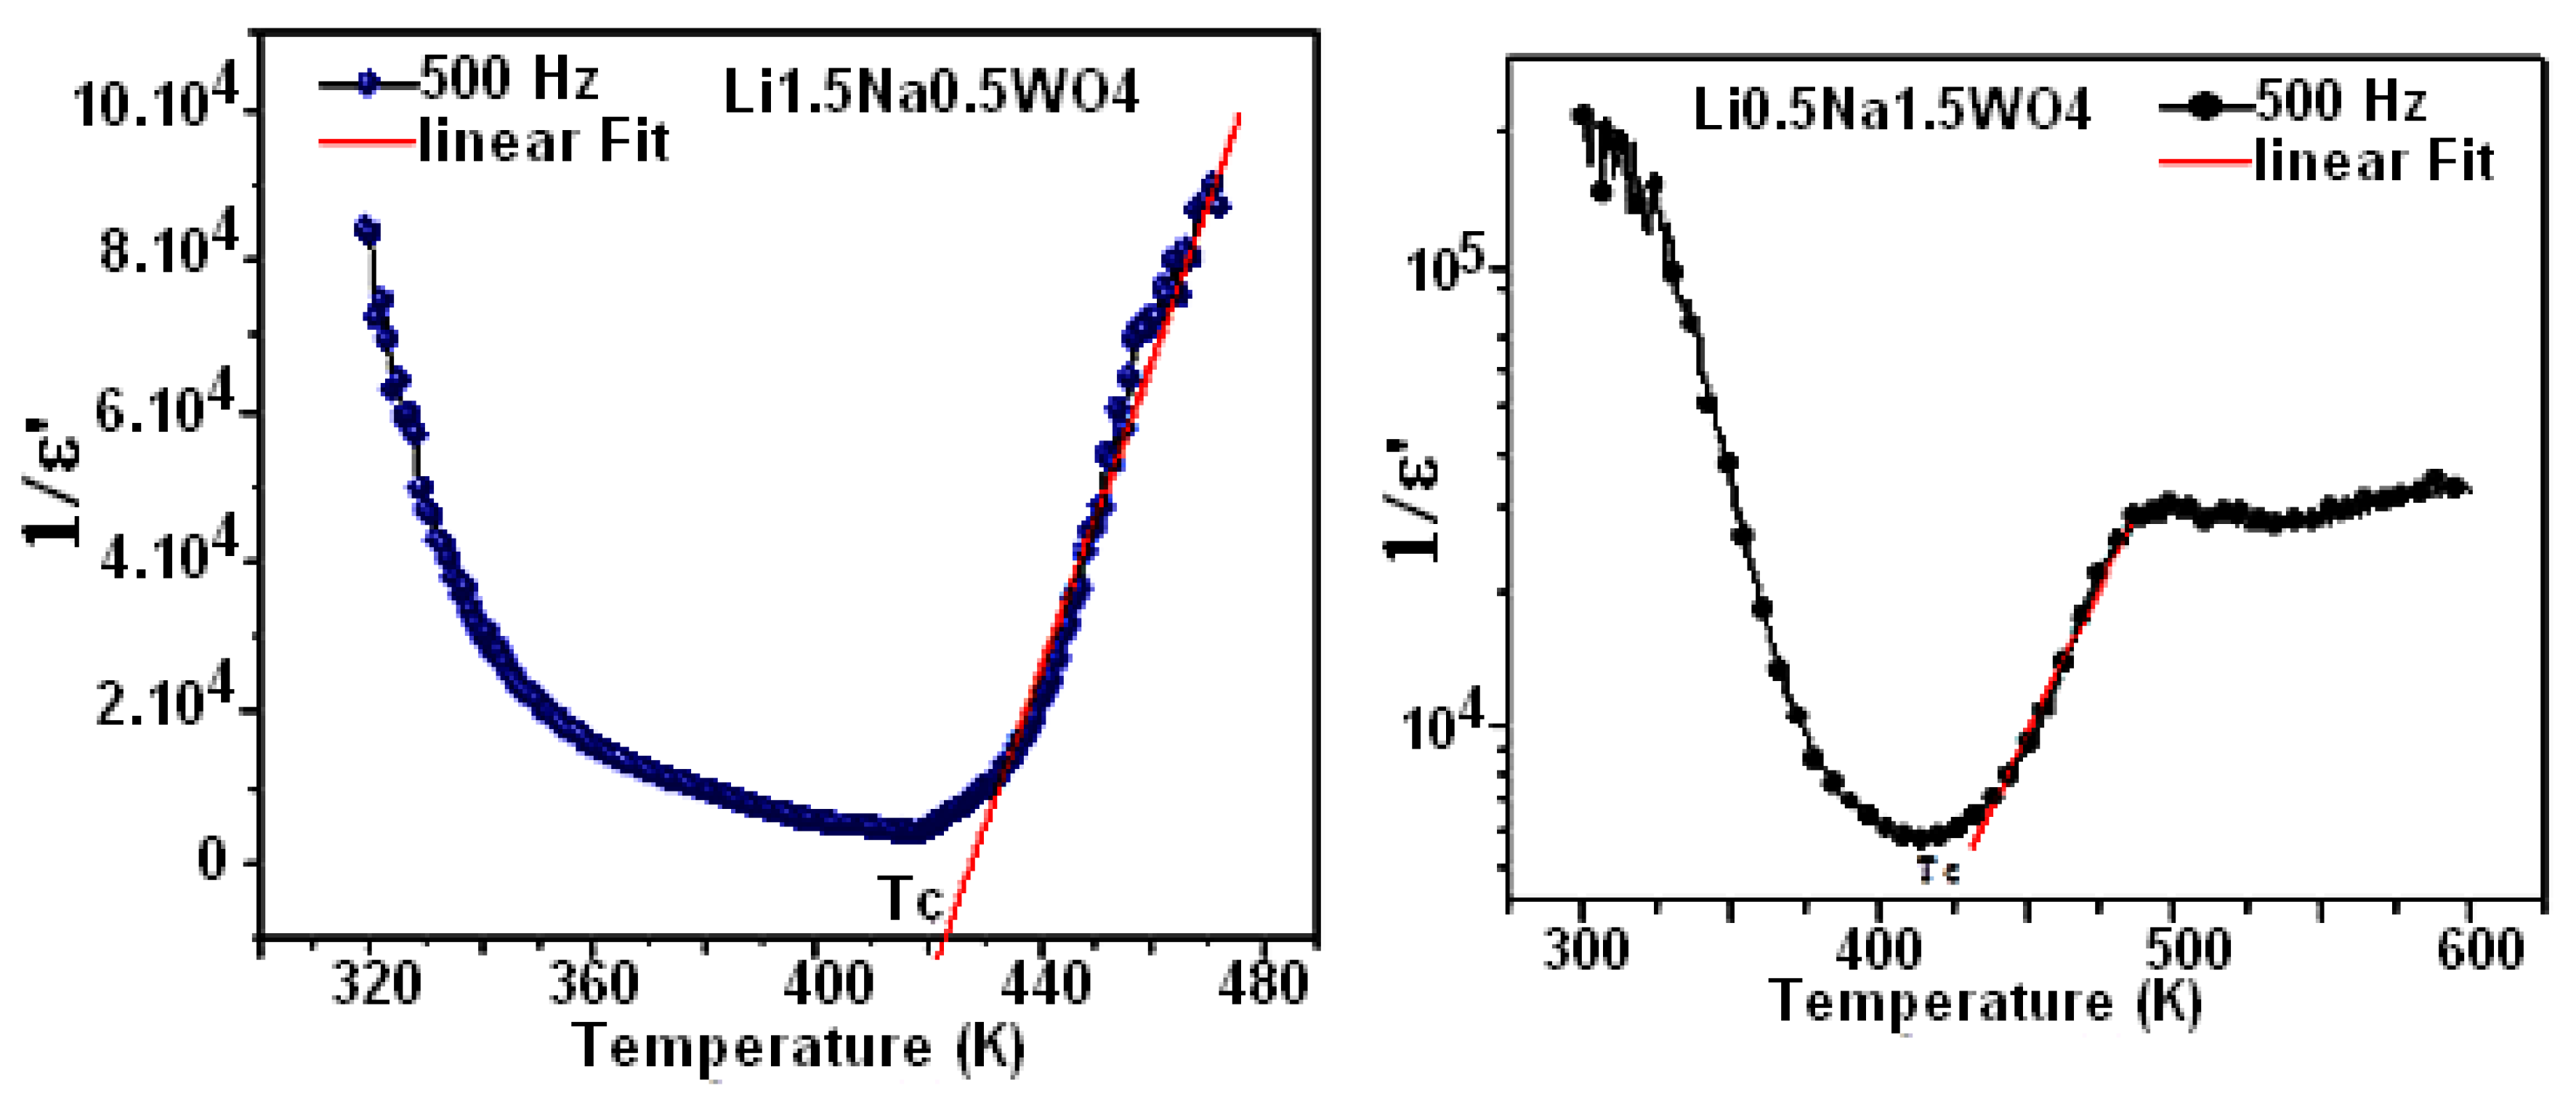
Figure 11 depicts the temperature dependency of the dielectric reciprocal (1/ε′) at 500 Hz. Indeed, for Li0.5Na1.5WO4 and Li1.5Na0.5WO4, these plots display straight lines, with the x-axis intercepts at T0 = 418 K and 421 K [34]. In classical ferroelectrics, the value of T0 indicates the order of the para–ferroelectric phase transition. In the case of T0 ≠ TC, the phase transition is first order. If T0 = TC, then this transition is of second order [52]. According to our observations, the value of T0 is comparable to TC, suggesting that this transition is of second order [53]. Beginning with the concept of ε′, which is connected to capacitance and the alignment of the dipole that is observed, we may deduce that a rise in frequency corresponds to an increase in disorder, which causes ε′ to drop. It is evident from comparing the ε′ values of the studied compounds that Li0.5Na1.5WO4 has higher values than Li1.5Na0.5WO4. We could, therefore, conclude that the latter is the most disordered.
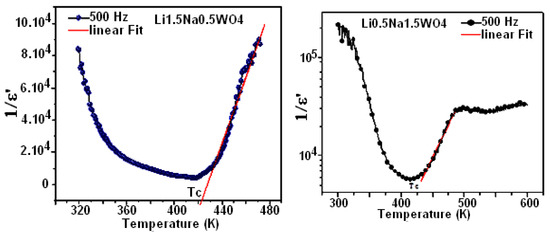
Figure 11.
Temperature variation in (1/ε′) at 500 Hz.
3.5. Conductivity Analysis
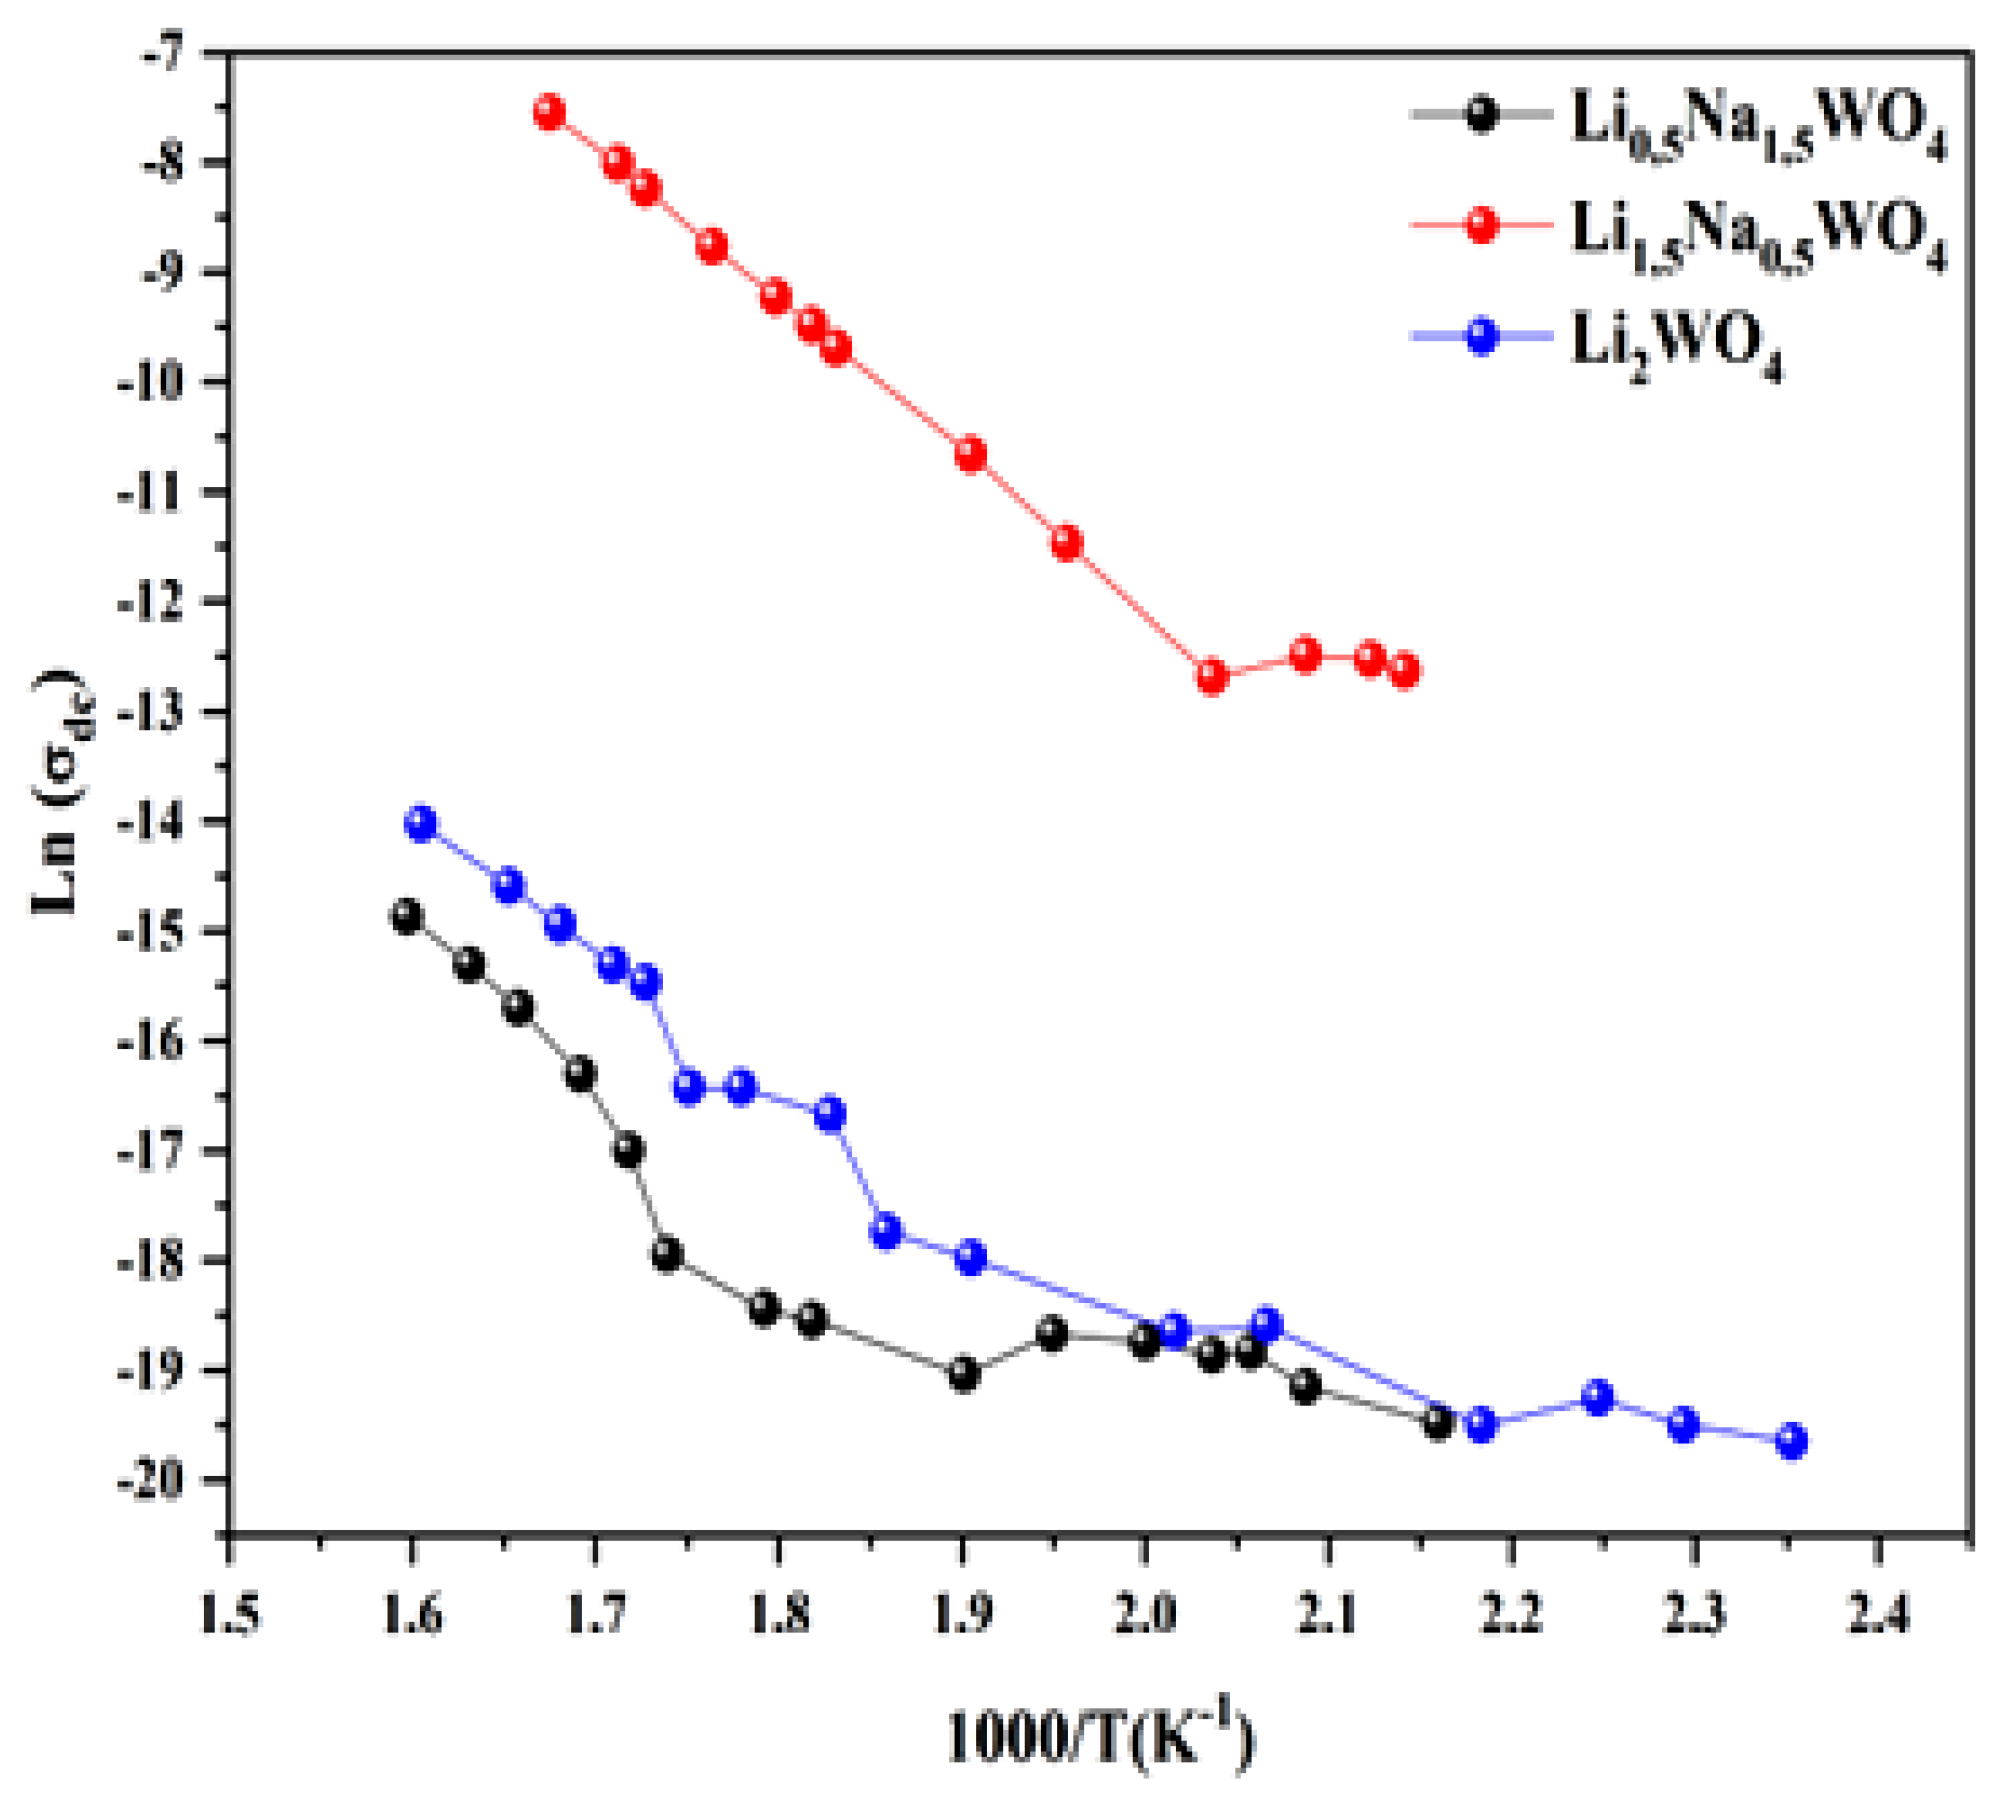
For the three compounds under investigation, we have calculated the conductivity fluctuation as a function of the frequency of the various temperature values [6,34,35]. We also observed that the experimental variation in conductivity is described by Jonscher’s universal law. The experimental results were adopted using the equation
In fact, as shown in Figure 12, and based on this adjustment, we have plotted the curves which are adjusted by the following expression:
where is the pre-exponential factor given by the following expression:
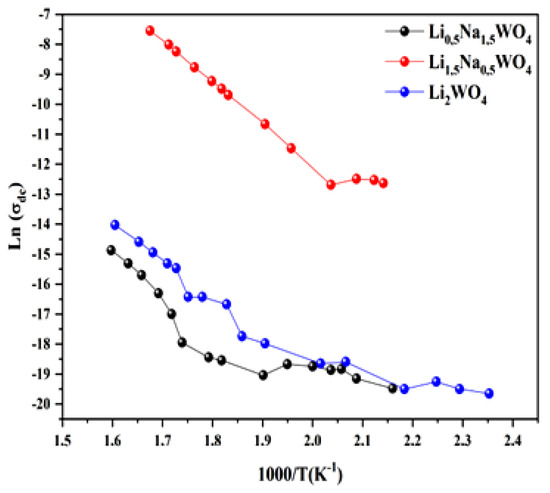
Figure 12.
Variation in conductivity for the three studied compounds.
The number of charge carriers that contribute to the conduction N and the entropy S are both proportional to this factor. Since the activation energies of the three materials are of the same order of magnitude, the high conductivity of the Li1.5Na0.5WO4 combination can be explained by other factors (Table 2). Moreover, given that the number of charge carriers is related to the density of the localized states (N = kTN (EF)) [54], the number in Li1.5Na0.5WO4 is greater than those in Li2WO4 and Li0.5Na1.5WO4. The enormous value of the Urbach energy for the composite Li1.5Na0.5WO4 compared to the other two compounds indicates that the disorder (translated by the entropy S) in this material is more important, and thus: S(x = 0.5) > S(x = 1) > S(x = 1.5). Actually, a comparative study revealed that the conductivity of the compound Li1.5Na0.5WO4 is greater than that of the other two compounds, which can be explained by the fact that the disorder (entropy represented by the Urbach energy) and the number of charge carriers (represented by the number of localized states) is greater for this compound than for the other two.
4. Conclusions
The obtained results allow us to deduce that the compounds Li2WO4 and Li1.5Na0.5WO4 crystallize in the monoclinic system while the compound Li0.5Na1.5WO4 crystallizes in the orthorhombic system. The values obtained from the estimation of the crystallite sizes of these compounds range between 0.2 and 0.1 µm, which is smaller than the grain sizes that were determined from the SEM images, which range from 3 to 5 μm. The SEM images clearly show that the compounds’ structures are compact, with a small number of pores resulting from the compounds’ tendency to form agglomerations. The EDX analysis verifies that the chemical elements are present in the compositions of the samples. Additionally, we can state that the optical analysis carried out with a UV-Vis spectrophotometer showed that the two compounds Li1.5Na0.5WO4 and Li2WO4 each had a single absorption band present at 245 nm, while Li0.5Na1.5WO4 had a single absorption band at 300 nm. In fact, this difference could be explained by the shift in symmetry from orthorhombic to monoclinic. Then, the optical gap energy was calculated using the Kubelka–Munk equation. In addition, the Urbach energy calculation revealed that the compound Li1.5Na0.5WO4 is the most disordered of the three investigated. The dielectric studies of the two compounds also revealed the presence of ferro–paraelectric transitions at 421 K and 418 K for Li0.5Na1.5WO4 and Li1.5Na0.5WO4. Thermal research detected this transition (DSC), which occurs in the parent compounds at about 373 K; where the temperature offset may be due to symmetry differences. Moreover, a comparison study revealed that the conductivity of the compound Li1.5Na0.5WO4 is greater than that of the other two compounds, which may be due to the fact that the disorder and the charge number are higher in the case of Li1.5Na0.5WO4.
Author Contributions
Conceptualization, M.K. (Moufida Krimi) and A.B.R.; methodology, K.K.; software, M.K. (Moufida Krimi) and M.H.A.-H.; validation, M.K., A.B.R. and A.H.A.; formal analysis, M.K. (Moufida Krimi); investigation, A.B.R.; data curation, K.K.; writing—original draft preparation, M.K. (Moufida Krimi) and A.B.R.; writing—review and editing, A.B.R., M.K. (Mohamed Khitouni) and K.K.; supervision, A.B.R. All authors have read and agreed to the published version of the manuscript.
Funding
This research received no external funding.
Data Availability Statement
Data can be requested from the authors.
Acknowledgments
Researchers would like to thank the Deanship of Scientific Research, Qassim University for the funding publication of this project.
Conflicts of Interest
The authors declare no conflict of interest.
References
- Deb, K.K. Pyroelectric characteristics of (Pb0.9Sm0.1)TiO3 ceramics. Ferroelectrics 1988, 82, 45–53. [Google Scholar] [CrossRef]
- Tandon, R.P.; Singh, R.; Singh, V.; Swani, N.H.; Hans, V.K. Ferroelectric properties of lead titanate/polymer composite and its application in hydrophones. J. Mater. Sci. Lett. 1992, 11, 883–885. [Google Scholar] [CrossRef]
- Alvarez-Vega, M.; Rodriguez-Carvajal, J.; Reyes-Cardenas, J.G.; Fuentes, A.F.; Amador, U. A Topological Analysis of Void Spaces in Tungstate Frameworks: Assessing Storage Properties for the Environmentally Important Guest Molecules and Ions: CO2, UO2, PuO2, U, Pu, Sr2+, Cs+, CH4, and H2. J. Chem. Mater. 2001, 13, 3871–3875. [Google Scholar]
- Wong, C.P.P.; Lai, C.W.; Lee, K.M. Tungsten-Based Materials for Supercapacitors. In Book Inorganic Nanomaterials for Supercapacitor Design, 1st ed.; CRC Press: Boca Raton, FL, USA, 2020; Volume 11. [Google Scholar] [CrossRef]
- Isupov, V.A. Ferroelectric and Ferroelastic Phase Transitions in Molybdates and Tungstates of Monovalent and Bivalent Elements. Ferroelectrics 2005, 322, 83–114. [Google Scholar] [CrossRef]
- Sharma, S.; Choudhary, R.N.P. Phase transition in Li2WO4. Ferroelectrics 1999, 4, 129–137. [Google Scholar] [CrossRef]
- Besozzi, E.; Dellasega, D.; Pezzoli, A.; Conti, C.; Passoni, M.; Beghi, M.G. Amorphous, ultra-nano- and nano-crystalline tungsten-based coatings grown by Pulsed Laser Deposition: Mechanical characterization by Surface Brillouin Spectroscopy. Mater. Des. 2016, 106, 14–21. [Google Scholar] [CrossRef]
- Sharma, S.; Choudhary, R.N.P.; Shanigrahi, S.R. Structural and electrical properties of Na2WO4 ceramics. J. Mater. Lett. 1999, 40, 134–139. [Google Scholar] [CrossRef]
- Bazarova, Z.G.; Arkhincheyeva, S.I.; Batuyeva, I.S.; Bazarov, B.G.; Tushinova, Y.I.; Bazarova, S.T.; Fyodorov, K.N. Complex Oxide Compounds of Polyvalent Metals: Synthesis, Structure and Properties. Chem. Sustain. Dev. 2000, 8, 135–139. [Google Scholar]
- Nagasaki, T.; Kok, K.; Yahaya, A.H.; Igawa, N.; Noda, K.; Ohno, H. Phase identification and electrical conductivity of Li2WO4 Reviewed. Solid State Ion. 1997, 96, 61–74. [Google Scholar] [CrossRef]
- Busey, R.H.; Keller, O.L., Jr. Structure of the Aqueous Pertechnetate Ion by Raman and Infrared Spectroscopy. Raman and Infrared Spectra of Crystalline KTcO4, KReO4, Na2MoO4, Na2WO4, Na2MoO4·2H2O, and Na2WO4·2H2O. J. Chem. Phys. 1964, 41, 215–225. [Google Scholar] [CrossRef]
- Pal, I.; Agarwal, A.; Sanghi, S.; Shearan, A.; Ahlawat, N. Conductivity and dielectric relaxation in sodium borosulfate glasses. J. Alloys Compd. 2009, 472, 40–45. [Google Scholar] [CrossRef]
- Dyre, J.C. The random free-energy barrier model for ac conduction in disordered solids. J. Appl. Phys. 1988, 64, 2456–2468. [Google Scholar] [CrossRef]
- Karoui, K.; Rhaiem, A.B.; Jomni, F.; Moneger, J.L.; Bulou, A.; Guidara, K. Characterization of phase transitions of [N(CH3)4]2ZnCl2Br2 mixed crystals. J. Mol. Struct. 2013, 1048, 287–294. [Google Scholar] [CrossRef]
- Huebner, J.S.; Dillenburg, R.G. Impedance spectra of hot, dry silicate minerals and rock: Qualitative interpretation of spectra. J. Am. Mineral. 1995, 80, 46–64. [Google Scholar] [CrossRef]
- Imran, M.M.A.; Lafi, O.A. Electrical conductivity, density of states and optical band gap in Se90Te6Sn4 glassy semiconductor. Physica B 2013, 410, 201–205. [Google Scholar] [CrossRef]
- Bhowmik, R.N.; Vijayasri, G. Study of microstructure and semiconductor to metallic conductivity transition in solid state sintered Li0.5Mn0.5Fe2O4−δ spinel ferrite. J. Appl. Phys. 2013, 114, 223701. [Google Scholar] [CrossRef]
- Bhowmik, R.N.; Aneesh Kumar, K.S. Role of pH value during material synthesis and grain-grain boundary contribution on the observed semiconductor to metal like conductivity transition in Ni1.5Fe1.5O4 spinel ferrite. Mater. Chem. Phys. 2016, 177, 417–428. [Google Scholar] [CrossRef]
- Saraswat, V.K.; Singh, K.; Saxena, N.S.; Kishore, V.; Sharma, T.P.; Saraswat, P.K. Composition dependence of the electrical conductivity of Se85−xTe15Sbx (x = 2, 4, 6, 8 and 10) glass at room temperature. Curr. Appl. Phys. 2006, 6, 14–18. [Google Scholar] [CrossRef]
- Pradhan, S.K.; Kalidoss, J.; Barik, R.; Sivaiah, B.; Dhar, A.; Bajpai, S. Development of high density tungsten based scandate by Spark Plasma Sintering for the application in microwave tube devices. Int. J. Refract. Metals Hard Mater. 2016, 61, 215–224. [Google Scholar] [CrossRef]
- Namikawa, H. Characterization of the diffusion process in oxide glasses based on the correlation between electric conduction and dielectric relaxation. J. Non-Cryst. Solids 1975, 18, 173–195. [Google Scholar] [CrossRef]
- Gudmundsson, J.T.; Svavarsson, H.G.; Gudjonsson, S.; Gislason, H.P. Frequency-dependent conductivity in lithium-diffused and annealed GaAs. Phys. B Condens. Matter 2003, 340–342, 324–328. [Google Scholar] [CrossRef]
- van den Berg, A.J.; Tuinstra, F.; Warczewski, J. Modulated structures of some alkali molybdates and tungstates. Acta Cryst. B 1973, 29, 586–589. [Google Scholar] [CrossRef]
- Mollah, S.; Som, K.K.; Chaudri, K.B. AC conductivity in Bi4Sr3Ca3CuyOx (y=0–5) and Bi4Sr3Ca3−zLizCu4Ox (z=0.1–1.0) semiconducting oxide glasses. J. Appl. Phys. 1993, 74, 931–937. [Google Scholar] [CrossRef]
- Hayashi, T.; Okada, J.; Toda, E.; Kuzuo, R.; Matsuda, Y.; Kuwata, N.; Kawamura, J. Electrochemical effect of lithium tungsten oxide modification on LiCoO2 thin film electrode. J. Power Sources 2015, 285, 559–567. [Google Scholar] [CrossRef]
- Radzikhovskaya, M.A.; Garkushin, I.K.; Danilushikina, E.G. Ternary systems LiBr-Li2MoO4-Li2WO4 and LiF-Li2MoO4-Li2WO4. Russ. J. Inorg Chem. 2012, 57, 1616–1620. [Google Scholar] [CrossRef]
- Barinova, O.; Sadovskiy, A.; Ermochenkov, I.; Kirsanova, S.; Khomyakov, A.; Zykova, M.; Kuchuk, Z.; Avetissov, I. Solid solution Li2MoO4 – Li2WO4 crystal growth and characterization. Cryst. Growth 2017, 468, 365–368. [Google Scholar] [CrossRef]
- Dkhilalli, F.; Megdiche, S.; Guidara, K.; Rasheed, M.; Barillé, R.; Megdiche, M. AC conductivity evolution in bulk and grain boundary response of sodium tungstate Na2WO4. Ionics 2017, 24, 169–180. [Google Scholar] [CrossRef]
- Johan, M.R.; Han, T.K.; Arof, A.K. Growth and sintering effects of hydrated polycrystalline Li2WO4. Ionics 2010, 16, 323–333. [Google Scholar] [CrossRef]
- Luz Lima, C.; Saraiva, G.D.; Freire, P.T.C.; Maczka, M.; Paraguassu, W.; de Sousa, F.F.; Filho, J.M. Temperature-induced phase transformations in Na2WO4 and Na2MoO4 crystals. Raman Spectrosc. 2011, 42, 799–802. [Google Scholar] [CrossRef]
- Zhou, D.; Randall, C.A.; Pang, L.-X.; Wang, H.; Guo, J.; Zhang, G.-Q.; Wu, X.-G.; Shui, L.; Yao, X. Microwave Dielectric Properties of Li2WO4 Ceramic with Ultra-Low Sintering Temperature. J. Am. Ceram. Soc. 2011, 94, 348–350. [Google Scholar] [CrossRef]
- Bárbara, F.; Joséa, E. Antiferromagnetic and Ferroelectric Phase Transitions and Instabilities in PFW-PT Multiferroic Solid Solution Characterized by Anelastic Measurement. Ferroelectrics 2013, 448, 86–95. [Google Scholar]
- Urusova, M.A.; Valyashko, V.M. High-temperature equilibria and critical phenomena in the Na2CO3-NaCl-H2O and Na2CO3-Na2WO4-H2O systems. Russ. J. Inorg. Chem. 2011, 56, 430–441. [Google Scholar] [CrossRef]
- Krimi, M.; Karoui, K.; Sunol, J.J.; Rhaiem, A.B. Phase transition, impedance spectroscopy and conduction mechanism of Li0.5Na1.5WO4 material. Phys. E Low-Dimens. Syst. Nanostruct. 2018, 102, 137–145. [Google Scholar] [CrossRef]
- Krimi, M.; Karoui, K.; Suñol, J.J.; Rhaiem, A.B. Optical and electrical properties of Li2WO4 compound. Phase Trans. 2019, 92, 737–754. [Google Scholar] [CrossRef]
- Mallah, A.; Al-Thuwayb, F.; Khitouni, M.; Alsawi, A.; Suñol, J.J.; Greneche, J.-M.; Almoneef, M.M. Synthesis, Structural and Magnetic Characterization of Superparamagnetic Ni0.3Zn0.7Cr2−xFexO4 Oxides Obtained by Sol-Gel Method. Crystals 2023, 13, 894. [Google Scholar] [CrossRef]
- Warren, B.E. X-ray Diffraction; Dover: New York, NY, USA, 1990; pp. 251–275. [Google Scholar]
- Williamson, G.K.; Hall, W.H. X-ray line broadening from filed aluminium and wolfram. Acta Metall. 1953, 1, 22–31. [Google Scholar] [CrossRef]
- Kuschke, W.M.; Keller, R.M.; Grahle, P.; Mason, R.; Arzt, E. Mechanisms of Powder Milling Investigated by X-ray Diffraction and Quantitative Metallography. Z. Metallkd. 1995, 86, 804–813. [Google Scholar] [CrossRef]
- Aleksandrov, I.V.; Valiev, R.Z. Studies of Nanocrystalline Materials by X-ray Diffraction Techniques. Phys. Met. Metallogr. 1994, 77, 623–629. [Google Scholar]
- Halder, N.C.; Wagner, C.N. Analysis of the Broadening of Powder Pattern Peaks Using Variance, Integral Breadth, and Fourier Coefficients of the Line Profile. Adv. X-ray Anal. 1966, 9, 91–102. [Google Scholar]
- Daly, R.; Khitouni, M.; Kolsi, A.W.; Njah, N. The studies of crystallite size and microstrains in aluminum powder prepared by mechanical milling. Phys. Stat. Solidi C 2006, 3, 3325–3331. [Google Scholar] [CrossRef]
- Khitouni, M.; Kolsi, A.W.; Njah, N. The effects of boron additions on the disordering and crystallite refinement of NI3AI powders during mechanical milling. Ann. Chim. Sci. Matériaux 2003, 28, 17–29. [Google Scholar] [CrossRef]
- Barhoumi, A.; Leroy, G.; Duponchel, B.; Gest, J.; Yang, L.; Waldhoff, N.; Guermazi, S. Aluminum doped ZnO thin films deposited by direct current sputtering: Structural and optical properties. Superlattices Microstruct. 2015, 82, 483–498. [Google Scholar] [CrossRef]
- Kubelka, P.; Munk, F. An article on optics of paint layers. Z. Tech. Phys. 1931, 12, 259–274. [Google Scholar]
- Bougrine, A.; El Hichou, A.; Addou, M.; Ebothé, J.; Kachouane, A.; Troyon, M. Structural, optical and cathodoluminescence characteristics of undoped and tin-doped ZnO thin films prepared by spray pyrolysis. J. Mater. Chem. Phys. 2003, 80, 438–445. [Google Scholar] [CrossRef]
- Enneffati, M.; Maaloul, N.K.; Louati, B.; Guidara, K. Synthesis, vibrational and UV–visible studies of sodium cadmium orthophosphate. Opt. Quantum Electron. 2017, 49, 331. [Google Scholar] [CrossRef]
- Ben Nasr, W.; Karoui, K.; Bulou, A.; Ben Rhaiem, A. Li1.5Rb0.5MoO4: Ferroelectric properties and characterization of phase transitions by Raman spectroscopy. Phys. E Low-Dimens. Syst. Nanostruct. 2017, 93, 339–344. [Google Scholar] [CrossRef]
- Uchino, K.; Nomura, S. Critical Exponents of the Dielectric Constants in Diffused-Phase-Transition Crystals. Ferroelectr. Lett. Sect. 1982, 44, 55–61. [Google Scholar] [CrossRef]
- Viehland, D.; Wuttig, M.; Cross, L.E. The glassy behavior of relaxor ferroelectrics. Ferroelectrics 2011, 120, 71–77. [Google Scholar] [CrossRef]
- Tan, Y.-Q.; Yuan, Y.; Hao, Y.-M.; Dong, S.-Y.; Yang, Y.-W. Structure and dielectric properties of Ba5NdCu1.5Nb8.5O30−δ tungsten bronze ceramics. Mater. Res. Bull. 2013, 48, 1934–1938. [Google Scholar] [CrossRef]
- Rhaiem, A.; Jomni, F.; Karoui, K.; Guidara, K. Ferroelectric properties of the [N(CH3)4]2CoCl2Br2 compound. J. Mol. Struct. 2013, 1035, 140–144. [Google Scholar] [CrossRef]
- Hajji, R.; Oueslati, A.; Hajlaoui, F.; Bulou, A.; Hlel, F. Structural characterization, thermal, ac conductivity and dielectric properties of (C7H12N2)2[SnCl6]Cl2·1.5H2O. Phase Trans. 2016, 89, 523–542. [Google Scholar] [CrossRef]
- Long, A.R. Frequency-Dependent Loss in Amorphous Semiconductors. J. Adv. Phys. 1982, 31, 553–637. [Google Scholar] [CrossRef]
Disclaimer/Publisher’s Note: The statements, opinions and data contained in all publications are solely those of the individual author(s) and contributor(s) and not of MDPI and/or the editor(s). MDPI and/or the editor(s) disclaim responsibility for any injury to people or property resulting from any ideas, methods, instructions or products referred to in the content. |
© 2023 by the authors. Licensee MDPI, Basel, Switzerland. This article is an open access article distributed under the terms and conditions of the Creative Commons Attribution (CC BY) license (https://creativecommons.org/licenses/by/4.0/).

