
Self-Assembly and Conformational Change in the Oligomeric Structure of the Ectodomain of the TBEV E Protein Studied via X-ray, Small-Angle X-ray Scattering, and Molecular Dynamics

 , and
, and
Abstract
:1. Introduction
2. Materials and Methods
2.1. E Protein Ectodomain Isolation and Purification, Crystallization, and Structure Refinement
2.2. SAXS
2.3. Molecular Modeling
3. Results and Discussion
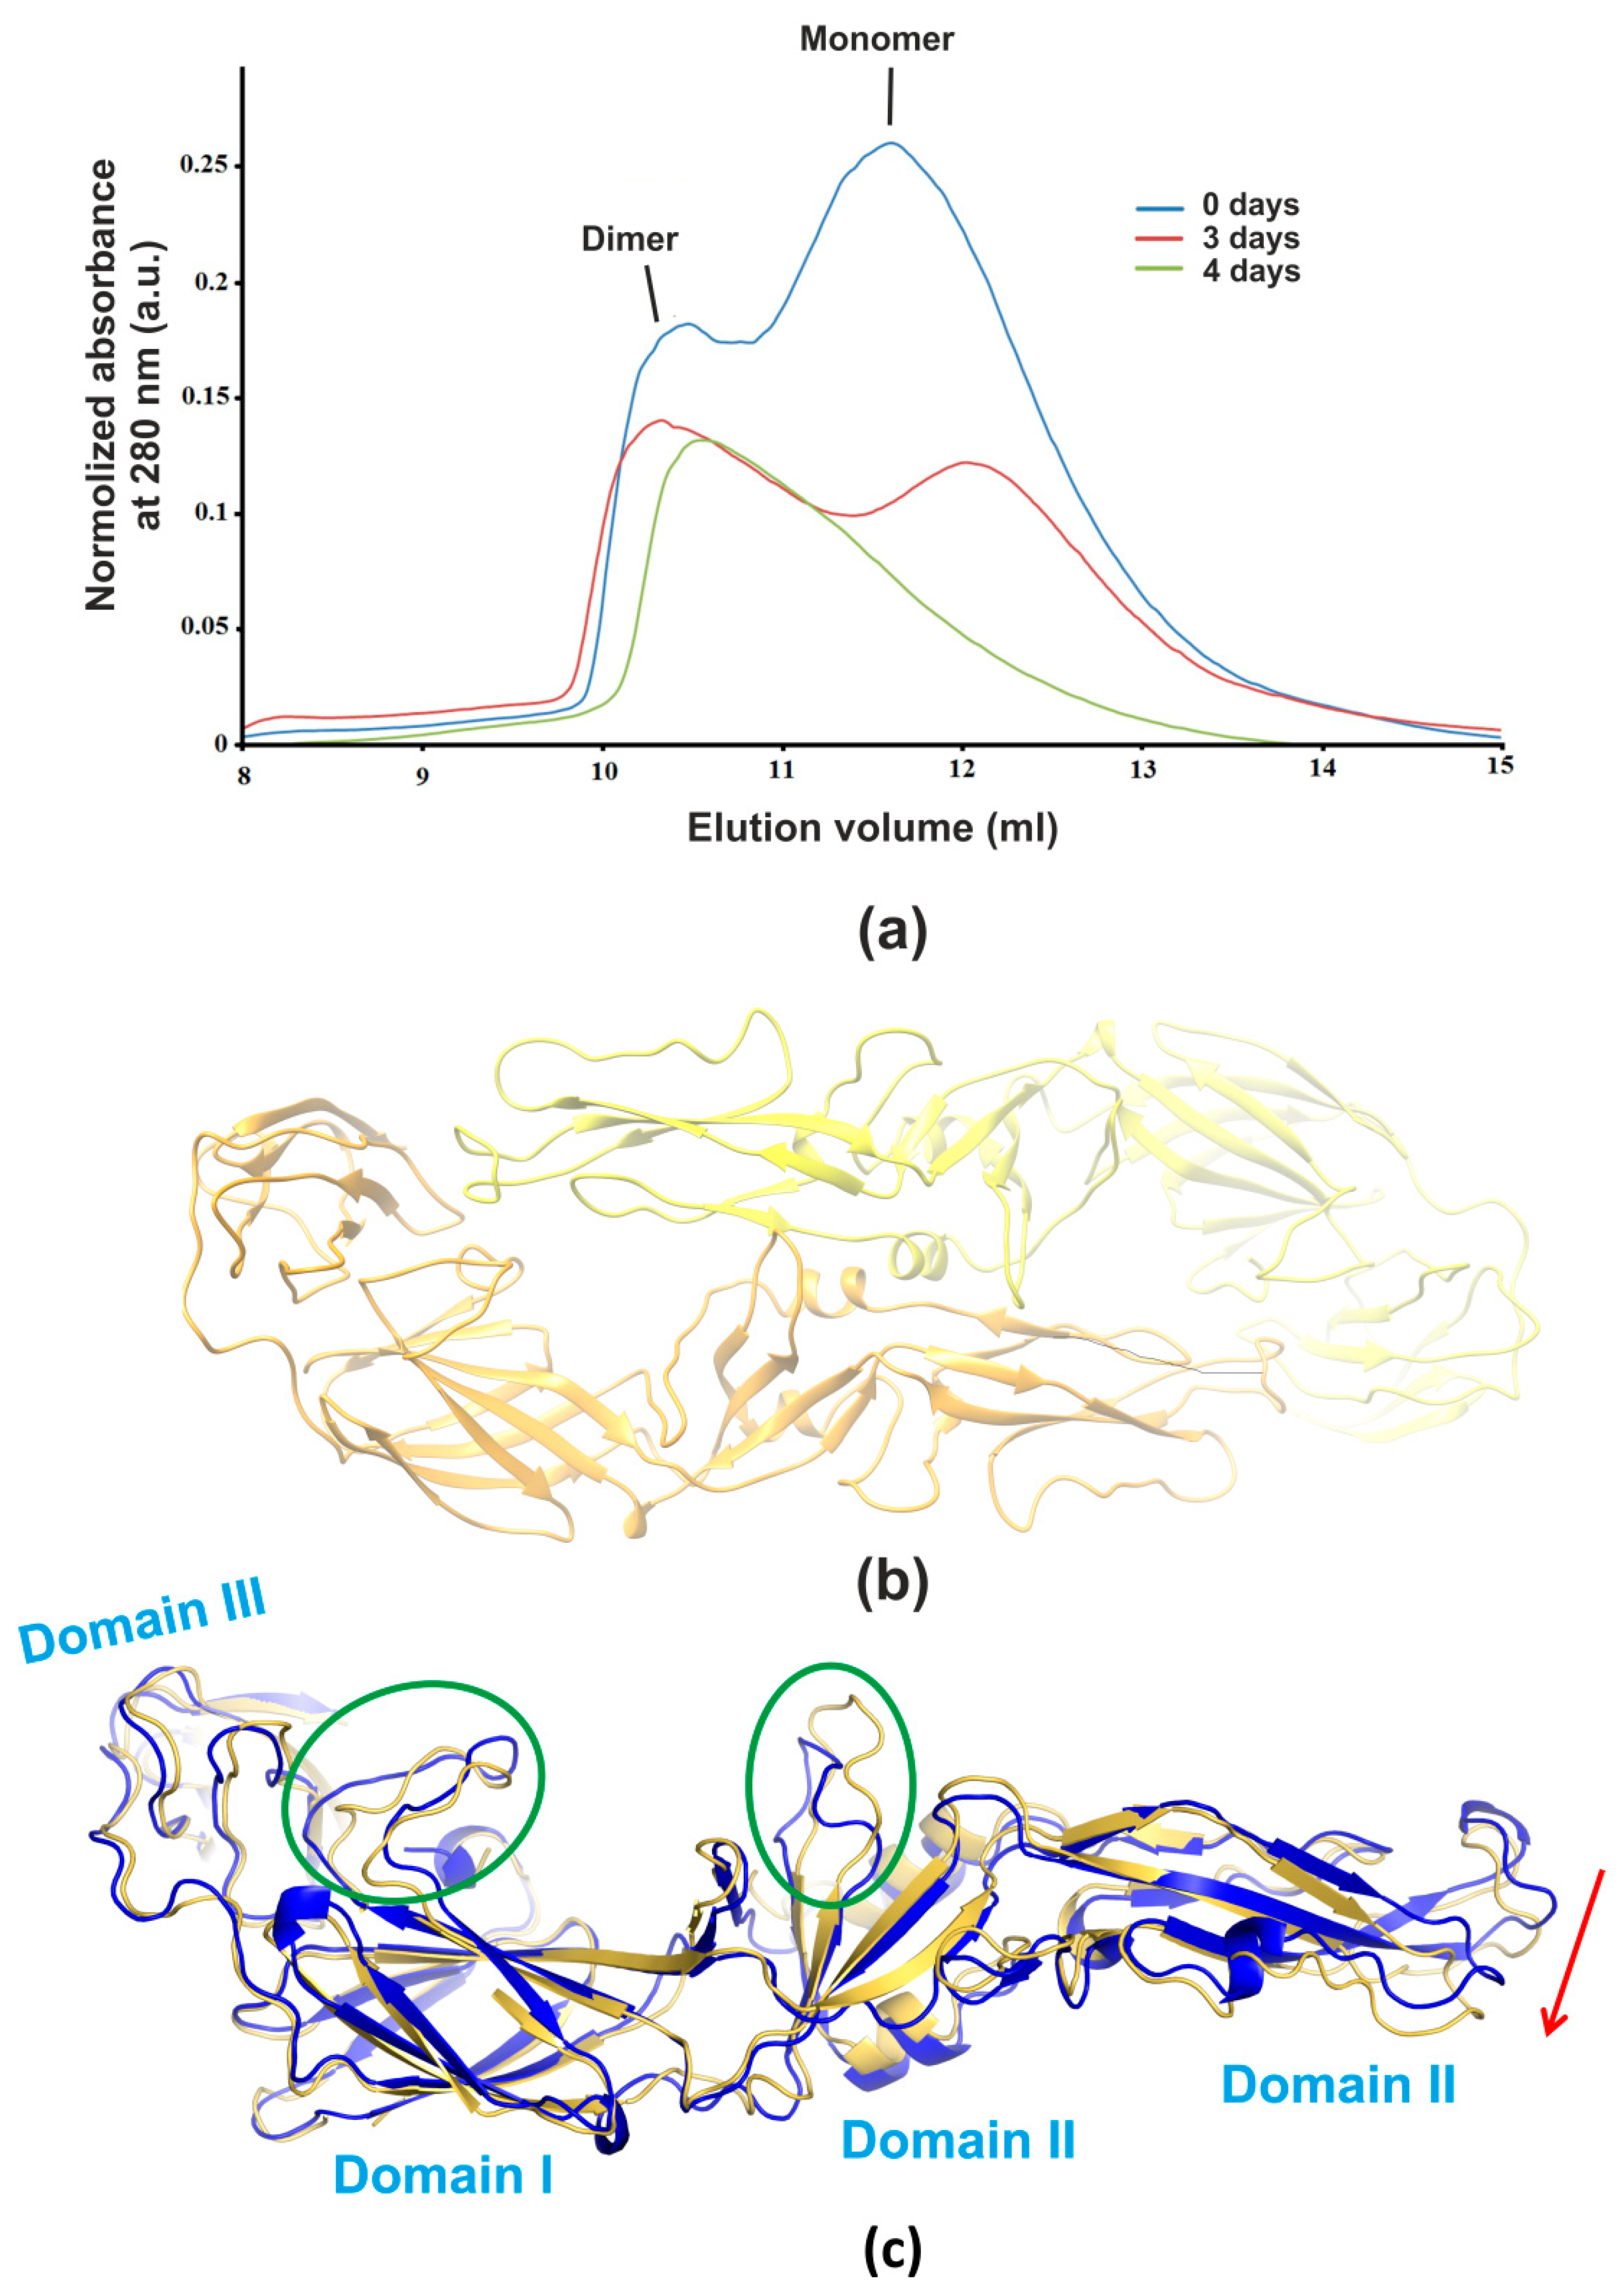
3.1. Size-Exclusion Chromatography
3.2. X-ray Analysis
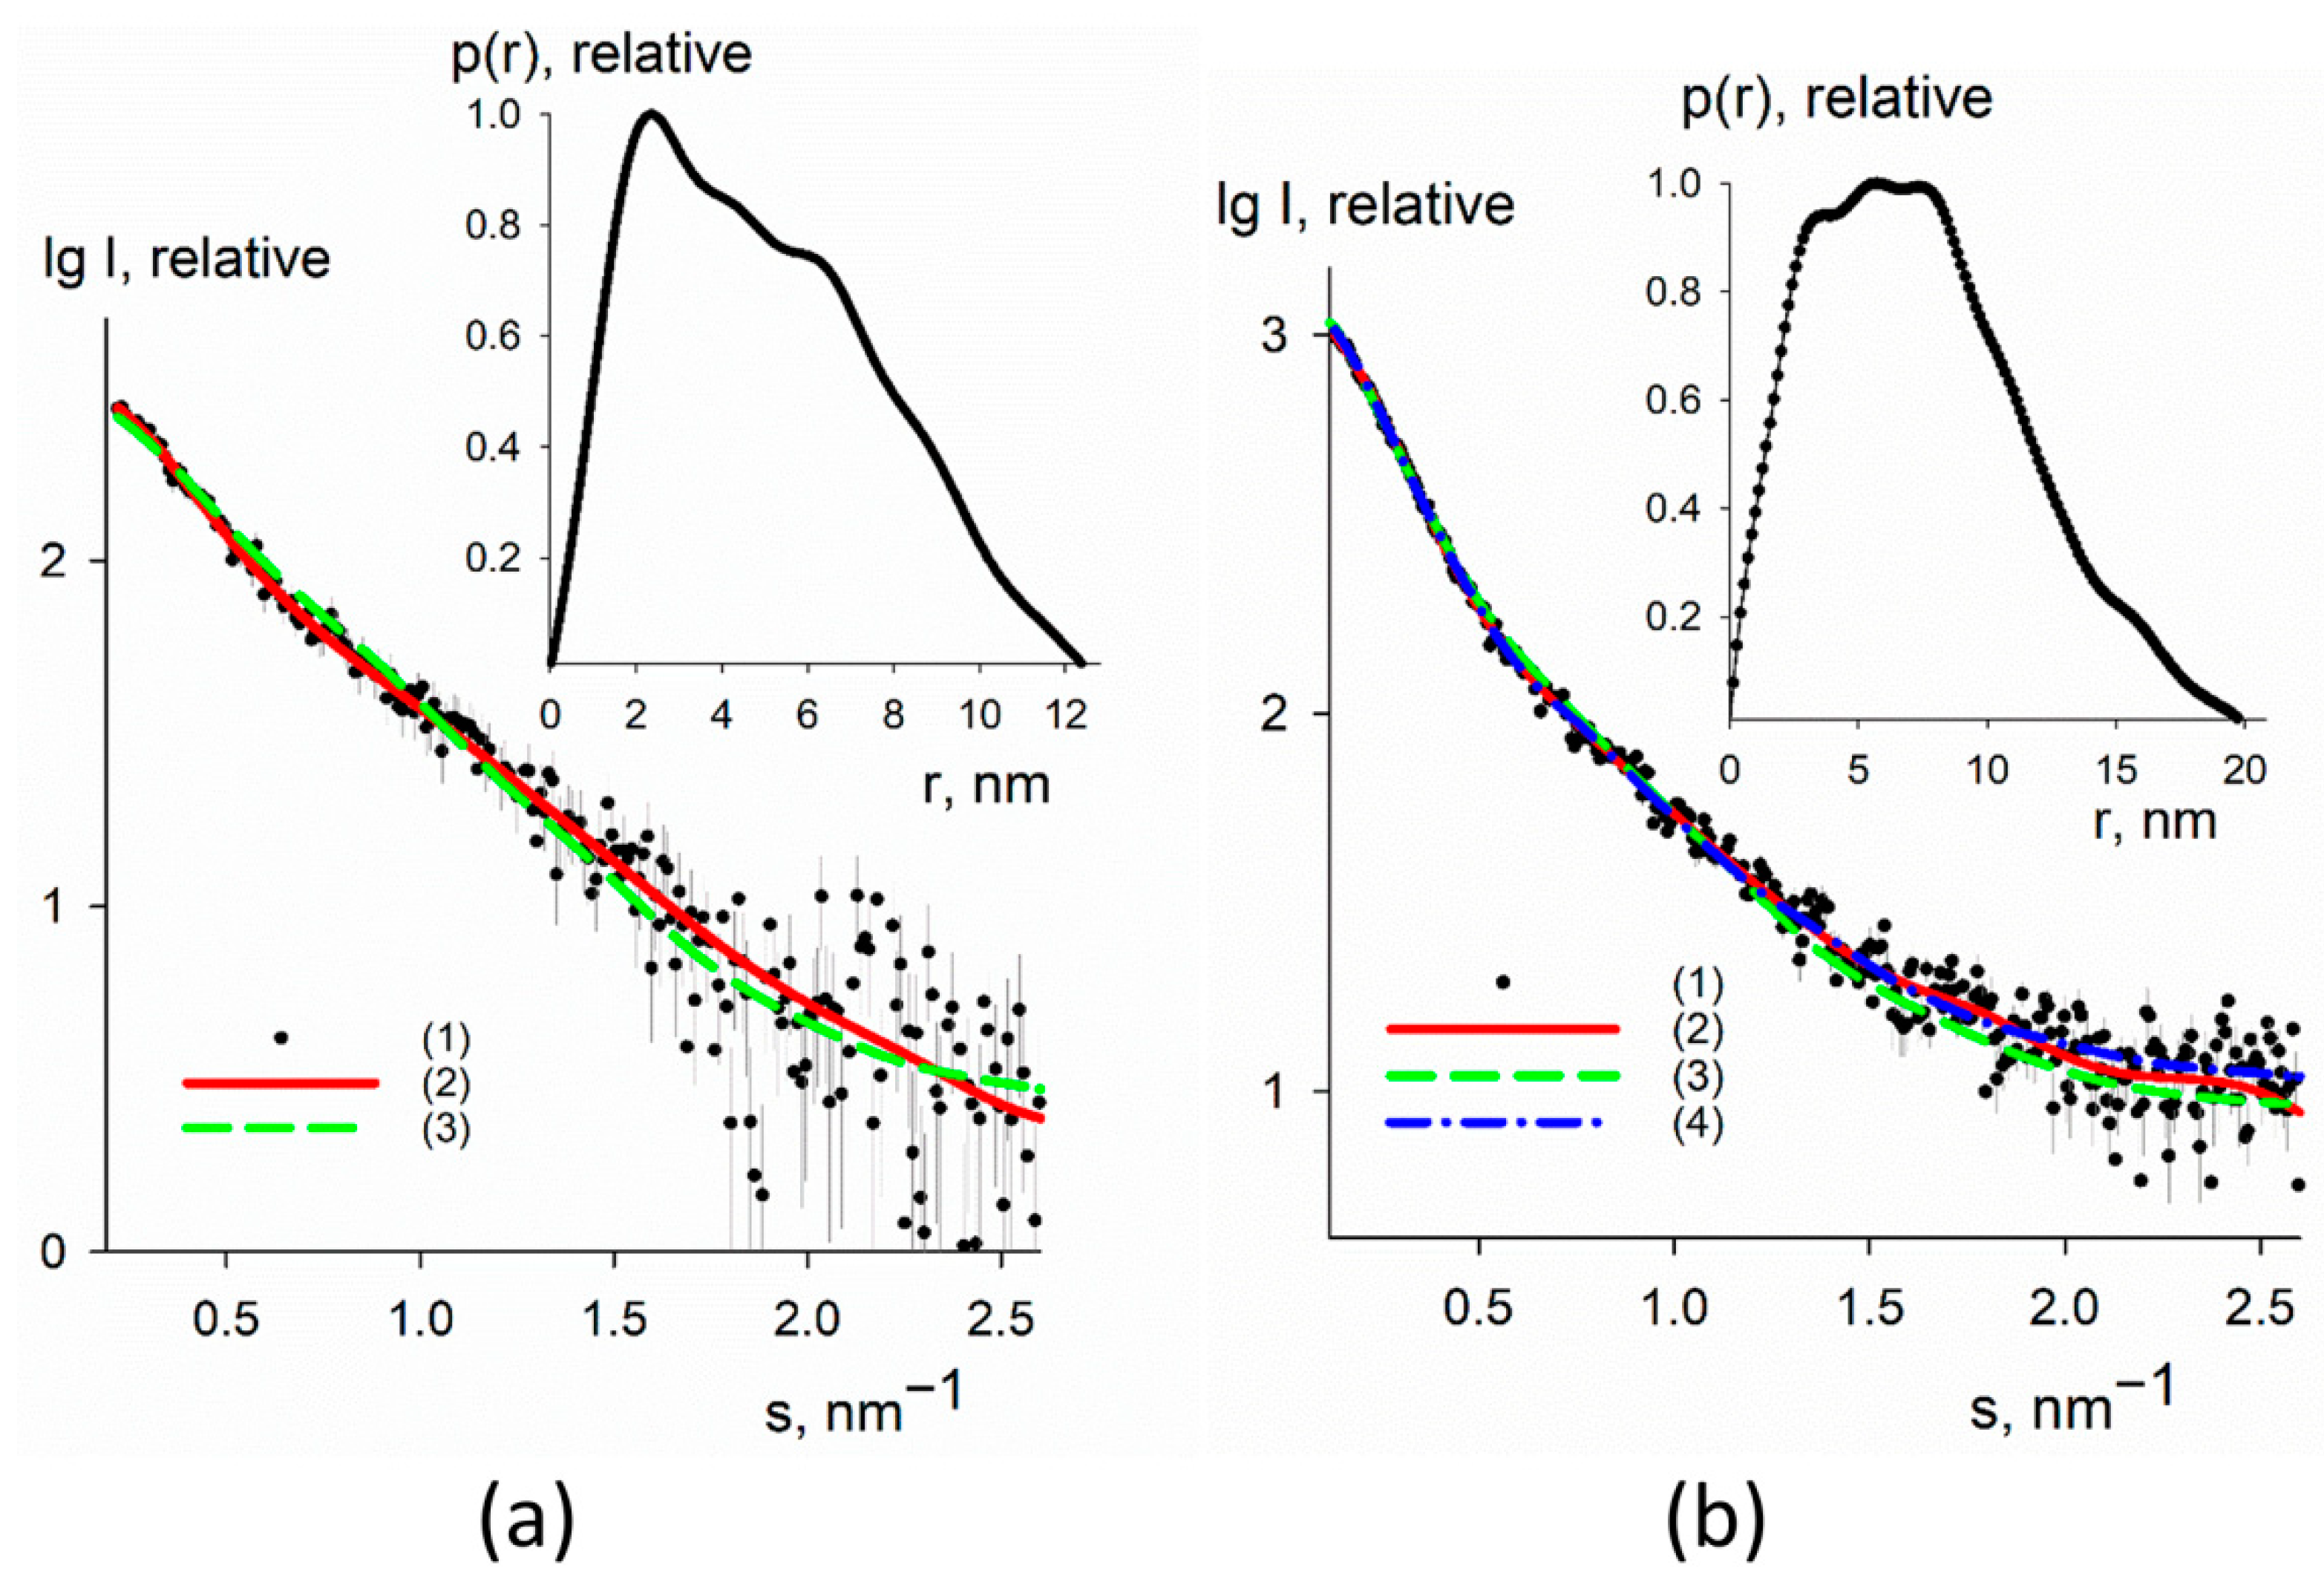
3.3. SAXS
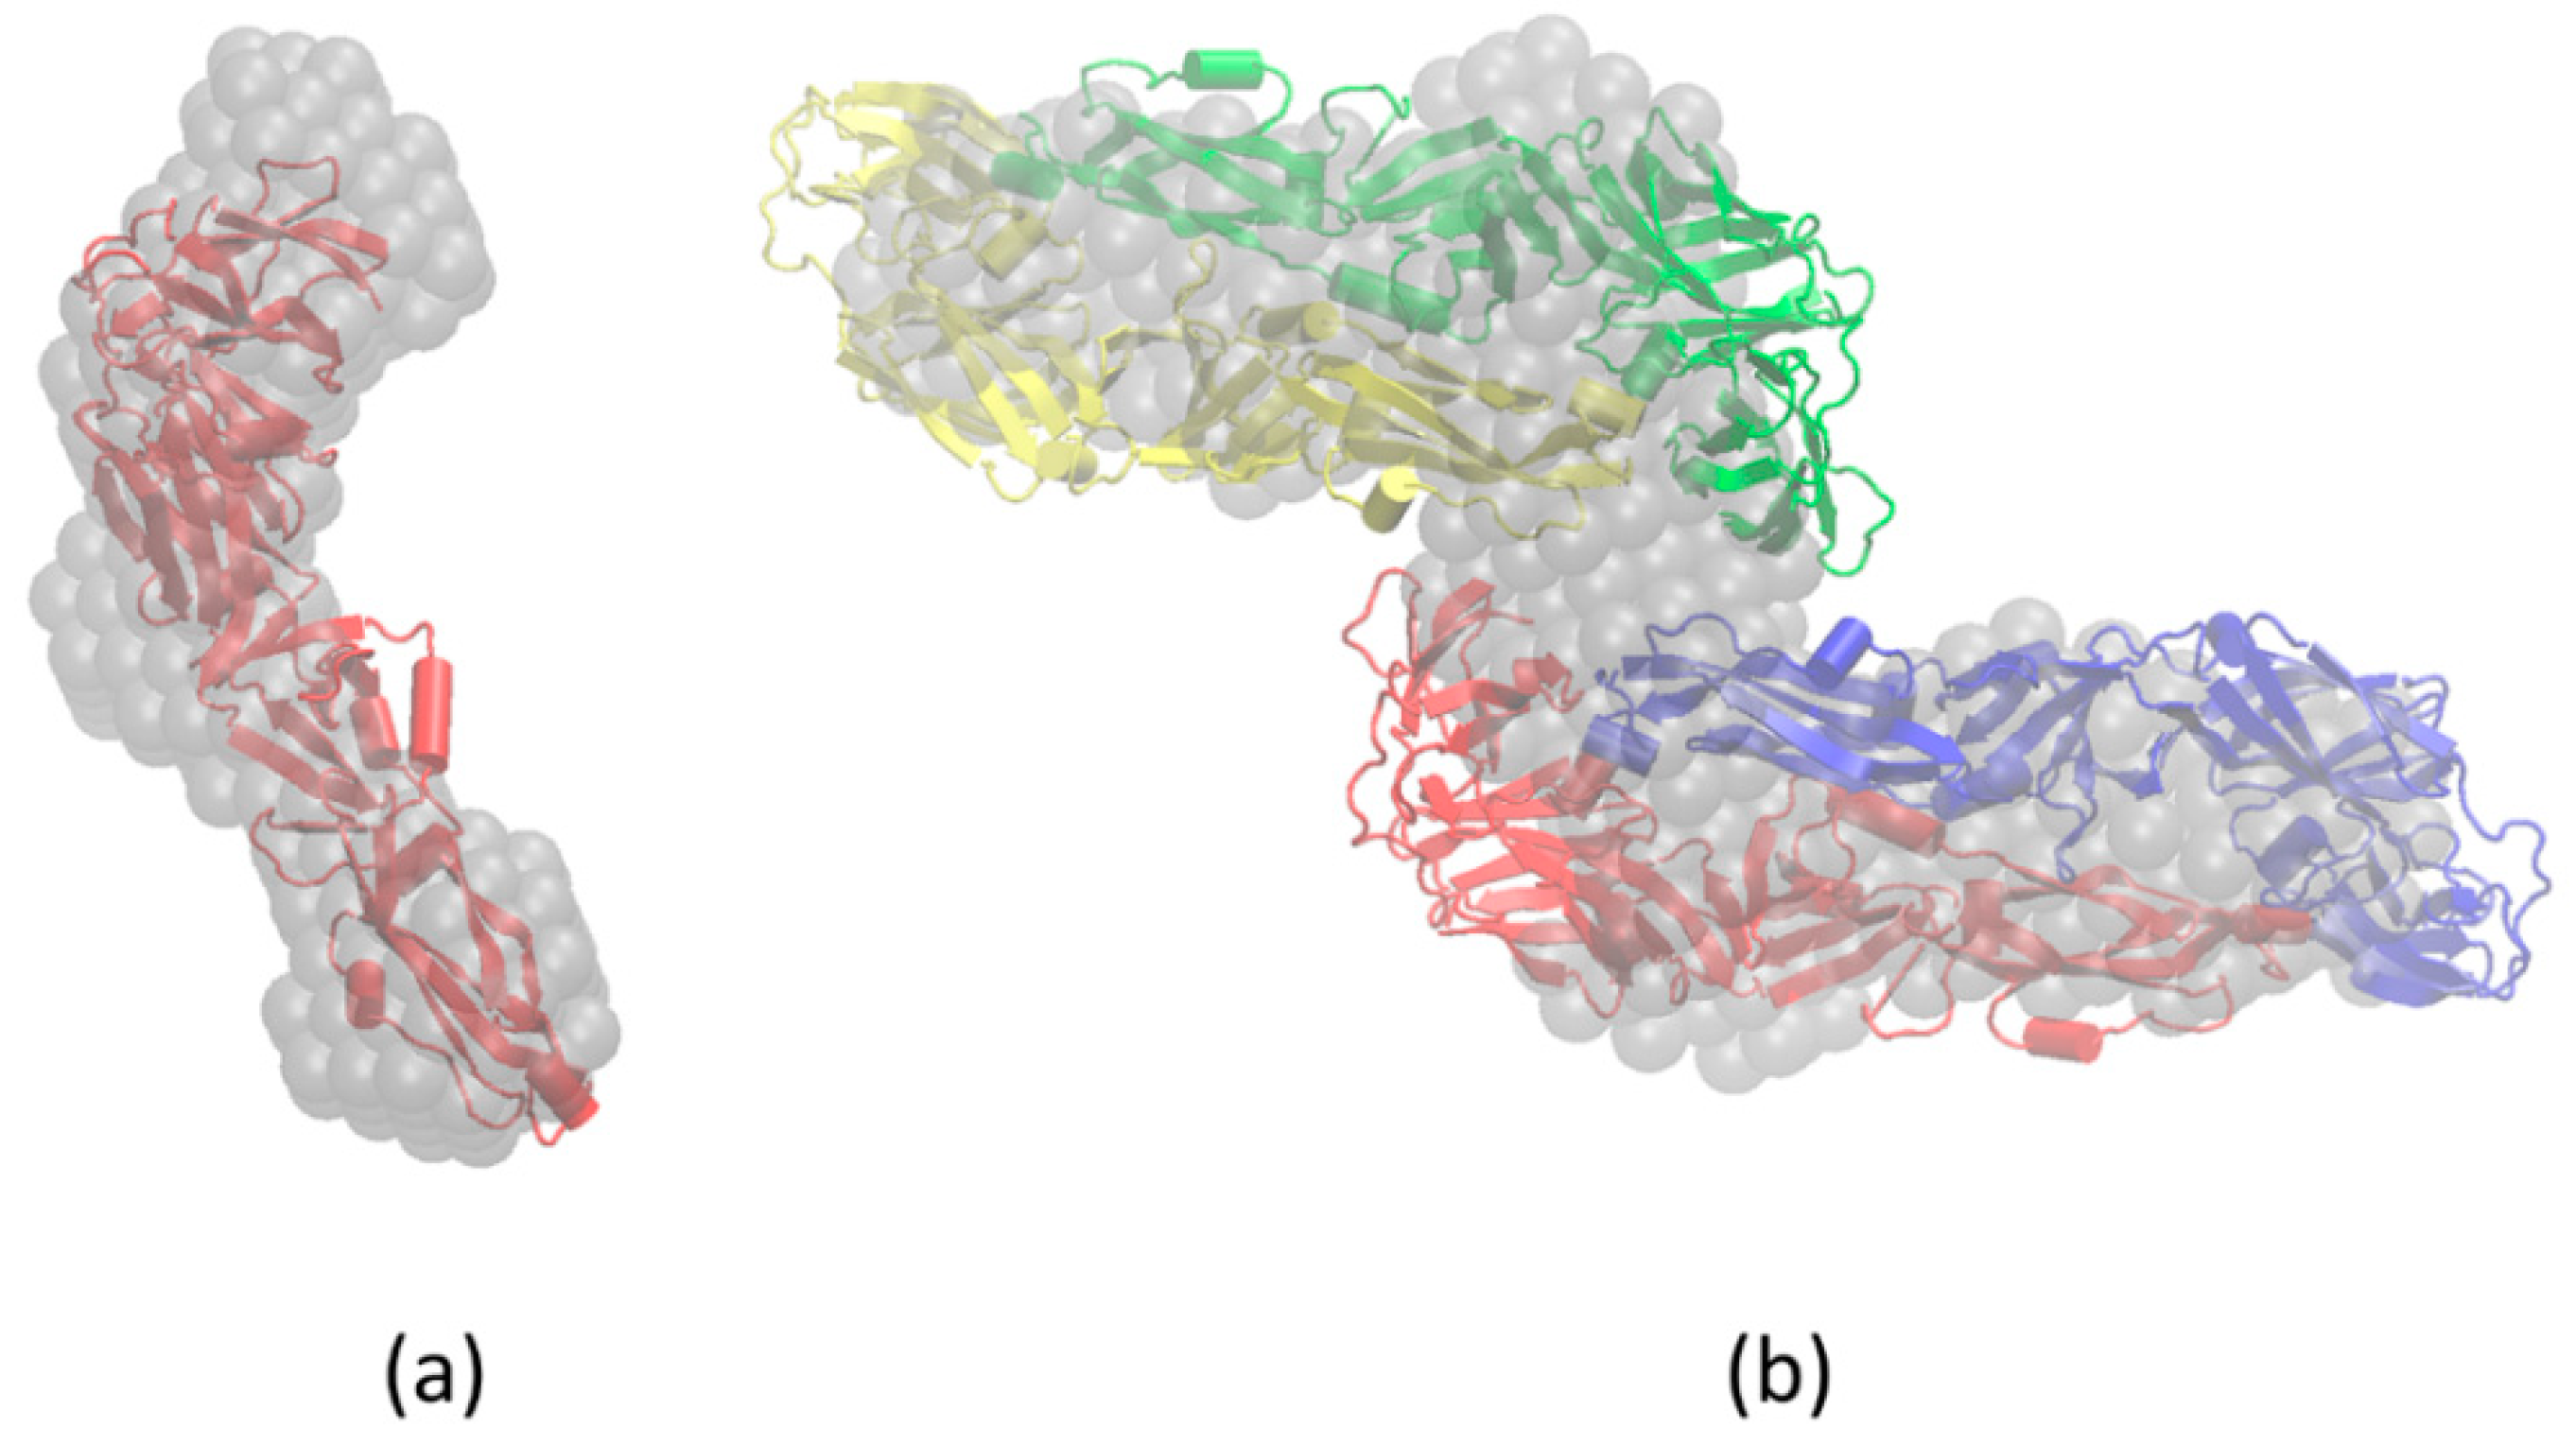
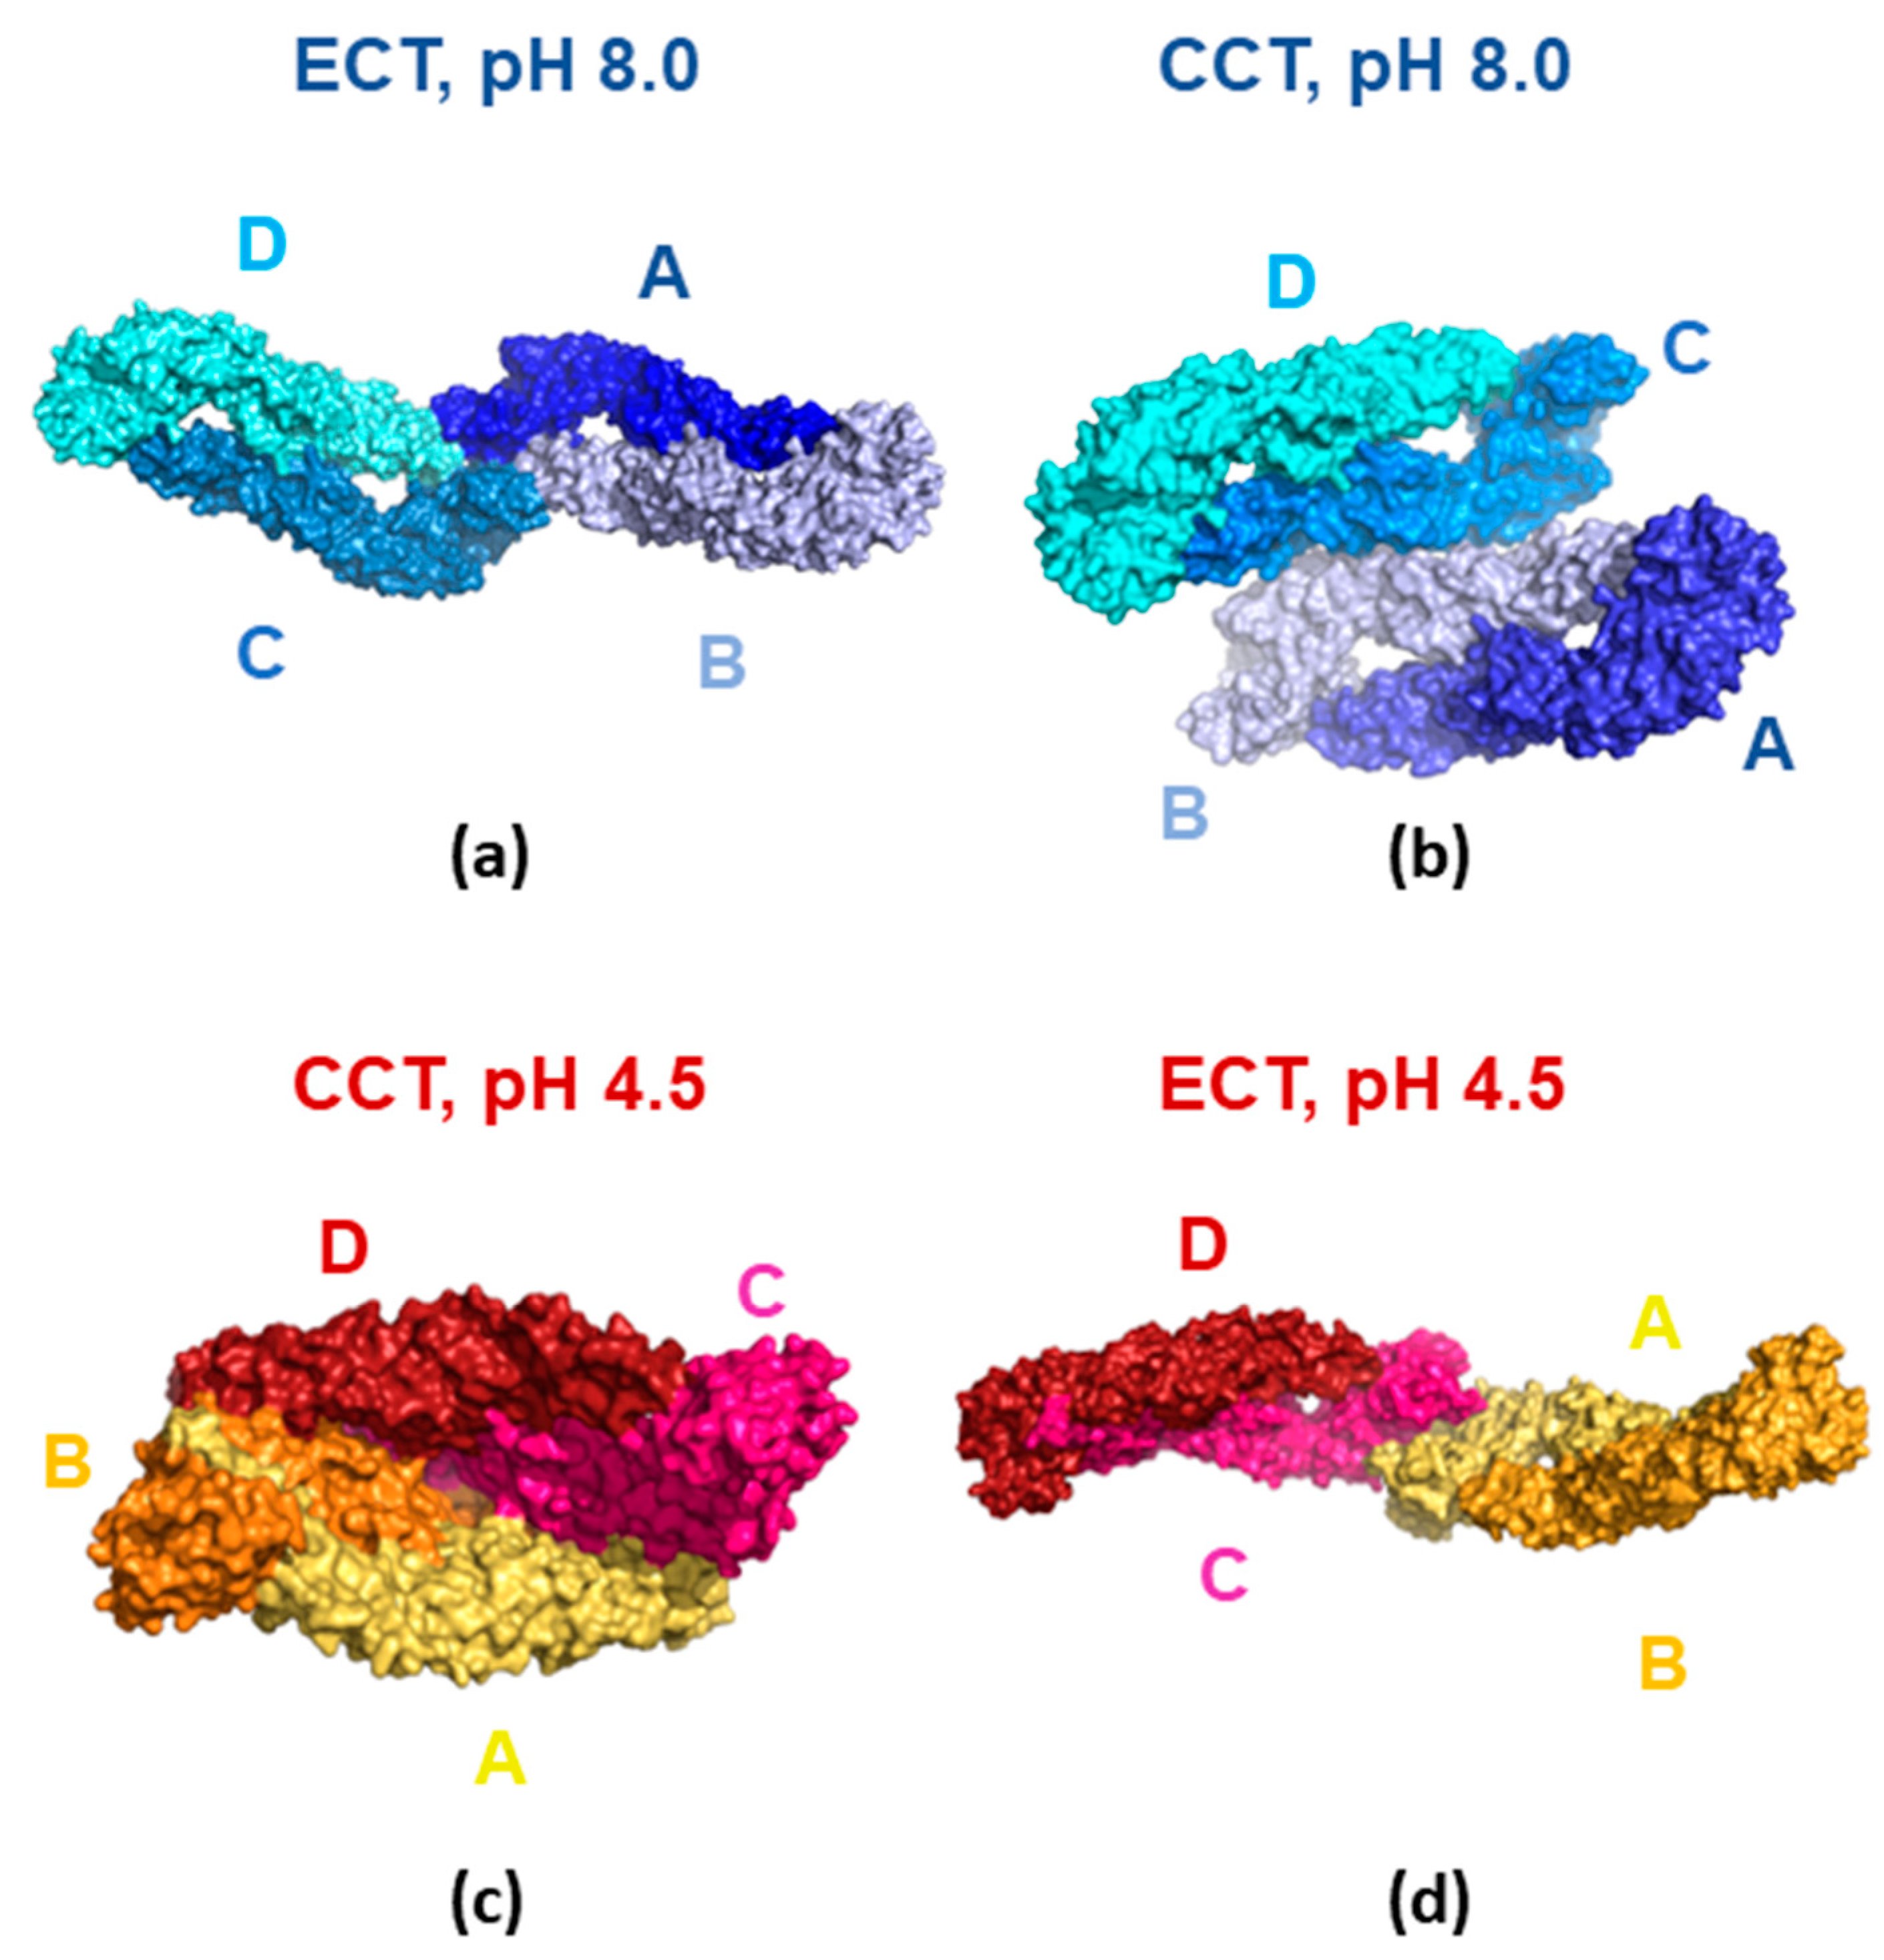
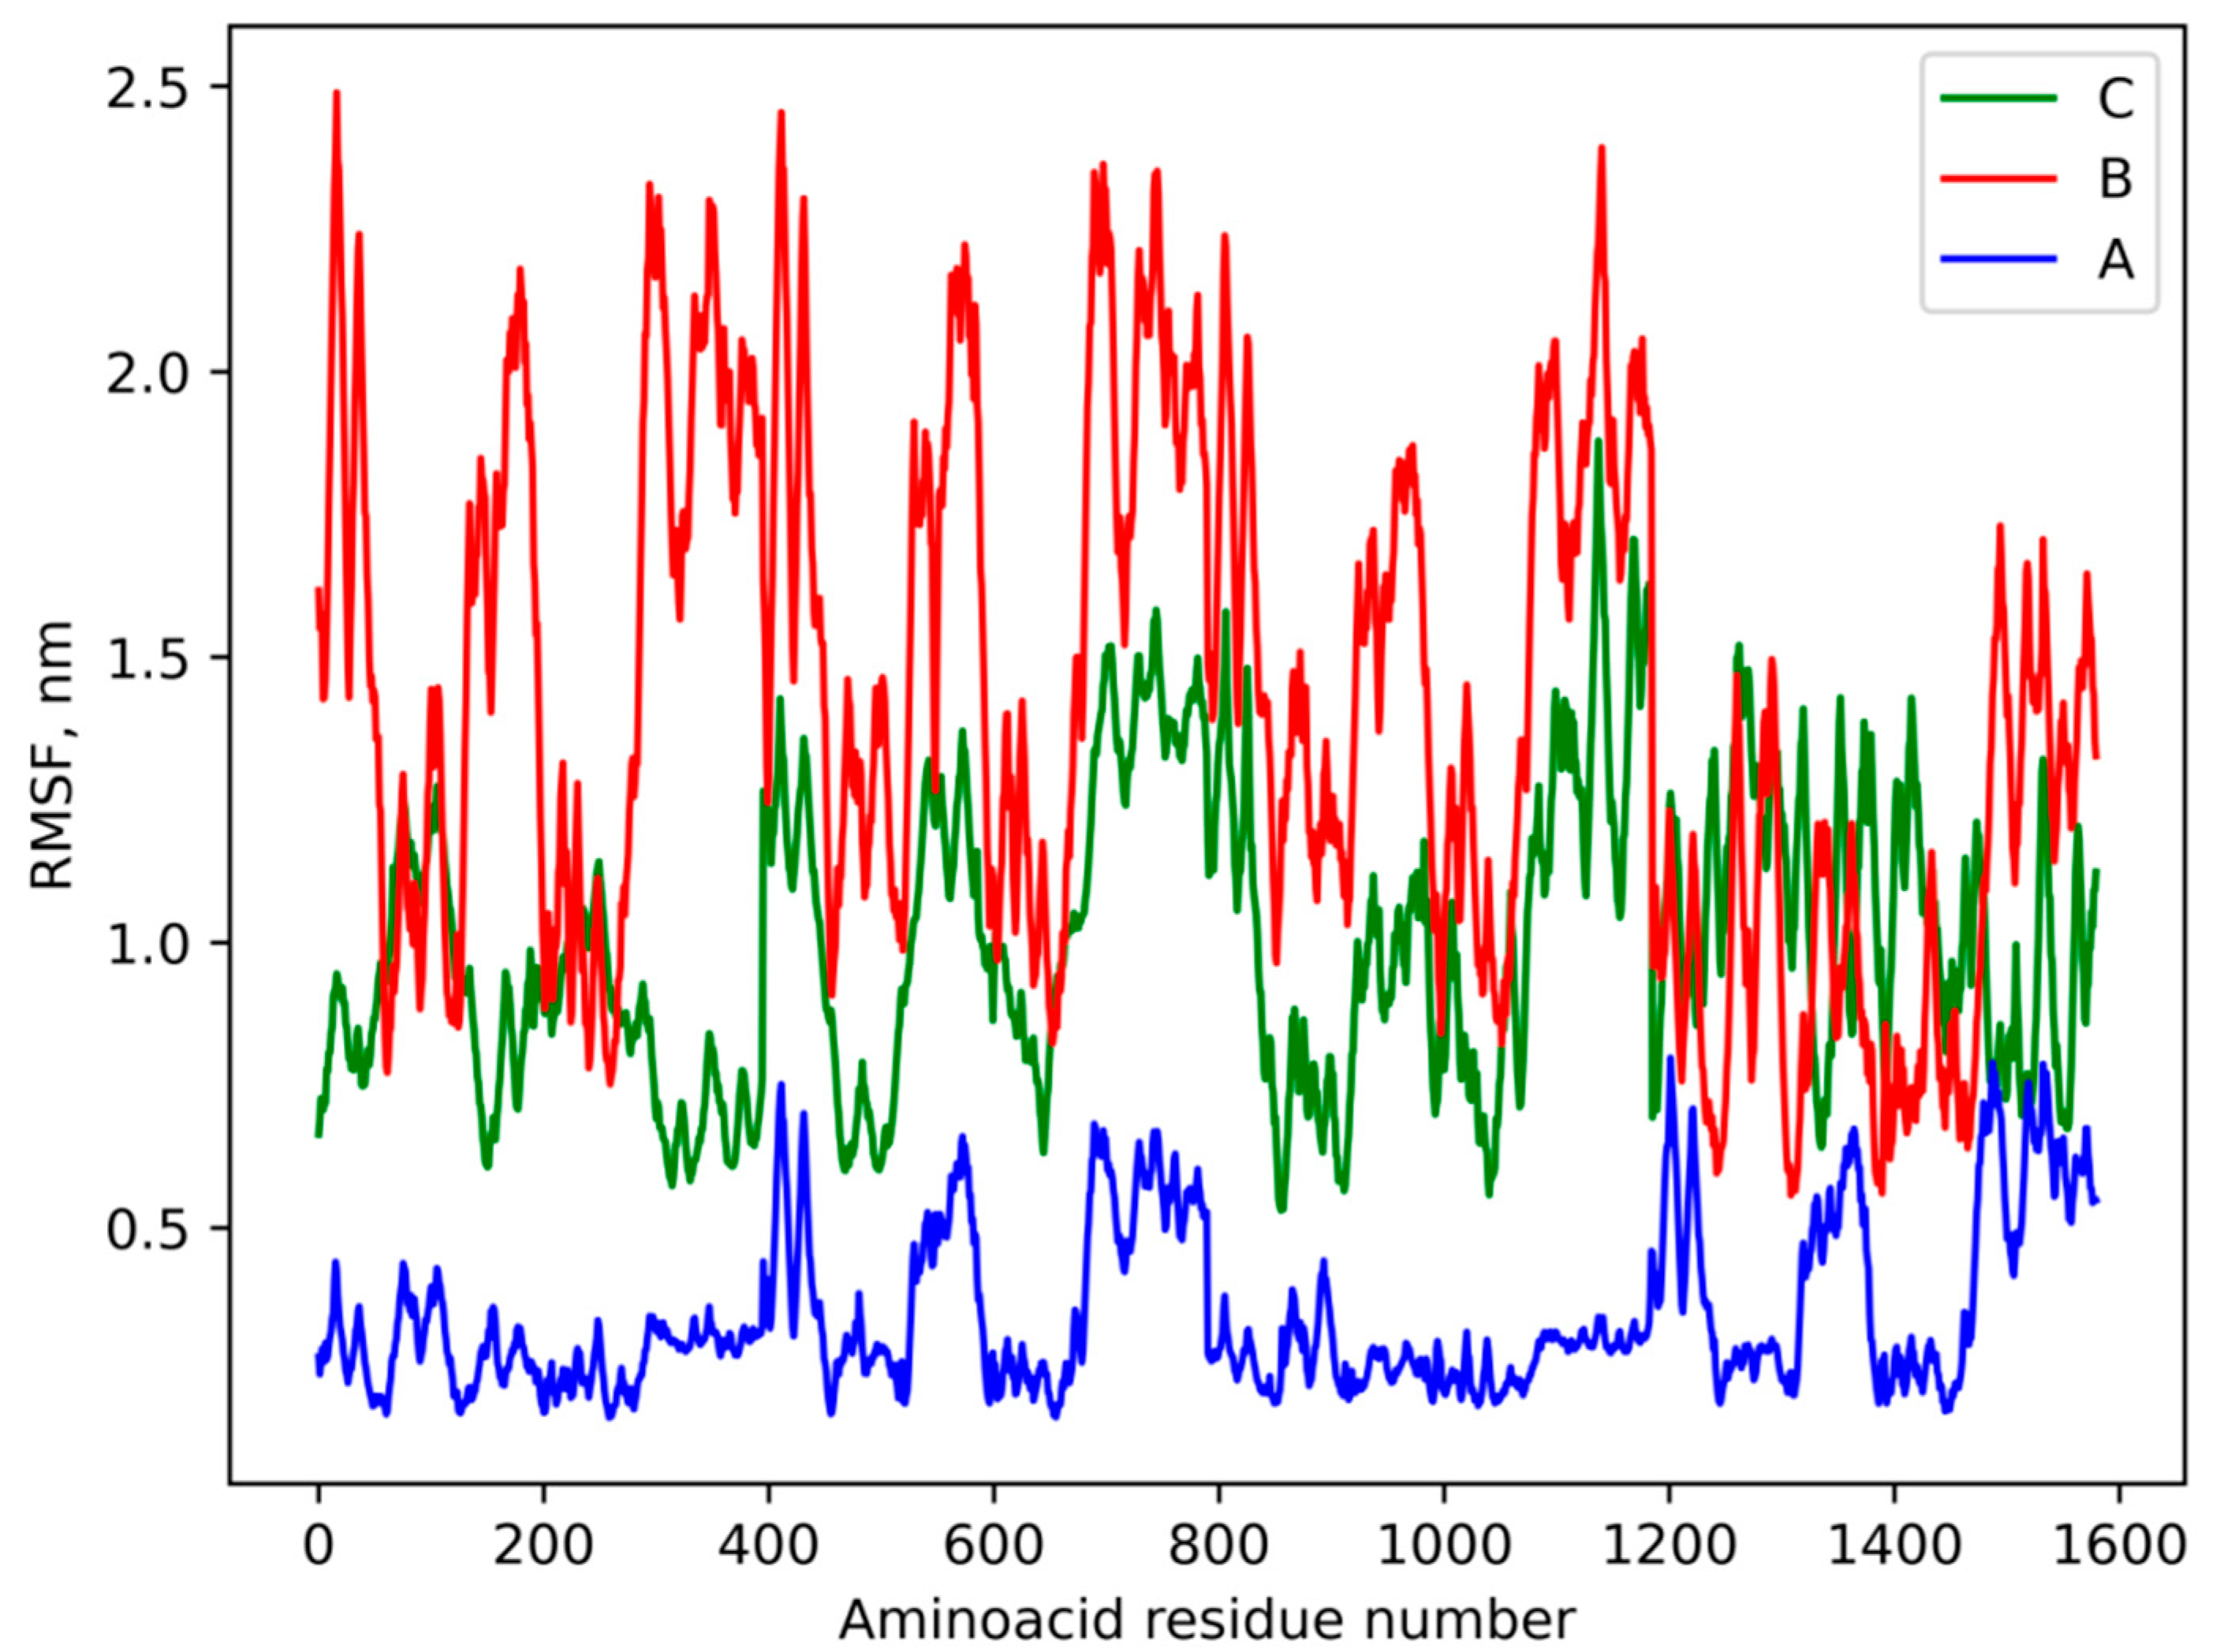
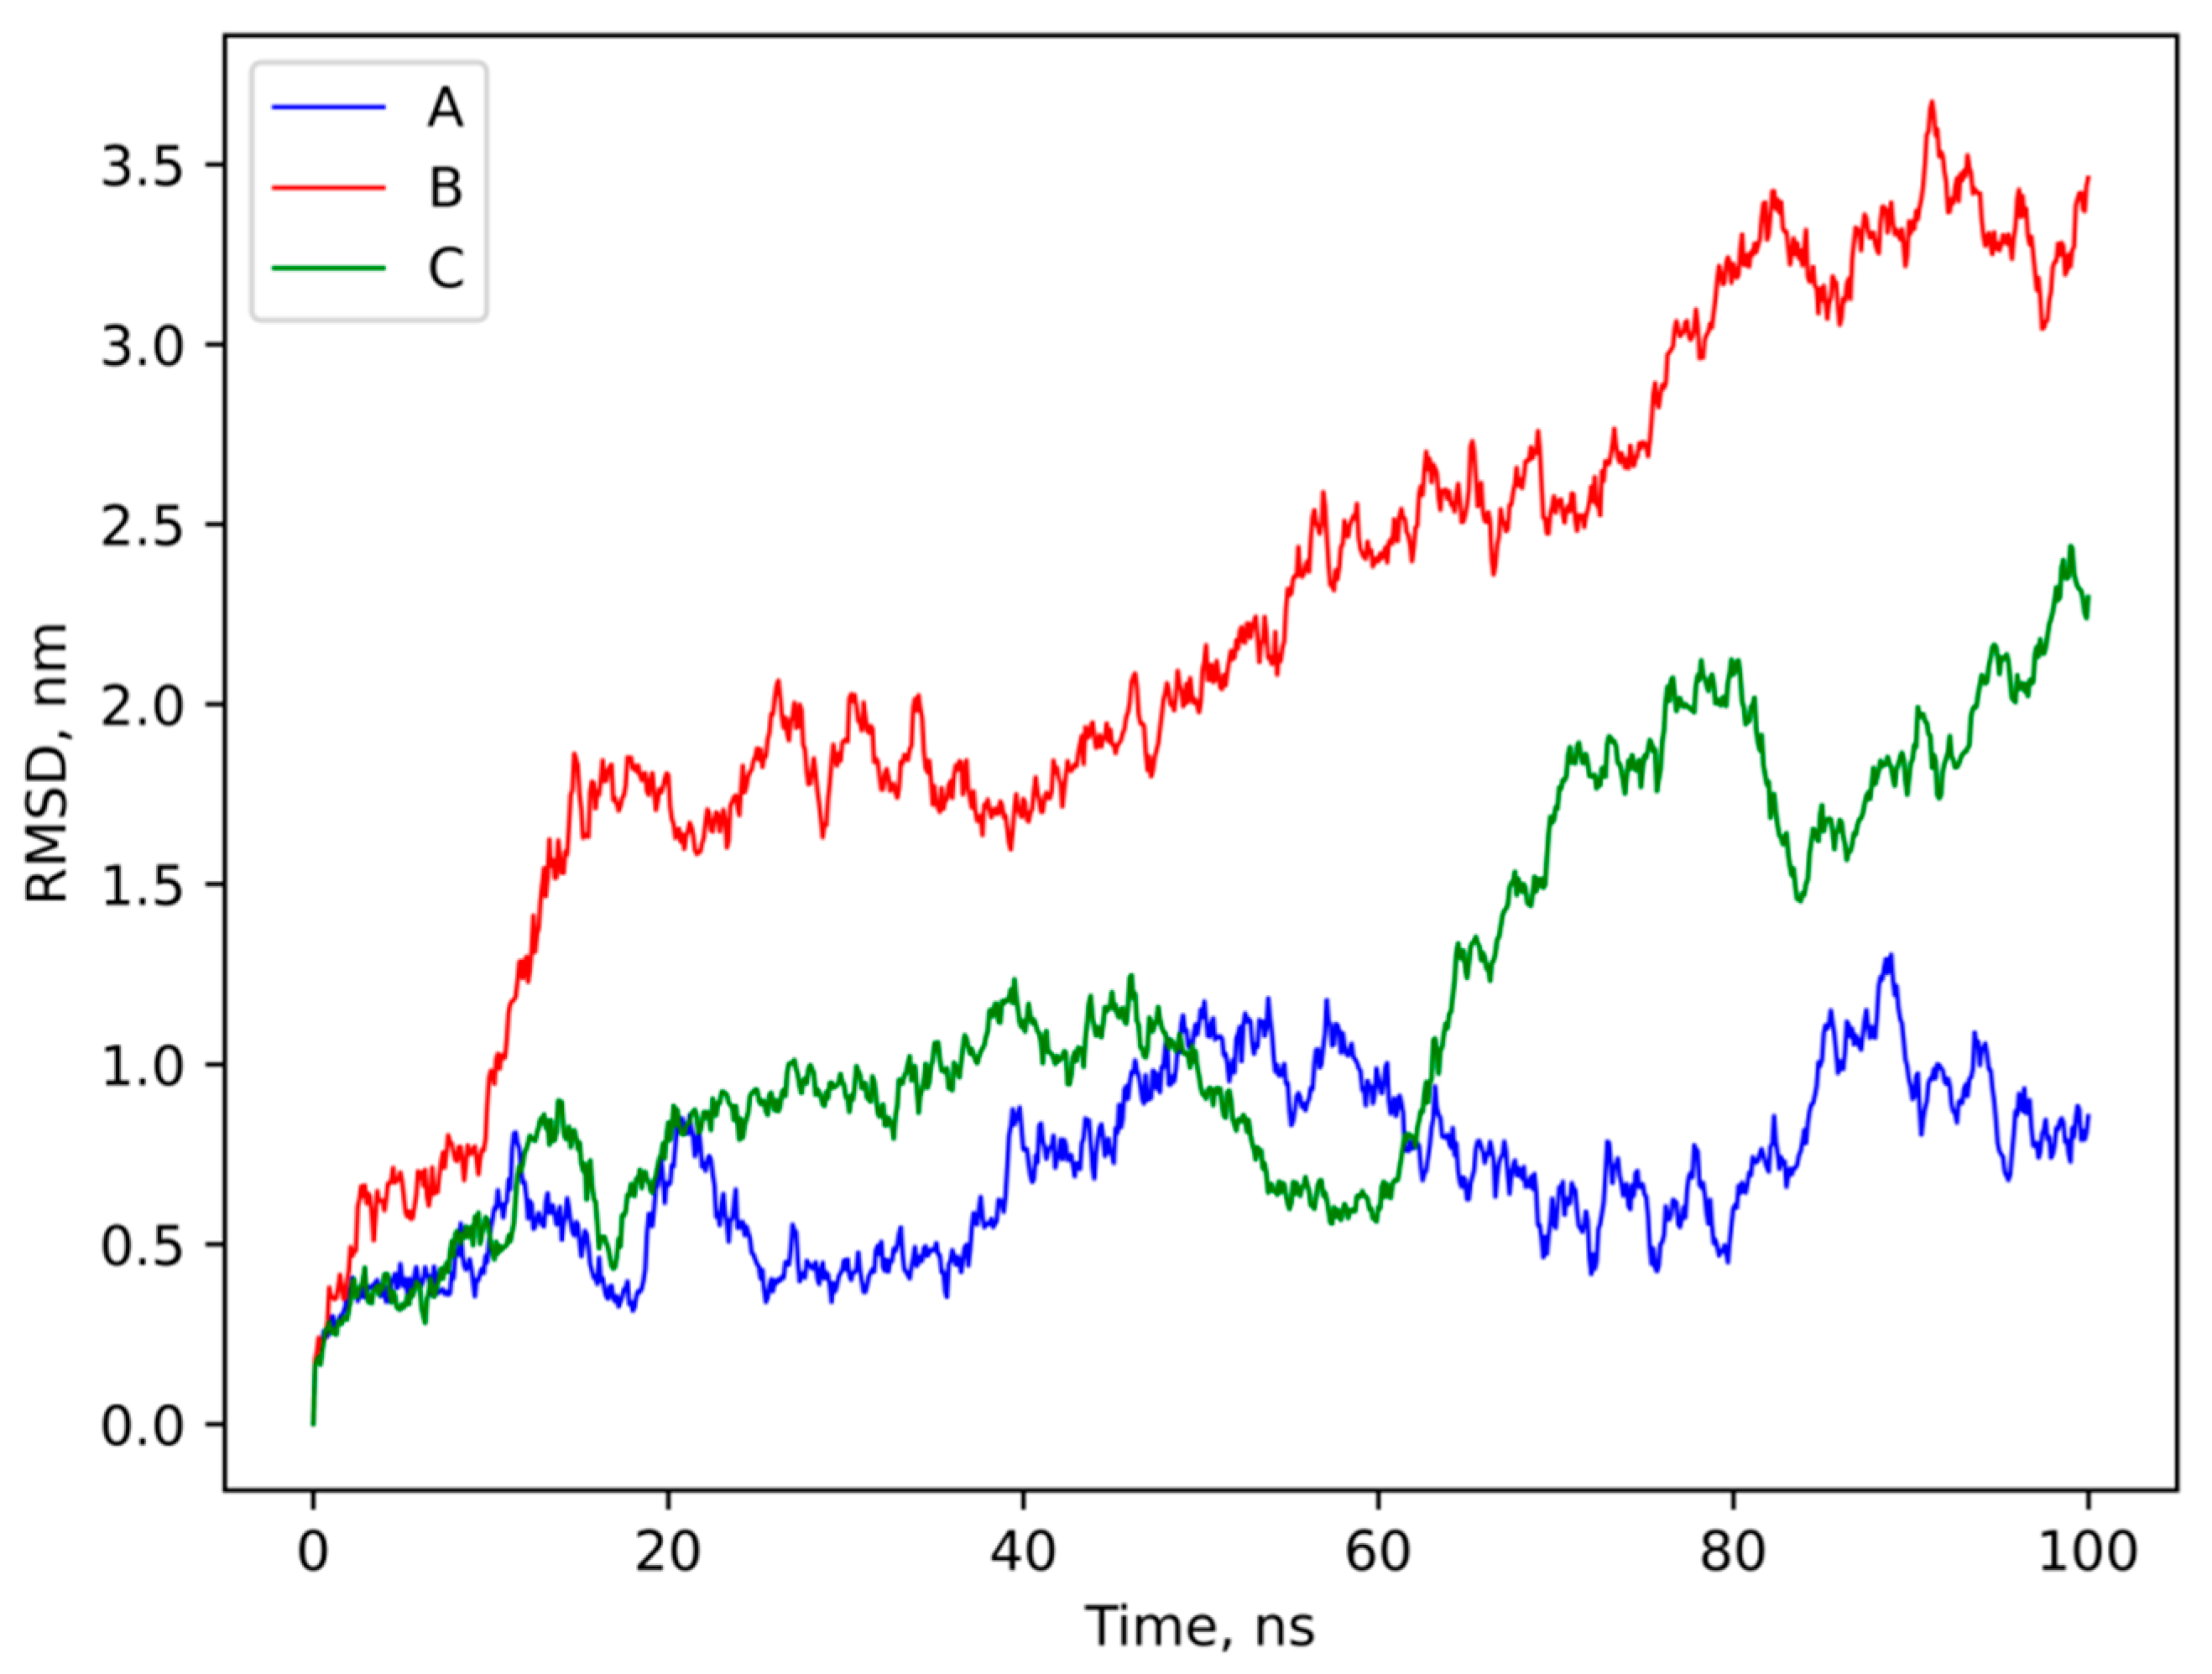
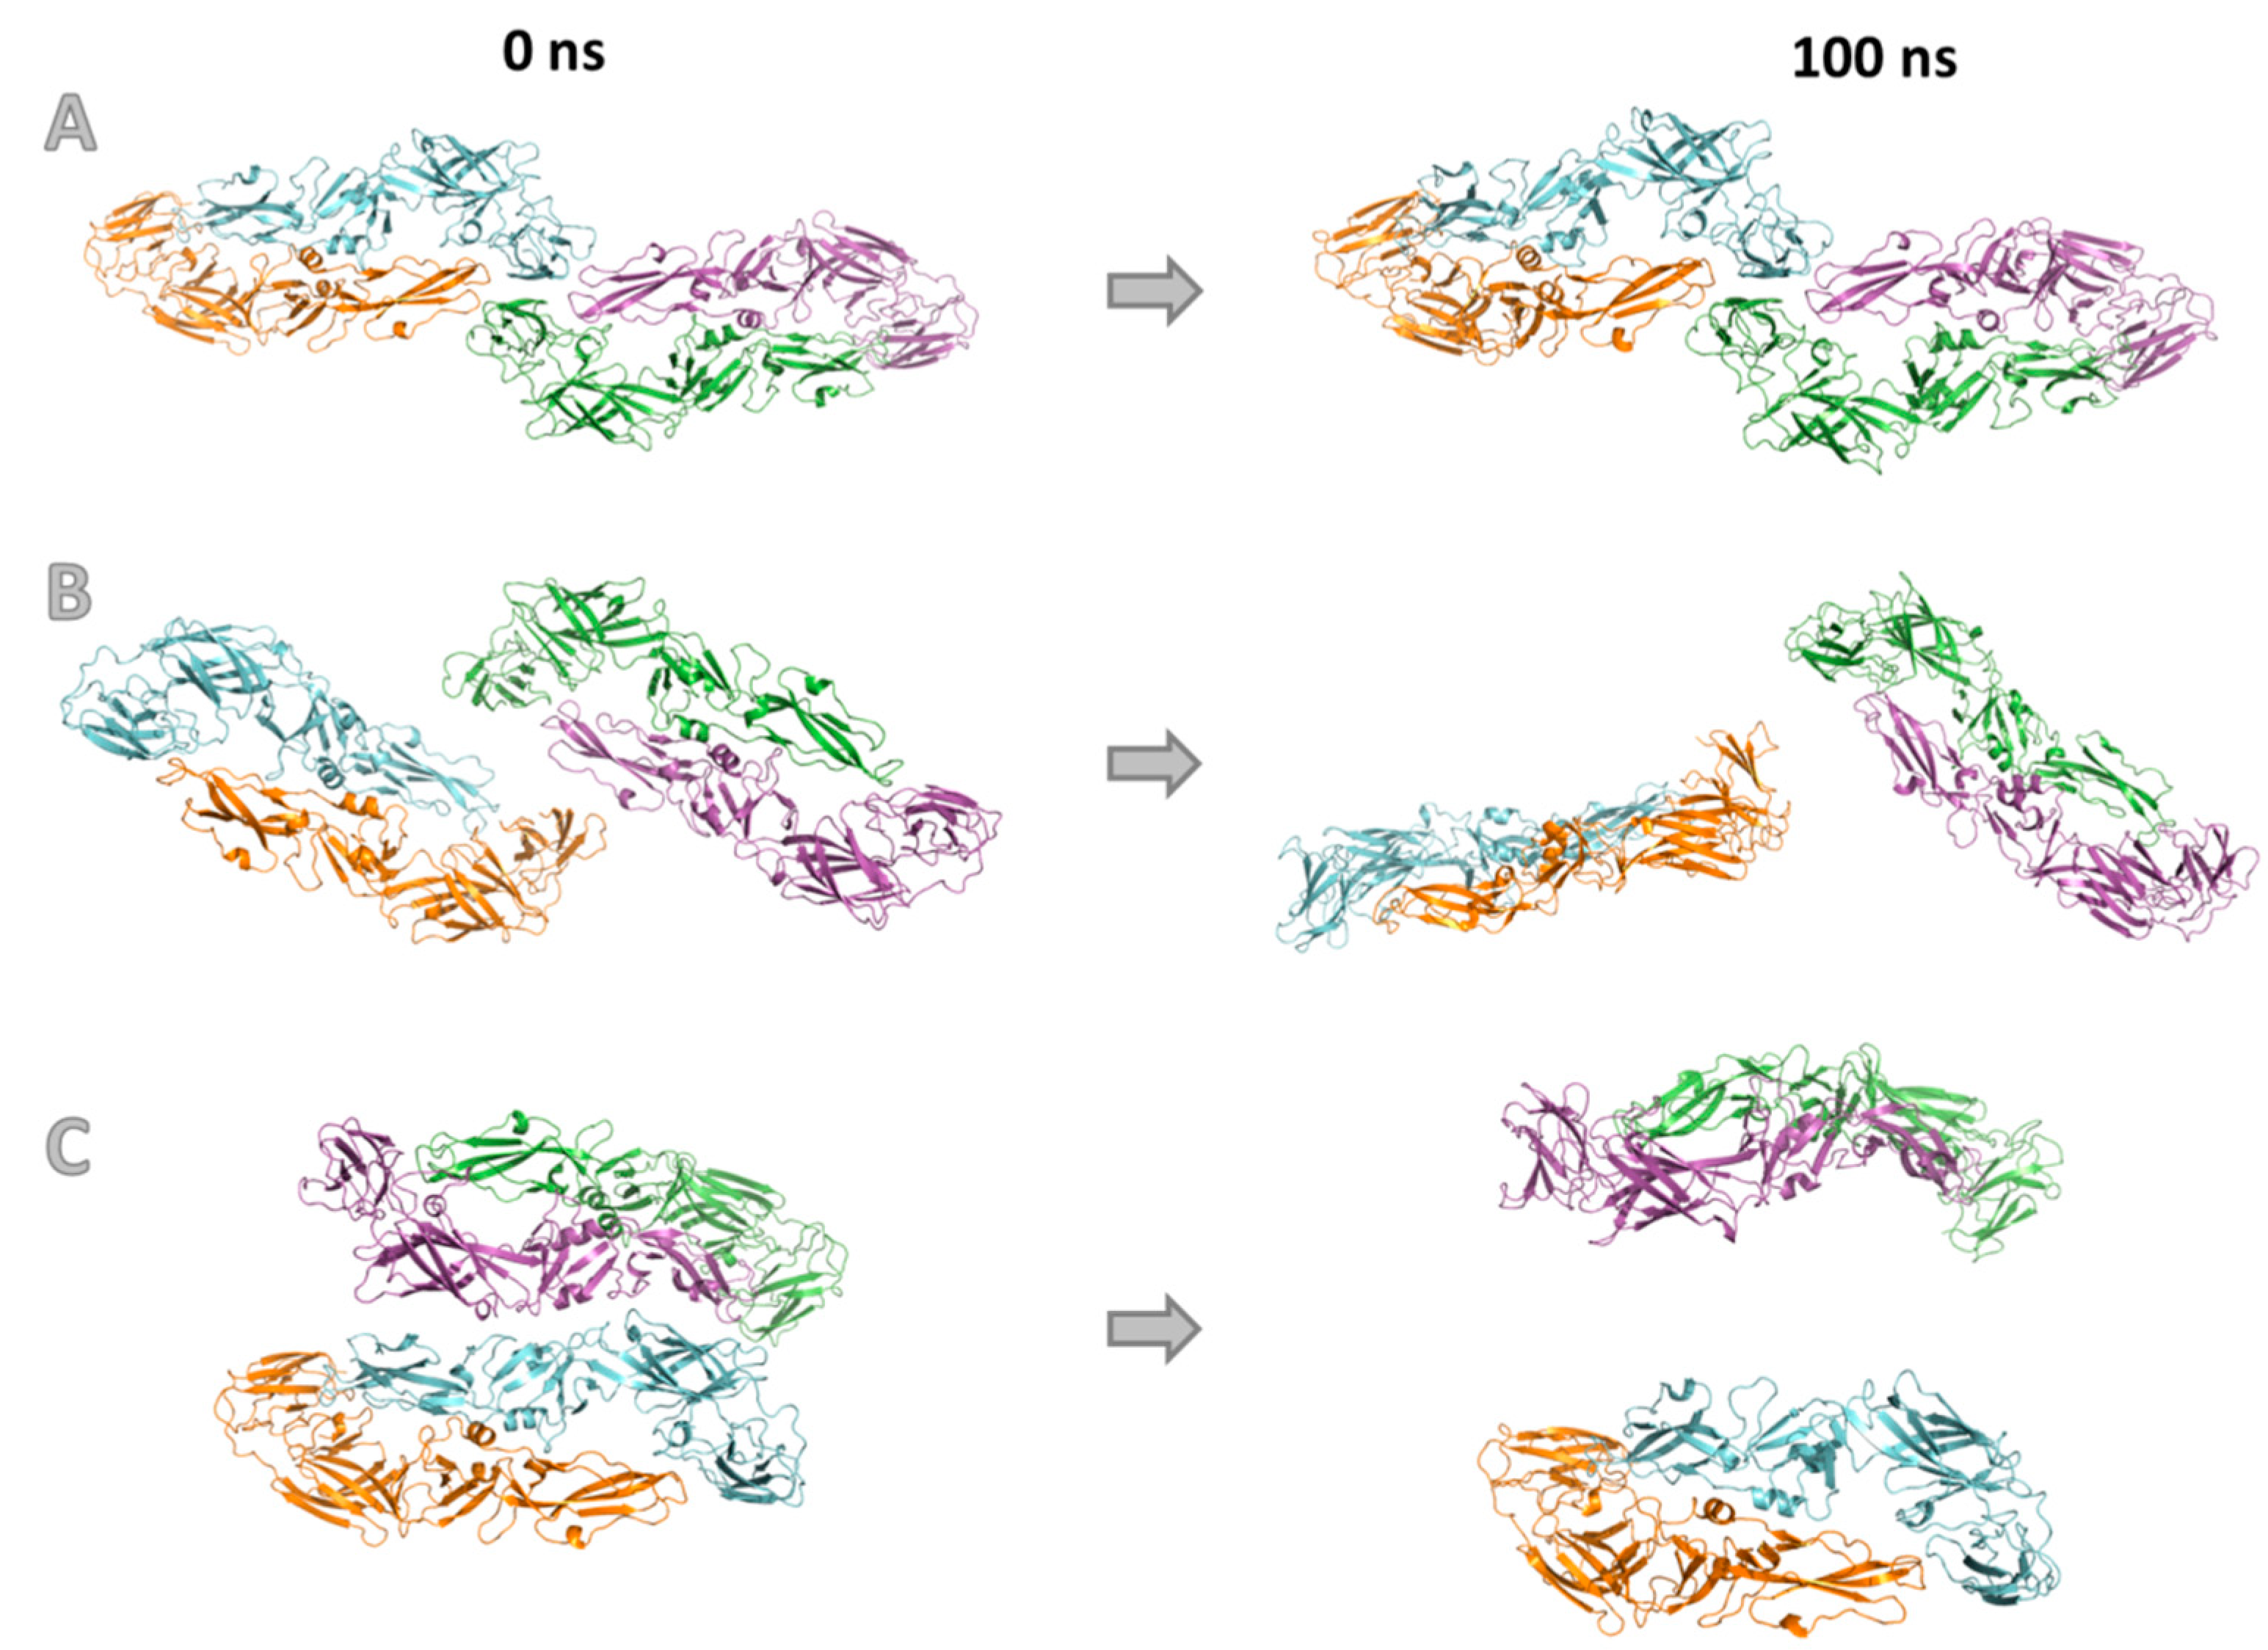
3.4. Molecular Modeling
4. Conclusions
Supplementary Materials
Author Contributions
Funding
Data Availability Statement
Acknowledgments
Conflicts of Interest
References
- Kaufmann, B.; Rossmann, M.G. Molecular mechanisms involved in the early steps of flavivirus cell entry. Microbes Infect. 2011, 13, 1–9. [Google Scholar] [CrossRef] [PubMed]
- Stiasny, K.; Kössl, C.; Lepault, J.; Rey, F.A.; Heinz, F.X. Characterization of a Structural Intermediate of Flavivirus Membrane Fusion. PLoS Pathog. 2007, 3, e20. [Google Scholar] [CrossRef] [PubMed]
- Yang, X.; Qi, J.; Peng, R.; Dai, L.; Gould, E.A.; Gao, G.F.; Tien, P. Molecular Basis of a Protective/Neutralizing Monoclonal An-tibody Targeting Envelope Proteins of both Tick-Borne Encephalitis Virus and Louping Ill Virus. J. Virol. 2019, 93, e02132–e2218. [Google Scholar] [CrossRef] [PubMed]
- Kanai, R.; Kar, K.; Anthony, K.; Gould, L.H.; Ledizet, M.; Fikrig, E.; Marasco, W.A.; Koski, R.A.; Modis, Y. Crystal structure of West Nile Virus envelope glycoprotein reveals viral surface epitopes. J. Virol. 2006, 80, 11000–11008. [Google Scholar] [CrossRef] [PubMed]
- Nybakken, G.E.; Nelson, C.A.; Chen, B.R.; Diamond, M.S.; Fremont, D.H. Crystal Structure of the West Nile Virus Envelope Glycoprotein. J. Virol. 2006, 80, 11467–11474. [Google Scholar] [CrossRef] [PubMed]
- Lu, X.; Xiao, H.; Li, S.; Pang, X.; Song, J.; Liu, S.; Cheng, H.; Li, Y.; Wang, X.; Huang, C.; et al. Double Lock of a Human Neutralizing and Protective Monoclonal Antibody Targeting the Yellow Fever Virus Envelope. Cell Rep. 2019, 26, 438–446. [Google Scholar] [CrossRef]
- Modis, Y.; Ogata, S.; Clements, D.; Harrison, S.C. A ligand-binding pocket in the dengue virus envelope glycoprotein. Proc. Natl. Acad. Sci. USA 2003, 100, 6986–6991. [Google Scholar] [CrossRef]
- Modis, Y.; Ogata, S.; Clements, D.; Harrison, S.C. Surface Epitopes in the Crystal Structure of Dengue Virus Type 3 Envelope Glycoprotein. J. Virol. 2005, 79, 1223–1231. [Google Scholar] [CrossRef]
- Rouvinski, A.; Guardado-Calvo, P.; Barba-Spaeth, G.; Duquerroy, S.; Vaney, M.-C.; Kikuti, C.M.; Sanchez, M.E.N.; Dejnirattisai, W.; Wongwiwat, W.; Haouz, A.; et al. Recognition determinants of broadly neutralizing human antibodies against dengue viruses. Nature 2015, 520, 109–113. [Google Scholar] [CrossRef]
- Dai, L.; Song, J.; Lu, X.; Deng, Y.Q.; Musyoki, A.M.; Cheng, H.; Zhang, Y.; Yuan, Y.; Song, H.; Haywood, J.; et al. Structures of the Zika Virus Envelope Protein and Its Complex with a Flavivirus Broadly Protective Antibody. Cell Host Microbe 2016, 19, 696–704. [Google Scholar] [CrossRef]
- Chen, Z.; Ye, F.; Lin, S.; Yang, F.; Cheng, Y.; Cao, Y.; Chen, Z.; Lu, G. Crystal structure of Usutu virus envelope protein in the pre-fusion state. Virol. J. 2018, 15, 183. [Google Scholar] [CrossRef] [PubMed]
- Liu, X.; Zhao, X.; Na, R.; Li, L.; Warkentin, E.; Witt, J.; Lu, X.; Yu, Y.; Wei, Y.; Peng, G.; et al. The structure differences of Japanese encephalitis virus SA14 and SA14-14-2 E proteins elucidate the virulence attenuation mechanism. Protein Cell 2019, 10, 149–153. [Google Scholar] [CrossRef]
- Zhang, Y.; Zhang, W.; Ogata, S.; Clements, D.; Strauss, J.H.; Baker, T.S.; Kuhn, R.J.; Rossmann, M.G. Conformational changes of the flavivirus E glycoprotein. Structure 2004, 12, 1607–1618. [Google Scholar] [CrossRef] [PubMed]
- Vaney, M.C.; Dellarole, M.; Duquerroy, S.; Medits, I.; Tsouchnikas, G.; Rouvinski, A.; England, P.; Stiasny, K.; Heinz, F.X.; Rey, F.A. Evolution and activation mechanism of the flavivirus class II membrane-fusion machinery. Nat. Commun. 2022, 13, 3718. [Google Scholar] [CrossRef] [PubMed]
- Hashizume, Y.; Inaka, K.; Furubayashi, N.; Kamo, M.; Takahashi, S.; Tanaka, H. Methods for Obtaining Better Diffractive Protein Crystals: From Sample Evaluation to Space Crystallization. Crystals 2020, 10, 78. [Google Scholar] [CrossRef]
- Kordonskaya, Y.V.; Timofeev, V.I.; Dyakova, Y.A.; Marchenkova, M.A.; Pisarevsky, Y.V.; Kovalchuk, M.V. Free Energy Change during the Formation of Crystalline Contact between Lysozyme Monomers under Different Physical and Chemical Conditions. Crystals 2021, 11, 1121. [Google Scholar] [CrossRef]
- Kovalchuk, M.V.; Blagov, A.E.; Dyakova, Y.A.; Gruzinov, A.Y.; Marchenkova, M.A.; Peters, G.S.; Pisarevsky, Y.V.; Timofeev, V.I.; Volkov, V.V. Investigation of the Initial Crystallization Stage in Lysozyme Solutions by Small-Angle X-ray Scattering. Cryst. Growth Des. 2016, 16, 1792–1797. [Google Scholar] [CrossRef]
- Behlke, J.; Marg, A.; Paeschke, M.J. Protein crystallization with and without precipitants. Appl. Cryst. 1997, 30, 559–560. [Google Scholar] [CrossRef]
- Vekilov, P.G.; Vorontsova, M.A. Nucleation precursors in protein crystallization. Acta Crystallogr. F Struct. Biol. Commun. 2014, 70, 271–282. [Google Scholar] [CrossRef]
- Dubova, K.M.; Vlaskina, A.V.; Korzhenevskiy, D.A.; Agapova, Y.K.; Rakitina, T.V.; Samygina, V.R. Preliminary X-ray Diffraction Analysis of the Envelope (E) Protein of Far-Eastern Tick-Borne Encephalitis Virus Subtype (Sofjin Strain). Crystallogr. Rep. 2022, 67, 581–585. [Google Scholar] [CrossRef]
- Murshudov, G.N.; Vagin, A.A.; Dodson, E.J. Refinement of macromolecular structures by the maximum-likelihood method. Acta Cryst. 1997, D53, 240–255. [Google Scholar] [CrossRef]
- Emsley, P.; Lohkamp, B.; Scott, W.G.; Cowtan, K. Features and development of Coot. Acta Cryst. 2010, D66, 486–501. [Google Scholar] [CrossRef]
- Winn, M.D.; Ballard, C.C.; Cowtan, K.D.; Dodson, E.J.; Emsley, P.; Evans, P.R.; Keegan, R.M.; Krissinel, E.B.; Leslie, A.G.W.; McCoy, A.; et al. Overview of the CCP4 suite and current developments. Acta. Cryst. 2011, D67, 235–242. [Google Scholar] [CrossRef]
- Peters, G.S.; Zakharchenko, O.A.; Konarev, P.V.; Karmazikov, Y.V.; Smirnov, M.A.; Zabelin, A.V.; Mukhamedzhanov, E.H.; Veligzhanin, A.A.; Blagov, A.E.; Kovalchuk, M.V. The small-angle X-ray scattering beamline BioMUR at the Kurchatov synchrotron radiation source. Nucl. Instrum. Methods Phys. Res. Sect. A Accel. Spectrometers Detect. Assoc. Equip. 2019, 945, 162616. [Google Scholar] [CrossRef]
- Hammersley, A.P. FIT2D: A multi-purpose data reduction, analysis and visualization program. J. Appl. Crystallogr. 2016, 49, 646–652. [Google Scholar] [CrossRef]
- Manalastas-Cantos, K.; Konarev, P.V.; Hajizadeh, N.R.; Kikhney, A.G.; Petoukhov, M.V.; Molodenskiy, D.S.; Panjkovich, A.; Mertens, H.D.T.; Gruzinov, A.; Borges, C.; et al. ATSAS 3.0: Expanded functionality and new tools for small-angle scattering data analysis. J. Appl. Crystallogr. 2021, 54, 343–355. [Google Scholar] [CrossRef]
- Dolinsky, T.J.; Nielsen, J.E.; McCammon, J.A.; Baker, N.A. PDB2PQR: An Automated Pipeline for the Setup of Poisson-Boltzmann Electrostatics Calculations. Nucleic Acids Res. 2004, 32, W665–W667. [Google Scholar] [CrossRef]
- Van Der Spoel, D.; Lindahl, E.; Hess, B.; Groenhof, G.; Mark, A.E.; Berendsen, H.J.C. GROMACS: Fast, flexible, and free. J. Comput. Chem. 2005, 26, 1701–1718. [Google Scholar] [CrossRef]
- Lindorff-Larsen, K.; Piana, S.; Palmo, K.; Maragakis, P.; Klepeis, J.L.; Dror, R.O.; Shaw, D.E. Improved side-chain torsion potentials for the Amber ff99SB protein force field. Proteins Struct. Funct. Bioinform. 2010, 78, 1950–1958. [Google Scholar] [CrossRef]
- Horn, H.W.; Swope, W.C.; Pitera, J.W.; Madura, J.D.; Dick, T.J.; Hura, G.L.; Head-Gordon, T. Development of an improved four-site water model for biomolecular simulations: TIP4P-Ew. J. Chem. Phys. 2004, 120, 9665–9678. [Google Scholar] [CrossRef]
- Berendsen, H.J.C.; Postma, J.P.M.; Van Gunsteren, W.F.; Dinola, A.; Haak, J.R. Molecular dynamics with coupling to an external bath. J. Chem. Phys. 1984, 81, 3684–3690. [Google Scholar] [CrossRef]
- Parrinello, M.; Rahman, A. Strain fluctuations and elastic constants. J. Chem. Phys. 1982, 76, 2662–2666. [Google Scholar] [CrossRef]
- Van Gunsteren, W.F.; Berendsen, H.J.C. A Leap-Frog Algorithm for Stochastic Dynamics. Mol. Simul. 1998, 1, 173–185. [Google Scholar] [CrossRef]
- Chiara, C.; Rees, M.; Menon, R.P.; Pauwels, K.; Lawrence, C.; Konarev, P.V.; Svergun, D.I.; Martin, S.R.; Chen, Y.W.; Pastore, A. Self-Assembly and Conformational Heterogeneity the AXH Domain of Ataxin-1: An Unusual Example of a Chameleon Fold. Biophys. J. 2013, 104, 1304–1313. [Google Scholar] [CrossRef]
- Zhang, N.; Li., C.; Jiang, S.; Du, L. Recent Advances in the Development of Virus-Like Particle-Based Flavivirus Vaccines. Vaccines 2020, 8, 481. [Google Scholar] [CrossRef]

| Protein | ectoE |
| Data collection | |
| Wavelength | 0.98888 |
| Resolution (Å) | 50.0−3.20 (3.28–3.2) * |
| Space group | P4132 |
| Unit cell parameters | |
| a = b = c (Å) | 165.1 |
| α = β = γ (°) | 90 |
| Completeness (%) | 99.9 (100) |
| I/σ (I) | 12.3 (2.43) |
| Multiplicity | 3.8 (3.1) |
| Rmerge (%) | 15.8 (94.2) |
| CC1/2 (%) | 99.9 (93.3) |
| No. unique reflections | 50,107 (6384) |
| Refinement | |
| Rwork/Rfree (%) | 20.2/28.6 |
| No. atoms | |
| Protein | 3028 |
| Water | 8 |
| Average B factors (Å2) | |
| Protein | 121.9 |
| Water | 72.78 |
| R.m.s. deviations | |
| Protein bond lengths (Å) | 0.014 |
| Protein bond angles (°) | 2.12 |
| Ramachandran analysis | - |
| Favored (%) | 79.1 |
| Allowed region (%) | 12.5 |
| Outliers (%) | 9.5 |
| PDB code | 8R2L |
| Rg, nm | Dmax, nm | VP, nm3 | MMexp, kDa | |
|---|---|---|---|---|
| EctoE, fraction 1 | 3.95 ± 0.05 | 12.5 ± 0.5 | 67 ± 7 | 45 ± 5 |
| EctoE, fraction 2 | 5.94 ± 0.15 | 20.0 ± 1.0 | 235 ± 15 | 160 ± 13 |
| Models/(Programs) | Rg, nm | Dmax, nm | χ2 |
|---|---|---|---|
| ECT, pH 8.0/ (CRYSOL) | 7.1 | 25.4 | 4.62 |
| CCT, pH 8.0/ (CRYSOL) | 5.1 | 17.5 | 5.75 |
| Mixture of crystallographic tetramers pH 8.0 (45% CCT + 55%ECT)/ (OLIGOMER) | -- | -- | 1.42 |
| ECT, pH 4.5/ (CRYSOL) | 7.0 | 24.8 | 6.31 |
| CCT, pH 4.5/ (CRYSOL) | 4.5 | 15.0 | 17.97 |
| Mixture of crystallographic tetramers pH 4.5 (25% CCT + 75% ECT)/ (OLIGOMER) | -- | -- | 4.26 |
| Rigid body model/(SASREF) | 6.0 | 21.1 | 1.35 |
Disclaimer/Publisher’s Note: The statements, opinions and data contained in all publications are solely those of the individual author(s) and contributor(s) and not of MDPI and/or the editor(s). MDPI and/or the editor(s) disclaim responsibility for any injury to people or property resulting from any ideas, methods, instructions or products referred to in the content. |
© 2023 by the authors. Licensee MDPI, Basel, Switzerland. This article is an open access article distributed under the terms and conditions of the Creative Commons Attribution (CC BY) license (https://creativecommons.org/licenses/by/4.0/).
Share and Cite
Konarev, P.V.; Vlaskina, A.V.; Korzhenevskiy, D.; Rakitina, T.V.; Petrenko, D.; Agapova, Y.; Kordonskaya, Y.; Samygina, V.R. Self-Assembly and Conformational Change in the Oligomeric Structure of the Ectodomain of the TBEV E Protein Studied via X-ray, Small-Angle X-ray Scattering, and Molecular Dynamics. Crystals 2023, 13, 1676. https://doi.org/10.3390/cryst13121676
Konarev PV, Vlaskina AV, Korzhenevskiy D, Rakitina TV, Petrenko D, Agapova Y, Kordonskaya Y, Samygina VR. Self-Assembly and Conformational Change in the Oligomeric Structure of the Ectodomain of the TBEV E Protein Studied via X-ray, Small-Angle X-ray Scattering, and Molecular Dynamics. Crystals. 2023; 13(12):1676. https://doi.org/10.3390/cryst13121676
Chicago/Turabian StyleKonarev, Petr V., Anna V. Vlaskina, Dmitry Korzhenevskiy, Tatiana V. Rakitina, Dmitry Petrenko, Yulia Agapova, Yulia Kordonskaya, and Valeriya R. Samygina. 2023. "Self-Assembly and Conformational Change in the Oligomeric Structure of the Ectodomain of the TBEV E Protein Studied via X-ray, Small-Angle X-ray Scattering, and Molecular Dynamics" Crystals 13, no. 12: 1676. https://doi.org/10.3390/cryst13121676