Abstract
The aim of the research campaign was to simulate in vitro the typical conditions for the corrosion in biofluid of a femoral bone implant manufactured with AZ31 alloy. The samples were immersed in biofluid (alpha-MEM) for time intervals of up to 56 days. For each immersion time, the chemical compositions and morphologies of the samples were studied with SEM, EDX, XRD, Raman spectroscopy, and XPS. The weight losses of the samples caused by corrosion were also measured. The results highlighted the formation of calcium phosphate crystals on the surface of the samples. This type of coating is well-known for its excellent corrosion resistance and for its ability to accelerate tissue regeneration. The deceleration of the corrosion process, observed after 28 days of immersion in biofluid, confirms the anti-corrosive effect of the coating that was spontaneously formed during the immersion tests.
1. Introduction
Implants for human bone repair and replacement are generally fabricated from stainless steels, Ti alloys, and Co-Cr alloys due to their excellent corrosion resistance and biocompatibility [1,2]. However, there are some issues due to the large difference between the mechanical properties of permanent implants and those of the human bone, the toxicity of some corrosion products, and sometimes the need for a second surgery to remove the implant [3]. Therefore, the use of implants produced with biocompatible and biodegradable materials seems to be a promising alternative.
Biodegradable alloys contain the typical chemical elements necessary for human metabolism (Mg, Fe, and Zn), and their corrosion products are non-toxic and are released from the body in a natural way. Furthermore, their gradual corrosion allows tissue regeneration and replacement of the initial prosthesis without the need for a secondary surgery. Compared to other biodegradable alloys such as Fe-based [4,5,6] or Zn-based [7] ones, Mg-based alloys are of particular interest due to their excellent biocompatibility and biodegradability [8,9,10]. Their use for temporary implants in orthopedics or in other medical applications, such as vascular stents, looks promising. Recently, AZ31 alloy has been selected to produce rib fixators used to aid the osteosynthesis of multi-fractured ribs [11,12].
Some studies have shown that Mg-based implants could also stimulate new bone formation [13]. The physical and mechanical properties of Mg alloys are very similar to those of human bone: a density of 1.74 g cm−1 (bone: 1–2 g cm−1), an elastic modulus of 41–45 GPa (bone: 3–20 GPa), and a tensile strength of 160–263 MPa (bone: 1.5–283 MPa). Furthermore, Mg is indispensable for many biochemical processes in the human body and helps to maintain the proper functioning of muscles and nerves, regulate heart rate and blood sugar level, and stimulate the immune system [14].
AZ31 alloy contains 3%wt of Al and 1%wt of Zn. The presence of Al improves the mechanical proprieties, like ductility, yield strength and ultimate tensile strength, and corrosion resistance. The addition of zinc into Mg-based alloys improves its creep behavior, yield strength, and tensile strength, and it affects the microstructure of the alloy refining it [15]. The addition of Zn also improves the corrosion resistance in the SBF solution [16].
Despite the great interest in Mg alloys as biodegradable materials, some drawbacks currently limit their use for temporary implants. The corrosion rate in the physiological pH environment (7.4–7.6) is very high, causing the loss of structural integrity of the system before the time necessary for tissue regeneration and the formation of H2 bubbles [17], which can cause tissue necrosis.
To overcome these drawbacks, many studies have been carried out in recent years to improve the corrosion resistance and mechanical properties, in particular by tailoring the composition [18] and changing the microstructure (grain size and second phases) [19,20] and the surface condition through suitable manufacturing and processing techniques (extrusion [21], heat treatments [22], surface modifications [23,24], ECAP [25], etc.). Recently, the use of hydroxyapatite surface coating containing multi-walled carbon nanotubes [26] has shown a reduction in corrosion current density of AZ31 alloys and an increase in its elongation to failure of about 70% in simulated body fluid (SBF).
Even the results of in vitro tests on Mg alloys with the use of simulated body fluids (SBFs) [27,28,29,30] reported in the literature sometimes are contradictory, particularly in long-term biocorrosion tests.
This work was carried out to study the effects of long-term immersion of AZ31 alloy in SBF, considering times of up to 56 days. The duration and parameters of the experiments were chosen in order to simulate typical conditions for femoral bone implants. The transformation of the surface morphology, the chemical composition of the biocorrosion products, and their influence on weight loss were investigated.
2. Materials and Methods
The Mg alloy used in this study was AZ31 (supplied by Goodfellows) with a nominal composition of 3Al, 1Zn, and Mg to balance weight percentage. Before the tests, the samples in the form of disks, with a diameter of 6 mm and a thickness of 0.6 mm, were mechanically polished with abrasive papers up to a grade of 4000 grits and cleaned with ultrasound in deionized water for 5 min.
The SBF used in the corrosion tests had the following composition: 78% α-MEM (Sigma Aldrich, St. Louis, MO, USA), 20% fetal bovine serum (FBS), 1% glutamines, and 1% streptomycin and penicillin.
Each sample was immersed in 5 mL of SBF and placed in a Hera Cell incubator at 37 °C and in an atmosphere with 5% CO2. The initial pH of the SBF was balanced to 7.4. After defined time intervals (3, 7, 10, 14, 21, 28, 35, 42, 48, and 56 days), the samples were extracted from the SBF, washed in deionized water, rinsed in ethanol, dried with air flow, and placed in the desiccator for 3 h.
The pH of the SBF was measured before and after each immersion test using a pH-meter. To evaluate the weight loss of the samples due to the corrosion process, the samples’ weights were measured with an electronic scale (with a resolution of up to 10 μg) before and after each immersion test in the SBF. The mean weight value of the samples before the tests was 25 mg.
To identify the corrosion products, X-ray diffraction (XRD) measurements were performed on the samples after each immersion time. XRD spectra were collected with angular steps 2θ of 0.05° and a counting time of 2 s per step using Cu-Kα radiation (λ = 1.5408 Å). The phases were identified using the JCPDS-ICDD database [31].
After each immersion test, the samples were observed with scanning electron microscopy (SEM) to study the morphology of the surface, and the chemical compositions of the corrosion products were determined with the EDX technique and Raman spectroscopy.
Dried samples were placed on aluminum stubs with adhesive carbon tabs and sputtered with platinum (2 nm thick) with an Emitech K575 sputter (Emitech Lim., Ashford, Kent, UK). Observations and high-magnification images were obtained with high-resolution SEM (mod. S4000, Hitachi, Tokyo, Japan) operating at 15 kV and a working distance (WD) of 15–20, equipped with a Ul-99 UtraDry EDS Detector (Thermo Fisher Scientific, Waltham, MA, USA).
The surface chemical compositions of the samples were investigated with X-ray photoelectron spectroscopy (XPS). The XPS measurements were performed with an ESCALAB 250Xi spectrometer (Thermo Fisher Scientific, East Grinsted, UK) equipped with a monochromatic X-ray source (Al K − h = 1486.6 eV), a six-channeltron detection system, and an ion gun source for the ion sputtering process. During the XPS measurements, the base pressure of the main chamber was 1 × 10⁻¹⁰ mbar, while during the sputtering, the pressure increased to up to 1 × 10⁻⁷ mbar. The depth profiles were carried out with an EX-05 ion (Ar+) gun set at 2 keV energy; the concentration profiles were created with alternating cycles of ion sputtering and spectra acquisition. The sputtering rate was estimated to be 0.84 nm/s. The binding energy scale was calibrated by positioning the C 1s peak of adventitious carbon at BE = 285.0 eV. The accuracy of the measurements was ± 0.1 eV. The XPS data were collected and processed with Avantage v.5.979 (Thermo Fisher Scientific, East Grinsted, UK).
Raman spectroscopy (RS, OPTOSKY, ATR 8300 Series, Xiamen, China) measurements were carried out in the spectral range of 200–2000 cm−1, at room temperature and in air by employing a laser wavelength of 785 nm. The spectral resolution was about ± 2 cm−1.
3. Results and Discussion
To more carefully simulate the typical conditions for a femoral bone implant, AZ31 samples with a surface area of 249 mm2 (SA) were immersed in a surface volume (SV) of 5 mL of SBF. The volume of SBF was chosen in accordance with the study results of L. Yang and E. Zhang [32]. In their work, they studied the influence of the SV/SA ratio on the biocorrosion rate of Mg-based alloys. In the case of the femora bone implant, the surface of the implant will be surrounded by cortical bone tissue and muscle tissue that will limit body fluid and blood in contact with the implant surface, so the SV/SA ratio will be low. The ratio chosen in this work was about two, which could be considered low (the authors consider 0.67 as a low ratio). An SV/SA ratio of 6.7 was considered high and typical for artery stent degradation conditions where the blood flow is high. The suitable choice of an SV/SA ratio helped us to avoid the overestimation of the biocorrosion rate.
At the beginning of the tests, the pH of the SBF was 7.4 and shifted towards more basic values in the first 10 days of immersion to the value of ~8.4 that remained stable with increasing immersion time (Table 1). In the aqueous solution on the surface of the samples formed a Mg(OH)2 layer as a result of the reduction reaction. It was observed that the presence of NaCl in the corrosive solutions (the α-MEM used in our work contained 6800 mg/L of NaCl) led to the substitution of OH− ions with Cl−, with a formation of highly soluble MgCl2. The corrosion process continued with an increased rate, and at the same time, the released OH− ions increased the pH of the SBF. The increasing pH created a condition of calcium phosphate precipitation that led to corrosion deceleration [32]. It should be mentioned that the pH value was higher near the sample’s surface than those values reported in Table 1, measured in volume.

Table 1.
pH value of the SBF after the immersion tests.
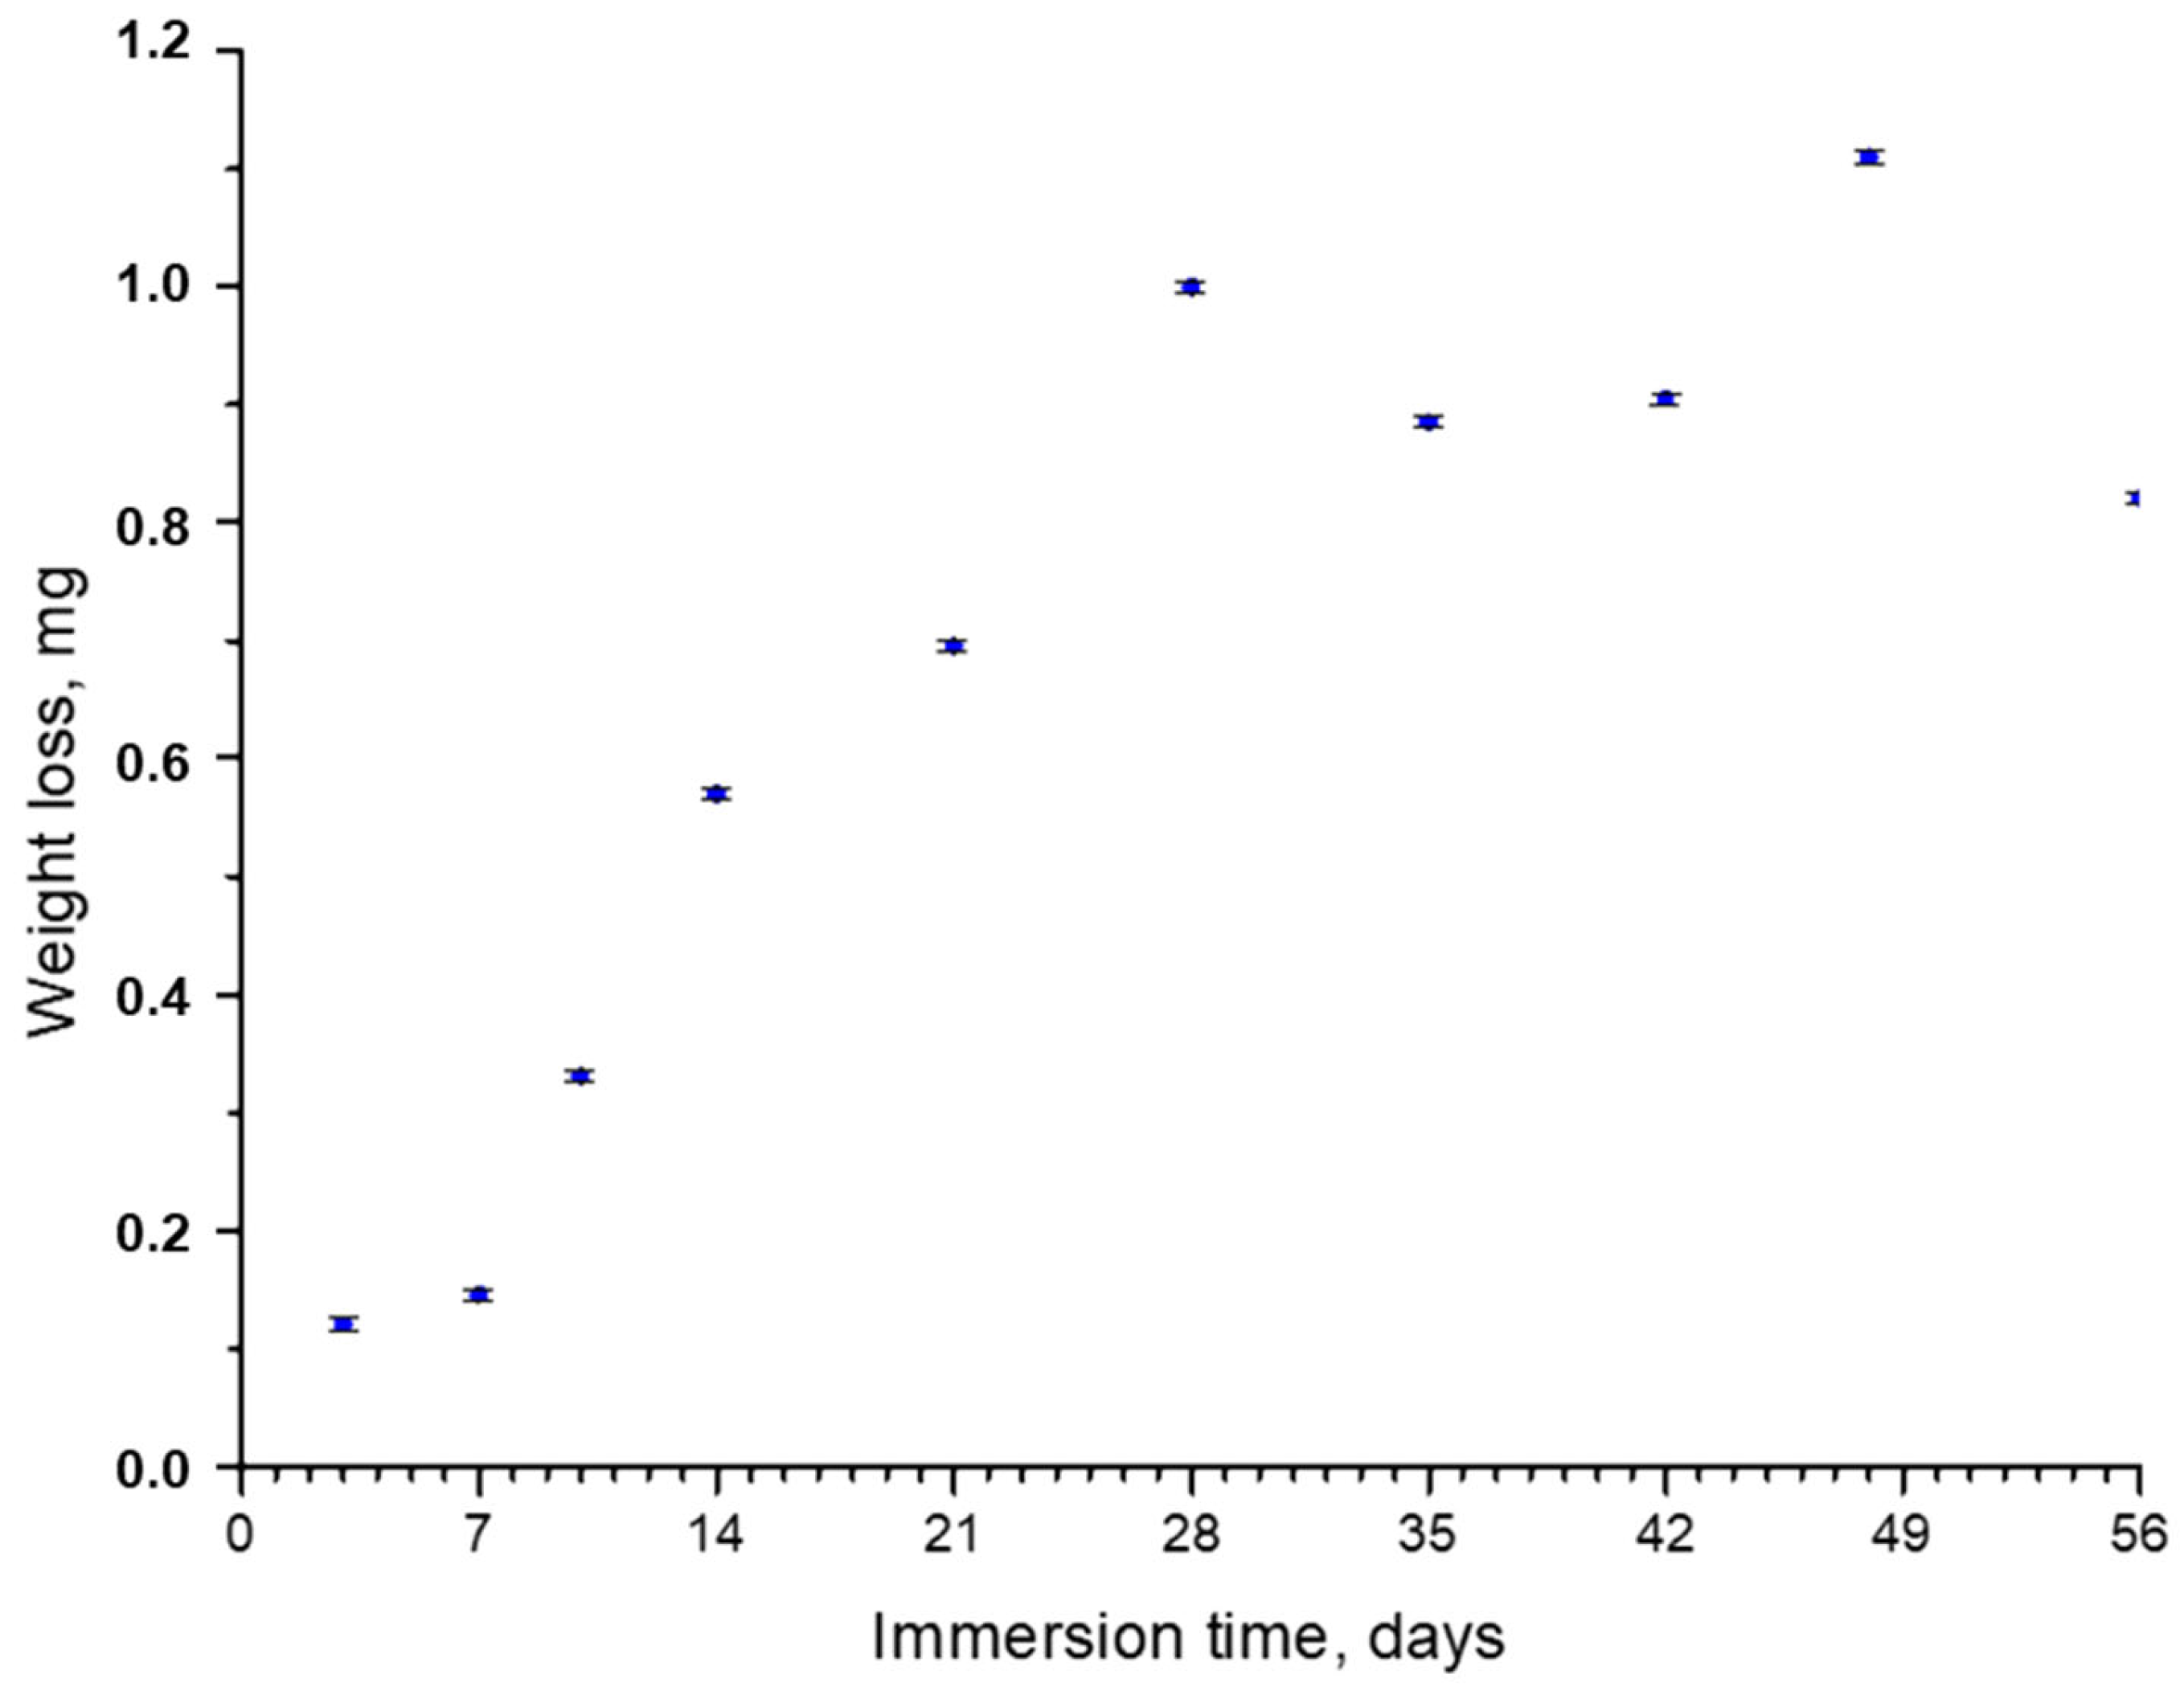
Figure 1 shows the weight loss values after the immersion tests. In the first 28 days of immersion, a high weight loss rate was observed; samples lost from 0.1 mg after 7 days to 1 mg after 28 days. From that moment, the trend considerably changed, and at up to 56 days, the weight loss remained around 1 mg, with small variations from sample to sample. The maximum weight loss observed in the tests was ~4% of the total weight.
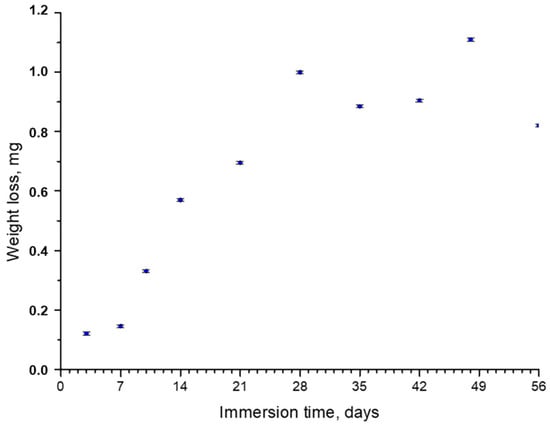
Figure 1.
Weight loss of AZ31 samples vs. immersion time in the SBF.
The deceleration of corrosion observed after 28 days can generally be caused by several factors. The first one, according to a study by X.N. Gu et al. [33], could have been the absorption of proteins (FBS) present in the biofluid, which took place more easily for Al2O3 than for Mg(OH)2. This promoted the growth of an additional protective layer and decelerated corrosion. The second factor was the low ratio of the volume of the solution to the surface area of the sample, which increases the pH of the solution and tends to suppress the corrosion process [32]. The third factor was the formation of calcium phosphates on the surface of the sample, the crystals that are well-known for their protective properties under physiological conditions [34]. The presence of both Al2O3 and crystal calcium phosphate layers after the immersion of AZ31 disks into SBF, together with the deposition of the organic film on the crystals’ surfaces, was confirmed with the characterization techniques used in this work. The results are presented as follows.
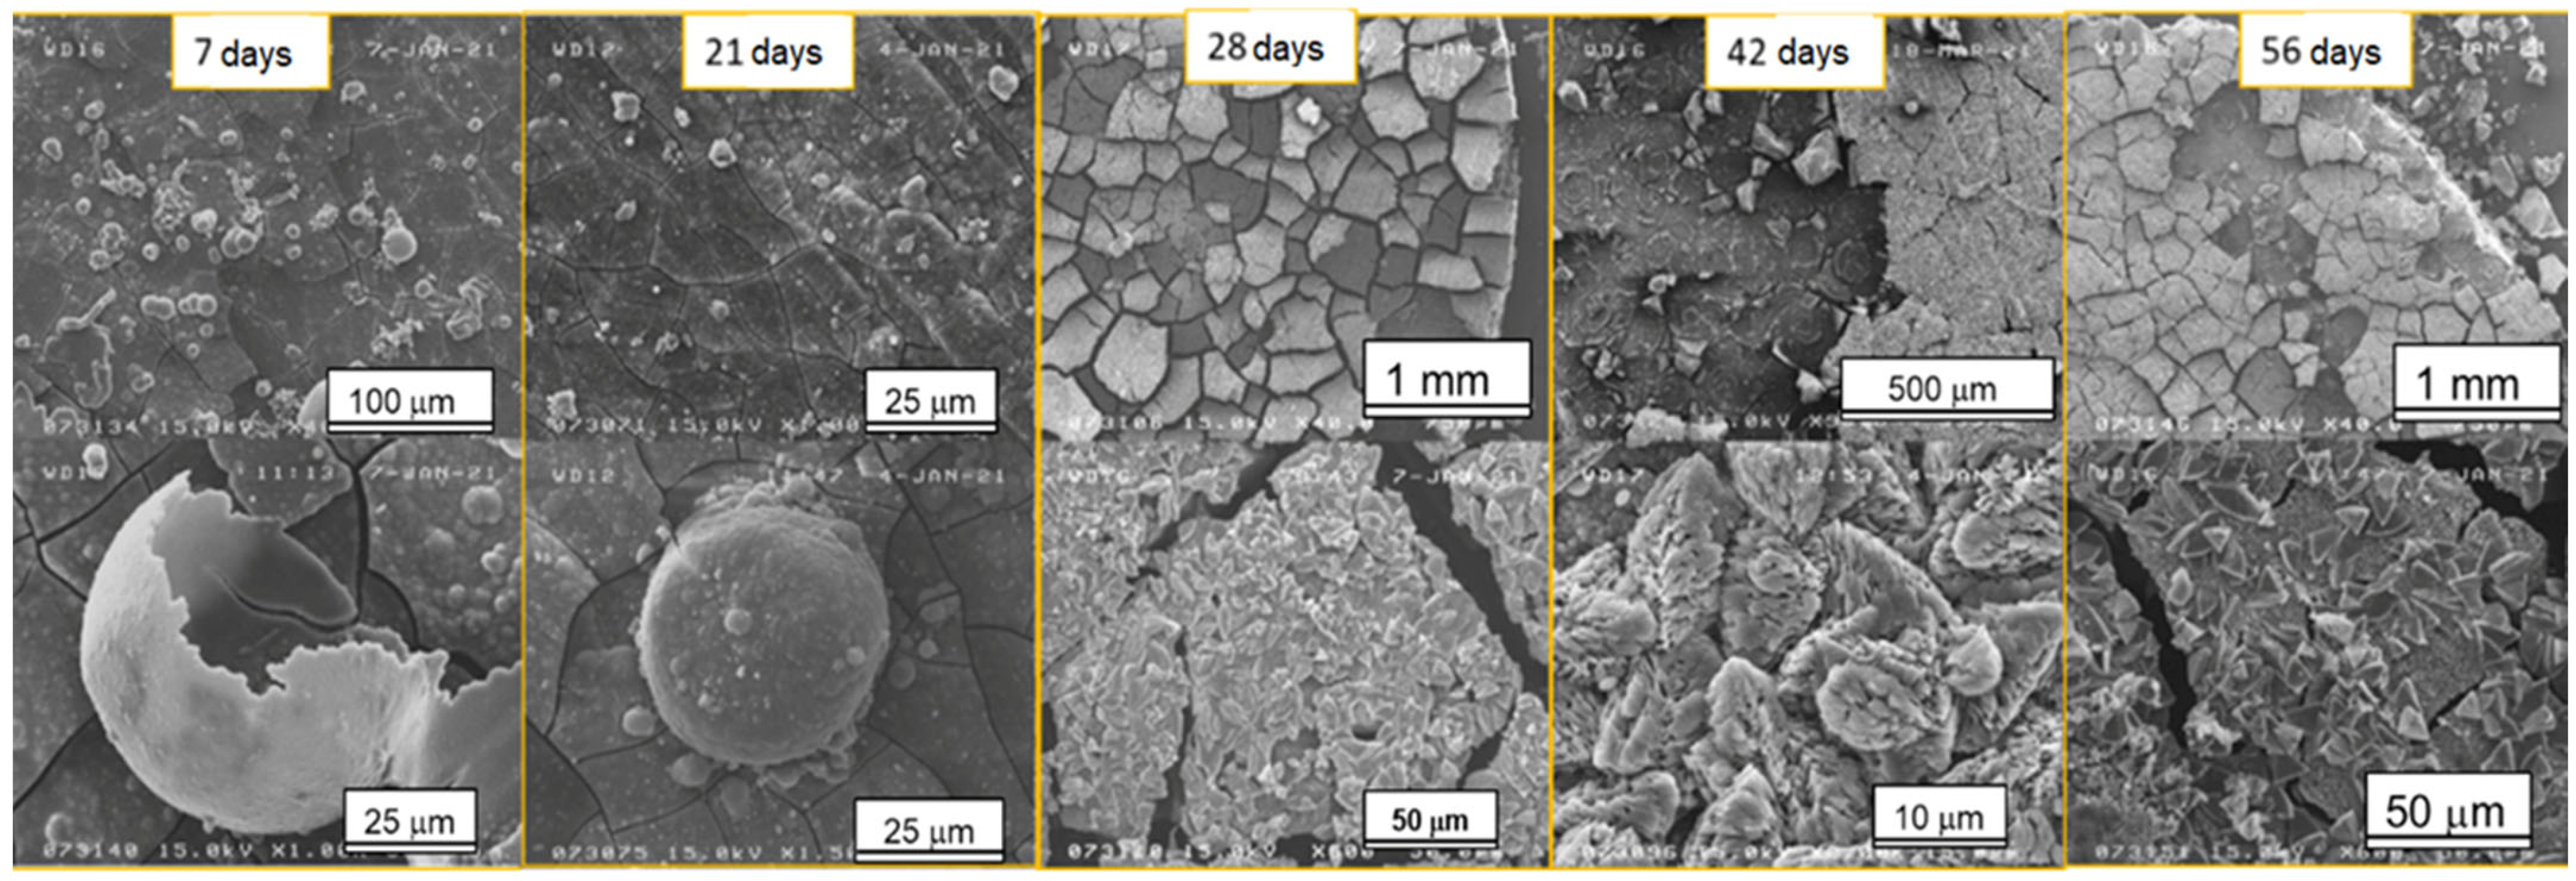
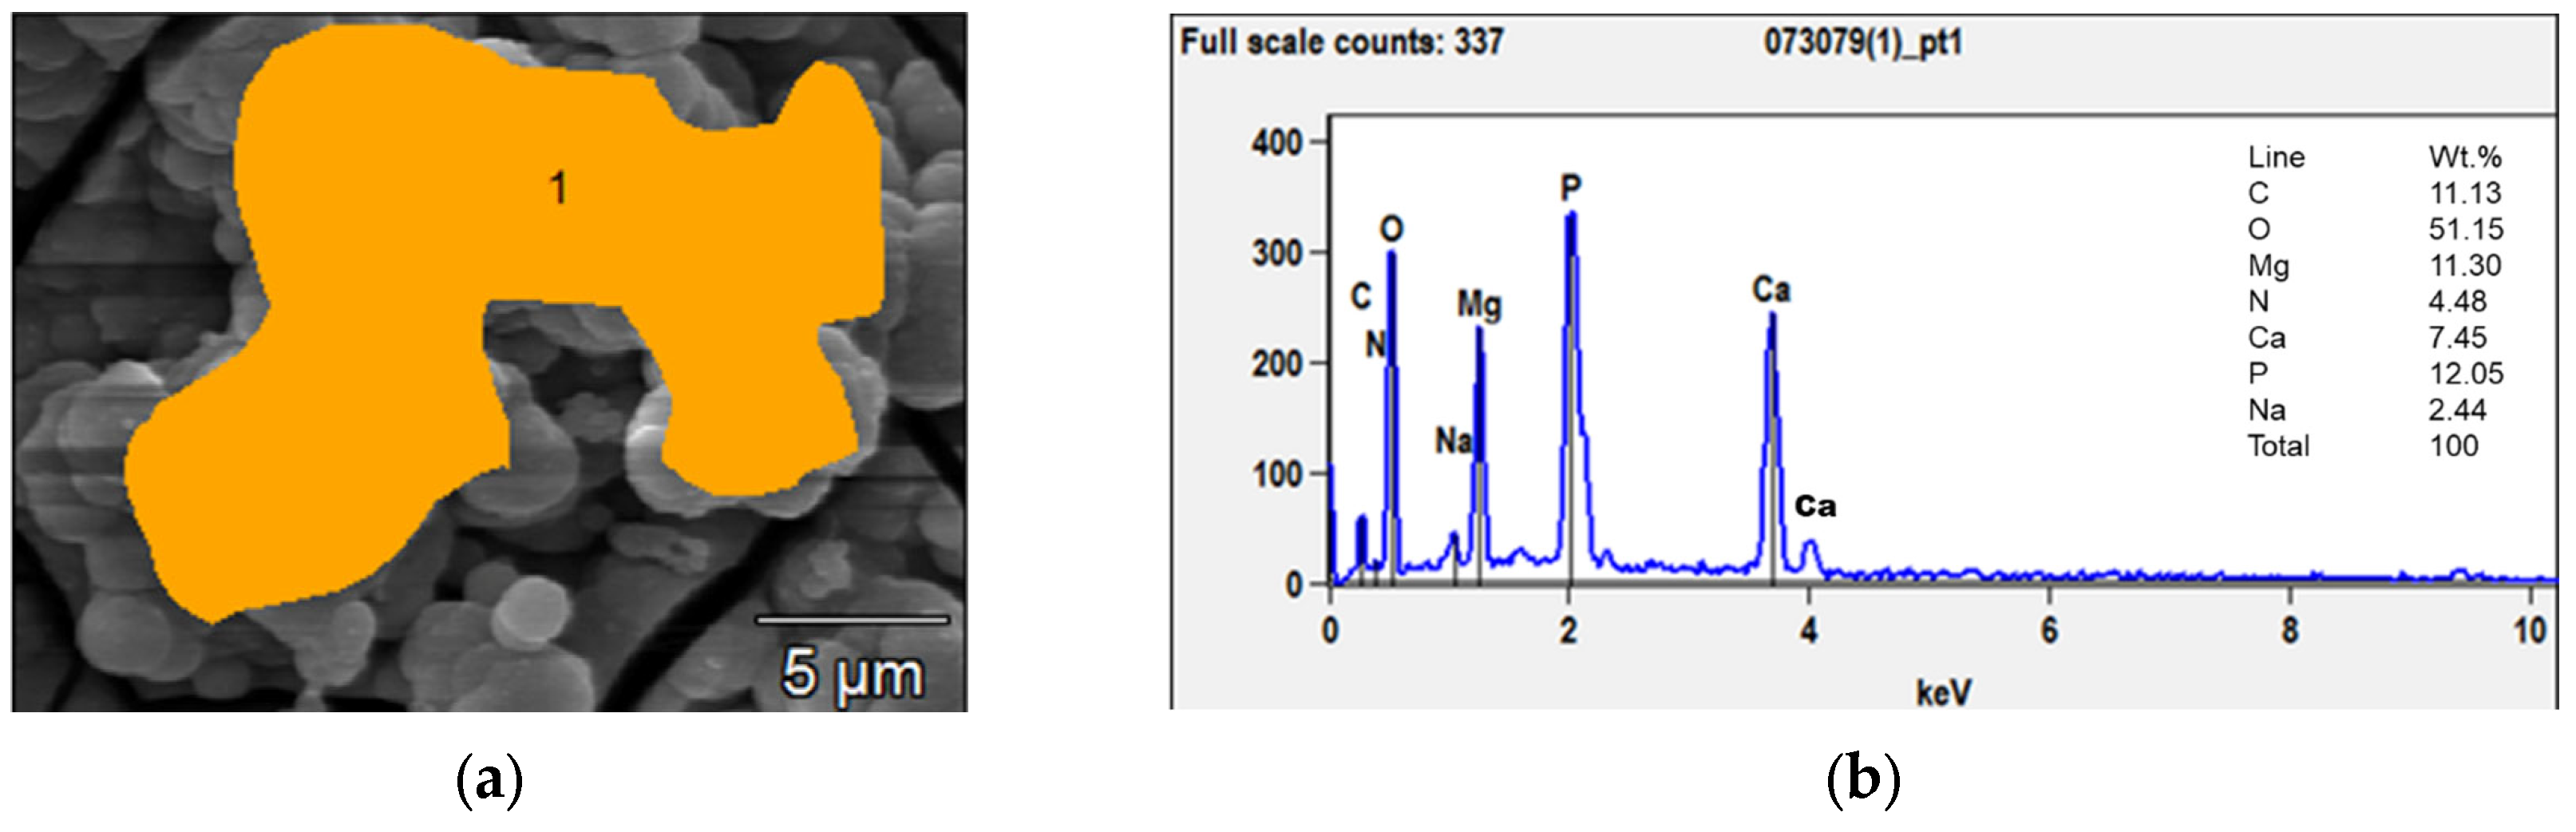
Figure 2 shows the morphological modifications of the samples’ surfaces after different immersion times. In the first 21 days, bubble-shaped crystals non-homogeneously dispersed were observed; their sizes ranged from a few nanometers to tens of microns. EDX analyses (Figure 3b) showed that the Ca/P ratio was close to 0.5, which corresponded to Ca phosphate with the formula Ca(PO3)2 also detected through XRD. The formation of these crystals could be induced by the release of hydrogen as one of the corrosion products with the subsequent growth of bubbles.
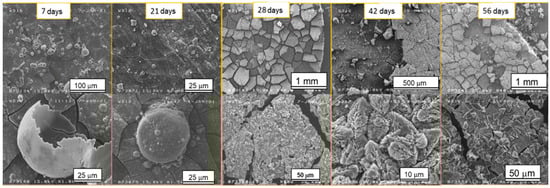
Figure 2.
SEM images of the samples after different time steps of immersion in SBF.

Figure 3.
SEM micrograph (a) and EDX analyses (b) of the bubble-shaped crystals (orange area) grown after 7 days of immersion.
The situation changed after 28 days of immersion: a coating composed of large prismatic crystals with sizes between 3 and 10 μm was observed on the surface of the AZ31 samples (Figure 4a). From the EDX analysis (Figure 4b), the Ca/P ratio was determined, and it was close to 1.5, which corresponded to calcium phosphate with the formula Ca3(PO4)2—tricalcium phosphate (TCP) that is much less soluble than Ca(PO3)2. TCP, together with hydroxyapatite (HA), forms a coating with excellent biocompatibility, anti-inflammatory, and bone regeneration properties [34]. In fact, TCP formation coincided with the deceleration of the samples’ corrosion.
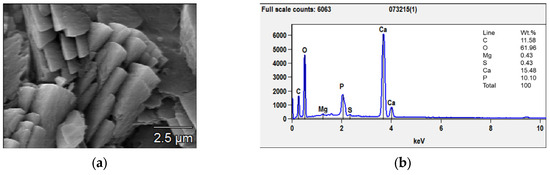
Figure 4.
SEM micrograph (a) and EDX analyses (b) of the prismatic crystals grown after 56 days of immersion.
For all the samples, the corrosion product coating showed multiple cracks caused by the drying process.
Figure 5 shows the XRD spectra of AZ31 samples after immersion tests for increased times. For comparison, the spectrum of AZ31 before the tests is also shown. The peaks of Mg (JCPDS-ICDD—file 35–821) and Mg(OH)2 (JCPDS-ICDD—file 7–239) were observed in the sample before immersion in the SBF. After immersion, low-intensity peaks of Ca(PO3)2 phases were detected (JCPDS-ICDD—files 11–39). The partial spectrum, with a high angular resolution (0.005°) and counting time, of the 56-day sample clearly showed the Ca(PO3)2 peaks (Figure 6).
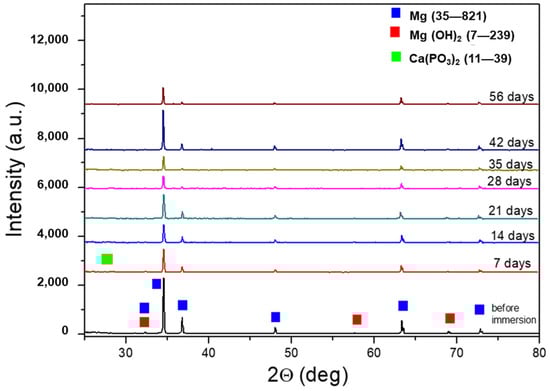
Figure 5.
XRD spectra of AZ31 samples after the immersion test. For comparison, the spectrum of AZ31 before the immersion test is also reported.
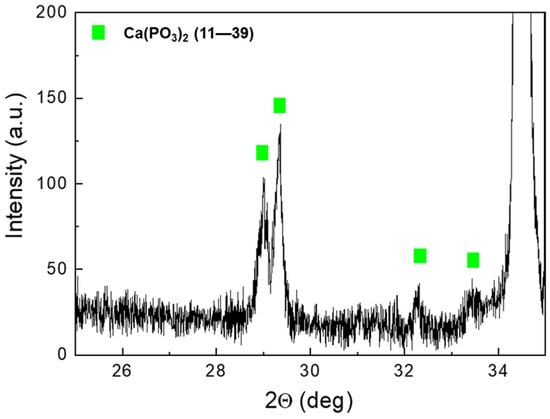
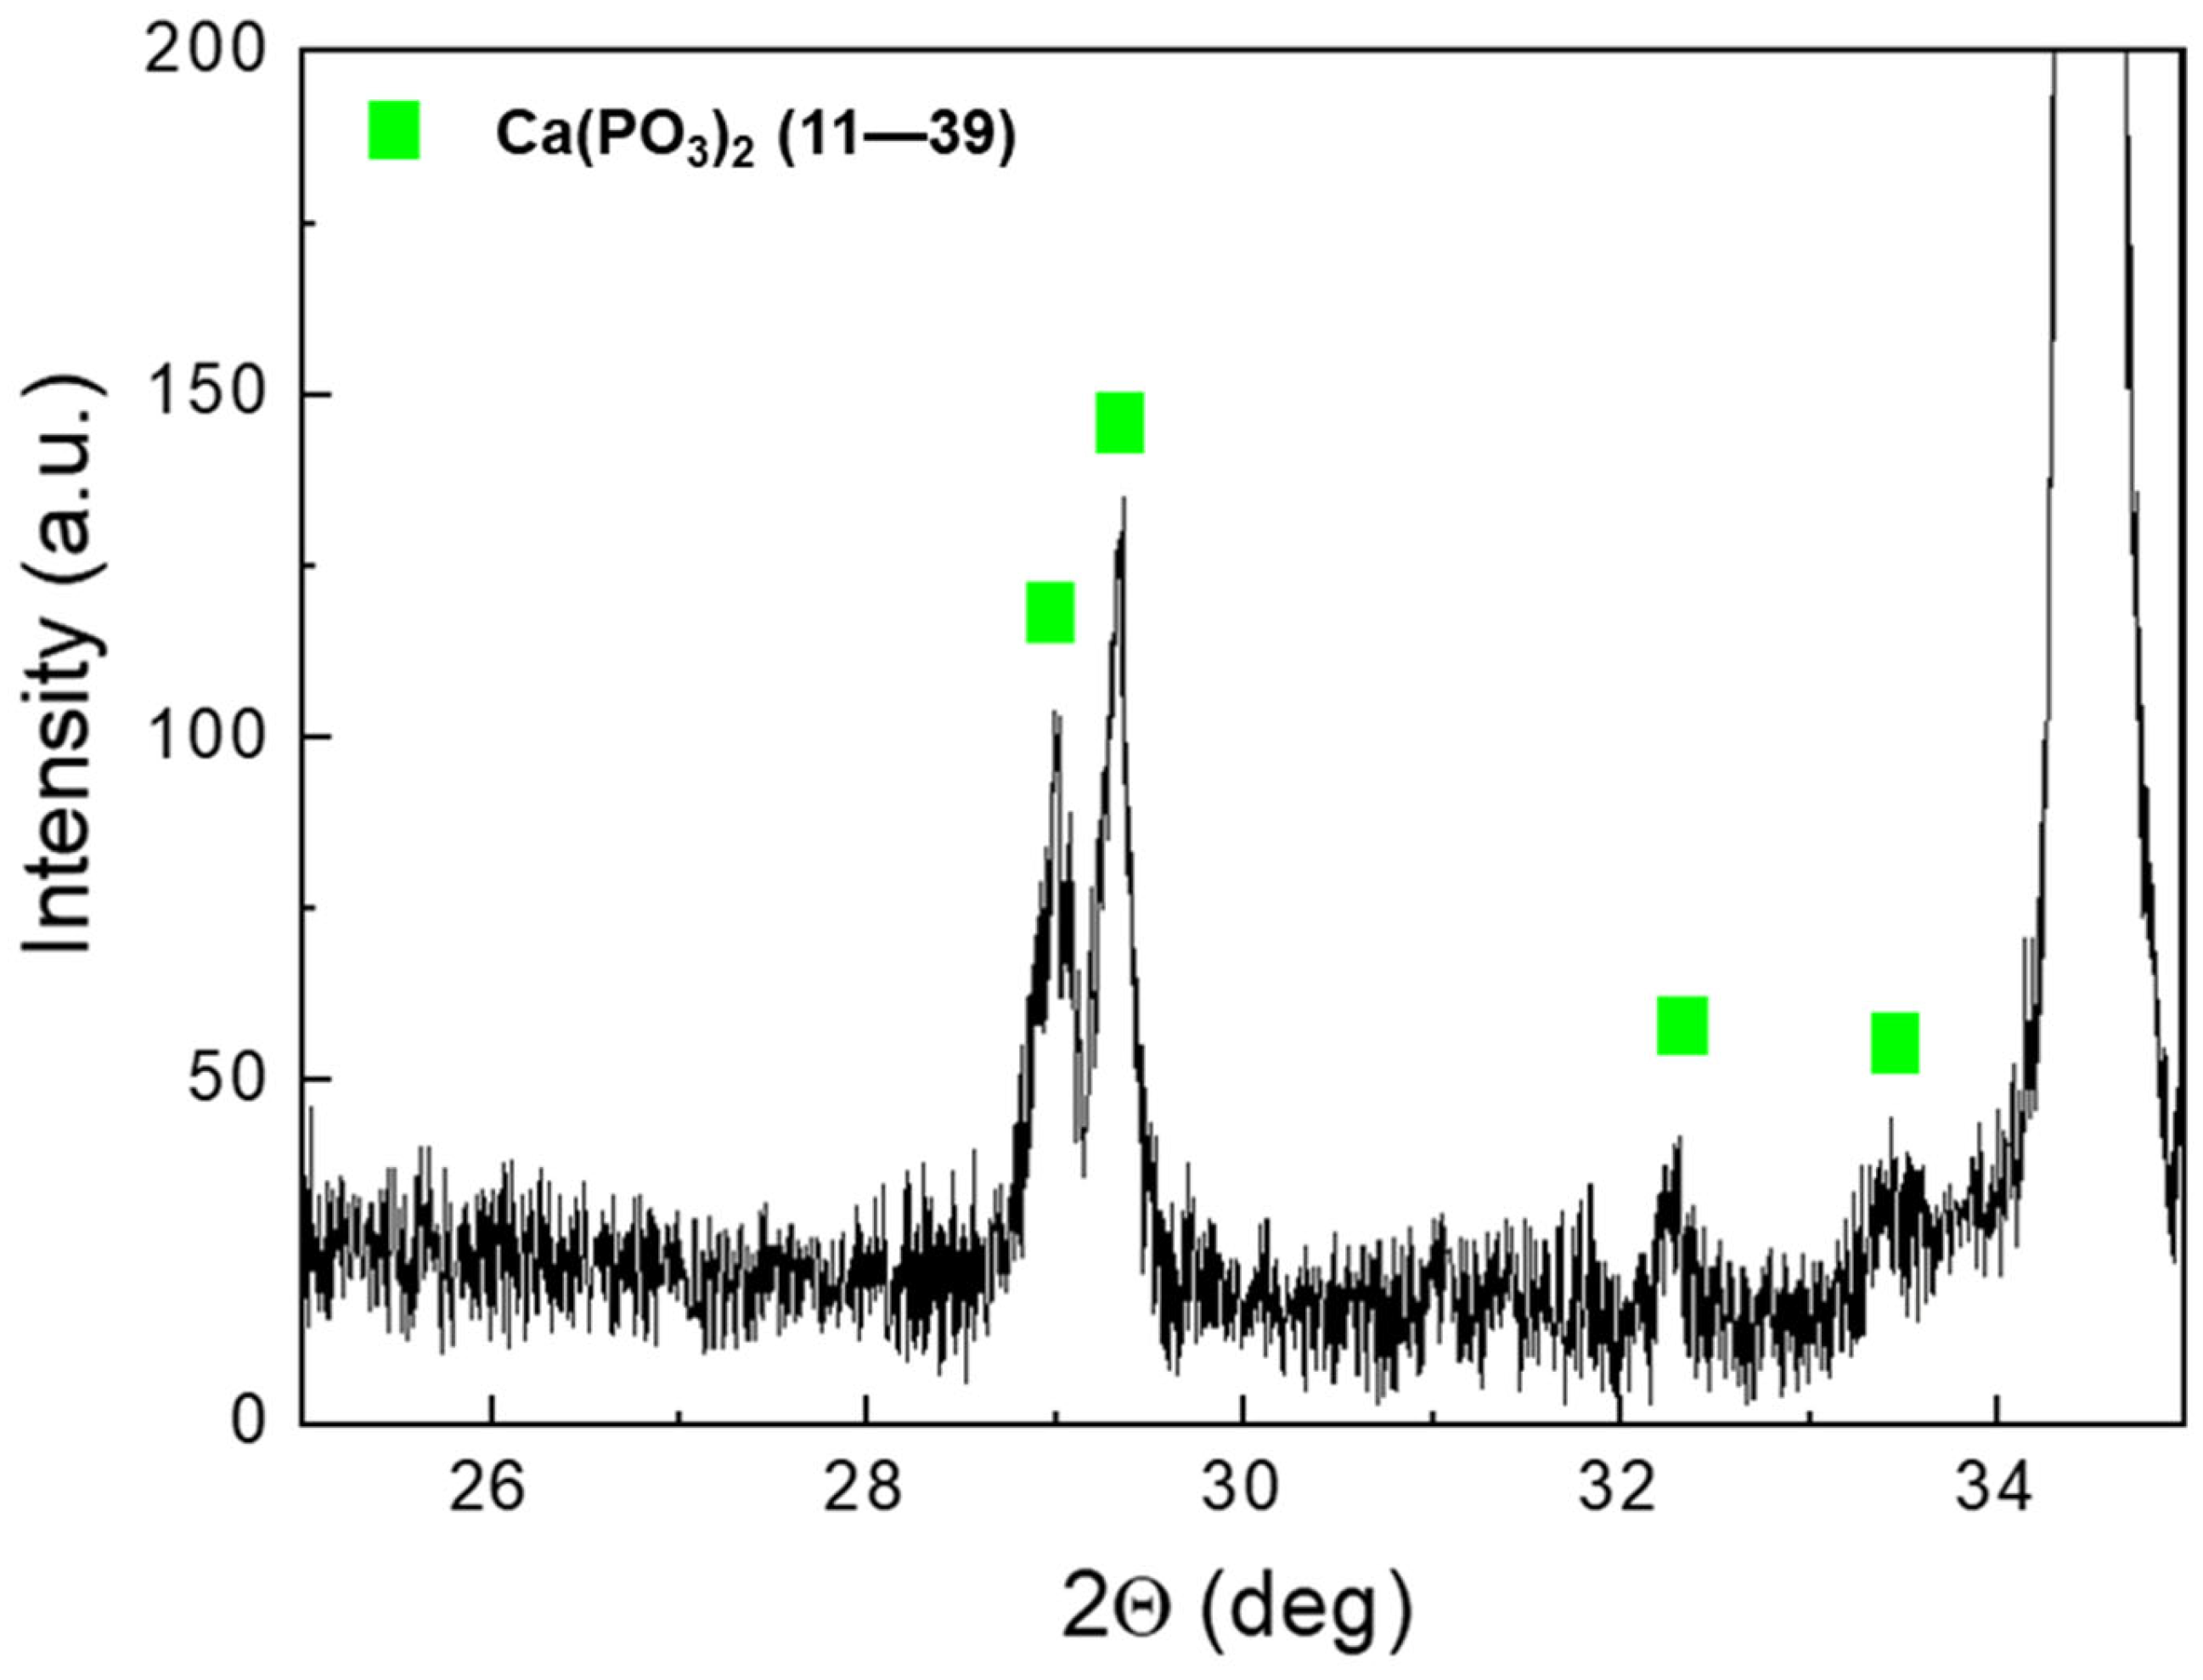
Figure 6.
AZ31 high-resolution spectrum after immersion for 56 days.
The different depth of analyses of EDX (~1 μm) and XRD (~50 μm) allowed the investigation of different layers from the outer part of the coating to the substrate. Since Ca3(PO4)2 only appeared with EDX, this compound formed a very thin layer on the thicker Ca(PO3)2, which was detected only with XRD.
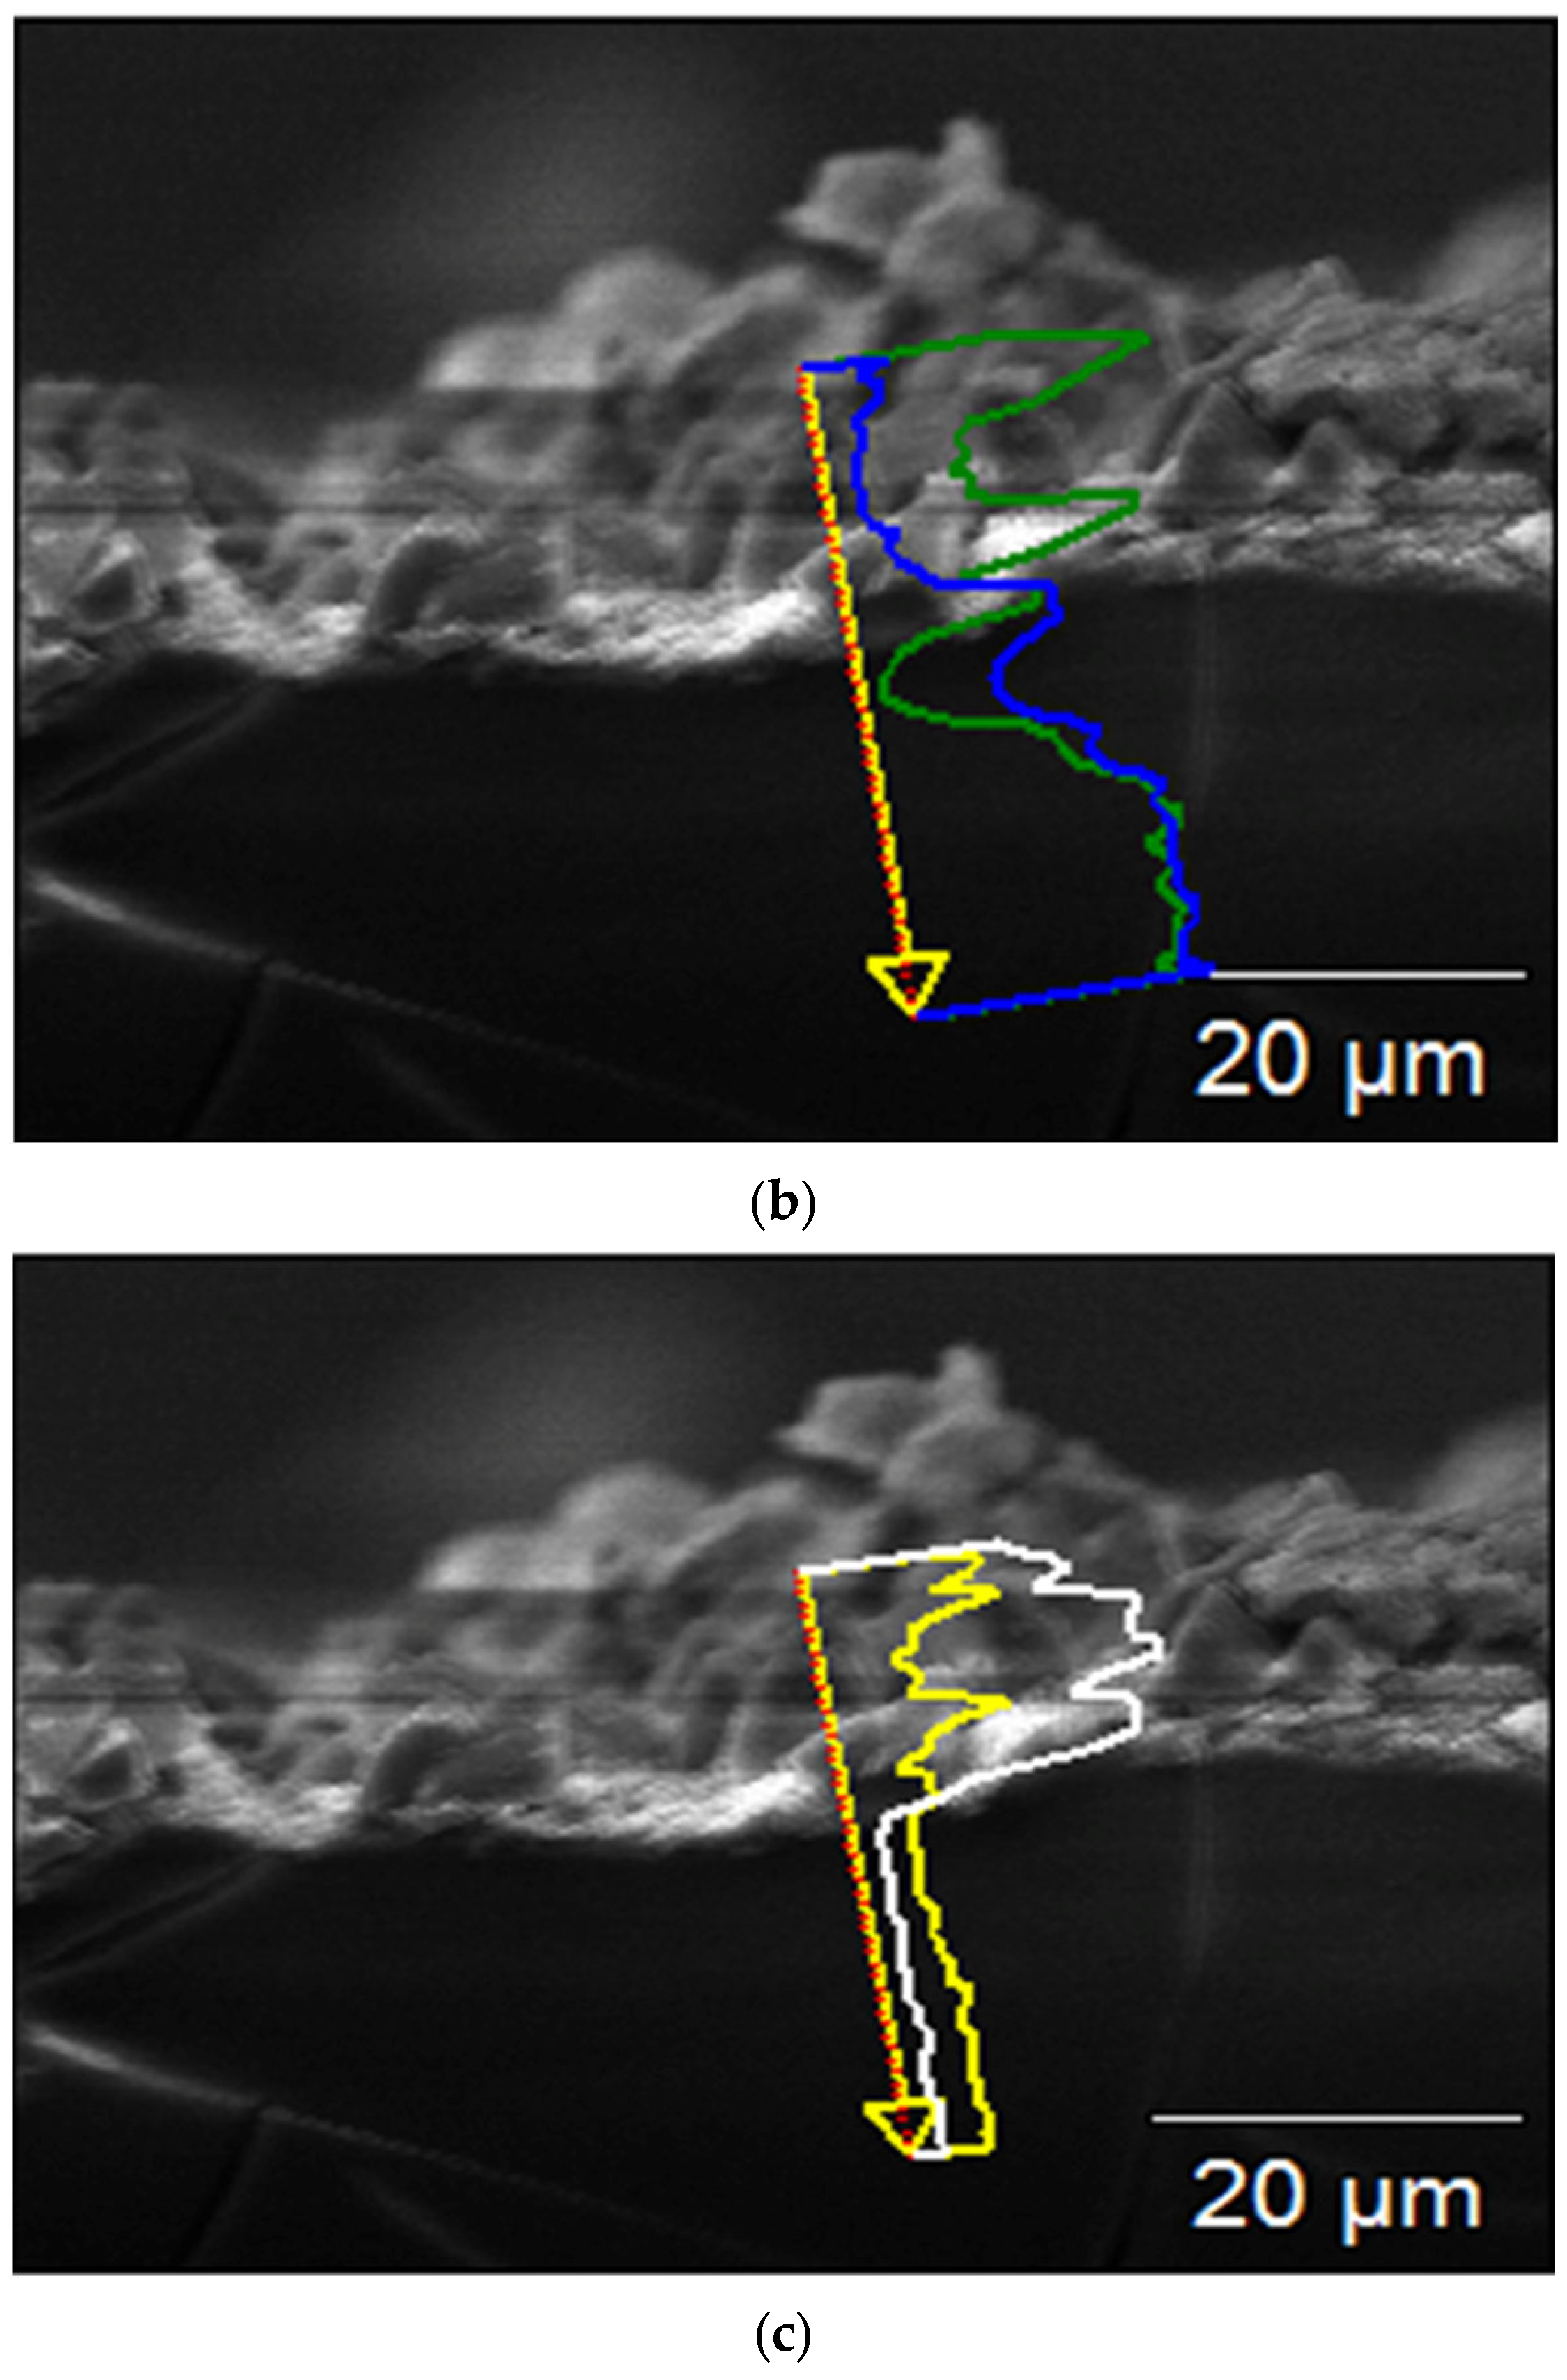
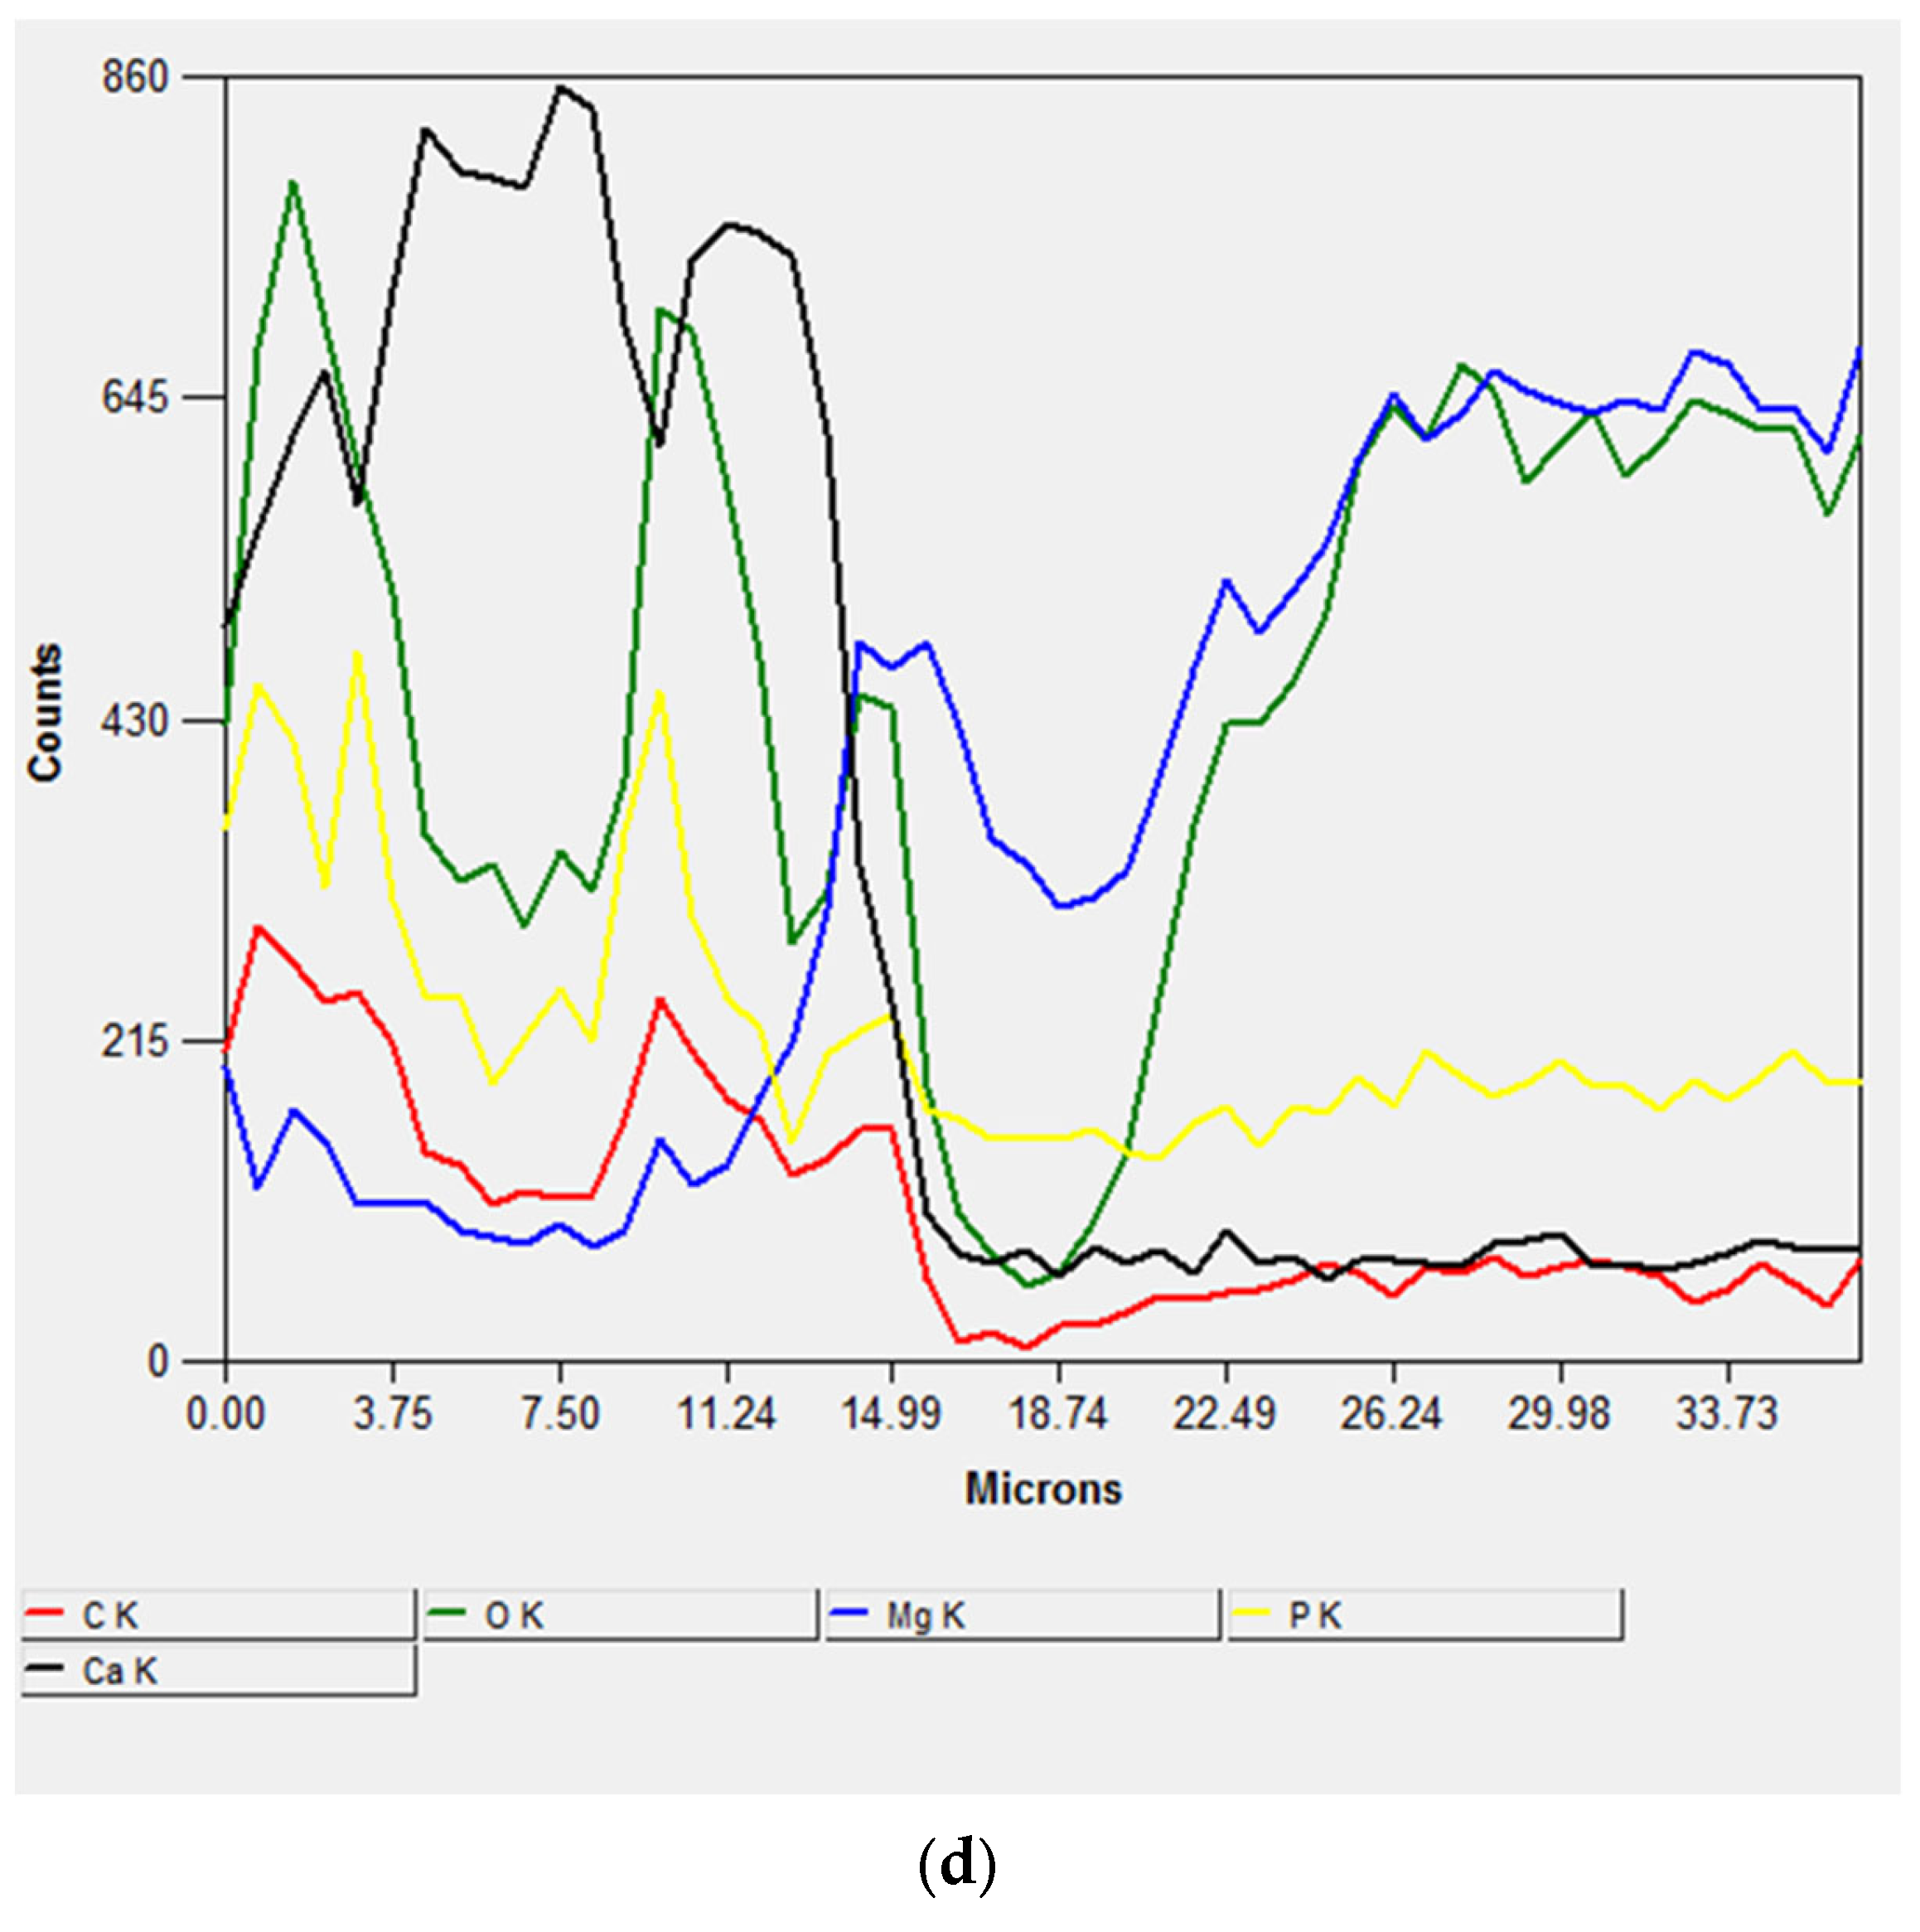
Figure 7 shows SEM images and linear EDX analyses of the cross-section of the sample immersed for 56 days, performed for studying the coating process. The thickness of the surface coating, composed of corrosion products, was ~60–65 μm (Figure 7a), and it consisted of two main layers: the inner one composed of Mg(OH)2, formed by the interaction between H2O in the atmosphere and in the SBF solution, and the outer one composed of calcium phosphate crystals that grew on the previously formed Mg(OH)2 (Figure 7b–d).
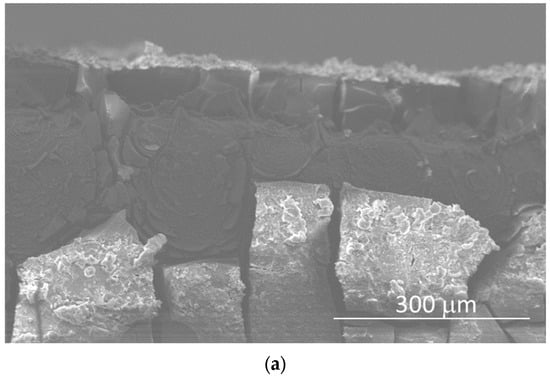
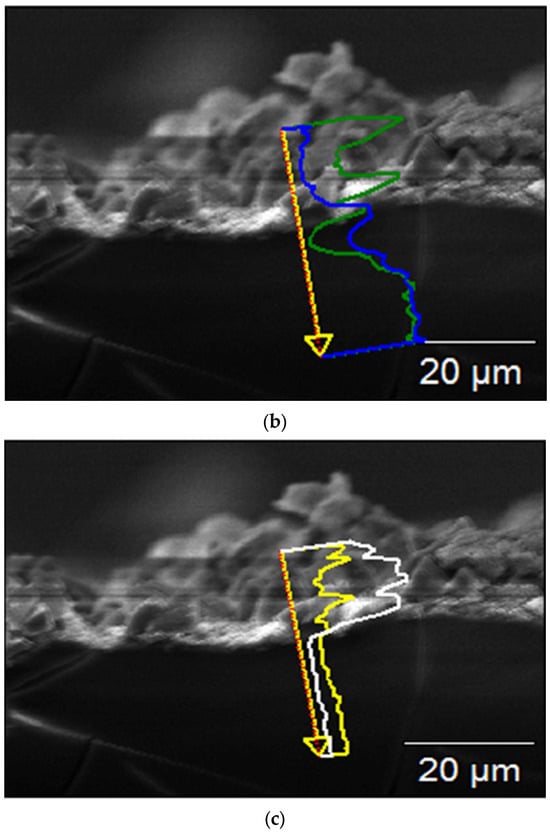
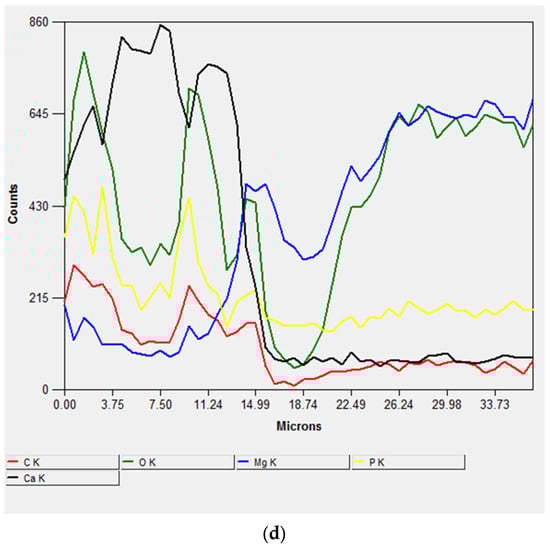
Figure 7.
SEM micrograph of the cross-section (a) and EDS spectra of the cross-section of the sample after 56 days of immersion (b–d).
The results of the XPS quantification of the samples’ surfaces are listed in Table 2.
Table 2.
XPS quantification of the samples after the immersion tests (small area of 300 × 300 µm2).
As can be observed, the atomic concentration of Mg on the surface increased with an increased immersion time of up to 35 days. After 42 days, the signal of Mg 1s disappeared, and the surface was covered with a layer of organic material from the SBF. It is worth mentioning that XPS is a very surface-sensitive technique able to provide information on the chemical composition from the first layer of the investigated material (less 10 nm); therefore, after increasing the immersion time, a layer of the organic material remained adhered to the Mg alloy, reducing the intensity of the Mg 1s signal. As for Mg, the O content also increased with an increase in the immersion time, following its own trend. This is comprehensible since the BE value of the Mg 1s signal corresponded to MgO, excluding the presence of Mg(OH)2 on the surface, as aforementioned. Therefore, combining the obtained results between the different characterization techniques, it is possible to conclude that a thin layer of MgO was formed on top of the thick Mg(OH)2 layer.
The presence of components like C-C, C-O-C, C-O, amine, ammonium, CaO, and organic and inorganic carbonates in the SBF suggested that they were deposited on the surface of the porous crystal layer.
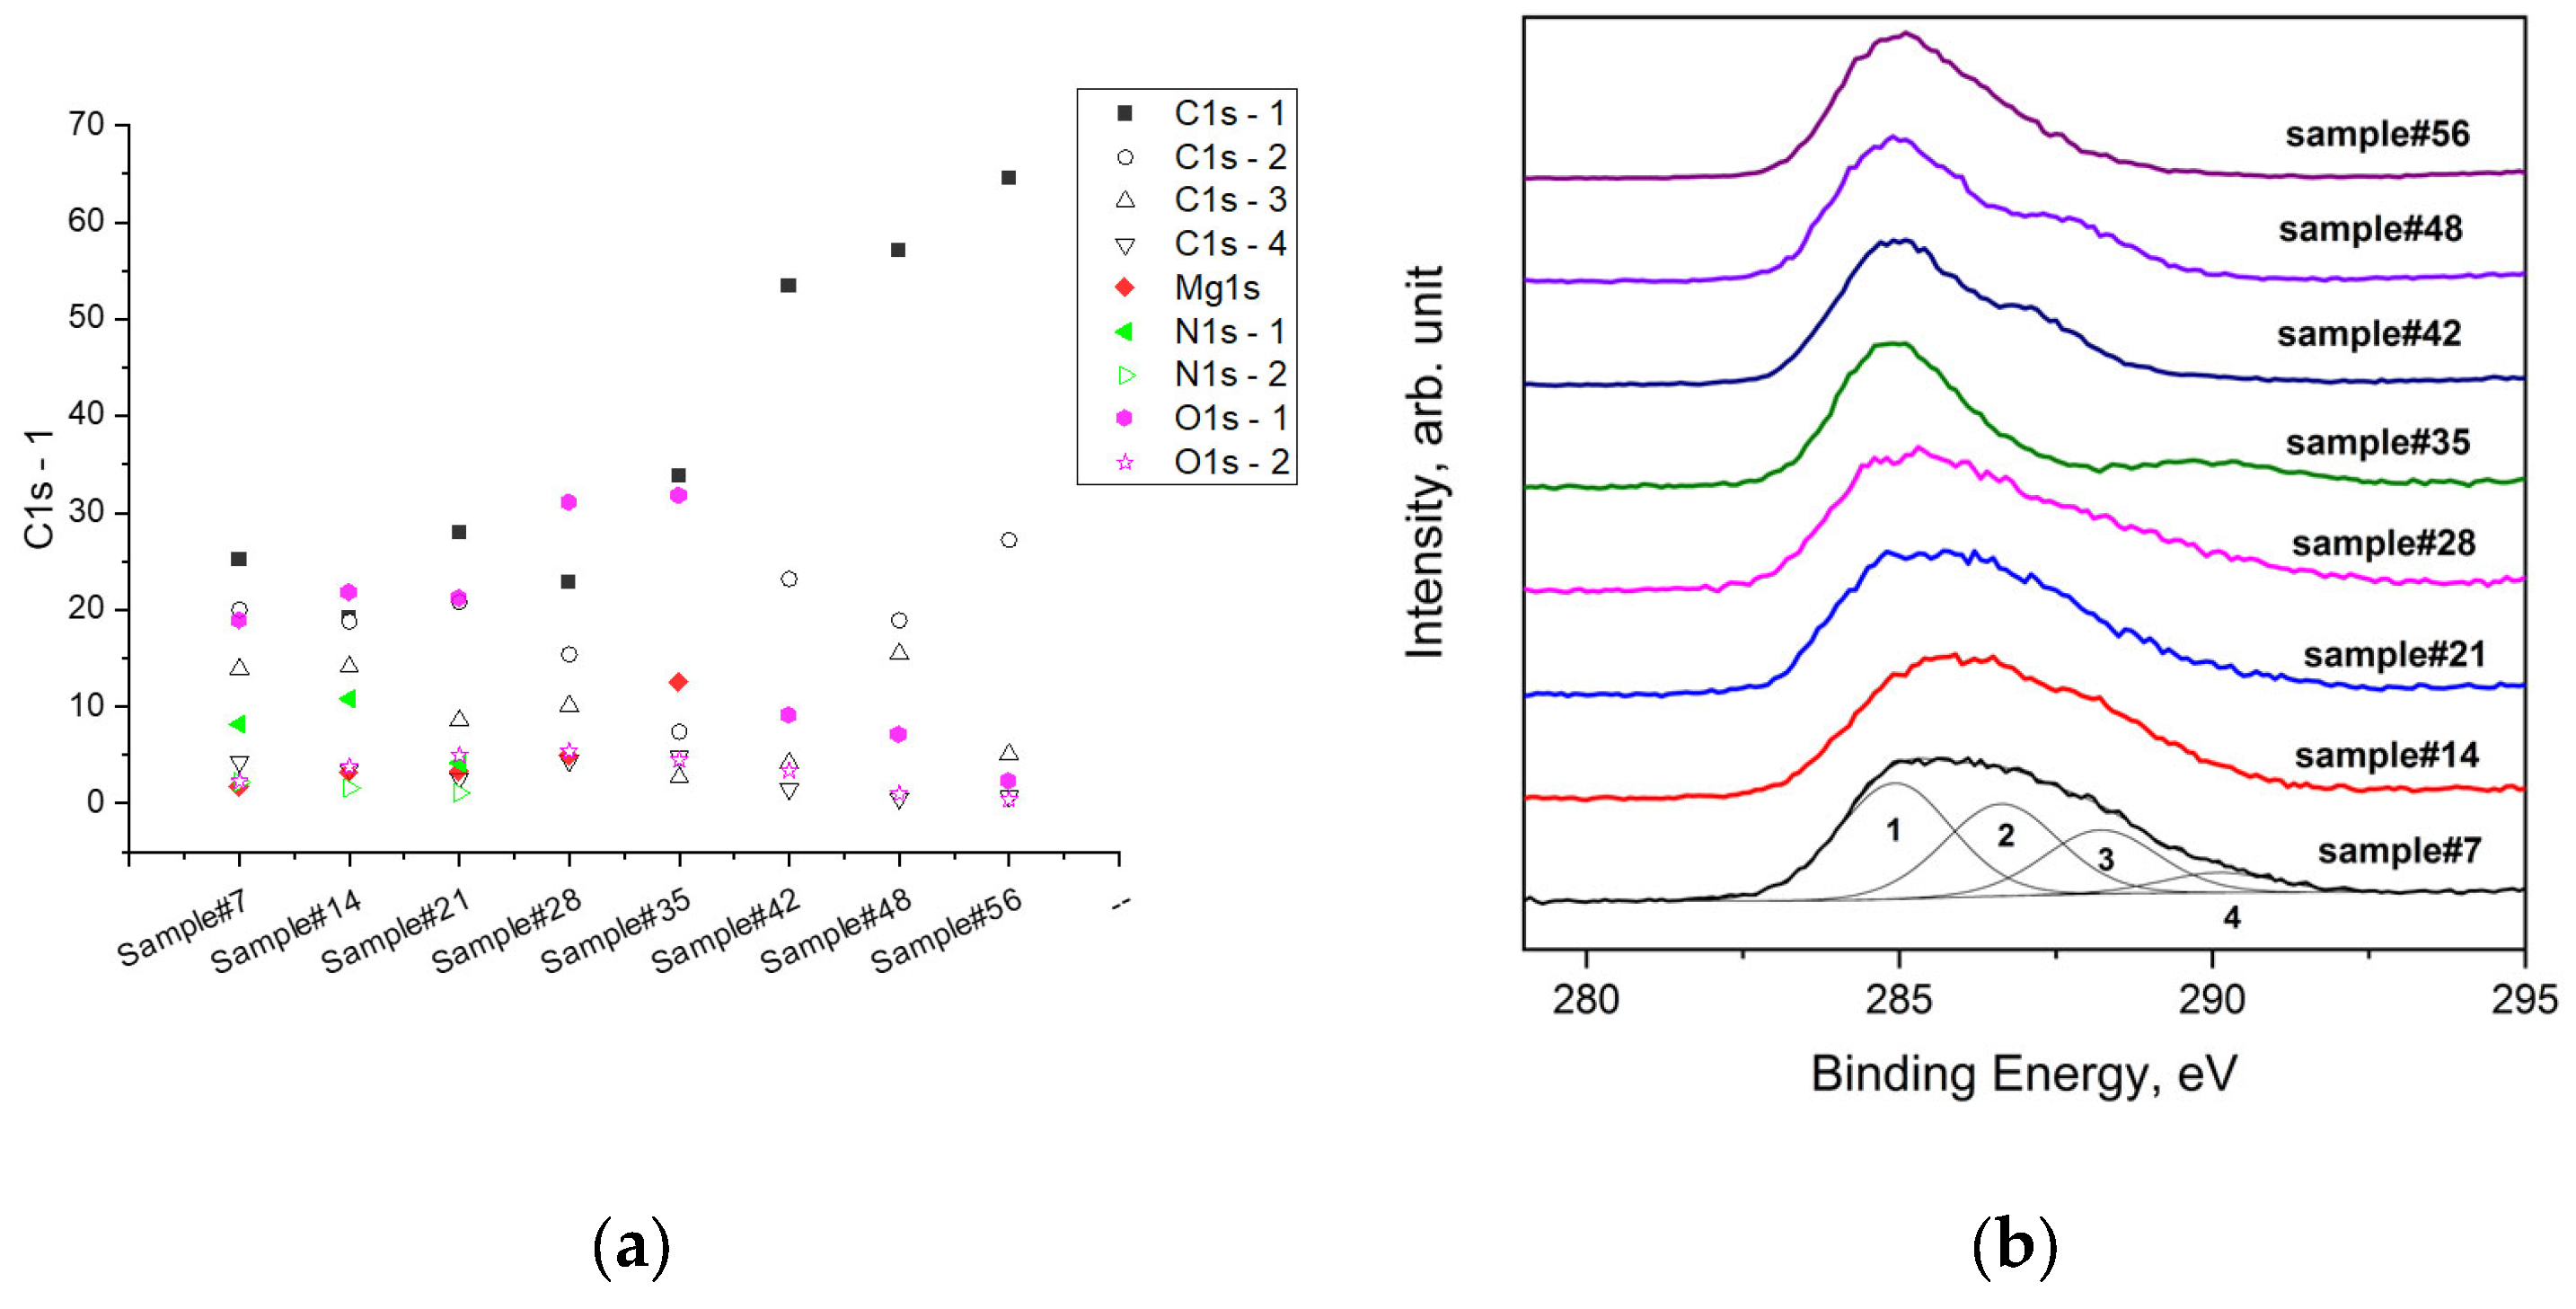
In contrast to the trend of Mg and O, the amount of C decreased with an increased immersion time. But after 35 days, as already mentioned, the carbon concentration increased, in particular, the C1s-1 (Figure 8) component of the C 1s signal, which was assigned to the C-C bond. With a longer immersion time, this component increased more, becoming the main one.
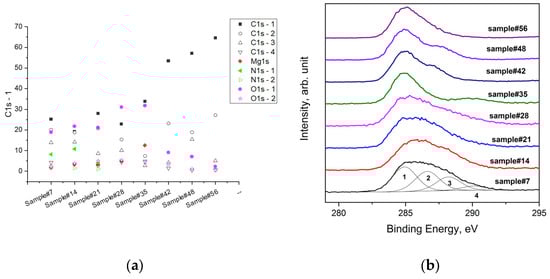
Figure 8.
Atomic compositions of the samples’ surfaces at different times of immersion in the SBF (a), and the main photoemission signals of C 1s for AZ31 alloy samples after immersion in the SBF and the synthetic peaks used for fitting the C 1s spectrum of sample#7 (b).
Figure 9 shows the concentration depth profile carried out on the sample immersed for 42 days. The profile evidences that a layer of C of about 50 nm was formed above the Mg alloy, and below the carbon layer, the presence of Mg in the form of MgO was found.
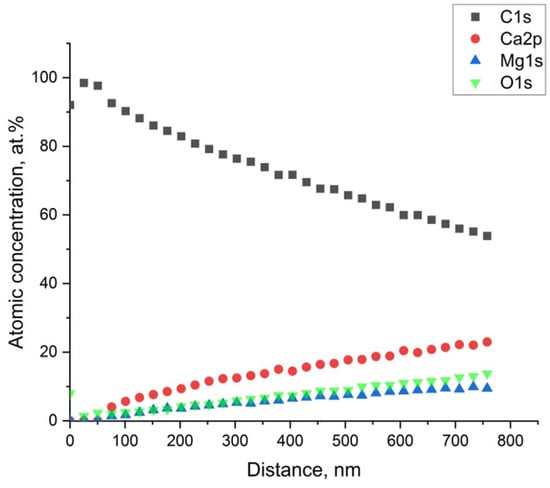
Figure 9.
Atomic concentration’s depth profile (Ar+ − 2 KeV) of the sample immersed for 42 days.
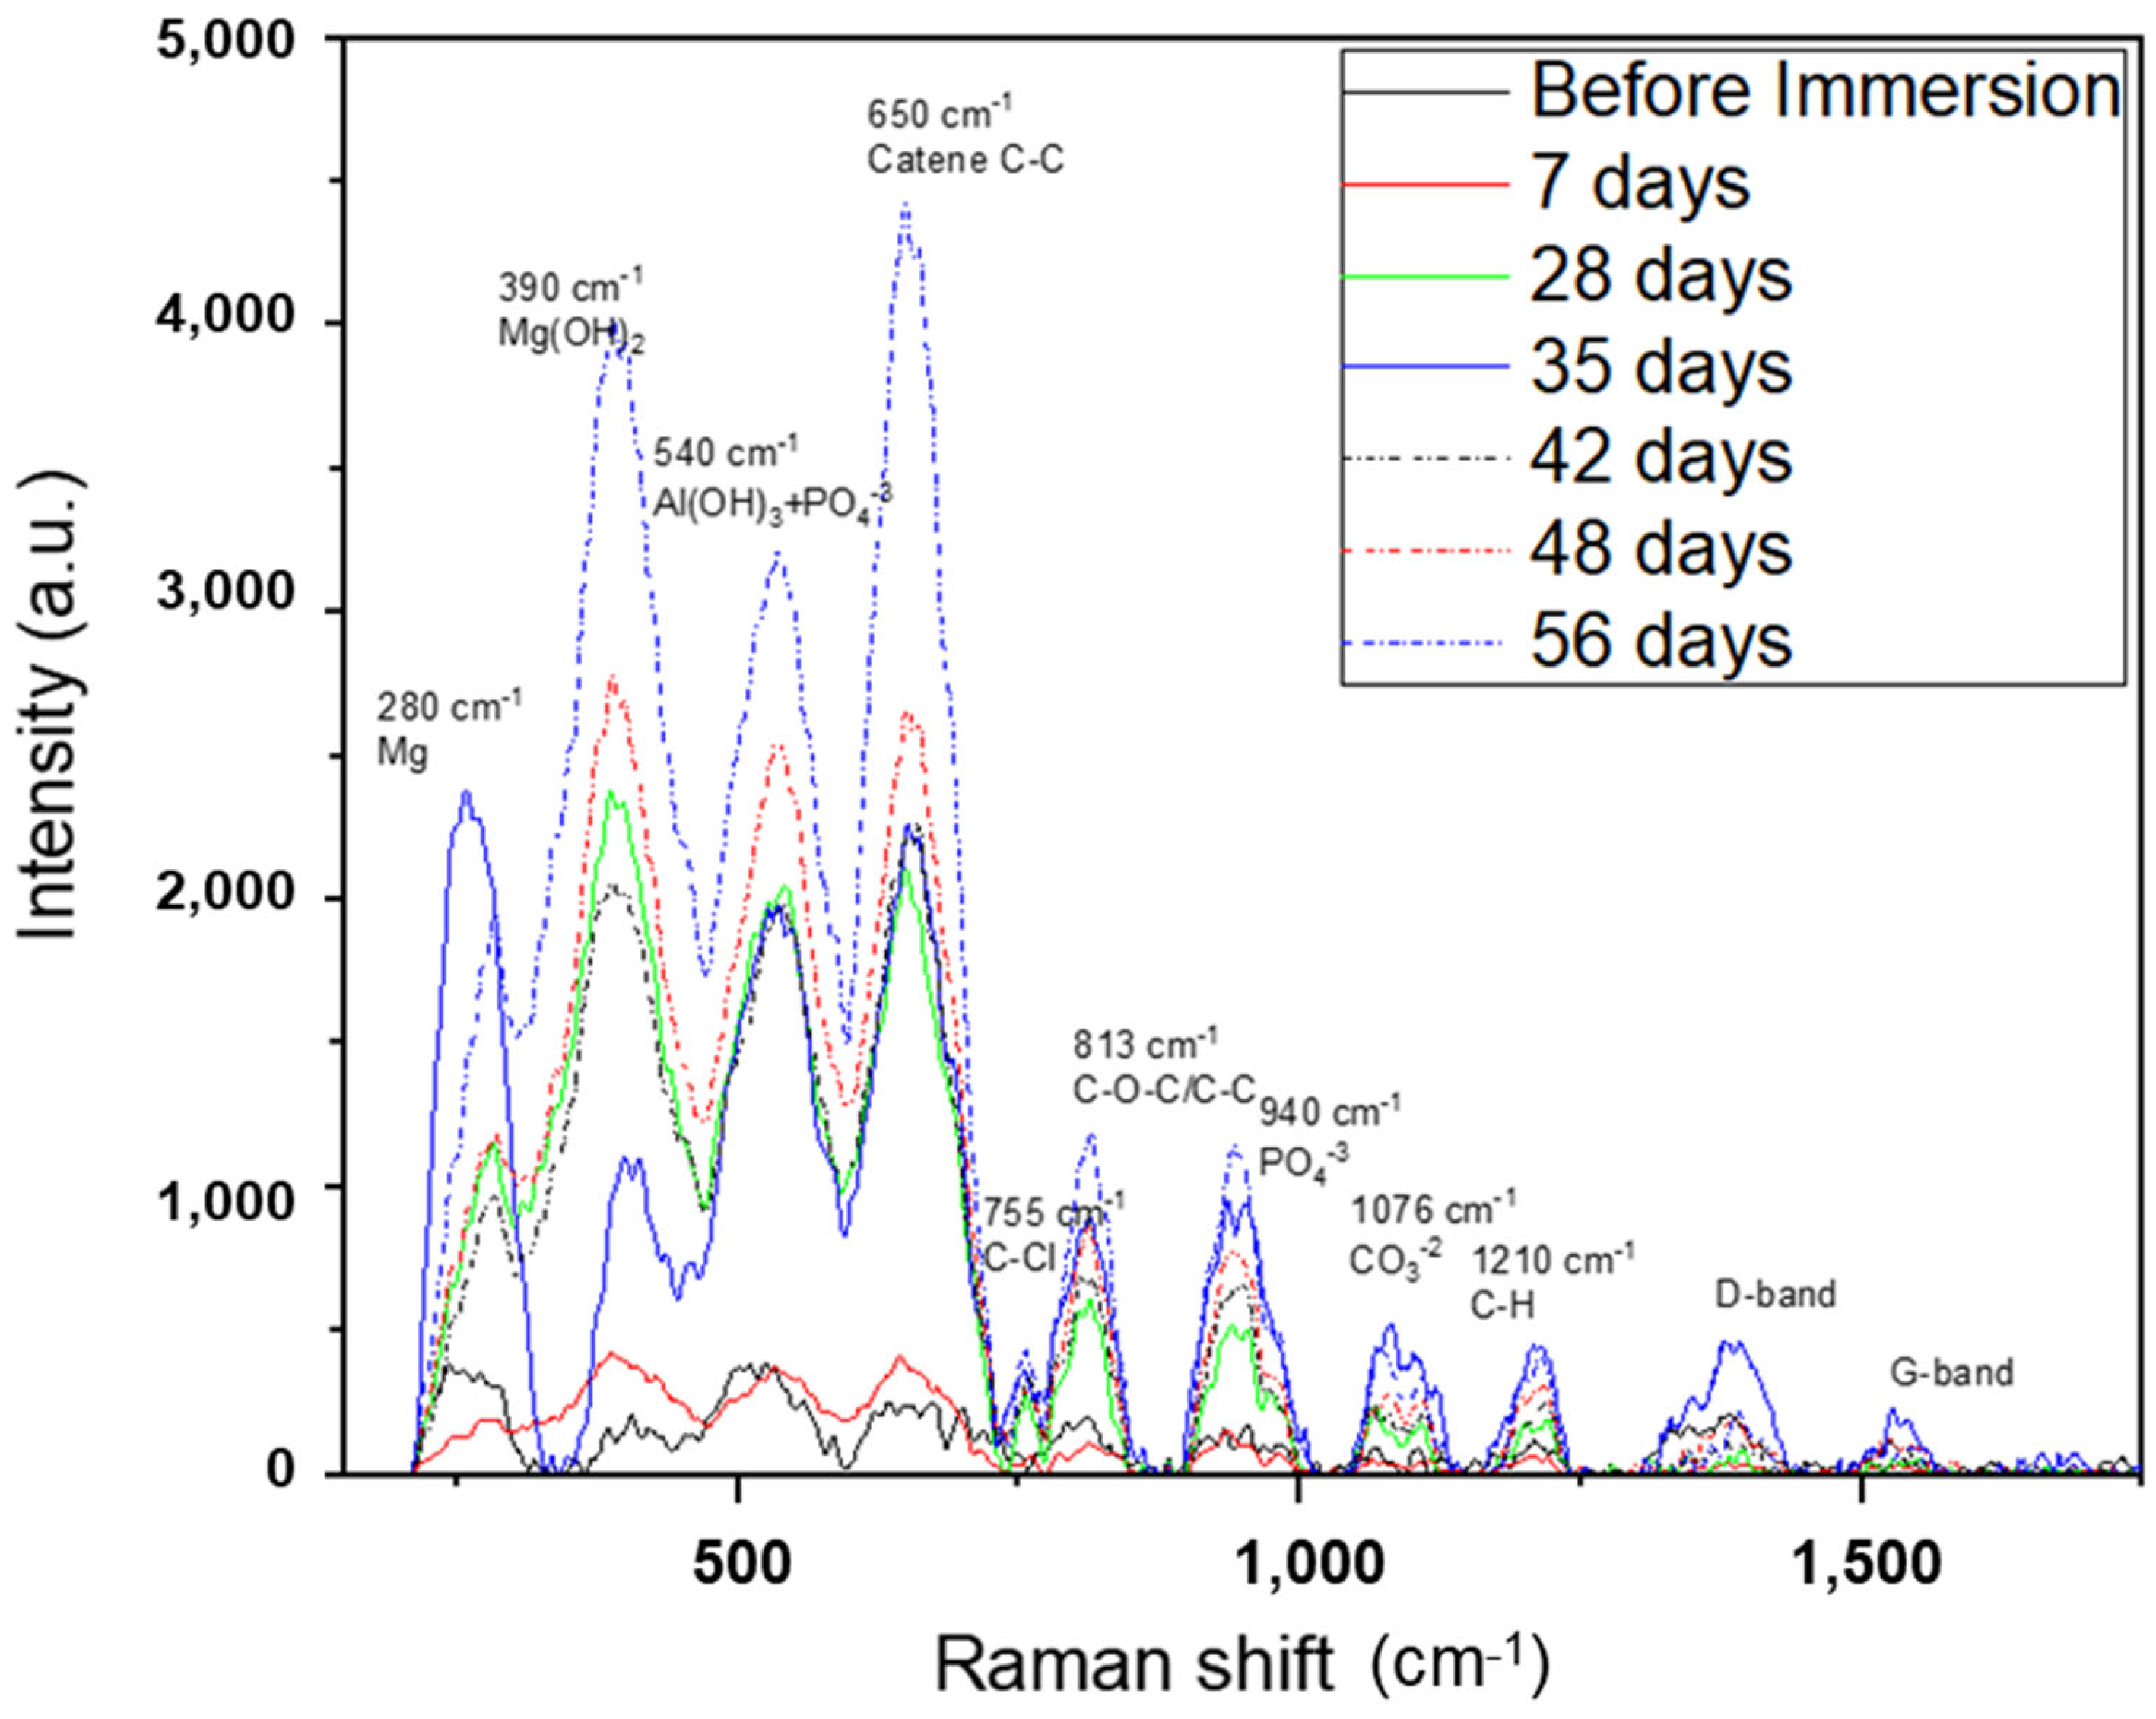
The Raman spectra of AZ31 samples before and after the immersion test are shown in Figure 10. It confirmed the presence of metallic Mg0 (280 cm−1), Mg(OH)2 (390 cm−1) [35], TCP (940 cm−1), and carbonates (1076 cm−1) [36,37] observed with XRD, EDS, and XPS analyses. It also showed the presence of Al(OH)3, probably formed by the aqueous environment [38]. Different peaks linked to the organic component of the SBF were observed after the immersion test. The peak at a Raman shift of 650 cm−1, which increased in intensity from the sample immersed for 7 days to that immersed for 56 days, was attributed to the presence of aliphatic chains of C-C [39]. Furthermore, C-O-C/C-C and C-H compounds were revealed (813 cm−1 and 1210 cm−1, respectively) [39]. These organic components were also detected with XPS spectroscopy, and their presence could be explained by the deposition of organic chains from the SBF on the porous surface of the TCP crystals. The same explanations could be given for the presence of the elements Na and Cl also revealed with the EDS technique. They originated from the traces of the inorganic components of SBF—NaCl, NaHCO3, and CaCl2.
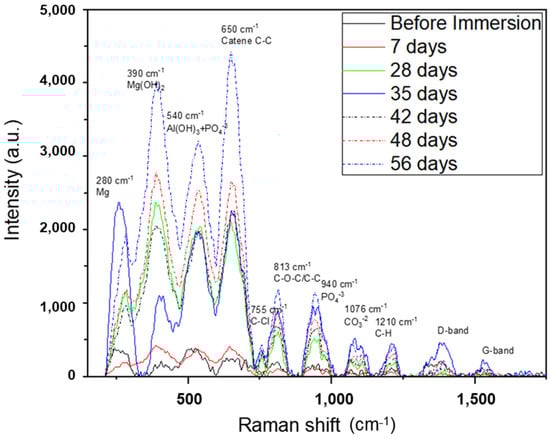
Figure 10.
Raman shift of AZ31 samples after the immersion test. For comparison, the spectrum of AZ31 before the immersion test is also reported.
In the areas not covered by the layer of corrosive products (detached due to the layer’s embrittlement after the drying process), the multiple crystal bases remained on the surface of the samples. Figure 11 shows the area without the surface layer of the sample after 56 days of immersion with two different magnifications. It can be evidenced that the crystals of Mg(OH)2 had spiral growths from screw dislocations, a phenomenon that takes place when, as in our case, the pH level is low enough to favor few nucleation centers and, as a consequence, large crystal growth. The presence of a single screw dislocation was sufficient to determine the direction of their growth [40].
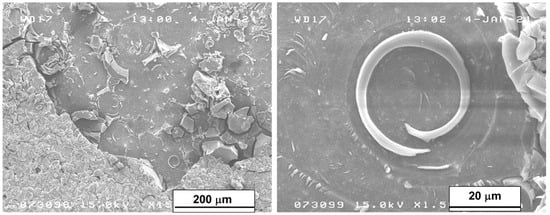
Figure 11.
SEM micrograph of the surface area of the sample immersed for 56 days without the corrosion product’s layer.
In this work, the immersion tests in the SBF of the AZ31 magnesium alloy samples were carried out for up to 56 days with the aim to characterize the morphologies of the samples’ surfaces and the chemical compositions of the corrosion products.
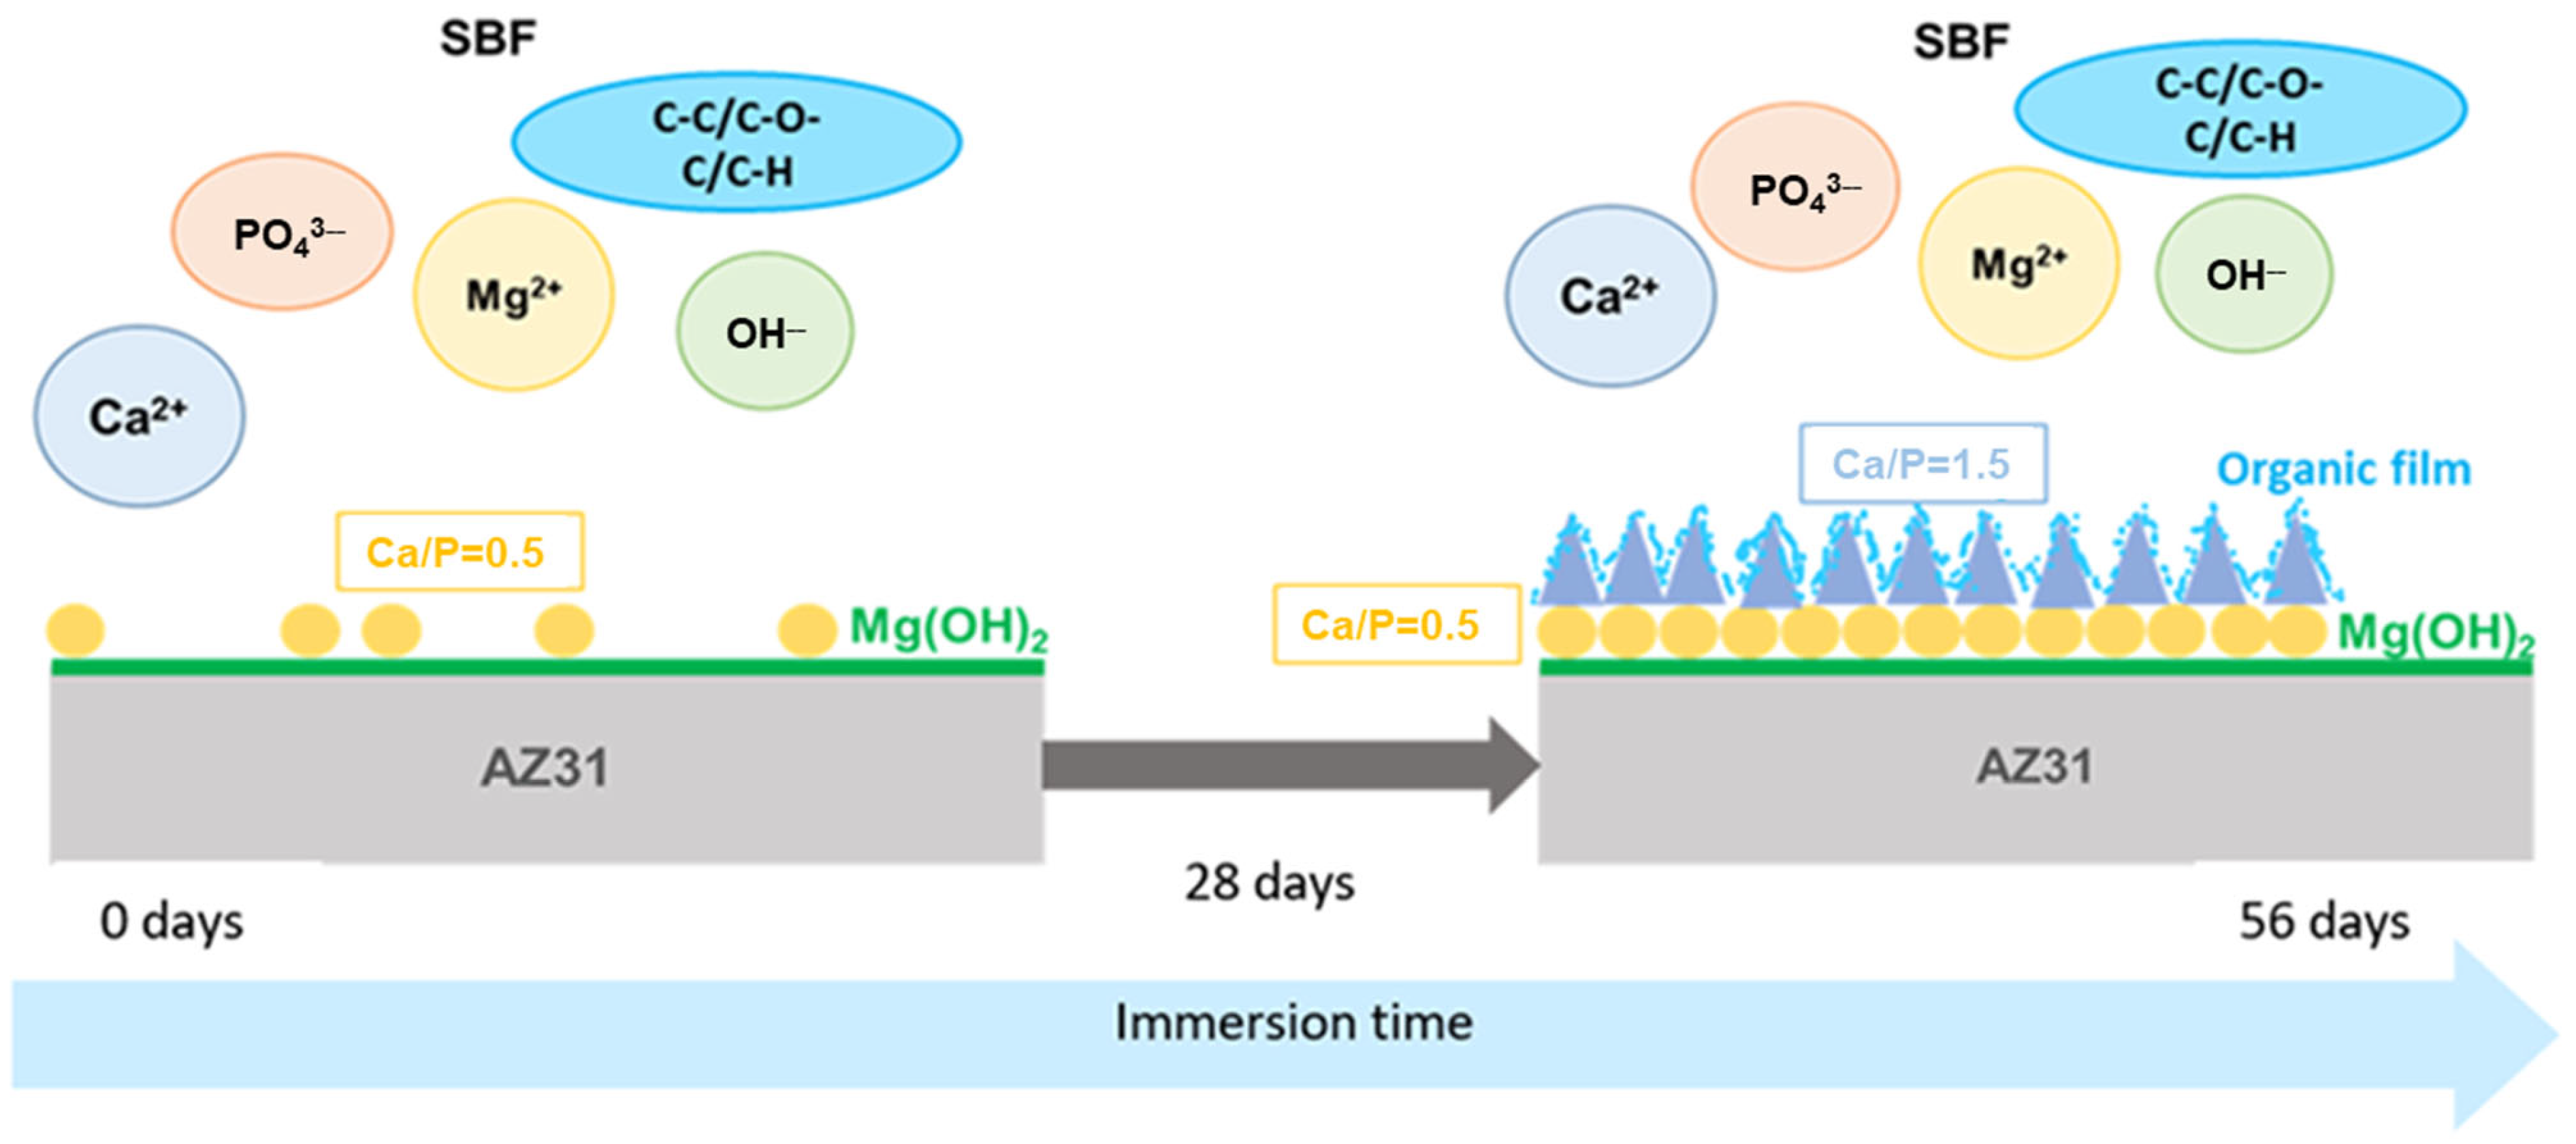
Based on the experimental results, the processes of the surface layer’s modification after the immersion of the samples in SBF was schematically reconstructed in Figure 12. It can be described as follows:
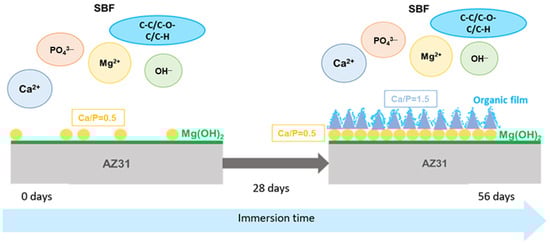
Figure 12.
The schematic representation of the corrosion process of the samples in the SBF.
- (1)
- In the beginning, the surface was covered by a thin layer of Mg(OH)2 that grew from screw dislocation sites.
- (2)
- From 7 to 28 days, Ca(PO3)2 crystals grew on the Mg hydroxide layer. Since the crystals did not homogeneously cover the entire surface, the biocorrosion rate was high.
- (3)
- The continuous release of Mg hydroxide in the solution gradually increased the pH of the SBF. The pH value and the higher Ca/P value of the SBF (Ca/P = 1.78) reached after 28 days favored the growth of crystals with higher Ca/P-Ca3(PO4)2, which covered the surface more homogeneously and decelerated the corrosion process. At the same time, the porous surface of the TCP crystals became covered in an organic film formed by the organic carbon group components of the SBF that protected the samples from further corrosion.
- (4)
- The slight presence of Al(OH)3, revealed by the tests, could have augmented the protective features of the surface layer.
4. Conclusions
The SEM, EDX, XRD, XPS, and Raman spectroscopy analyses and the measurement of weight loss gave the following results:
- (1)
- The maximal weight loss observed after 56 days of biofluid immersion was 4% of the total weight. After 28 days, the corrosion process slowed down.
- (2)
- This study allowed the determination of the surface transformation mechanism of the samples: in the first stage (0–28 days), the surface was covered by a thick layer of Mg(OH)2, covered with crystals of Ca(PO3)2, and the corrosion rate was high; in the second stage (28–56 days), the appearance of homogeneously distributed Ca3(PO4)2 crystals covered by a film formed by the organic carbon group components of the SBF significantly decelerated the corrosion process.
- (3)
- The Mg(OH)2 crystals had a typical spiral growth for growth from screw dislocation.
The results of the study help to better understand the behavior of AZ31 alloy in the specific conditions and times of use of femoral bone implants.
Author Contributions
Conceptualization, E.P. and G.C.; methodology, E.P., A.V., A.M., A.F., and C.M.; investigation, E.P., A.V., A.M., C.M., and F.L.; data curation, E.P., A.V., A.M., A.F., and A.P.; writing—original draft preparation, E.P.; writing—review and editing, E.P., A.V., A.M., A.F., C.M., F.L., A.P., and G.C. All authors have read and agreed to the published version of the manuscript.
Funding
This research received no external funding.
Data Availability Statement
Data are contained within the article.
Acknowledgments
The authors are grateful to Roberto Montanari of the Department of Industrial Engineering, University of Rome “Tor Vergata”, for the conceptualization and investigational support.
Conflicts of Interest
The authors declare no conflict of interest.
References
- Mantripragada, V.P.; Lecka-Czernik, B.; Ebraheim, N.A.; Jayasuriya, A.C. An overview of recent advances in designing orthopedic and craniofacial implants. J. Biomed. Mater. Res. Part B Appl. Biomater. 2013, 101, 3349–3364. [Google Scholar] [CrossRef] [PubMed]
- Ng, W.F.; Chiu, K.Y.; Cheng, F.T. Effect of pH on the in vitro corrosion rate of magnesium degradable implant material. Mater. Sci. Eng. C 2010, 30, 898–903. [Google Scholar] [CrossRef]
- Aspenberg, P. Silk, metal and bone: Why take implants out? Nat. Rev. Rheumatol. 2014, 10, 386–387. [Google Scholar] [CrossRef] [PubMed]
- Peustera, M.; Wohlseinb, P.; Brügmannb, M.; Ehlerdinga, M.; Seidlera, K.; Finka, C.; Brauerc, H.; Fischerc, A.; Hausdorfa, G. A novel approach to temporary stenting: Degradable cardiovascular stents produced from corrodible metal-results 6–18 months after implantation into New Zealand white rabbits. Heart 2001, 86, 563–569. [Google Scholar] [CrossRef] [PubMed]
- Feng, Q.; Zhang, D.; Xin, C.; Liu, X.; Lin, W.; Zhang, W.; Chen, S.; Sun, K. Characterization and in vivo evaluation of a bio-corrodible nitrided iron stent. J. Mater. Sci. Mater. Med. 2013, 24, 713–724. [Google Scholar] [CrossRef] [PubMed]
- Schinhammer, M.; Hänzi, A.C.; Löffler, J.F.; Uggowitzer, P.J. Design strategy for biodegradable Fe-based alloys for medical applications. Acta Biomater. 2010, 6, 1705–1713. [Google Scholar] [CrossRef]
- Vojtěch, D.; Kubásek, J.; Šerák, J.; Novák, P. Mechanical and corrosion properties of newly developed biodegradable Zn-based alloys for bone fixation. Acta Biomater. 2011, 7, 3515–3522. [Google Scholar] [CrossRef]
- Chen, Y.; Xu, Z.; Smith, C.; Sankar, J. Recent advances on the development of magnesium alloys for biodegradable implants. Acta Biomater. 2014, 10, 4561–4573. [Google Scholar] [CrossRef]
- Chen, K.; Dai, J.; Zhang, X. Improvement of corrosion resistance of magnesium alloys for biomedical applications. Corros. Rev. 2015, 33, 101–117. [Google Scholar] [CrossRef]
- Zhao, D.; Witte, F.; Lu, F.; Wang, J.; Li, J.; Qin, L. Current status on clinical applications of magnesium-based orthopaedic implants: A review from clinical translational perspective. Biomaterials 2017, 112, 287–302. [Google Scholar] [CrossRef]
- Ramirez, O.; Ceccarelli, M.; Russo, M.; Torres-San-Miguel, C.R.; Urriolagoitia-Calderon, G. Experimental Dynamic Tests of Rib Implants. Adv. Ital. Mech. Sci. 2019, 2019, 353–361. [Google Scholar]
- Arrequin, J.L.; Montanari, R.; Ceccarelli, M.; Ambrogi, V.; Richetta, M.; Torres-San-Miguel, C.R.; Varone, A. Design solutions from material selection for rib fixators. Mater. Sci. Forum 2021, 1016, 303–308. [Google Scholar]
- Witte, F.; Fischer, J.; Nellesen, J.; Crostack, H.-A.; Kaese, V.; Pisch, A.; Beckmann, F.; Windhagen, H. In vitro and in vivo corrosion measurements of magnesium alloys. Biomaterials 2006, 27, 1013–1018. [Google Scholar] [CrossRef] [PubMed]
- Shuai, C.; Li, S.; Peng, S.; Feng, P.; Lai, Y.; Gao, C. Biodegradable metallic bone implants. Mater. Chem. Front. 2019, 3, 544–562. [Google Scholar] [CrossRef]
- Pompa, L.; Rahman, Z.U.; Munoz, E.; Haider, W. Surface characterization and cytotoxicity response of biodegradable magnesium alloys. Mater. Sci. Eng. C 2015, 49, 761–768. [Google Scholar] [CrossRef] [PubMed]
- Istrate, B.; Munteanu, C.; Bălțatu, M.-S.; Cimpoeșu, R.; Ioanid, N. Microstructural and Electrochemical Influence of Zn in MgCaZn Biodegradable Alloys. Materials 2023, 16, 2487. [Google Scholar] [CrossRef] [PubMed]
- Xin, Y.; Hu, T.; Chu, P.K. In vitro studies of biomedical magnesium alloys in a simulated physiological environment: A review. Acta Biomater. 2011, 7, 1452–1459. [Google Scholar] [CrossRef] [PubMed]
- Chen, Y.; Dou, J.; Yu, H.; Chen, C. Degradable magnesium-based alloys for biomedical applications: The role of critical alloying elements. J. Biomater. Appl. 2019, 33, 1348–1372. [Google Scholar] [CrossRef]
- Alvarez-Lopez, M.; Pereda, M.D.; del Valle, J.; Fernandez-Lorenzo, M.; Garcia-Alonso, M.C.; Ruano, O.A.; Escudero, M.L. Corrosion behaviour of AZ31 magnesium alloy with different grain sizes in simulated biological fluids. Acta Biomater. 2010, 6, 1763–1771. [Google Scholar] [CrossRef]
- Feng, H.; Liu, S.; Du, Y.; Lei, T.; Zeng, R.; Yuan, T. Effect of the second phases on corrosion behavior of the Mg–Al–Zn alloys. J. Alloys Compd. 2017, 695, 2330–2338. [Google Scholar] [CrossRef]
- Jiang, H.; Li, F.; Zeng, X. Microstructural characteristics and deformation of magnesium alloy AZ31 produced by continuous variable cross-section direct extrusion. J. Mater. Sci. Technol. 2017, 33, 573–579. [Google Scholar] [CrossRef]
- Anuradha, J.; Mitun, D.; Vamsi, K.B. Effect of heat treatment on microstructure, mechanical, corrosion and biocompatibility of Mg-Zn-Zr-Gd-Nd alloy. J. Alloys Compd. 2020, 821, 153462. [Google Scholar]
- Linyuan, H.; Xuan, L.; Feng, X.; Chenglin, C.; Jing, B. Biocorrosion behavior of micro-arc-oxidized AZ31 magnesium alloy in different simulated dynamic physiological environments. Surf. Coat. Technol. 2019, 361, 240–248. [Google Scholar]
- Zhicheng, L.; Zhenzhen, S.; Xian, W.; Qing, Z. Corrosion resistance and cytotoxicity of AZ31 magnesium alloy with N+ ion implantation. Mater. Technol. 2019, 34, 730–736. [Google Scholar]
- Peron, M.; Skaret, P.C.; Fabrizi, A.; Varone, A.; Montanari, R.; Roven, H.J.; Ferro, P.; Berto, F.; Torgersen, J. The effect of Equal Channel Angular Pressing on the stress corrosion cracking susceptibility of AZ31 alloy in simulated body fluid. J. Mech. Behav. Biomed. Mater. 2020, 106, 103724. [Google Scholar] [CrossRef] [PubMed]
- Mohajernia, S.; Pour-Ali, S.; Hejazi, S.; Saremi, M.; Kiani-Rashid, A.-R. Hydroxyapatite coating containing multi-walled carbon nanotubes on AZ31 magnesium: Mechanical-electrochemical degradation in a physiological environment. Ceram. Int. 2018, 44, 8297–8305. [Google Scholar] [CrossRef]
- Zeng, R.C.; Hu, Y.; Guan, S.K.; Cui, H.-Z.; Han, E.-H. Corrosion of magnesium alloy AZ31: The influence of bicarbonate, sulphate, hydrogen phosphate and dihydrogen phosphate ions in saline solution. Corros. Sci. 2014, 86, 171–182. [Google Scholar] [CrossRef]
- Wang, L.; Shinohara, T.; Zhang, B.P. Influence of chloride, sulfate and bicarbonate anions on the corrosion behavior of AZ31 magnesium alloy. J. Alloys Compd. 2010, 496, 500–507. [Google Scholar] [CrossRef]
- Walker, J.; Shadanbaz, S.; Kirkland, N.T.; Stace, E.; Woodfield, T.; Staiger, M.P.; Dias, G.J. Magnesium alloys: Predicting in vivo corrosion with in vitro immersion testing. J. Biomed. Mater. Res. Part B Appl. Biomater. 2012, 100, 1134–1141. [Google Scholar] [CrossRef]
- Ambrogi, V.; Bolli, E.; Ceccarelli, M.; Kaciulis, S.; Mezzi, A.; Montanari, R.; Pakhomova, E.; Richetta, M.; Varone, A. Surface modifications of biodegradable AZ31 alloy after immersion in physiological solution. Surf. Interface Anal. 2023, 55, 474–479. [Google Scholar] [CrossRef]
- JCPDS-International Centre for Diffraction Data. Available online: https://www.icdd.com (accessed on 29 November 2023).
- Yang, L.; Zhang, E. Biocorrosion behavior of magnesium alloy in different simulated fluids for biomedical application. Mater. Sci. Eng. C 2009, 29, 1691–1696. [Google Scholar] [CrossRef]
- Gu, X.N.; Zheng, Y.F.; Chen, L.J. Influence of artificial biological fluid composition on the biocorrosion of potential orthopedic Mg–Ca, AZ31, AZ91 alloys. Biomed. Mater. 2009, 4, 065011. [Google Scholar] [CrossRef] [PubMed]
- Shadanbaz, S.; Dias, G.J. Calcium phosphate coatings on magnesium alloys for biomedical applications: A review. Acta Biomater. 2012, 8, 20–30. [Google Scholar] [CrossRef] [PubMed]
- Omar, S.A.; Ballarre, J.; Schreiner, W.H.; Ceré, S.M. Micro Raman and XPS surface analysis to understand the electrochemical behaviour of AZ31 and AZ91 magnesium alloys as temporary implant materials. Mater. Today Commun. 2022, 31, 103557. [Google Scholar] [CrossRef]
- Khan, A.F.; Awais, M.; Khan, A.S.; Tabassum, S.; Chaudhry, A.A.; Rehman, I.U. Raman Spectroscopy of Natural Bone and Synthetic Apatites. Appl. Spectrosc. Rev. 2013, 48, 329–355. [Google Scholar] [CrossRef]
- Takeuchi, H.; Ohtsuka, Y.; Harada, I. Ultraviolet Resonance Raman Study on the Binding Mode of Enkephalin to Phospholipid Membranes. J. Am. Chem. Soc. 1992, 114, 5321–5328. [Google Scholar] [CrossRef]
- Mindivan, H.; Kayali, E.S.; Cimenoglu, H. Tribological behavior of squeeze cast aluminum matrix composites. Wear 2008, 265, 645–654. [Google Scholar] [CrossRef]
- Lin-Vien, D.; Colthup, N.B.; Fateley, W.G.; Grasselli, J.G. The Handbook of Infrared and Raman Characteristic Frequencies of Organic Molecules; Elsevier: Amsterdam, The Netherlands, 1991; pp. 83–90. [Google Scholar]
- Phillips, V.A.; Kolbe, J.L.; Opperhauser, H. Effect of pH on the growth of Mg(OH)2 crystals in an aqueous environment at 60 °C. J. Cryst. Growth 1977, 41, 228–234. [Google Scholar] [CrossRef]


Disclaimer/Publisher’s Note: The statements, opinions and data contained in all publications are solely those of the individual author(s) and contributor(s) and not of MDPI and/or the editor(s). MDPI and/or the editor(s) disclaim responsibility for any injury to people or property resulting from any ideas, methods, instructions or products referred to in the content. |
© 2023 by the authors. Licensee MDPI, Basel, Switzerland. This article is an open access article distributed under the terms and conditions of the Creative Commons Attribution (CC BY) license (https://creativecommons.org/licenses/by/4.0/).