

Study of Microstructure Regulation and In Situ Tensile Performance of Ni-Al Films


Abstract
:1. Introduction
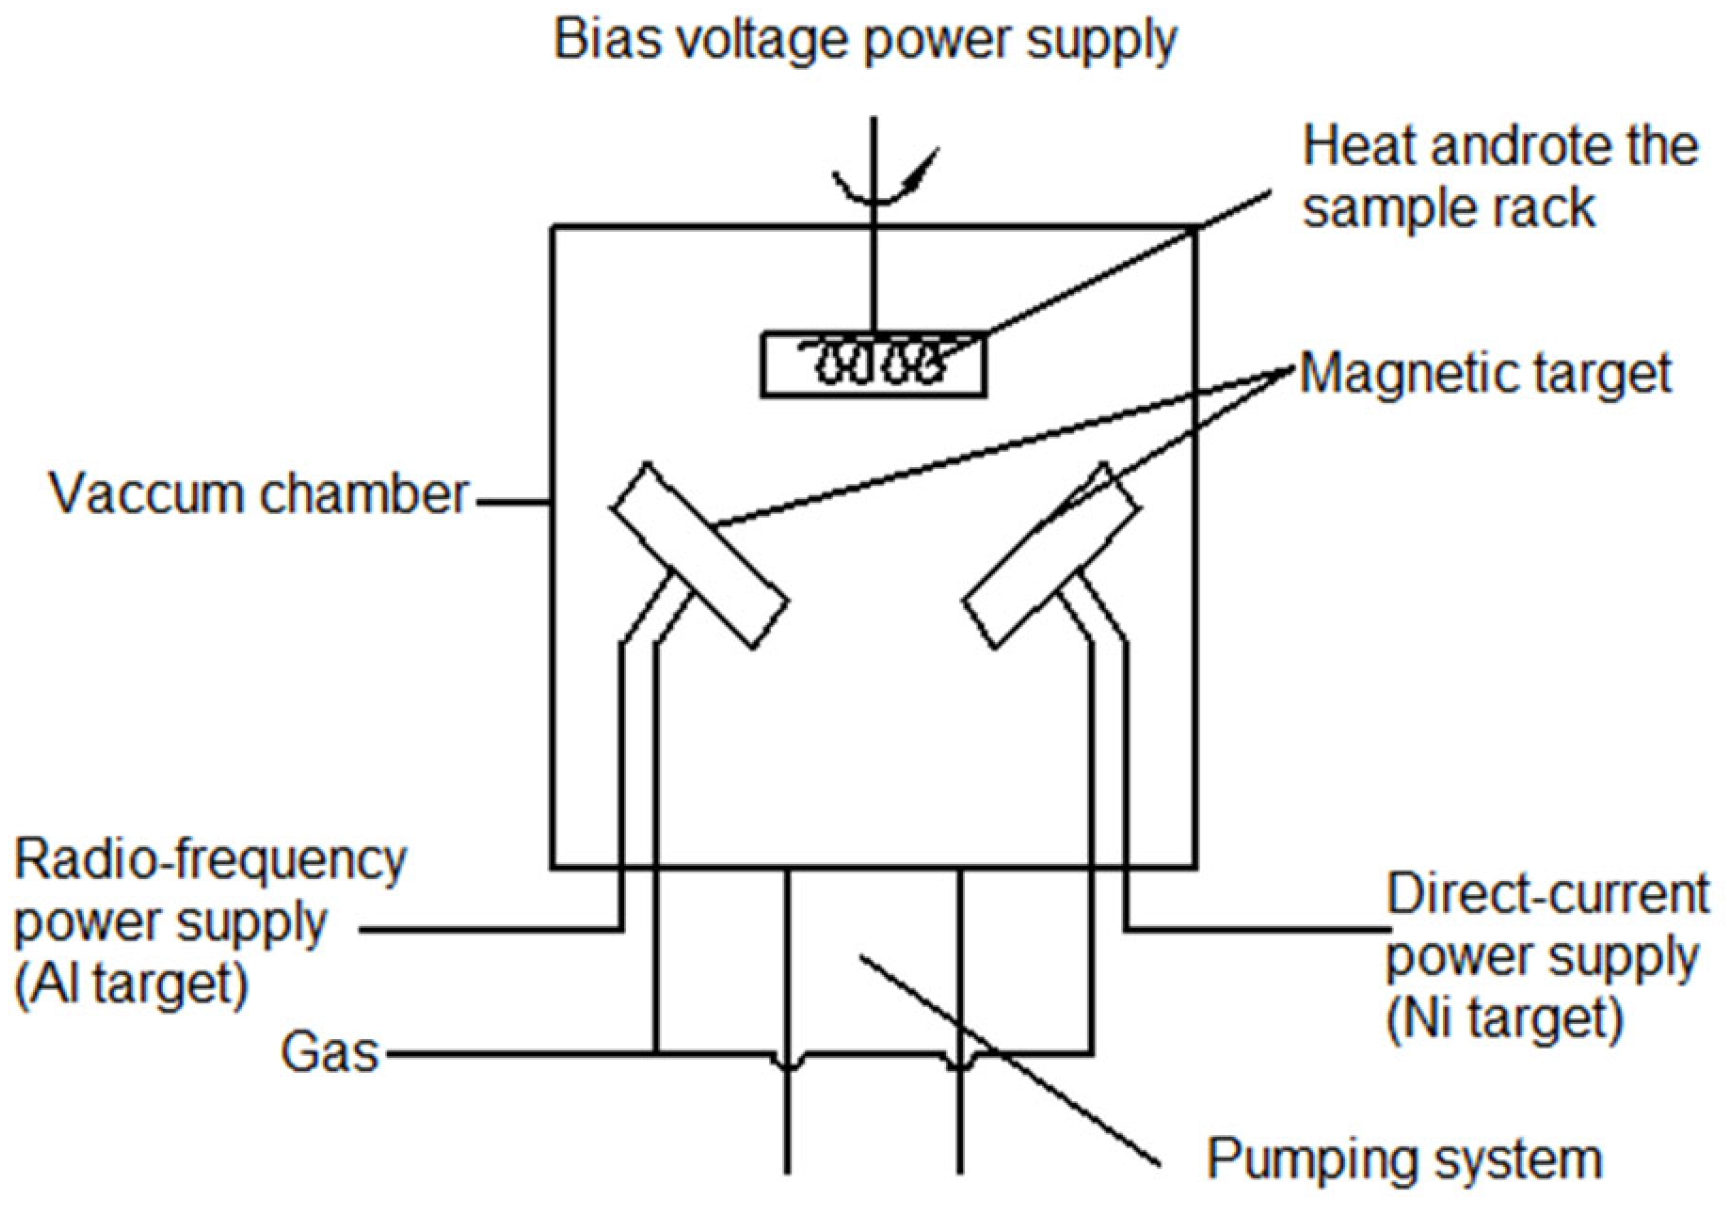
2. Experimental
3. Results and Discussion
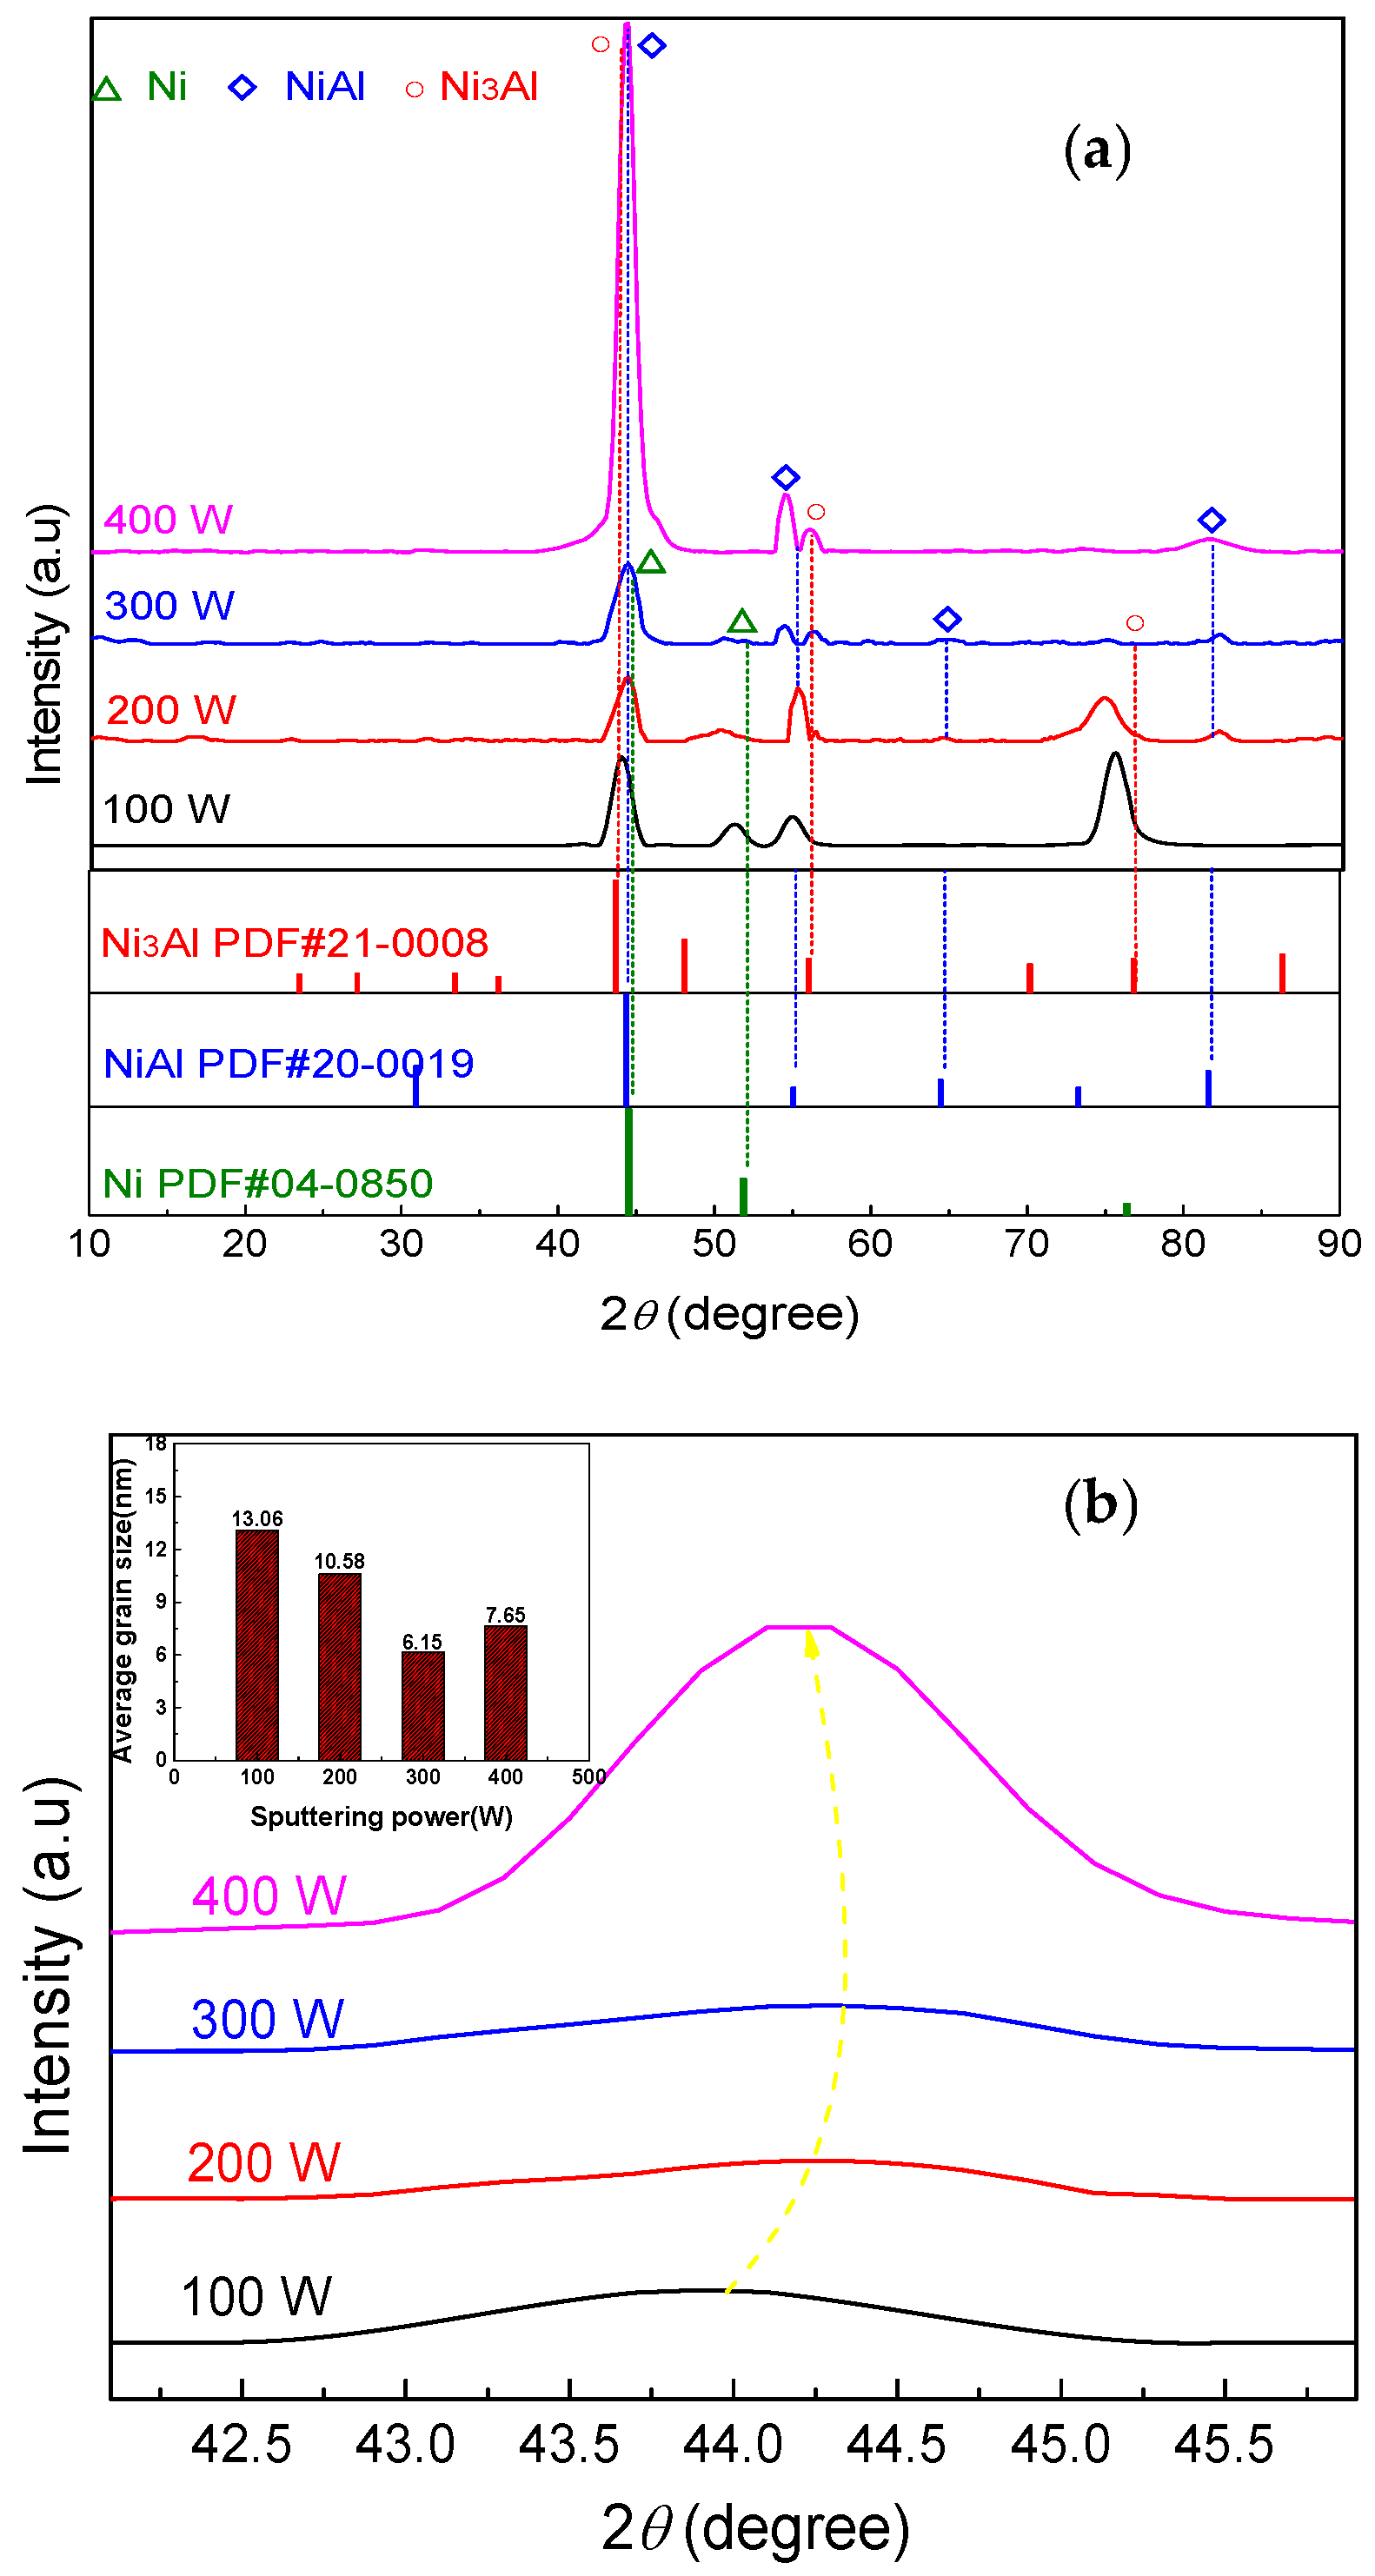
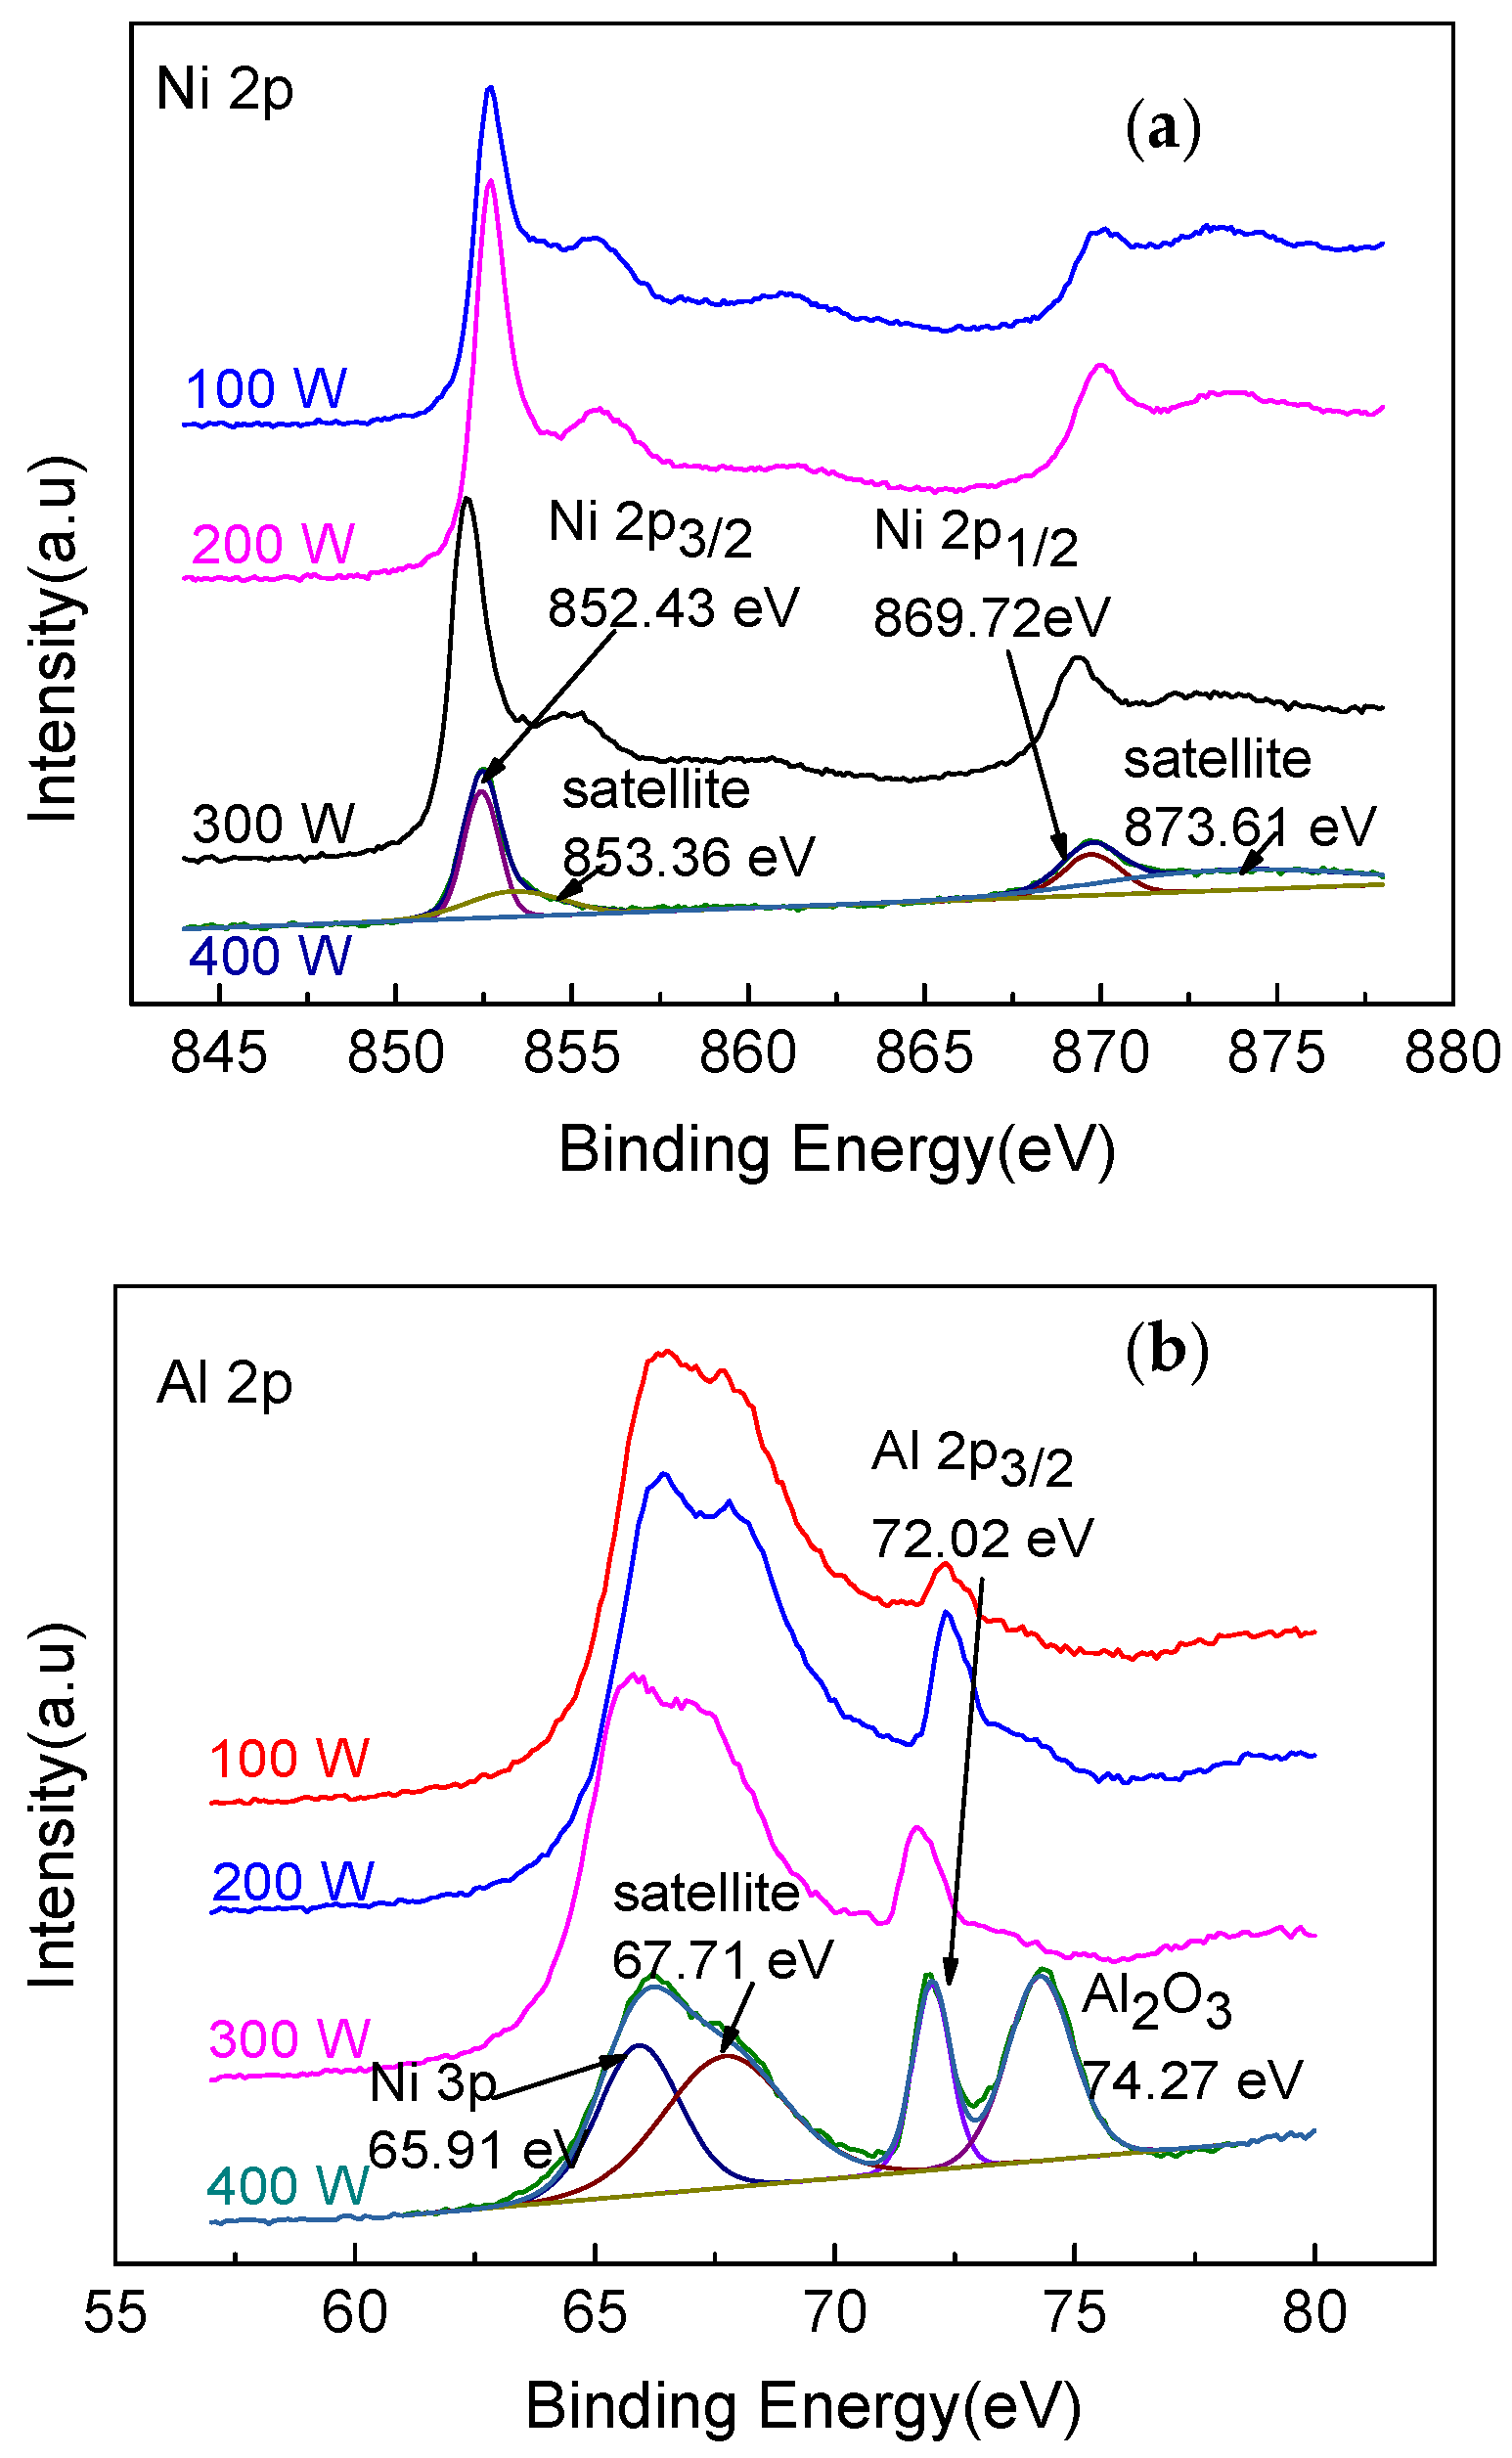
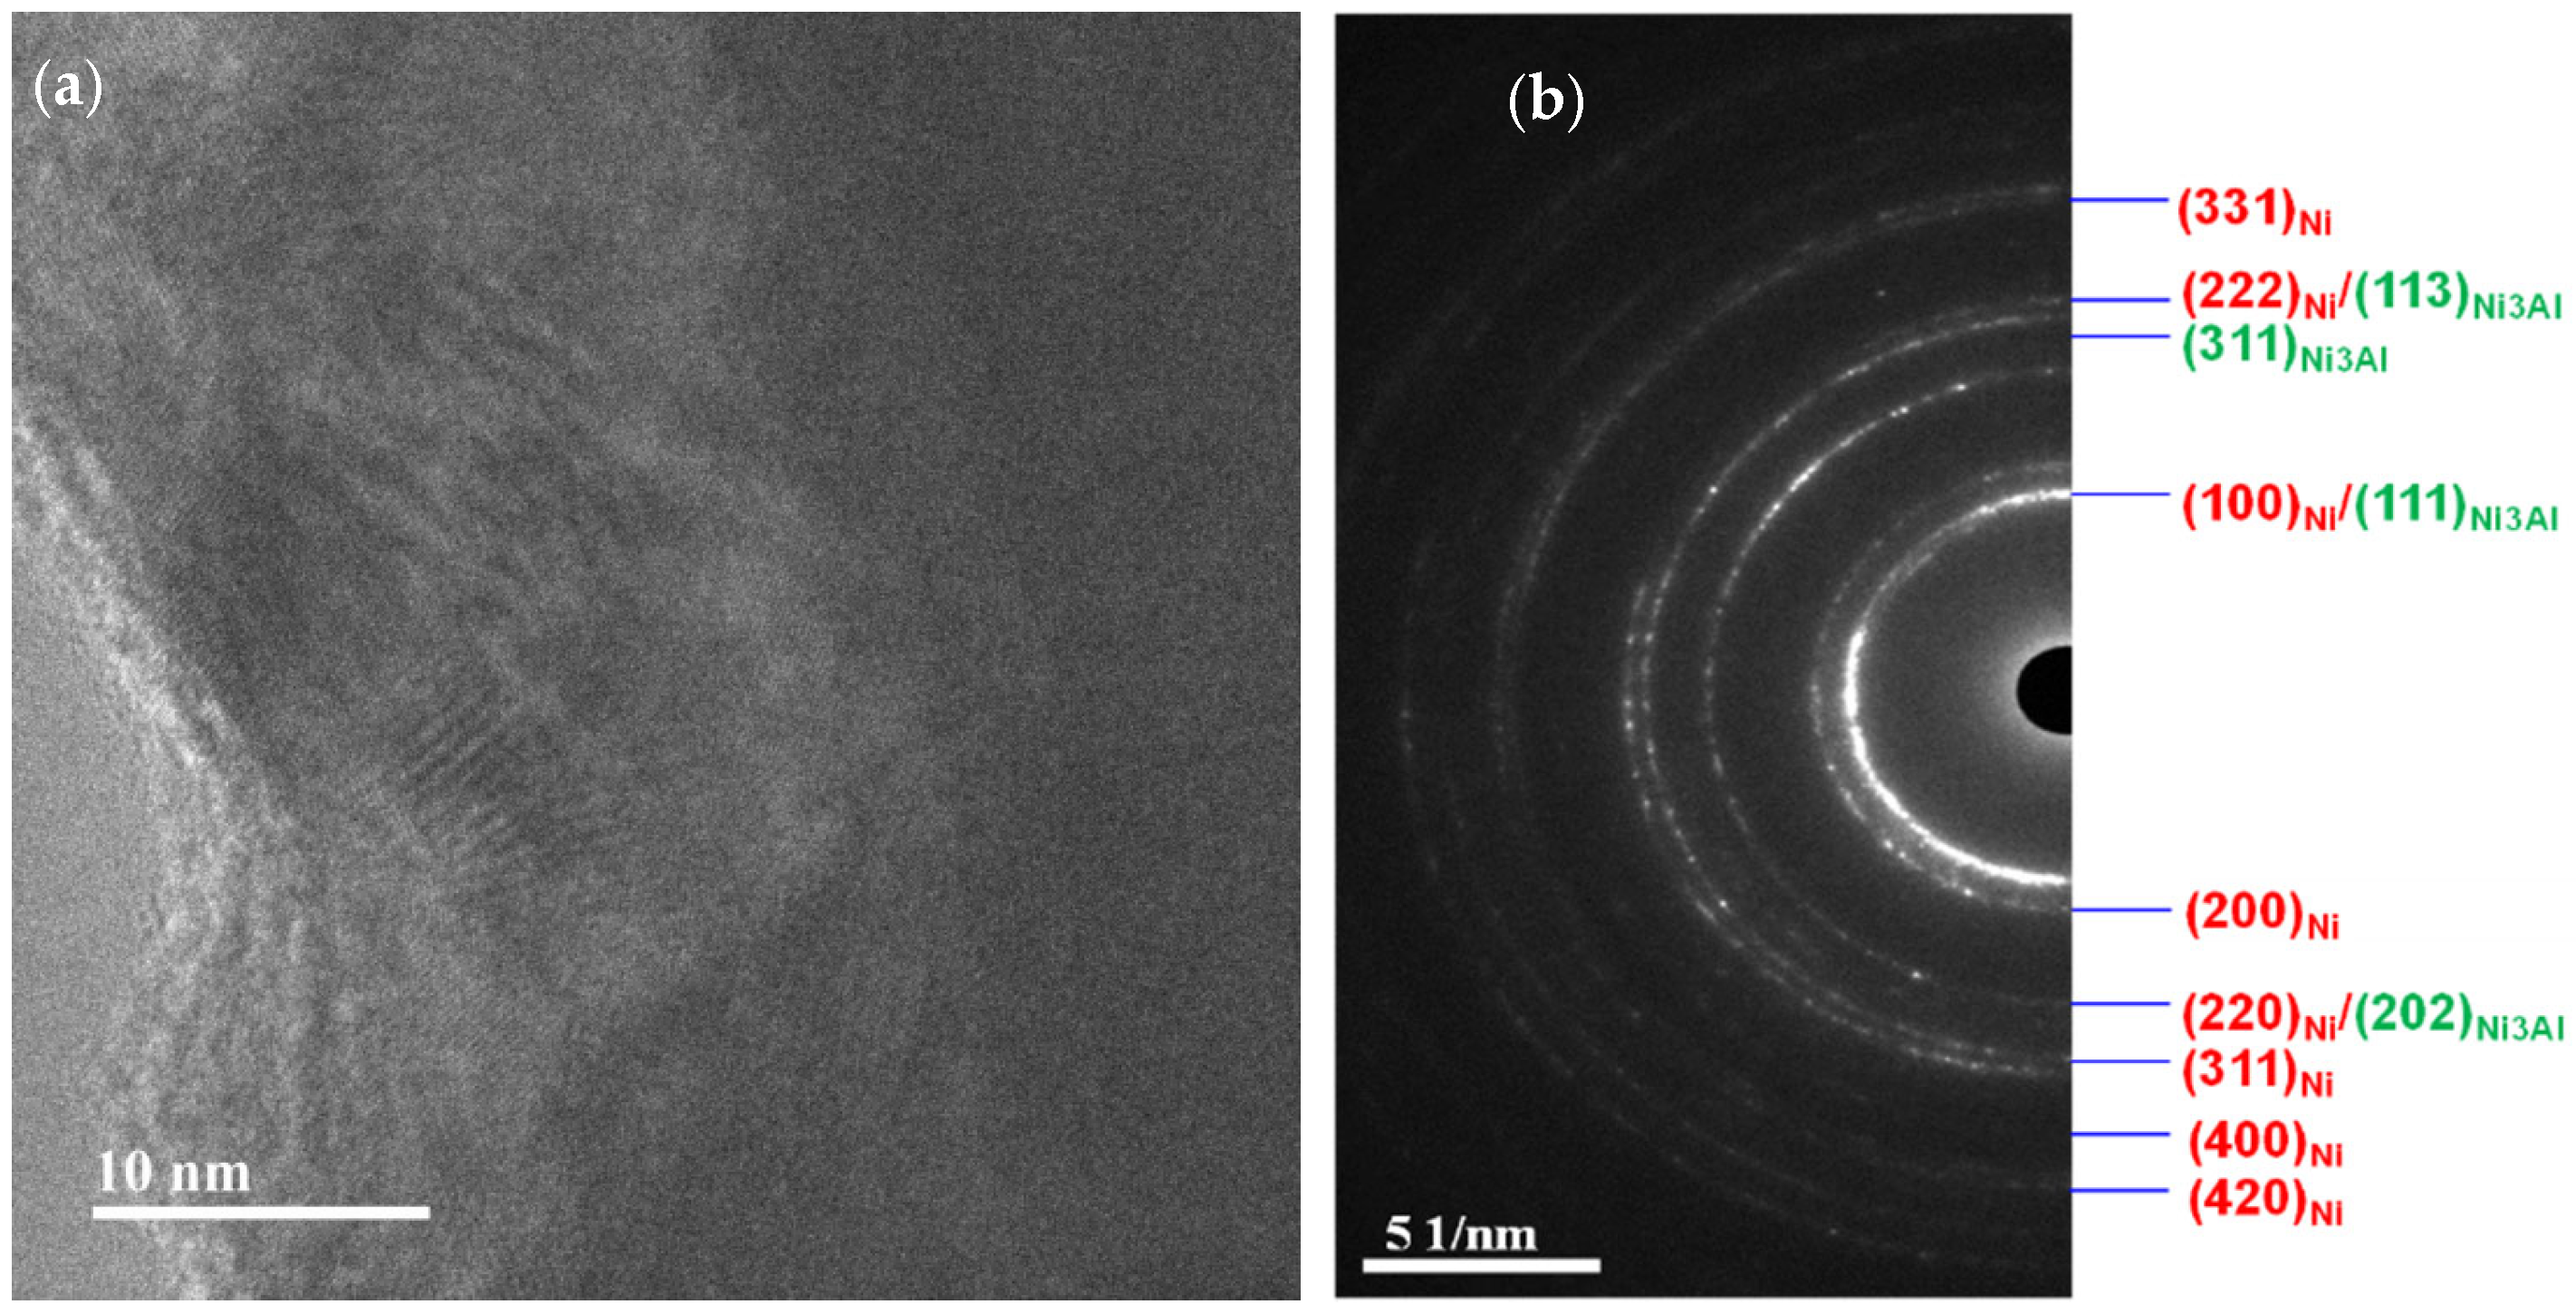
3.1. Microstructure
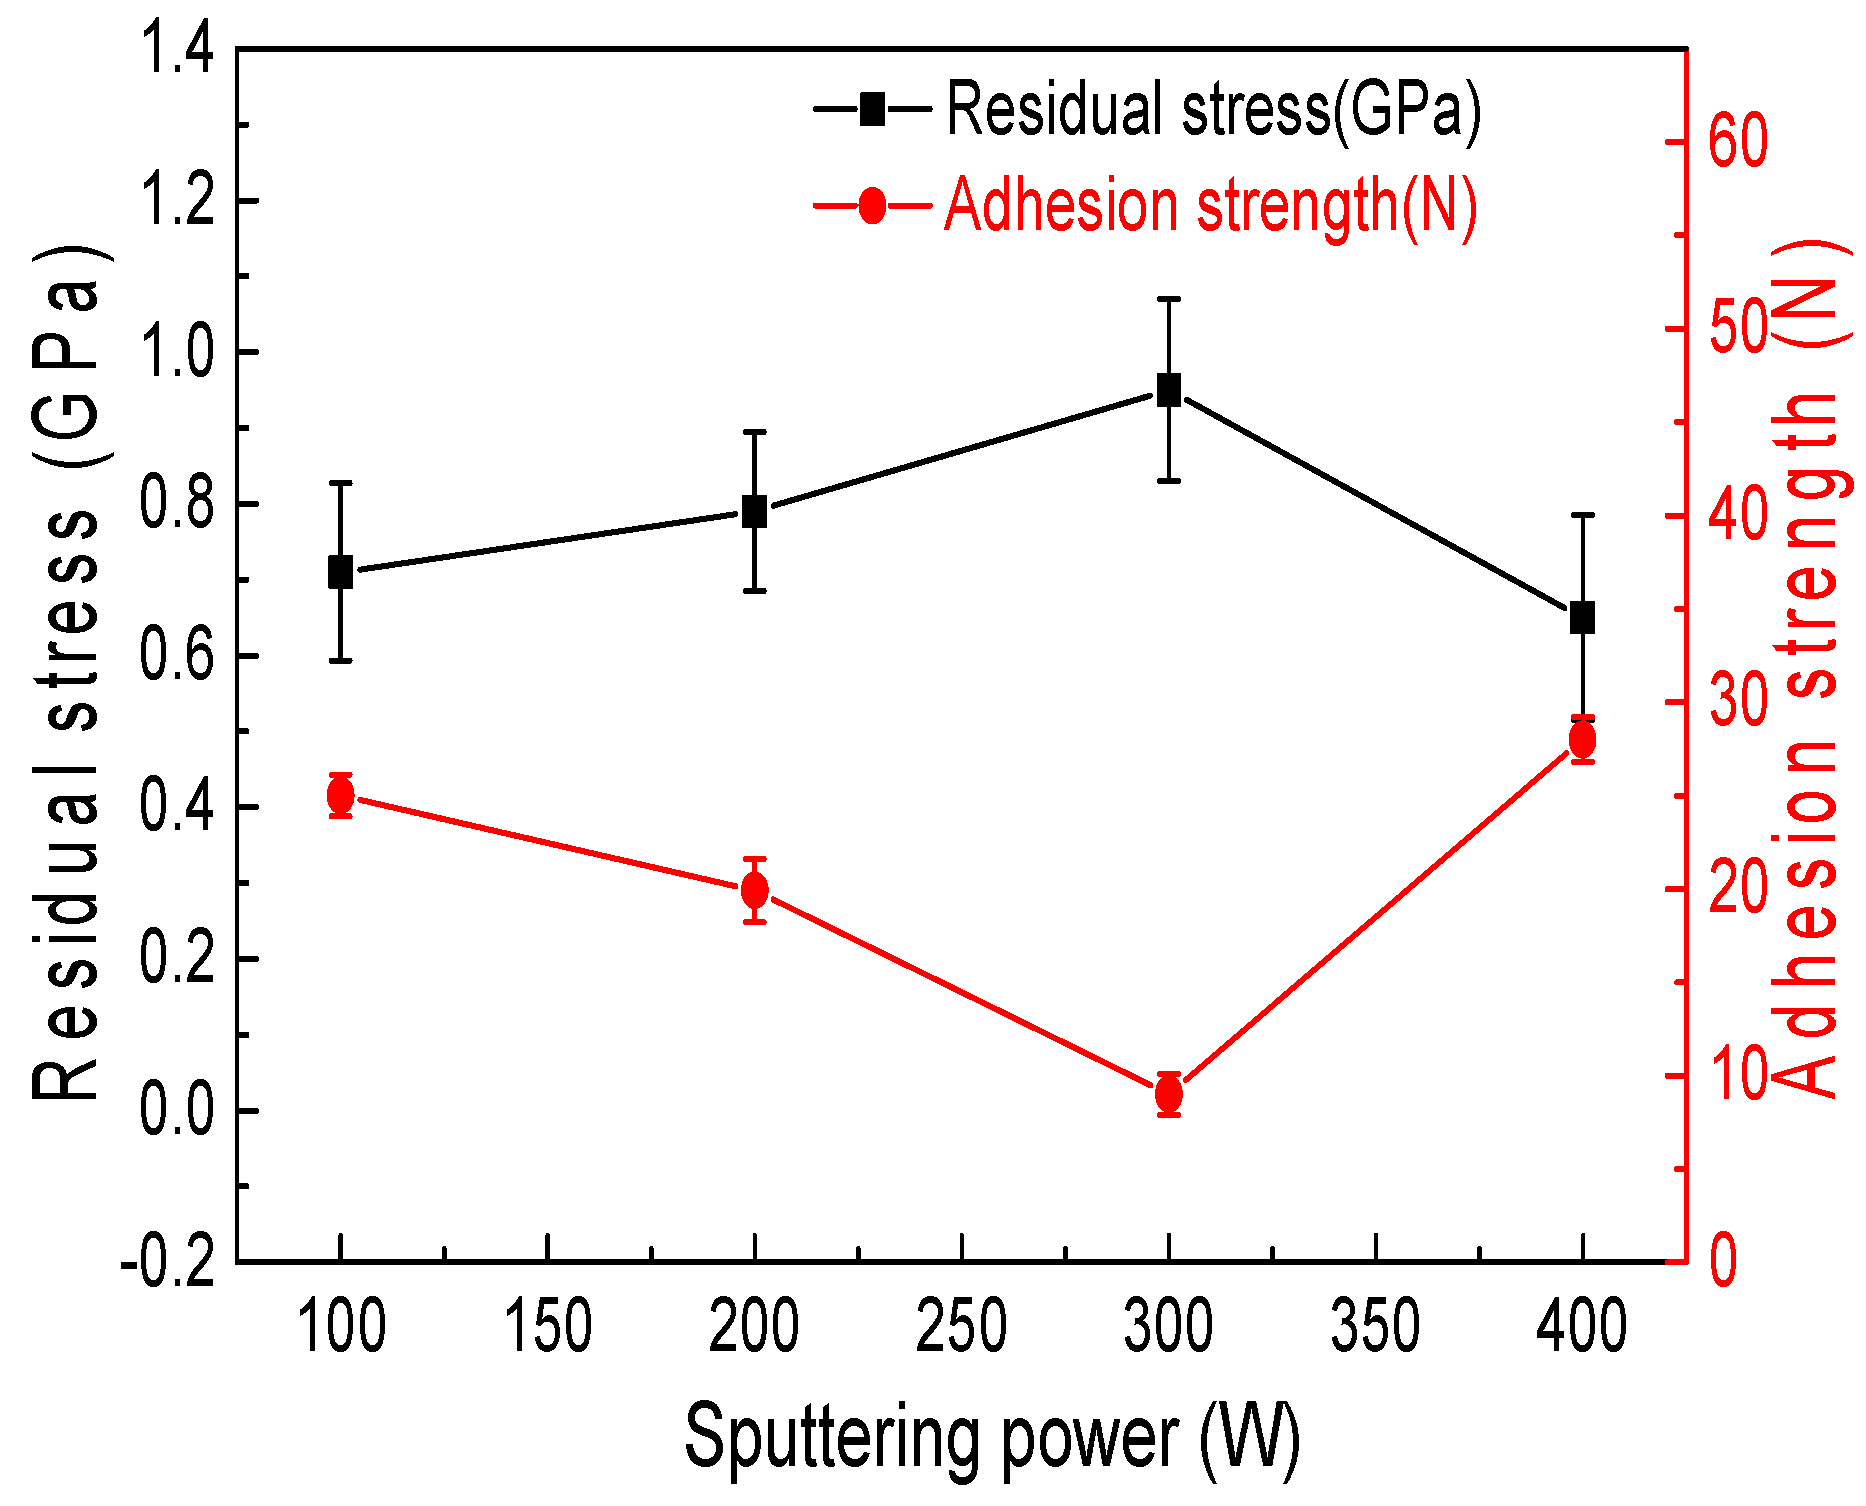
3.2. Residual Stress and Adhesion Strength
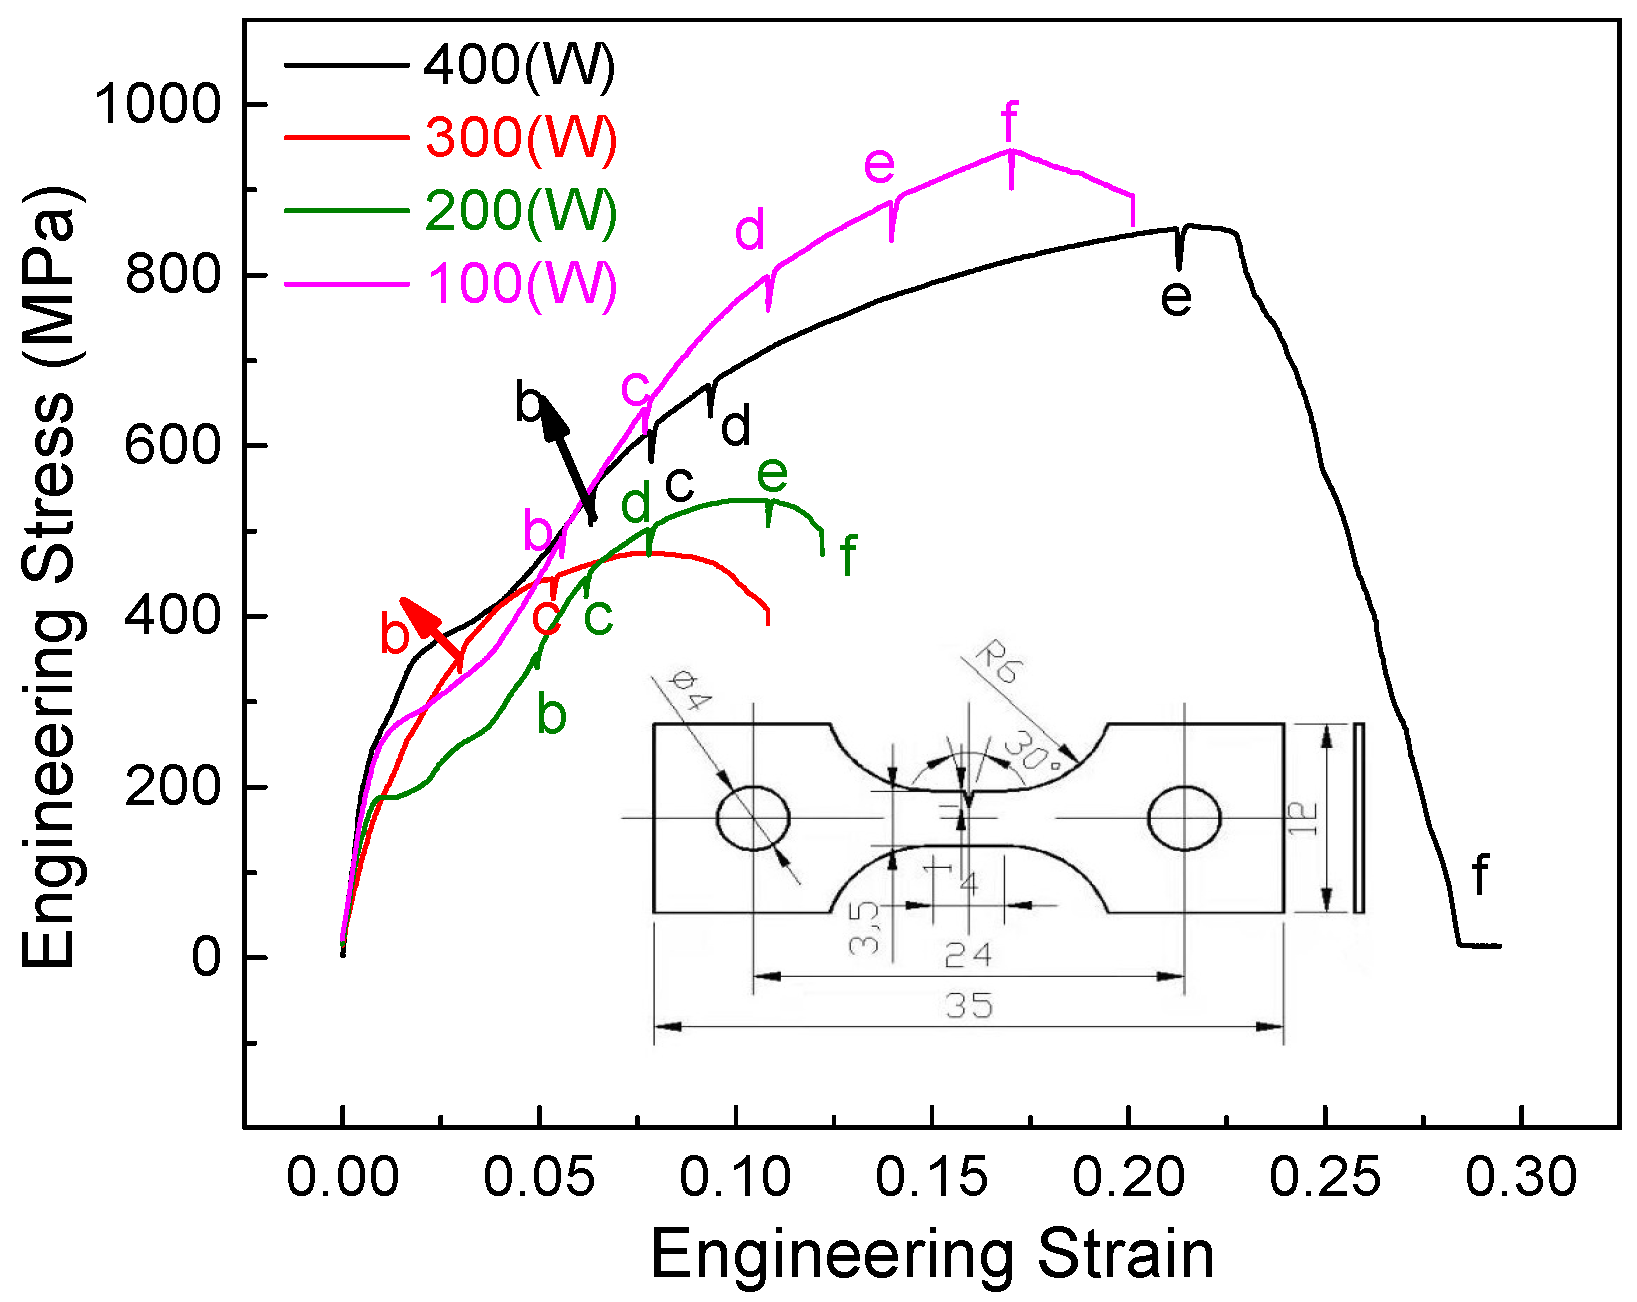
3.3. In Situ Tensile Research
4. Conclusions
Author Contributions
Funding
Data Availability Statement
Conflicts of Interest
References
- Liu, M.; Tay, N.H.S.; Bell, S.; Belusko, M.; Jacob, R.; Will, G.; Bruno, F. Review on concentrating solar power plants and new developments in high temperature thermal energy storage technologies. Renew Sust. Energ. Rev. 2016, 53, 1411–1415. [Google Scholar] [CrossRef]
- Hou, S.J.; Zhu, S.L.; Wang, F.H. A magnetron sputtered microcrystalline beta-NiAl coating for SC superalloys. Part I. Characterization and comparison of isothermal oxidation behavior at 1100 degrees C with a NiCrAlY coating. Appl. Surf. Sci. 2015, 324, 1–6. [Google Scholar] [CrossRef]
- Ding, W.J.; Bauer, T. Progress in Research and Development of Molten Chloride Salt Technology for Next Generation Concentrated Solar Power Plants. Engineering 2021, 7, 334–338. [Google Scholar] [CrossRef]
- Ding, W.J.; Yang, F.; Alexander, B.; Thom, B. Molten chloride salts for high-temperature thermal energy storage: Continuous electrolytic salt purifcation with two Mg-electrodes and alternating voltage for corrosion control. Sol. Energ. Mat. Sol. C. 2021, 223, 110979–110987. [Google Scholar] [CrossRef]
- Saha, S.; Ganguli, A.K. FeCoNi Alloy as Noble Metal-Free Electrocatalyst for Oxygen Evolution Reaction (OER). Chem. Select 2017, 2, 1630–1634. [Google Scholar] [CrossRef]
- Gong, M.; Dai, H. A mini review on NiFe-based materials as highly active oxygen evolution reaction electrocatalysts. Nano Res. 2015, 8, 23–29. [Google Scholar] [CrossRef] [Green Version]
- Yang, Y.F.; Liu, Z.L.; Ren, P.; Wang, Q.W.; Bao, Z.B.; Zhu, S.L.; Li, W. Hot corrosion behavior of Pt+Hf co-modified NiAl coating in the mixed salt of Na2SO4-NaCl at 900 °C. Corros. Sci. 2020, 167, 108527. [Google Scholar] [CrossRef]
- Seyring, M.; Rettenmayr, M. Impact of crystallography at Ni/NiAl interfaces on the nucleation of Ni3Al. Acta Mater. 2021, 208, 116713. [Google Scholar] [CrossRef]
- Liu, H.; Xu, M.M.; Li, S.; Bao, Z.B.; Zhu, S.L.; Wang, F.H. Improving cyclic oxidation resistance of Ni3Al-based single crystal superalloy with low-diffusion platinum-modified aluminide coating. J. Mat. Sci. Technol. 2020, 54, 132–137. [Google Scholar] [CrossRef]
- Tolpygo, V.K.; Clarke, D.R. On the rumpling mechanism in nickel-aluminide coatings part I: An experimental assessment. Acta Mater. 2004, 52, 5115–5119. [Google Scholar]
- Zhou, Y.; Wang, L.; Xiao, P.; Wang, G.; Jin, D.; Hao, W.; Zhao, X. Influence of substrate composition on the oxidation performance of nickel aluminide coating prepared by pack cementation. Corros. Sci. 2016, 110, 284–287. [Google Scholar] [CrossRef]
- Zhang, Y.; Haynes, J.A.; Wright, G.; Pint, B.A.; Cooley, K.M.; Lee, W.Y.; Liaw, P.K. Effects of Pt incorporation on the isothermal oxidation behavior of chemical vapor deposition aluminide coatings. Metall. Mater Trans. A 2001, 32, 1727–1741. [Google Scholar] [CrossRef]
- Biswajyoti, M.; Rishow, K.; Aminul, I.; Asiq, R.O.S.; Anup, K.K. Evaluation of strength-ductility combination by in-situ tensile testing of graphene nano platelets reinforced shroud plasma sprayed Nickel Aluminium coating. J. Alloy. Compd. 2018, 765, 1082–1089. [Google Scholar]
- He, M.Y.; Evans, A.G.; Hutchinson, J.W. The ratcheting of compressed thermally grown thin films on ductile substrates. Acta Mater. 2000, 48, 2593–2601. [Google Scholar] [CrossRef]
- Panat, R.; Hsia, K.J.; Oldham, J. Rumpling instability in thermal barrie systems under isothermal conditions in vacuum. Philos. Mag. 2005, 85, 45–64. [Google Scholar] [CrossRef]
- Xing, Y.Y.; Wei, X.H.; Ma, Y.J. Effect of deposition temperature on microstructure and properties of Ni3Al-Cr films by magnetron sputtering. Funct. Materials 2013, 4, 37–41. [Google Scholar]
- Zhong, D.; Moore, J.J.; Sutter, E.; Mishra, B. Microstructure, composition and oxidation resistance of nanostructured NiAl and Ni–Al–N coatings produced by magnetron sputtering. Surf. Coat Tech. 2005, 200, 1236–1241. [Google Scholar] [CrossRef]
- Madiha, S.; Nasar, A.; Khizar, U.H.; Shabnam, S. Structural optical and magnetic properties of transition metal doped ZnO magnetic nanoparticles synthesized by sol-gel auto-combustion method. Mater Sci. Poland. 2019, 37, 280–288. [Google Scholar]
- He, D.M. Effect of magnetron sputtering power on composition and microstructure of Ni Al coating. Mater Sci. Eng. Pow. Metall. 2018, 23, 335–341. [Google Scholar]
- Vorob’ev, V.L.; Dobysheva, L.V.; Bayankin, V.Y. Comparison of electron binding energies in Ni3Al, Al, and Ni determined by X-ray photoelectron spectroscopy and quantum-mechanical calculation. J. Electron. Spectrosc. 2021, 252, 147124–147129. [Google Scholar] [CrossRef]
- Xiao, P.; Tian, L.X.; Dong, Z.Y. Effect of Grain Refinement and Metal Oxide Dispersions on High-Temperature Oxidation Resistance of Nickel Aluminide Coating. Coat Technol. 2018, 23, 335–339. [Google Scholar]
- Li, T.F. High Temperature Oxidation and Hot Corrosion of Metals; Chemistry Industry Press: Beijing, China, 2003; pp. 26–31. [Google Scholar]
- Pauleau, Y. Generation and evolution of residual stresses in physical vapour-deposited thin films. Vacuum 2001, 61, 175–179. [Google Scholar] [CrossRef]
- Xu, S.P.; Li, X.W.; Huang, M.D.; Ke, P.L.; Wang, A.Y. Stress reduction dependent on incident angles of carbon ions in ultrathin tetrahedral amorphous carbon films. Appl. Phys. Lett. 2014, 104, 141908. [Google Scholar] [CrossRef] [Green Version]
- Shuai, J.T.; Zuo, X.; Wang, A.Y.; Wang, Z.; Sun, L.; Chen, R.; Wang, L.; Ke, P. Erosion behavior and failure mechanism of Ti/TiAlN multilayer coatings eroded by silica sand and glass beads. J. Mater Sci. Technol. 2021, 80, 179–182. [Google Scholar] [CrossRef]
- Tomastik, J.; Ctvrtlik, R.; Drab, M.; Manak, J. On the importance of combined scratch/acoustic emission test evaluation: SiC and SiCN thin films case study. Coatings 2018, 8, 196. [Google Scholar] [CrossRef] [Green Version]
- Xie, Y.; Hawthorne, H.M. Effect of contact geometry on the failure modes of thin coatings in the scratch adhesion test. Surf. Coat. Technol. 2002, 155, 121–125. [Google Scholar] [CrossRef]
- Jie, S.; Junchen, L.; Peiqing, L.; Fuan, W.; Yi, S.; Keliang, W. Investigation of tensile properties of 316L stainless steel with micro-nano-structure in SEM by in situ tension. Integr. Ferroelectr. 2017, 181, 31–35. [Google Scholar] [CrossRef]
- He, P.; Wang, F.S.; Liu, S.; Du, J. Effects of Wear-resistant Coating on Tensile Property of 40Cr Ni Mo A Alloy Steel. Hot Work Technol. 2020, 49, 103–106. [Google Scholar]
- Sheng, J.; La, P.Q.; Su, J.Q.; Shi, Y.; Li, Z.N.; Wang, J. In situ SEM analysis for deformation mechanism of micro/nanostructured 304 stainless steel with high strength and good plasticity. Mod. Phys. Lett. B. 2018, 32, 1850182. [Google Scholar] [CrossRef]
- Yang, M.; Weng, L.; Zhu, H.; Fan, T.; Zhang, D. Simultaneously enhancing the strength, ductility and conductivity of copper matrix composites with graphene nanoribbons. Carbon 2017, 118, 250–254. [Google Scholar] [CrossRef]
- Huang, L.; Wang, L.; Qian, M.; Zou, J. High tensile-strength and ductile titanium matrix composites strengthened by TiB nanowires. Scr. Mater. 2017, 141, 133–138. [Google Scholar] [CrossRef]


Disclaimer/Publisher’s Note: The statements, opinions and data contained in all publications are solely those of the individual author(s) and contributor(s) and not of MDPI and/or the editor(s). MDPI and/or the editor(s) disclaim responsibility for any injury to people or property resulting from any ideas, methods, instructions or products referred to in the content. |
© 2023 by the authors. Licensee MDPI, Basel, Switzerland. This article is an open access article distributed under the terms and conditions of the Creative Commons Attribution (CC BY) license (https://creativecommons.org/licenses/by/4.0/).
Share and Cite
Xu, S.; Zheng, Y.; Sheng, J.; Chen, W.; Zhan, F.; La, P. Study of Microstructure Regulation and In Situ Tensile Performance of Ni-Al Films. Crystals 2023, 13, 225. https://doi.org/10.3390/cryst13020225
Xu S, Zheng Y, Sheng J, Chen W, Zhan F, La P. Study of Microstructure Regulation and In Situ Tensile Performance of Ni-Al Films. Crystals. 2023; 13(2):225. https://doi.org/10.3390/cryst13020225
Chicago/Turabian StyleXu, Shipeng, Yuehong Zheng, Jie Sheng, Weiqian Chen, Faqi Zhan, and Peiqing La. 2023. "Study of Microstructure Regulation and In Situ Tensile Performance of Ni-Al Films" Crystals 13, no. 2: 225. https://doi.org/10.3390/cryst13020225