Article

Low-Cost Production of Fe3O4/C Nanocomposite Anodes Derived from Banana Stem Waste Recycling for Sustainable Lithium-Ion Batteries

by
Waewwow Yodying
1,
Thapanee Sarakonsri
1,2,3,
Natthakan Ratsameetammajak
1,3,
Kittiched Khunpakdee
1,3,
Mitsutaka Haruta
4 and
Thanapat Autthawong
1,2,*
1
Department of Chemistry, Faculty of Science, Chiang Mai University, Chiang Mai 50200, Thailand
2
Material Science Research Center, Faculty of Science, Chiang Mai University, Chiang Mai 50200, Thailand
3
Center of Excellent for Innovation in Chemistry (PERCH-CIC), Faculty of Science, Chiang Mai University, Chiang Mai 50200, Thailand
4
Institute for Chemical Research, Kyoto University, Uji, Kyoto 611-0011, Japan
*
Author to whom correspondence should be addressed.
Crystals 2023, 13(2), 280; https://doi.org/10.3390/cryst13020280
Submission received: 13 January 2023 / Revised: 30 January 2023 / Accepted: 3 February 2023 / Published: 6 February 2023
(This article belongs to the Section Materials for Energy Applications)

Abstract

:
The development of lithium-ion batteries (LIBs) has become an important aspect of advanced technologies. Although LIBS have already outperformed other secondary batteries, they still require improvement in various aspects. Most crucially, graphite, the commercial anode, has a lower capacity than emerging materials. The goal of this research is to develop carbon-based materials from sustainable sources. Banana stem waste was employed as a precursor because of its xylem structure and large surface area. In addition, catalytic graphitization of biomass yields both graphitic carbon and metal oxides, which can be converted into higher-capacity Fe3O4/C nanocomposites. The nanocomposites consist of nanoparticles distributed on the surface of the carbon sheet. It was found that Fe3O4/C nanocomposites not only achieved a superior specific capacity (405.6 mAh/g at 0.1 A/g), but also had good stability in long-term cycling (1000 cycles). Interestingly, they had a significantly greater capacity than graphite at a high current density (2 A/g), 172.8 mAh/g compared to 63.9 mAh/g. For these reasons, the simple preparation approach, with its environmental friendliness and low cost, can be employed to produce Fe3O4/C nanocomposites with good electrochemical properties. Thus, this approach may be applicable to varied biomasses. These newly developed Fe3O4/C nanocomposites derived from banana waste recycling were found to be suitable to be used as anodes for sustainable LIBs.

Graphical Abstract

1. Introduction

Lithium-ion batteries (LIBs) have always been the center of attention in energy storage development. Among similar metal-ion batteries, lithium possesses the smallest atomic radius among metals, which leads to faster diffusion rates and the ability to access more active sites within the electrode structure. With this ability, LIBs not only display superior capacity and energy density compared to other secondary batteries, but also provide other solid advantages, including a longer shelf life, less complex maintenance, and a low self-discharge rate. LIBs are also known to have no memory effects, which was a significant hindrance in older rechargeable batteries such as Ni-Cd batteries. Nevertheless, some aspects of LIBs could still be improved further. Although LIBs can provide higher capacity than other batteries, it is not enough to completely satisfy the rising demand for energy, especially in novel technologies and innovations [1]. Moreover, LIBs require high initial cost and difficult recycling schemes. Despite their limitations, LIBs are widely used in various applications, ranging from portable devices to electric vehicles. However, it is still crucial for LIBs to gain higher efficiency in many aspects, such as capacity, cost, stability, and safety. Lithium-ion batteries have three main components: electrodes (anode and cathode), electrolyte, and a separator. The anode and cathode are divided by a separator to prevent short circuit, while the electrolyte acts as a medium for lithium-ion transfer during reaction [2].
The development of anode materials has been ongoing for a long time. First, the ideal anode material should have a high and stable electrical capacity after repeated use. Second, the material must have good conductivity to enable fast charge-discharge reactions. Third, low production costs and environmentally friendly processes are also desirable. To achieve the mentioned properties, the material needs to have a high surface area, a rigid structure, good conductivity, a low operating voltage, and be prepared by a non-toxic, cost-effective, scalable process. Although new and promising materials were continuously being discovered and invented, the improvement of graphite and other types of carbon remained a topic of interest [3]. Due to its abundance, graphite has well-balanced properties and is reasonably priced. Moreover, graphite could be alternatively obtained from carbon-containing sources, which cover an entire range of organic materials such as sugar, wood, and agricultural waste [4]. The ability to utilize organic sources as precursors implies that the preparation of graphite could be sustainable. However, the concept of obtaining graphite from other sources still has limitations. For example, biomass graphitization without catalysts would be ineffective even at high temperatures, so catalysts are required [5]. Furthermore, the obtained graphite or graphitic carbon must be improved in terms of capacity.
To increase the specific capacity of anode materials, there have been many investigations of possible anode materials categorized by reaction mechanisms into alloying materials (Si [6,7], Sn [8], Ge [9,10], etc.), conversion materials (metal oxides, metal salts, etc.) [11], and insertion materials (carbon, TiO2 polymorphs [12], etc.) as well as their composite materials [13,14,15]. Alloying materials could have a significantly high theoretical capacity from alloying reactions with lithium which cause them to swell and contract severely, resulting in fracture and rapid capacity loss in practical uses [9]. Conversion materials, although not as massive, also suffer from similar capacity drops along with low conductivity, which could lead to poor cycle performance. However, conversion materials possess a considerably high theoretical capacity, and are non-toxic and environmentally friendly. On the other hand, almost no volume changes were found in insertion materials because of their rigid structures with spaces to bind lithium ions. In return, insertion materials were limited by low theoretical capacity and energy density due to voids in the structure [11]. Carbon-based materials are in this category. Hence, the materials need to be combined with other materials to overcome the capacity limitations. Apart from stable performance and long cycle life, graphitic carbon also exhibits high conductivity and low voltage hysteresis. As a result, graphitic carbon is appropriate for use as a supporting material in the nanocomposite process [16]. Thus, there is a considerable amount of literature on carbon-based composite materials with various materials and morphologies.
Interestingly, transition metal oxides, the byproducts of catalytic graphitization, have also been studied. Metal oxides are conversion materials with a considerably high electrical capacity, but their low conductivity, rapid volume change, and memory effects hinder them from achieving superior performance [11,17]. As a result, their composite materials with carbon proved to amplify their capability as anode materials in LIBs. Researchers have prepared various composite materials of carbon and metal oxides prepared directly from biomass or other carbon sources, all of which showed better performance compared to pure graphite or pure oxides [18]. For example, He et al. published a journal article in 2013 about carbon-encapsulated Fe3O4 nanoparticles derived from glucose and iron acetate by pyrolysis method. The carbon layers coated on Fe3O4 nanoparticles could prevent further cracking and promote a stable solid electrolyte interface, leading to an exceptionally high and stable electrical capacity of 858 mAh/g at a very fast charge-discharge rate of 5 A/g [19]. In the case of biomass precursors, Li et al. issued a report (2016) about the preparation of Fe3O4 decorated on biochar composite anode materials from pomelo pericarp biomass by pyrolysis process. However, the specific capacity is smaller than He et al.’s (634.6 mAh/g at a slower charge-discharge current density of 0.5 A) because the morphology appears to be Fe3O4 particles dispersed on the surface of carbon, which is not as effective at reducing volume change as carbon coating. Their methods are less complex and use biomass waste materials as precursors [20]. Nevertheless, these composite materials showed great stability and improved capacity compared to both pure graphite and pure metal oxides by combining their advantages and drawbacks in the nanocomposite process. The remaining issues with carbon and metal oxide-based materials were the complex processes and specific precursors, which increased the cost and reduced the scalability. In iron-assisted catalytic graphitization, metal oxides such as the mentioned Fe3O4 are simultaneously produced together with graphitic carbon as a byproduct. This catalytic graphitization process therefore has the potential to produce composite materials between metal oxides and carbon in one step. To the best of our knowledge, however, no prior studies mention the utilization of byproducts in catalytic graphitization, nor the use of banana stem as a precursor for carbon-based anode materials.
In this research, we take an interest in converting biomass waste, especially the plentiful waste of banana stems in Thailand, into graphitic carbon-based anode materials by catalytic graphitization. Using metal catalysts, the byproducts of Fe3O4 nanoparticles would assist in enhancing specific capacity, while graphitic carbon from biomass provides conductive support and maintains cycling stability in battery applications. This study of Fe3O4/C nanocomposite anodes is centered on preparing not only improved electrochemical performance but also cost-effective anode materials from readily available biomass.

2. Materials and Methods

2.1. Nanocomposite Materials Preparation of Banana Stem Waste

For the preparation of banana stem waste, the fresh banana stem (retrieved from Chiang Mai, Thailand) was washed multiple times with water and then sliced to a length of 1–2 cm. The chopped stem was then blended in a home blender. The mixture was then drained and dried at 120 °C for 24 h to obtain banana stem powder. Following that, the processed biomass powder was homogeneously dispersed in Fe(NO3)3·9H2O (98%, Kemaus, New South Wales, Australia) solutions of 0.01, 0.03, and 0.05 M concentrations at a ratio of 1 g of biomass powder per 50 mL of solution. After homogenizing the mixture with a stirrer, they were allowed to soak for 24 h. The suspensions were then filtered and dried at 120 °C in an oven to obtain the treated biomass powder. Subsequently, they were transferred to an alumina boat and then heated up to 800 °C for 2 h (heating rate = 10 °C/min) in a carbon dioxide environment to produce Fe3O4/C nanocomposite materials. The final products were denoted as BA-X.XX, where BA is banana-derived anode and X.XX is the concentration of iron salt solution.

2.2. Materials Characterization

X-ray diffraction (XRD) patterns were collected from Rigaku SmartLab (Tokyo, Japan) and the Malvern PAN analytical EMPYREAN 3 (Worcestershire, UK) X-ray diffractometer to check the composite materials’ components and crystallinity. The experimental details of XRD measurements are listed in Supplementary Materials in Table S1. Using simultaneous thermal analyzer (Rigaku, Thermo plus EVO2, Tokyo, Japan), thermogravimetric analysis (TGA) was performed to determine the percentage of carbon components. Scanning and transmission electron microscopy (FE-SEM: JEOL JSM IT-300 and TEM: JEOL JEM 2010, Tokyo, Japan) were used to examine the morphology. The degree of graphitization of certain materials with superior electrochemical characteristics was also determined by Raman spectroscopy (Jobin Yvon Horiba, T6400, Palaiseau, France).

2.3. Electrochemical Measurements

In an aqueous solution, as-synthesized nanocomposite materials were mixed completely with sodium alginate (91%, Loba Chemie, Maharashtra, India) in 90:10 weight ratio to produce anode electrodes. The homogenous slurry was then coated onto a copper foil with a 150 μm thickness using the doctor blade technique. Each coated material was cut to 13 mm in diameter. The electrodes were then utilized to manufacture half-coin cells (CR2016) with 1 M LiPF6 in 1:1 v/v ethylene carbonate (EC) and dimethyl carbonate (DMC) as the electrolyte, polypropylene film (Celgard 2400) as the separator, and copper foil as the current collector. Several electrochemical experiments were conducted on the constructed cells using a battery test station (NEWARE BTS4000, Shenzhen, China) and potentiostat (Metrohm, Autolab PGSTAT302N, Utrecht, the Netherlands). The evaluations began with testing of rate performance at current densities of 0.05, 0.1, 0.2, 0.5, 1, and 2 A/g, followed by tests of cycle performance at 0.1 and 2 A/g. The nanocomposite material with the highest performance would then be further examined by cyclic voltammetry (CV) in the range of 0.01–3.00 V (scan rate of 0.1 mV/s) and electrochemical impedance spectroscopy (EIS) prior to and following cycle performance tests.

3. Results and Discussion

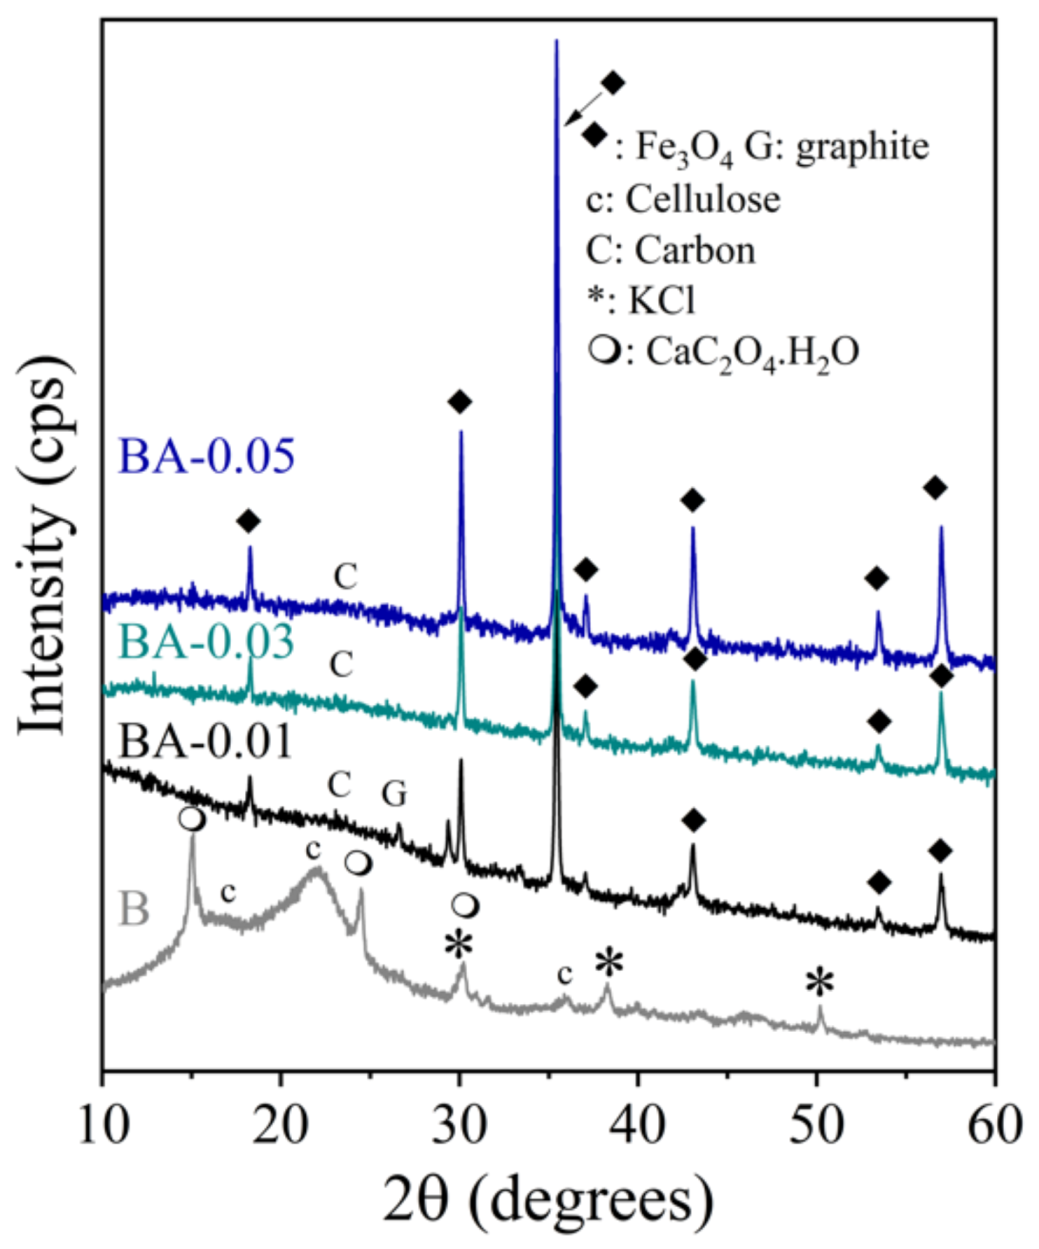
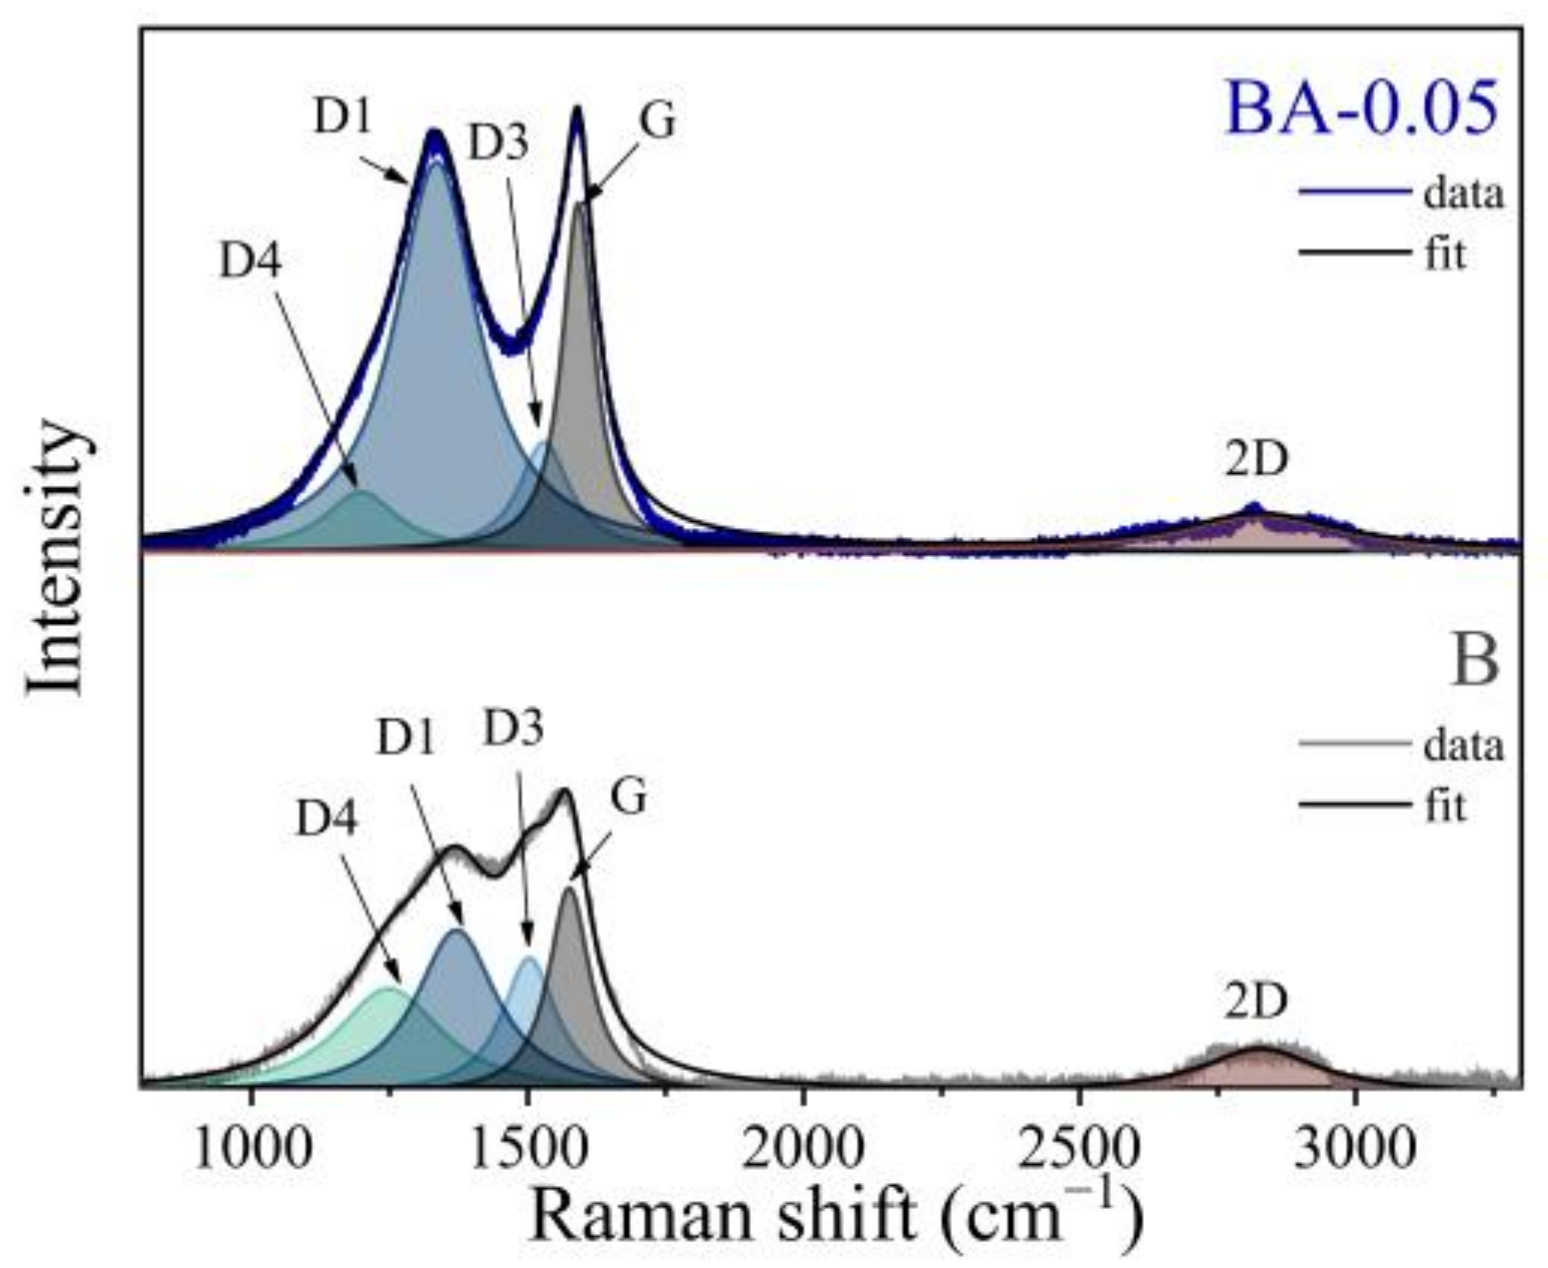
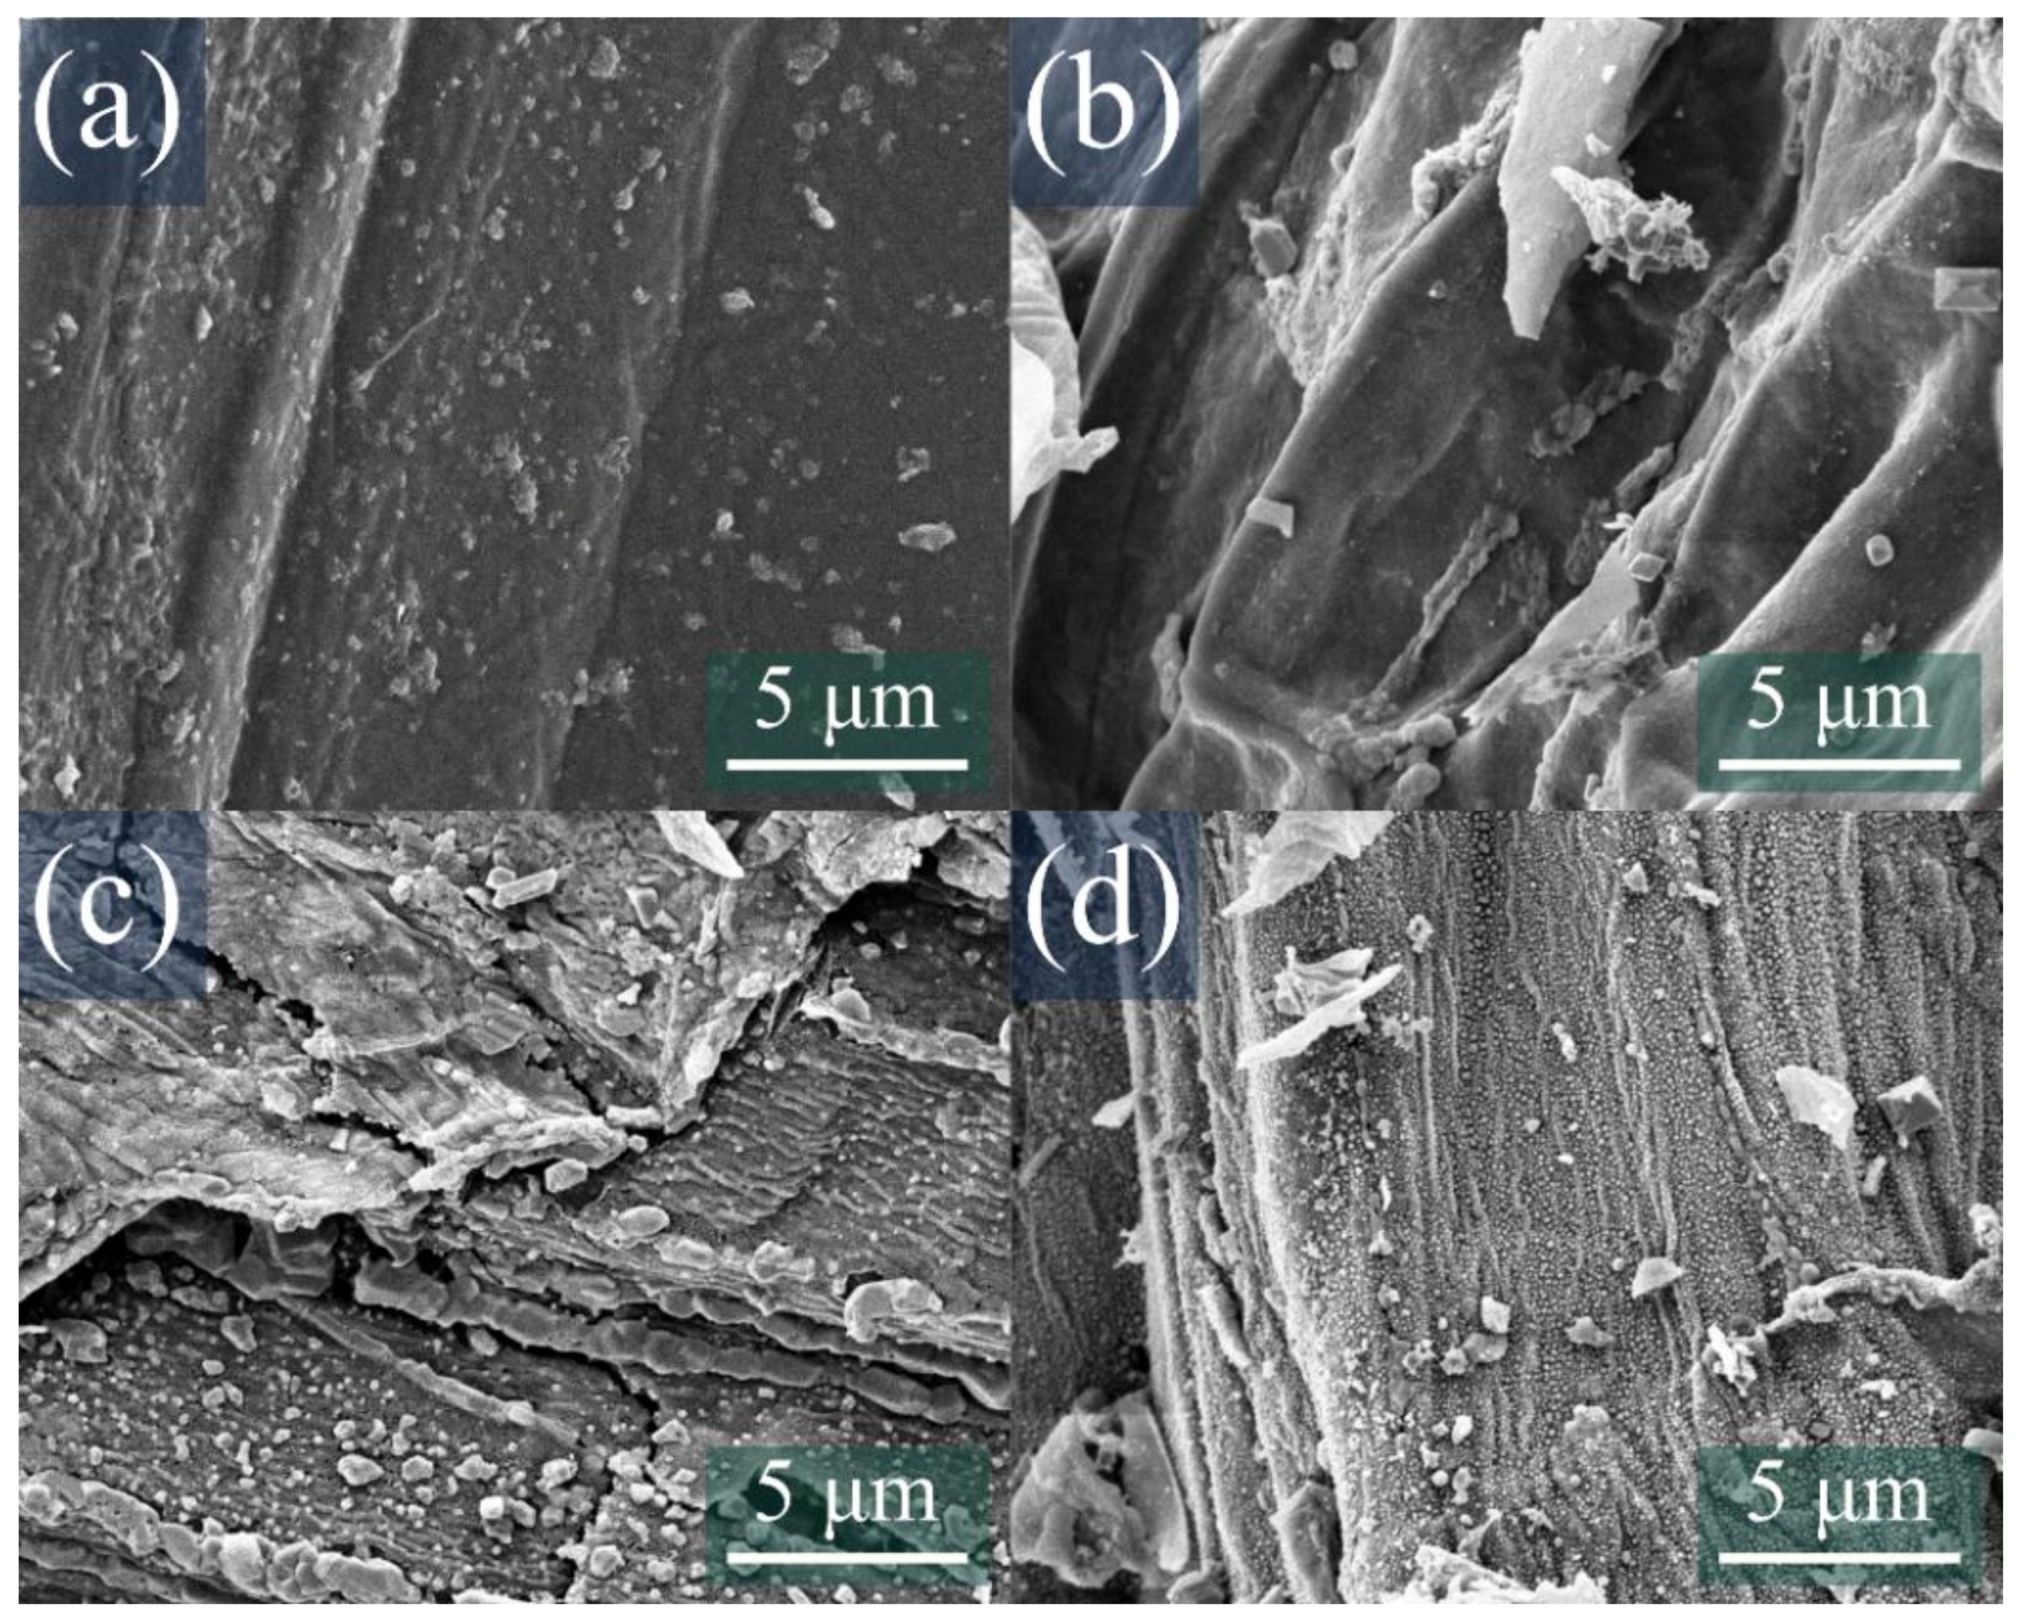
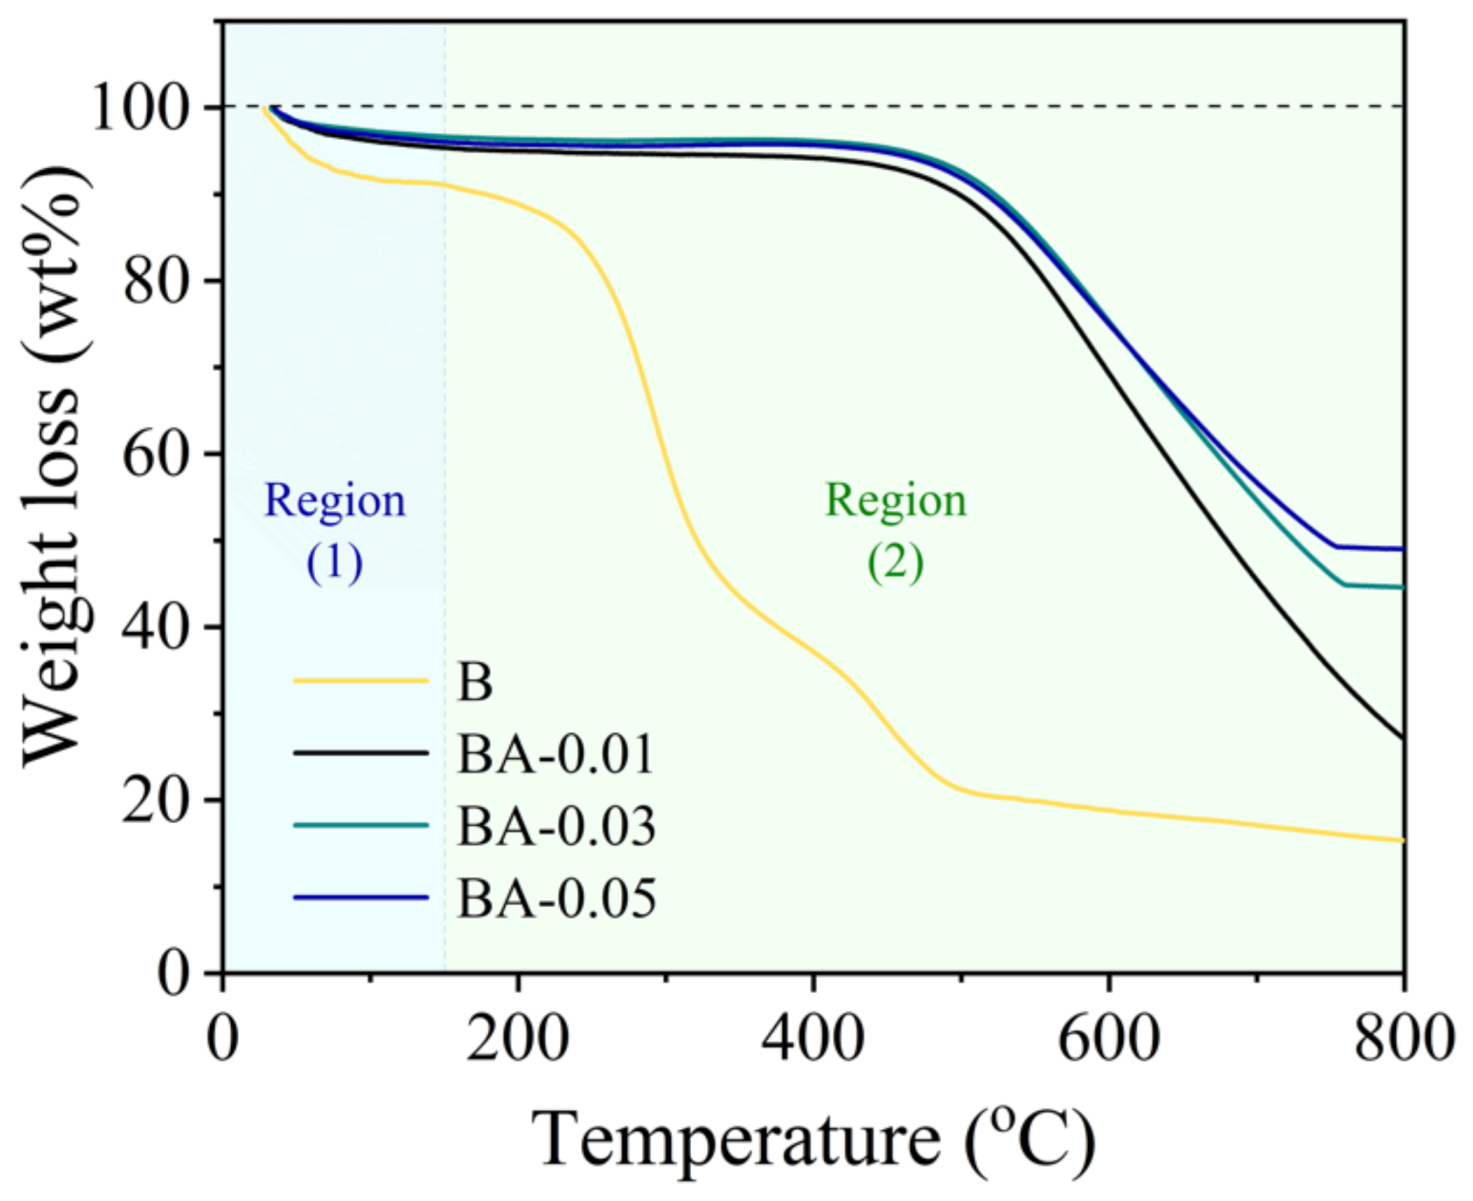
3.1. Physical Characterization

To explore the components of as-synthesized materials, XRD patterns of product were recovered and compared to those of the biomass source. Figure 1 depicts the diffraction patterns of banana stem-based materials in counts/s unit and Figure S1 shows individual XRD patterns for clarification. The pattern of the stem of a raw banana (Figure S1a) represented the broad peak of amorphous carbon at around 22°, along with broad peak at 16° and small peak at 35°, which could also be interpreted as cellulose [21]. Other sharp peaks were suspected to contain salt, such as KCl (JCPDS card number 75-0296) and CaC2O4·H2O. (JCPDS card no. 77-1160). These are common minerals present in unprocessed biomass. As for the patterns of products derived from banana stems, all of the peaks with the highest intensity were well matched with Fe3O4 (JCPDS card no. 75-0449), which was anticipated to be the primary component of nanocomposite materials. Fe3O4 peak intensities were proportionate to the iron salt concentrations utilized in each preparation. Since the sharpness of XRD patterns is connected to crystallinity, this discovery revealed that the concentration of iron salt increases the crystallinity of Fe3O4. However, salt content peaks were not observed in the nanocomposite products, despite no further purification of the precursor. This might be caused by the rinsing and soaking steps during the introduction of the iron salt catalyst into the precursor, resulting in salt loss and the absence of K and Ca species in XRD. Furthermore, the peaks indicating amorphous carbon (22°) and graphitic carbon (26°) were only observed in BA-0.01 and dissipated at increasing iron salt concentrations. It is possible that the carbon content within the material was lost because it could be mostly spent during the reduction ofthe iron salt catalysts [20]. Nevertheless, another reason could have been that the crystallinity of carbon within the nanocomposites was very low compared to Fe3O4. Hence, the existence and structure of carbon content within the materials would be later confirmed using other characterization methods.
Raman spectroscopy was utilized to track the changes in structure parameters, particularly the graphitization degree. One product was chosen to have its Raman spectrum recovered and compared to raw materials. Figure 2 depicts the results obtained. There were three major peaks in the Raman spectra, showing the presence of graphitic carbon: the D band (1330 cm−1), the G band (1580 cm−1), and the 2D band (2880 cm−1). D bands typically provide information regarding the disorder of graphitic structures, whereas G bands arise from the in-plane vibrations of aromatic carbons in pristine structures [22]. Consequently, the ratio of the intensities of the D and G bands (ID/IG ratio) was frequently utilized to determine the degree of graphitization in graphitic carbon materials. Lower ID/IG ratios often indicate a higher degree of graphitization in the material [23]. In addition, it was discovered that 2D bands suggest multilayer features that are exclusive to graphitic structures. In this instance, the graph demonstrates that the ID/IG ratios of both raw materials were lower than those of the nanocomposite materials. Nevertheless, the spectra of all substances were a mixture of more than one D band. The intensities and sizes of each peak in all spectra were determined using Lorentzian equations. In addition to the most powerful D1 band, the D3 band was also observed at around 1500 cm−1, coupled with the D4 band as a shoulder peak at approximately 1200 cm−1. To be precise, the D1 band is not only associated with defects but also with aromatic rings, sp2 carbon atoms, and carbon from the structure’s edges, all of which led the D1 band to be more prevalent in the Raman spectra of graphitic carbon. The D3 band represents sp2-bonded carbon fragments or functional groups in the disordered structure. Finally, the D4 band is dedicated to the vibration modes of sp3 carbon [24].
The raw material spectrum of a banana stem contains all the mentioned D and G bands at identical strengths. The cause is the naturally chaotic structure of biomass composed of sp, sp2, and sp3 carbon atoms. Unexpectedly, a 2D band was also detected in the unprocessed material, indicating that the precursor was already graphitized. When banana stem was utilized to create nanocomposite material (BA-0.05), the D3 and D4 band intensities decreased dramatically. On the contrary, D1 band and G band intensities increased significantly. This event indicated that the majority of functional groups, amorphous carbon, and sp3 carbon were removed or converted to sp2 carbons in the graphitic structure. The peak regions of all D bands and the G band were compared using the ratio (AD/AG) [25] in order to further analyze the global alterations in the structure. The shift in AD/AG of banana stem materials indicated a small decrease in structural defects (3.760 to 3.738). The raw banana stem was successfully transformed into carbon with a higher degree of graphitization, even though the material was still very disordered.
The effects of precursors and concentrations of iron on the morphology of the products were visualized by the SEM technique. The secondary electron images of banana stem powder and its synthesized products are displayed in Figure 3. An image of dried banana stem powder in Figure 3a shows parallel sheet morphology, which was probably a part of the xylem wall in the banana [26]. Moreover, small particles were commonly found scattered on the surface. These particles mostly consisted of KCl, the main salt content observed in the XRD technique. In the case of nanocomposite materials, as shown in Figure 3b,d, the images revealed rough, cracked carbon sheets. On the surface, spherical nanoparticles and various shapes of nanocrystalline were discovered. These were expected to be a combination of salt contents and Fe species. The number of particles on carbon sheets was proportional to the concentrations of iron salt used. The particles detected in BA-0.01 (Figure 3b) were significantly lower than in BA-0.03 (Figure 3c) and BA-0.05 (Figure 3d), which corresponds to the obscured intensity of iron oxide peaks in the XRD results. Most importantly, the images of nanocomposite materials exhibit great distribution of nanoparticles. The results were favorable because the evenly dispersed particles ensured that the carbon matrix could fully support the iron oxide particles and assist in charge-transfer reactions.
TEM was used to fully illustrate the missing morphological details in SEM and obtain more information on distribution behavior and nanocrystalline structure on the surface. The as-synthesized nanocomposite material with the best electrochemical performance (BA-0.05) was selected as a representative. As a result, TEM images along with the corresponding selected area electron diffraction (SAED) pattern of BA-0.05 are displayed in Figure 4. The image of BA-0.05 in Figure 4a displays highly distributed spherical nanoparticles on carbon sheets, which emphasized the morphology observed in SEM. The nanoparticles decorated on carbon sheets ranged in size from 14.8 to 54.7 nm, with an average of 30.3 nm. In the corresponding SAED pattern (the inset of Figure 4b), the ring patterns could be indexed to graphite and Fe3O4, as well as KCl, which could not be identified by XRD. Therefore, KCl might have remained at a very small amount and was discovered only because of the selective nature of TEM-SAED. These observations put emphasis on the existence of carbon and Fe3O4 in BA-0.05. In addition, it was worth noting that the material still possessed a miniscule amount of salt content, which was undistinguishable from Fe3O4 in both SEM and TEM.
The weight ratio of the Fe3O4 and carbon presented in the nanocomposite products was measured using TGA. The prepared products were heated at temperatures ranging from 25 to 800 °C in an ambient atmosphere at a heating rate of 10 °C per minute. The TGA curves of precursors and prepared products, as shown in Figure 5, obviously demonstrate two major stages of weight loss processes. In the early stages, weight loss below 150 °C was attributed to the evaporation of absorbed moisture from the materials’ surfaces. Following that, carbon and some carbon-containing compounds undergo a combustion process to produce carbon dioxide. The carbon dioxide gas would be released into the atmosphere, leading to a mass loss as shown in Equation (1) [27,28]. The proportion of carbon in carbon-based nanocomposite materials was measured by this weight loss process, particularly between 150 and 600 °C.
C(s) + O2(g) → CO2(g)
In the case of the raw banana stem (B), however, the TGA curve represents several minor weight loss levels. Following dehydration, the first weight loss at 200–300 °C resulted from the volatilization of organic compounds contained in the biomass, as well as hemicellulose decomposition. The combustion reaction of cellulose and other carbon compounds could contribute to the second weight loss of around 350–450 °C [26]. After 500 °C, the graph still showed a slight but gradual weight loss. In Luo et al.’s report, the same phenomenon was also observed and reported as the decomposition of lignin [29]. Considering the non-hydrated material, the weight percentage of carbon content was determined to be 83.14%, with another 16.86% of weight remaining at the end of the test. These residual contents were a combination of salt contents (KCl and CaC2O4), which were earlier observed in the XRD patterns of raw material (B) along with electron microscopy images.
In contrast, all banana stem-derived nanocomposite materials exhibited less complicated TGA curves with two major weight loss ranges. This was due to the fact that the graphitization process had already eliminated volatile compounds and functional groups from the carbon sources during heat treatment. While the second stage of weight loss resulted from carbon combustion, as demonstrated in Equation (1), simultaneously, Fe3O4 would also be oxidized, producing Fe2O3 [30,31], as illustrated in Equation (2).
4Fe3O4 + O2 → 6Fe2O3
The complete oxidation of Fe3O4 would raise the weight percent by around 3%. Furthermore, according to the XRD results, the leftover salts mostly dissolved in the iron salt solution during the iron catalyst impregnation step and could not be detected. Hence, only iron oxide remained at the end of the measurement. The percentages of carbon content in BA-0.01, BA-0.03, and BA-0.05 determined from TGA values are 73.27, 55.56, and 50.74%, respectively, whereas the Fe3O4 contents are 26.73, 44.44, and 49.26%, respectively. It can be concluded that as the concentration of iron salts increases, more iron oxides are produced, lowering the carbon percentages in nanocomposite materials. It is also worth noting that the relation between carbon content and iron salt concentrations was non-linear. As a result, there must be a concentration limit for iron salts that maximizes the iron oxide/carbon ratio. The summarized TGA data and its corresponding calculated theoretical specific capacity are reported in Table 1.

3.2. Electrochemical Characterization

Each nanocomposite material was assembled into the half-coin cell with an average mass loading of 0.219, 0.341, and 0.350 mg/cm2 for BA-0.01, BA-0.03, and BA-0.05, respectively. First, several rate performance tests were performed to determine the capabilities of the materials at various charge-discharge rates. All nanocomposite materials had rate performances measured at the current densities of 0.05, 0.1, 0.2, 0.5, 1, and 2 A/g. The rate performance results of banana stem-based nanocomposite materials are displayed in Figure 6a. It was found that the higher the concentration of iron salt used, the higher the capacities the composite provided at every current density. This trend was within expectations because more concentrated iron salt solutions have been proven by TGA to produce more iron oxides, which could contribute to increasing specific capacity. Furthermore, when the current density was reduced from 2 A/g to 0.05 A/g at cycle 61, all materials regained a capacity nearly equal to that of the initial cycles. Interestingly, capacity changes of all products during each current density change (cycle 11, 21, 31 and so on) occurred with some delays. This phenomenon might be caused by the voltage hysteresis of Fe3O4 in nanocomposite materials [32]. It also indicates that the iron oxide species were not destroyed during the high current density measurement. Among all nanocomposites, BA-0.05 showed the best performance, displaying fewer decreases in capacity as the current density rose. However, the stability of the nanocomposite materials at high charge-discharge rates needs to be confirmed further in cycle performance tests.
The results of the cycle performance measurement of the materials at the slower charge-discharge rate of 0.1 A/g are displayed in Figure 6b. The specific capacities were mostly related to the concentrations of iron salt solution used in preparation. The higher the concentration, the higher the specific capacity. From BA-0.01 to BA-0.05, each material delivered a first discharge capacity of 673.7, 857.1, and 846.2 mAh/g. These capacities rapidly dropped in the second cycle and gradually faded afterwards, with the initial Coulombic efficiencies (ICE) of 44.4, 52.9 and 57.7%, respectively. The high discharge capacities displayed at the first cycle were commonly reported to be caused by the formation of a solid electrolyte interphase (SEI) layer [33,34,35]. The SEI layer originated from the decomposition of electrolyte as well as irreversible reactions between electrolyte, electrode materials, and lithium ions. The consumption of lithium ions leads to an unusually high capacity in the first discharge. A stable SEI layer formed on the electrode surface could prevent further reactions in the following cycles [36,37]. Hence, it is reasonable to assume that these sudden capacity drops only occurred in the first cycle. In the subsequent cycles, nanocomposite materials with higher concentrations of iron oxides displayed more capacity decrease, and fluctuations were observed more clearly during cycling. This is because some iron oxide crystals on the surface, as viewed in electron microscopy images, were not protected. Therefore, the gradual capacity loss from the unstable nature of iron oxide crystals could still occur. From the physical characterizations, there were more iron oxide crystals on the surface of BA-0.05 than on BA-0.03 or BA-0.01, and thus BA-0.05 suffered the most from this capacity fading. Interestingly, it was found that the coulombic efficiency of all nanocomposite materials reached 100%, which implied that the materials could maintain their performance at a reasonable level of stability. At the 50th cycle, banana stem-derived products displayed reversible capacities of 204.0, 319.1, and 405.6 mAh/g for BA-0.01, BA-0.03, and BA-0.05, with cycle retention percentages of 30.3, 37.2, and 47.9%, respectively. This indicated that not only could Fe3O4 enhance the specific capacity of the materials but was also able to retain the additional capacity and provide stable performance. The increase in electrical conductivity from carbon could assist in reducing capacity drop and enhancing stability [38].
Next, cycle performance tests of all materials along with pure graphite at a faster current density of 2 A/g are illustrated in Figure 6c. There were large fluctuations at BA-0.05, which were caused by the changes in temperature of the test room due to a power outage. This phenomenon was confirmed by test logs, in which the recorded date during the fluctuations was the same as the power outage records. This might be related to the reaction rate of lithium on the surface of the anode. As ambient temperature reduces, the reactivity of lithium decreases, which in turn decelerates the charge-transfer steps of lithium insertion-conversion reactions [39]. Yi et al. also reported this observation in their studies in 2017 with carbon-based anode material derived from soda papermaking black liquor [40]. In their reports, the temperature change from −10 °C to 25 °C could cause the capacity to fluctuate greatly (from 250 to 750 and back to 250 mAh/g) during one continuous cycle test. Nevertheless, at this faster charge-discharge rate, all nanocomposite materials made from banana stems could easily surpass the performance of graphite. At the 1000th cycle, the banana stem-derived products displayed reversible capacities of 112.8, 156.7, and 172.8 mAh/g for BA-0.01, BA-0.03, and BA-0.05, respectively. Compared to the performance of pure graphite at the same conditions (63.9 mAh/g), all nanocomposite materials possess 2–3 times higher reversible capacities. Apart from the extra conductivity provided by the carbon matrix, the KCl component found in SEM and TEM also contributed to enhancing the ability to withstand a high charge-discharge rate. According to the study by Li et al. [20], the presence of KCl and CaCO3 in nanocomposite materials from biomass could enhance their performance as anode materials. During the SEI formation at the first cycle, KCl particles on the surface would be included as one of the components and lead to stability enhancement during cycling. Due to the improved conductivity from carbon and stability contributed by KCl, Fe3O4 was able to provide more capacity, resulting in better overall performance of the nanocomposites. In general, it could be concluded that the as-synthesized nanocomposite materials derived from banana stems were suitable to be used as anode materials, especially in high current density conditions. Considering all of the addressed electrochemical performance, it is important to highlight that the Fe3O4/C nanocomposites derived from banana stems, used as an anode for LIBs, exhibit acceptable electrochemical performance in comparison to the previously reported Fe3O4/C materials [20,40,41,42] and other carbon-based materials which utilized a similar process [43,44,45], as shown in Table S2. When compared to other synthesis methods, the preparation in this work has a larger batch scale, no requirement for hazardous reagents, a simple process, and inexpensive production costs, whereas the battery performances were consistent over time with a reasonable specific capacity. Furthermore, Fe3O4/C nanocomposites can be greatly improved by integrating with nanoscale materials that have higher specific capacities, as well as by modifying the morphology and surface area of the carbon supports.
The reaction mechanism of the obtained anode materials was further studied by CV. The CV curves of the BA-0.05 electrode are illustrated in Figure 7a. In the first scan, the cathodic peak at 0.6 V could be generated from the irreversible reactions and SEI formation on the anode. This speculation is confirmed by the absence of this peak in the following cycles. Another cathodic peak at around 0.1 V, which was also observed in the second and third scans, displayed the lithium insertion reaction into the carbon structure.
In the subsequent cathodic scans, some distinct peaks that did not occur in the first scan appeared along with the previously mentioned cathodic peak at 0.1 V. First, one broad peak was observed at around 1.5 V. This peak was reported to represent Fe(II) reduction to Fe [41]. There were two distinct reduction peaks at around 1.0 V and 0.8 V, which were previously reported to correspond to the two-step lithiation reactions of Fe3O4 [19]. All reduction reactions appearing within the cathodic region can be summarized in Equations (3)–(6):
xLi + + xe + C     Li x C
FeIIOx + 2xLi+ + 2e → Fe + xLi2O
Fe3O4 + 2Li+ + 2e → Li2(Fe3O4)
Li2(Fe3O4) + 6Li+ + 6e → 3Fe0 + 4Li2O
For anodic scans, there was a small oxidative peak at around 0.1 V, which was from the delithiation of carbon materials. Moreover, two anodic peaks at around 1.6 V and 1.8 V represented iron metal oxidation reactions into Fe(II) and Fe(III), respectively [30,41]. During the second and third scans, these peaks appear to shift to higher voltages (around 1.7 and 1.9 V). This might be due to the structural changes of Fe3O4 during the first cycle from inverse spinel to rock salt structure. The overall reaction is displayed in Equation (7). This reaction is the reverse reaction of Equations (5) and (6), which emphasize the reversibility of iron oxides as anode materials.
3Fe + 4Li2O → Fe3O4 + 8Li+ + 8e
It should be noted that during the third scan, all peaks were found to be slightly less intense than during the previous scan. The reason was mostly because iron oxides contained in the carbon structure were slowly degrading as observed in the cycle and rate performance tests, causing some irreversibility within the materials [46].
Moreover, the galvanostatic charge-discharge profiles of BA-0.05 electrode were retrieved, as shown in Figure 7b. The resulting curves had a wide plateau detected at around 0.8 V in the discharge curve of the first cycle only. This plateau refers to the formation of the SEI layer and irreversible side reactions [19]. In the following cycles, there were two plateaus observed at 1.0–0.8 V (discharge) and 1.5–2.0 V (charge). These plateaus were from the reduction and oxidation of iron in the Fe3O4 structure to form the conversion reaction with lithium [47]. In addition, a small plateau was also observed below 0.2 V, which was from the contribution of carbon component within the nanocomposite, as observed in CV [30]. Later cycles have seen the aforementioned plateaus gradually decline. These observations emphasize the reactions in CV results affirming that both carbon and Fe3O4 were active during electrochemical measurement. However, it also indicates that Fe3O4 was the main source of capacity in nanocomposite materials, as well as capacity fading.
To investigate the transformation within the electrode during cycle performance tests, EIS measurements were performed in BA-0.05, both before and after cycling at 2 A/g for 1000 cycles. Figure 7c depicts the changes in electrochemical nature using Nyquist plots. The curves were fitted using Nova 2.1 to obtain equivalent circuit models and fitting parameters in Table 2. The gap between the plot and y axis indicates bulk resistance (RS), which is the sum of the resistances of the electrolyte solution, current collector, and other cell components. During cycling, it is possible that the cell components were gradually denatured, causing a decrease in electrical conductivity and a larger Rs value at the end of the cycle performance test. As for the semicircle part, the semicircle displayed in the Nyquist plot before cycling was generated from charge-transfer resistance (Rct), which refers to the internal resistance from the charge-transfer reaction within the battery, and the constant phase element (CPE) of the electrical double layer formed between the electrode surface and electrolyte during measurement. In the case of used cells, the first semicircle could represent the resistance from the CPE and SEI layer (RSEI), which was formed at the beginning of the cycle performance test [48]. The second semicircle at a higher frequency also displayed charge-transfer resistance (Rct). This Rct value depends on the active sites and lithium intercalation characteristics of each material. In a fresh cell, each component was still intact and unaltered. This was reflected in a lower Rct value compared to a used cell and implied that the anode material had undergone structural changes. This demonstrates that the results from structural changes were reduced reaction rates and capacity loss, as previously observed in cycle performance tests. Lastly, the straight line after the semicircle plots represents Warburg impedance (W), which indicates Li+ diffusion behavior [49]. The circuit model of the resulting Nyquist plots was simplified, as shown in the inset of Figure 7c. Furthermore, the data within the Warburg region could be used to determine the lithium diffusion coefficient ( D Li + ) using Equation (8) [50]:
D Li + = R 2 T 2 2 n 4 F 4 A 2 C 2 σ w 2
where R = gas constant (8.314 J/K mol), T = absolute room temperature, A = surface area of the electrode, n = number of electrons per molecule during oxidation, F = Faraday’s constant (96,500 C/mol), C = the concentration of Li+, and σW = Warburg coefficient [51].
It is clear that D Li + is inversely proportional to the σW value, which could be obtained from the relationship between Z’ (Zre) and angular frequency (ω), as Z’ = RD + RL + σWω−1/2 [52]. Figure 7d shows the linear plots between Z’ and ω−1/2 from the low-frequency region of each sample, which theoretically possess a slope equal to the value of σW. As stated in the graph, σW slightly increased after cycling, suggesting that the structural changes within the material obstructed Li+ diffusion and contributed to the gradual capacity loss during cycle performance tests.
According to the CV results, the lithiation-delithiation mechanism within the nanocomposite material is illustrated in Figure 8. In the first lithiation, Fe3O4 nanoparticles distributed on carbon sheets would undergo a conversion reaction with lithium and the formation of the SEI layer, resulting in the mixed components of Fe/Li2O/C/SEI, as evidenced by the 0.6 V peak potential in the first cathodic scan. After that, the following delithiation process at 1.6 and 1.8 V would transform Fe and Li2O back to the mixed phase of Fe3O4 and Li2O contained within the SEI layer, with released Li+ near the sites of reaction. When this Fe3O4/Li2O was lithiated in the second cycle, it was implied by the reduction peak potential at 0.8 and 1.0 V in CV that the lithiation mechanism changed to two-step reactions. First, Li2(Fe3O4) formation occurred from neighboring Li+ and Fe3O4. Then, more Li+ were introduced to Li2(Fe3O4) and converted to Fe/Li2O. The phase evolutions within nanoparticles from pure Fe3O4 to mixed phases can also be confirmed by the increase of internal resistance (Rct) after the cycle performance test. Afterwards, the lithiation-delithiation process remained the same as in the second cycle. Nevertheless, some unreacted Li2O could be lost during each cycle, which caused the slight but gradual capacity decay. The carbon matrix supports the reversibility of the reactions by enhancing conductivity and obstructing the accumulation of Fe3O4 particles. Moreover, the stable SEI from the salt contents naturally presented in the biomass could prevent the particles from further deterioration during long-term cycling.
All of the aforementioned factors lead to good anode characteristics and electrochemical performance in LIBs. In addition, this synthesis approach, which is a very straightforward and low-cost process with mild conditions, was easily applicable to varied biomasses to obtain the Fe3O4/C nanocomposite-based anode materials Moreover, the Fe3O4/C nanocomposite produced from banana stem waste recycling revealed an improved electrochemical method in terms of operating under high current density and long-life cycle conditions. Because of the structural morphological benefits and electrochemical capabilities of their compositions, Fe3O4/C nanocomposites, especially the BA-0.05 electrode, might be considered an appropriate anode material for advanced technologies, especially electric vehicles, in the next generation of LIBs.

4. Conclusions

In this study, graphitic carbon-based nanocomposite materials were derived from banana stem waste by catalytic graphitization. Various concentrations of iron salt catalyst, ranging from 0.01 to 0.05 M, were used to optimize the properties of nanocomposite materials. XRD patterns and TGA revealed that the nanocomposite materials mainly consist of carbon, iron oxides, and salt contents. The morphology of all products was visualized by SEM to have iron oxide species nanoparticles and nanocrystalline salts that were uniformly distributed on rough carbon sheets. The carbon component in the nanocomposite was further confirmed by Raman spectroscopy to be graphitic carbon with an improved degree of graphitization from the precursor. In the electrochemical tests, BA-0.05 was able to deliver the best performances, delivering the reversible capacity of 405.6 mAh/g at 0.1 A/g for 50 cycles and 172.8 mAh/g at 2 A/g for 1000 cycles. The cyclic voltammetry and charge-discharge profiles indicate that the capacity of both materials was due to the contributions of both carbon and iron oxides. All results maintain that the nanocomposite materials derived from local biomass waste could be used as a cost-effective alternative to graphite as an anode in LIBs.

Supplementary Materials

The following supporting information can be downloaded at: https://www.mdpi.com/article/10.3390/cryst13020280/s1, Table S1: The XRD measurement parameters of raw material (B) and nanocomposite materials (BA-X.XX); Figure S1: XRD patterns of (a) raw material (b) BA-0.01 (c) BA-0.03 and (d) BA-0.05; Table S2: Comparison of preparations and performances between former Fe3O4/C materials from biomass and this work.

Author Contributions

Investigation and writing—original draft preparation, W.Y. and T.A.; conceptualization, W.Y. and T.A.; methodology, W.Y., K.K. and M.H.; writing—review and editing, W.Y., T.S., N.R. and T.A.; visualization, W.Y., K.K., N.R., M.H. and T.A.; supervision, T.S. and T.A. All authors have read and agreed to the published version of the manuscript.

Funding

This research was funded by TSRI, and the Program Management Unit for Human Resources and Institutional Development, Research and Innovation, Office of National Higher Education Science Research and Innovation Policy Council (NXPO) in Global Partnership Project [Grant No. B16F640001]. Advanced electron microscopy was supported by the Collaborative Research Program of Institute for Chemical Research, Kyoto University [Grant No.2022-127].

Institutional Review Board Statement

Not applicable.

Informed Consent Statement

Not applicable.

Data Availability Statement

Not applicable.

Acknowledgments

This work was supported by the financial funding from the post-doctoral fellowships, Chiang Mai University, Center of Excellence in Materials Science and Technology, and the Program Management Unit for Human Resources and Institutional Development, Postgraduate Education and Research Program in Chemistry (PERCH-CIC), Research and Innovation, Office of National Higher Education Science Research. The authors would also like to thank the Renewable Energy Laboratory-Advanced Battery Research Unit, Department of Chemistry, Chiang Mai University for sample preparation and characterization.

Conflicts of Interest

The authors declare no conflict of interest.

References

  1. Zubi, G.; Dufo-López, R.; Carvalho, M.; Pasaoglu, G. The Lithium-Ion Battery: State of the Art and Future Perspectives. Renew. Sustain. Energy Rev. 2018, 89, 292–308. [Google Scholar] [CrossRef]
  2. Mekonnen, Y.; Sundararajan, A.; Sarwat, A.I. A Review of Cathode and Anode Materials for Lithium-Ion Batteries. In Proceedings of the IEEE SoutheastCon 2016, Norfolk, VA, USA, 30 March–3 April 2016; pp. 1–6. [Google Scholar]
  3. Asenbauer, J.; Eisenmann, T.; Kuenzel, M.; Kazzazi, A.; Chen, Z.; Bresser, D. The Success Story of Graphite as a Lithium-Ion Anode Material-Fundamentals, Remaining Challenges, and Recent Developments Including Silicon (Oxide) Composites. Sustain. Energy Fuels 2020, 4, 5387–5416. [Google Scholar] [CrossRef]
  4. Yu, H.-Y.; Liang, H.-J.; Gu, Z.-Y.; Meng, Y.-F.; Yang, M.; Yu, M.-X.; Zhao, C.-D.; Wu, X.-L. Waste-to-Wealth: Low-Cost Hard Carbon Anode Derived from Unburned Charcoal with High Capacity and Long Cycle Life for Sodium-Ion/Lithium-Ion Batteries. Electrochim. Acta 2020, 361, 137041. [Google Scholar] [CrossRef]
  5. Thompson, E.; Danks, A.E.; Bourgeois, L.; Schnepp, Z. Iron-Catalyzed Graphitization of Biomass. Green Chem. 2015, 17, 551–556. [Google Scholar] [CrossRef]
  6. Wang, L.; Guo, Q.; Wang, J.; Li, H.; Wang, G.; Yang, J.; Song, Y.; Qin, Y.; Liu, L. Improved Cycling Performance of a Silicon Anode for Lithium Ion Batteries Using Carbon Nanocoils. RSC Adv. 2014, 4, 40812–40815. [Google Scholar] [CrossRef]
  7. Autthawong, T.; Chayasombat, B.; Laokawee, V.; Jarulertwathana, N.; Masuda, T.; Sarakonsri, T. Nanostructural Study of Silicon-Cobalt/Nitrogen-Doped Reduced Graphene Oxide Composites by Electron Microscopy for Using as Anode Material in Lithium-Ion Batteries. In Solid State Phenomena; Trans Tech Publications Ltd: Wollerau, Switzerland, 2018; Volume 283, pp. 37–45. [Google Scholar]
  8. Liu, L.; Xie, F.; Lyu, J.; Zhao, T.; Li, T.; Choi, B.G. Tin-Based Anode Materials with Well-Designed Architectures for next-Generation Lithium-Ion Batteries. J. Power Sources 2016, 321, 11–35. [Google Scholar] [CrossRef]
  9. Liu, X.; Wu, X.Y.; Chang, B.; Wang, K.X. Recent Progress on Germanium-Based Anodes for Lithium Ion Batteries: Efficient Lithiation Strategies and Mechanisms. Energy Storage Mater. 2020, 30, 146–169. [Google Scholar] [CrossRef]
  10. Autthawong, T.; Promanan, T.; Chayasombat, B.; Yu, A.S.; Uosaki, K.; Yamaguchi, A.; Kurata, H.; Chairuangsri, T.; Sarakonsri, T. Facile Synthesis Sandwich-Structured Ge/Nrgo Nanocomposite as Anodes for High-Performance Lithium-Ion Batteries. Crystals 2021, 11, 1582. [Google Scholar] [CrossRef]
  11. Lu, Y.; Yu, L.; Lou, X.W.D. Nanostructured Conversion-Type Anode Materials for Advanced Lithium-Ion Batteries. Chem 2018, 4, 972–996. [Google Scholar] [CrossRef]
  12. Liu, Z.; Andreev, Y.G.; Armstrong, A.R.; Brutti, S.; Ren, Y.; Bruce, P.G. Nanostructured TiO2(B): The Effect of Size and Shape on Anode Properties for Li-Ion Batteries. Prog. Nat. Sci. Mater. Int. 2013, 23, 235–244. [Google Scholar] [CrossRef]
  13. Deng, D.; Kim, M.G.; Lee, J.Y.; Cho, J. Green Energy Storage Materials: Nanostructured TiO2 and Sn-Based Anodes for Lithium-Ion Batteries. Energy Env. Sci. 2009, 2, 818–837. [Google Scholar] [CrossRef]
  14. Autthawong, T.; Yodbunork, C.; Yodying, W.; Boonprachai, R.; Namsar, O.; Yu, A.S.; Chimupala, Y.; Sarakonsri, T. Fast-Charging Anode Materials and Novel Nanocomposite Design of Rice Husk-Derived SiO2 and Sn Nanoparticles Self-Assembled on TiO2(B) Nanorods for Lithium-Ion Storage Applications. ACS Omega 2022, 7, 1357–1367. [Google Scholar] [CrossRef] [PubMed]
  15. Ratsameetammajak, N.; Autthawong, T.; Chairuangsri, T.; Kurata, H.; Yu, A.S.; Sarakonsri, T. Rice Husk-Derived Nano-SiO2 Assembled on Reduced Graphene Oxide Distributed on Conductive Flexible Polyaniline Frameworks towards High-Performance Lithium-Ion Batteries. RSC Adv. 2022, 12, 14621–14630. [Google Scholar] [CrossRef] [PubMed]
  16. Gomez-Martin, A.; Martinez-Fernandez, J.; Ruttert, M.; Heckmann, A.; Winter, M.; Placke, T.; Ramirez-Rico, J. Iron-Catalyzed Graphitic Carbon Materials from Biomass Resources as Anodes for Lithium-Ion Batteries. ChemSusChem 2018, 11, 2776–2787. [Google Scholar] [CrossRef]
  17. Qi, W.; Shapter, J.G.; Wu, Q.; Yin, T.; Gao, G.; Cui, D. Nanostructured Anode Materials for Lithium-Ion Batteries: Principle, Recent Progress and Future Perspectives. J. Mater. Chem. A Mater. 2017, 5, 19521–19540. [Google Scholar] [CrossRef]
  18. Boonprachai, R.; Autthawong, T.; Namsar, O.; Yodbunork, C.; Yodying, W.; Sarakonsri, T. Natural Porous Carbon Derived from Popped Rice as Anode Materials for Lithium-Ion Batteries. Crystals 2022, 12, 223. [Google Scholar] [CrossRef]
  19. He, C.; Wu, S.; Zhao, N.; Shi, C.; Liu, E.; Li, J. Carbon-Encapsulated Fe3O4 Nanoparticles as a High-Rate Lithium Ion Battery Anode Material. ACS Nano 2013, 7, 4459–4469. [Google Scholar] [CrossRef]
  20. Li, T.; Bai, X.; Qi, Y.X.; Lun, N.; Bai, Y.J. Fe3O4 Nanoparticles Decorated on the Biochar Derived from Pomelo Pericarp as Excellent Anode Materials for Li-Ion Batteries. Electrochim. Acta 2016, 222, 1562–1568. [Google Scholar] [CrossRef]
  21. Gong, J.; Li, J.; Xu, J.; Xiang, Z.; Mo, L. Research on Cellulose Nanocrystals Produced from Cellulose Sources with Various Polymorphs. RSC Adv. 2017, 7, 33486–33493. [Google Scholar] [CrossRef]
  22. Dresselhaus, M.S.; Jorio, A.; Saito, R. Characterizing Graphene, Graphite, and Carbon Nanotubes by Raman Spectroscopy. Annu. Rev. Condens. Matter Phys. 2010, 1, 89–108. [Google Scholar] [CrossRef]
  23. Charon, E.; Rouzaud, J.N.; Aléon, J. Graphitization at low temperatures (600–1200 °C) in the presence of iron implications in planetology. Carbon 2014, 66, 178–190. [Google Scholar] [CrossRef]
  24. Yin, Y.; Yin, J.; Zhang, W.; Tian, H.; Hu, Z.; Ruan, M.; Song, Z.; Liu, L. Effect of Char Structure Evolution During Pyrolysis on Combustion Characteristics and Kinetics of Waste Biomass. J. Energy Resour. Technol. 2018, 140, 1–10. [Google Scholar] [CrossRef]
  25. Gómez-Urbano, J.L.; Moreno-Fernández, G.; Arnaiz, M.; Ajuria, J.; Rojo, T.; Carriazo, D. Graphene-coffee waste derived carbon composites as electrodes for optimized lithium ion capacitors. Carbon 2020, 162, 273–282. [Google Scholar] [CrossRef]
  26. Subramanya, R.; Satyanarayana, K.G.; Shetty Pilar, B. Evaluation of Structural, Tensile and Thermal Properties of Banana Fibers. J. Nat. Fibers 2017, 14, 485–497. [Google Scholar]
  27. Zhao, X.; Xia, D.; Yue, J.; Liu, S. In-situ generated nano-Fe3C embedded into nitrogen-doped carbon for high performance anode in lithium ion battery. Electrochim. Acta 2014, 116, 292–299. [Google Scholar] [CrossRef]
  28. Huang, Y.-G.; Lin, X.-L.; Zhang, X.-H.; Pan, Q.-C.; Yan, Z.-X.; Wang, H.-Q.; Chen, J.-J.; Li, Q.-Y. Fe3C@carbon nanocapsules/expanded graphite as anode materials for lithium ion batteries. Electrochim. Acta 2015, 178, 468–475. [Google Scholar] [CrossRef]
  29. Luo, G.; Strong, P.J.; Wang, H.; Ni, W.; Shi, W. Kinetics of the Pyrolytic and Hydrothermal Decomposition of Water Hyacinth. Bioresour. Technol. 2011, 102, 6990–6994. [Google Scholar] [CrossRef] [PubMed]
  30. Gu, S.; Liu, Y.; Zhang, G.; Shi, W.; Liu, Y.; Zhu, J. Fe3O4/Carbon Composites Obtained by Electrospinning as an Anode Material with High Rate Capability for Lithium Ion Batteries. RSC Adv. 2014, 4, 41179–41184. [Google Scholar] [CrossRef]
  31. Ding, C.; Zeng, Y.; Cao, L.; Zhao, L.; Zhang, Y. Hierarchically Porous Fe3O4/C Nanocomposite Microspheres via a CO2 Bubble-Templated Hydrothermal Approach as High-Rate and High-Capacity Anode Materials for Lithium-Ion Batteries. J. Mater. Chem. A Mater. 2016, 4, 5898–5908. [Google Scholar] [CrossRef]
  32. Valvo, M.; Floraki, C.; Paillard, E.; Edström, K.; Vernardou, D. Perspectives on Iron Oxide-Based Materials with Carbon as Anodes for Li- and K-Ion Batteries. Nanomaterials 2022, 12, 1436. [Google Scholar] [CrossRef]
  33. Persson, K.; Sethuraman, V.A.; Hardwick, L.J.; Hinuma, Y.; Meng, Y.S.; van der Ven, A.; Srinivasan, V.; Kostecki, R.; Ceder, G. Lithium Diffusion in Graphitic Carbon. J. Phys. Chem. Lett. 2010, 1, 1176–1180. [Google Scholar] [CrossRef]
  34. Kim, M.S.; Bhattacharjya, D.; Fang, B.; Yang, D.S.; Bae, T.S.; Yu, J.S. Morphology-Dependent Li Storage Performance of Ordered Mesoporous Carbon as Anode Material. Langmuir 2013, 29, 6754–6761. [Google Scholar] [CrossRef]
  35. Thapaliya, B.P.; Luo, H.; Halstenberg, P.; Meyer, H.M.; Dunlap, J.R.; Dai, S. Low-Cost Transformation of Biomass-Derived Carbon to High-Performing Nano-Graphite via Low-Temperature Electrochemical Graphitization. ACS Appl. Mater. Interfaces 2021, 13, 4393–4401. [Google Scholar] [CrossRef]
  36. Bredar, A.R.C.; Chown, A.L.; Burton, A.R.; Farnum, B.H. Electrochemical Impedance Spectroscopy of Metal Oxide Electrodes for Energy Applications. ACS Appl. Energy Mater. 2020, 3, 66–98. [Google Scholar] [CrossRef]
  37. Wang, Q.; Mao, B.; Stoliarov, S.I.; Sun, J. A Review of Lithium Ion Battery Failure Mechanisms and Fire Prevention Strategies. Prog. Energy Combust. Sci. 2019, 73, 95–131. [Google Scholar] [CrossRef]
  38. Long, W.; Fang, B.; Ignaszak, A.; Wu, Z.; Wang, Y.J.; Wilkinson, D. Biomass-Derived Nanostructured Carbons and Their Composites as Anode Materials for Lithium Ion Batteries. Chem. Soc. Rev. 2017, 46, 7176–7190. [Google Scholar] [CrossRef]
  39. Ma, S.; Jiang, M.; Tao, P.; Song, C.; Wu, J.; Wang, J.; Deng, T.; Shang, W. Temperature effect and thermal impact in lithium-ion batteries: A review. Prog. Nat.Sci. Mater. Int. 2018, 28, 653–666. [Google Scholar] [CrossRef]
  40. Yi, X.; He, W.; Zhang, X.; Yue, Y.; Yang, G.; Wang, Z.; Zhou, M.; Wang, L. Graphene-like carbon sheet/Fe3O4 nanocomposites derived from soda papermaking black liquor for high performance lithium ion batteries. Electrochim. Acta 2017, 232, 550–560. [Google Scholar] [CrossRef]
  41. Huang, Y.; Li, X.; Xu, X.; Wei, F.; Wang, Y.; Ma, M.; Wang, Y.; Sun, D. Green and up-scalable fabrication of superior anodes for lithium storage based on biomass bacterial cellulose. Adv. Powder Technol. 2021, 32, 2484–2492. [Google Scholar] [CrossRef]
  42. Li, R.; Kamali, A.R. Clean preparation of Fe2SiO4 coated Fe2O3 integrated with graphene for Li-ion storage application. Colloids Surf. A Physicochem. Eng. Asp. 2023, 656, 130275. [Google Scholar] [CrossRef]
  43. Gomez-Martin, A.; Martinez-Fernandez, J.; Ruttert, M.; Winter, M.; Placke, T.; Ramirez-Rico, J. Porous Graphene-like Carbon from Fast Catalytic Decomposition of Biomass for Energy Storage Applications. ACS Omega 2019, 4, 21446–21458. [Google Scholar] [CrossRef] [PubMed]
  44. Liu, Y.; Li, X.; Haridas, A.K.; Sun, Y.; Heo, J.; Ahn, J.H.; Lee, Y. Biomass-Derived Graphitic Carbon Encapsulated Fe/Fe3C Composite as an Anode Material for High-Performance Lithium Ion Batteries. Energies 2020, 13, 827. [Google Scholar] [CrossRef]
  45. Li, B.; Zhang, Y.; Xiong, J.; Gui, Y.; Huang, T.; Peng, J.; Liu, H.; Yang, F.; Li, M. Chitosan-derived graphitic carbon@Fe3C as anode materials for lithium ion battery. J. Mater. Sci. 2022, 9939–9954. [Google Scholar] [CrossRef]
  46. Zhu, T.; Chen, J.S.; Lou, X.W. Glucose-Assisted One-Pot Synthesis of FeOOH Nanorods and Their Transformation to Fe3O4@carbon Nanorods for Application in Lithium Ion Batteries. J. Phys. Chem. C 2011, 115, 9814–9820. [Google Scholar] [CrossRef]
  47. Zhang, W.M.; Wu, X.L.; Hu, J.S.; Guo, Y.G.; Wan, L.J. Carbon Coated Fe3O4 Nanospindles as a Superior Anode Material for Lithium-Ion Batteries. Adv. Funct. Mater. 2008, 18, 3941–3946. [Google Scholar] [CrossRef]
  48. Lin, P.C.; Wu, J.Y.; Liu, W.R. Green and Facile Synthesis of Few-Layer Graphene via Liquid Exfoliation Process for Lithium-Ion Batteries. Sci. Rep. 2018, 8, 9766. [Google Scholar] [CrossRef]
  49. Choi, W.; Shin, H.C.; Kim, J.M.; Choi, J.Y.; Yoon, W.S. Modeling and Applications of Electrochemical Impedance Spectroscopy (Eis) for Lithium-Ion Batteries. J. Electrochem. Sci. Technol. 2020, 11, 1–13. [Google Scholar] [CrossRef]
  50. Autthawong, T.; Yodbunork, C.; Ratsameetammajak, N.; Namsar, O.; Chimupala, Y.; Sarakonsri, T. Enhanced Electrochemical Performance of Sn(SnO2)/TiO2(B) Nanocomposite Anode Materials with Ultrafast Charging and Stable Cycling for High-Performance Lithium-Ion Batteries. ACS Appl. Energy Mater. 2022, 5, 13829–13842. [Google Scholar] [CrossRef]
  51. Lin, Q.; Wang, J.; Zhong, Y.; Sunarso, J.; Tadé, M.O.; Li, L.; Shao, Z. High Performance Porous Iron Oxide-Carbon Nanotube Nanocomposite as an Anode Material for Lithium-Ion Batteries. Electrochim. Acta 2016, 212, 179–186. [Google Scholar] [CrossRef]
  52. Duan, W.; Zhu, Z.; Li, H.; Hu, Z.; Zhang, K.; Cheng, F.; Chen, J. Na3V2(PO4)3@C Core-Shell Nanocomposites for Rechargeable Sodium-Ion Batteries. J. Mater. Chem. A Mater. 2014, 2, 8668–8675. [Google Scholar] [CrossRef]
Figure 1. XRD patterns of as-synthesized materials and precursors.
Crystals 13 00280 g001
Figure 2. Raman spectra of selected BA-0.05 nanocomposite and raw materials (B). D1–D3 and G explained in the text.
Crystals 13 00280 g002
Figure 3. SEM images of as-synthesized materials; (a) raw material (B), (b) BA-0.01, (c) BA-0.03, and (d) BA-0.05 nanocomposites.
Crystals 13 00280 g003
Figure 4. (a) Low-magnification TEM image and (b) TEM image and corresponding SAED patterns of as-synthesized BA-0.05 nanocomposite.
Crystals 13 00280 g004
Figure 5. Thermogravimetric analysis of as-synthesized banana stem-based materials.
Crystals 13 00280 g005
Figure 6. Battery performances of prepared banana stem electrodes; (a) Rate cycle capability at various current densities, (b) Cycle performance at a current density of 0.1 A/g for 50 cycles, and (c) long-term cycle stability at a fast-charging stage of 2 A/g for 1000 cycles compared to commercial graphite.
Crystals 13 00280 g006
Figure 7. Electrochemical properties of prepared BA-0.05 electrode; (a) cyclic voltammogram at scan step 0.1 mV/s for the first three cycles, (b) galvanostatic charge-discharge profiles at a current rate of 0.1 A/g at different cycles between a potential range of 0.01 and 3.00 V, (c) EIS spectra with fitted equivalent circuit inset of before and after cycled electrode, and (d) line relationship of Zre and ω−1/2.
Crystals 13 00280 g007
Figure 8. Schematic model depicting the phase evolution of Fe3O4/C nanocomposite electrode during battery cycling.
Crystals 13 00280 g008
Table 1. The results of TGA data analysis for content determination and theoretical specific capacity calculation.
TGA Data Analysis ResultsSynthesized Products
BBA-0.01BA-0.03BA-0.05
Dehydration (water, wt%)8.934.623.373.95
Initial weight at 150 °C (wt%)91.0795.3896.6396.05
Region (1), RT-150 °C (wt% loss)8.934.623.373.95
Region (2), 150–800 °C (wt% loss)75.7268.3452.0546.95
Solid weight after 800 °C (Fe2O3, wt%)15.35 *27.0444.5849.10
Fe3O4 (calculated weight, wt%)-26.7344.4449.26
Carbon (calculated weight, wt%)83.1473.2755.5650.74
Theoretical specific capacity (mAh/g)-520617644
* KCl and CaC2O4 salts, wt%.
Table 2. Interpretation and calculation of Nyquist plots in prepared BA-0.05 electrode during pre-cycle and post-cycle.
ElectrodeInterpretation and Calculation of Nyquist Plots
Rs (Ω)RSEI (Ω)Rct (Ω)σw (Ω/s1/2)
BA-0.05 (pre-cycle)4.08-12.901.74
BA-0.05 (post-cycle)8.275.9717.601.94
Disclaimer/Publisher’s Note: The statements, opinions and data contained in all publications are solely those of the individual author(s) and contributor(s) and not of MDPI and/or the editor(s). MDPI and/or the editor(s) disclaim responsibility for any injury to people or property resulting from any ideas, methods, instructions or products referred to in the content.

