Article

Structural and Improper Ferroelectric Properties of TbInO3 Single Crystal Grown by Laser Floating Zone

1
Jiangsu Key Laboratory of Advanced Laser Materials and Devices, School of Physics and Electronics Engineering, Jiangsu Normal University, Xuzhou 221116, China
2
Rutgers Center for Emergent Materials, Department of Physics and Astronomy, Rutgers University, Piscataway, NJ 08854, USA
*
Authors to whom correspondence should be addressed.
These authors contributed equally to this work.
Crystals 2023, 13(2), 287; https://doi.org/10.3390/cryst13020287
Submission received: 6 January 2023 / Revised: 4 February 2023 / Accepted: 6 February 2023 / Published: 8 February 2023
(This article belongs to the Section Inorganic Crystalline Materials)

Abstract

:
The honeycomb TbInO3 has attracted wide research attention due to its fascinating physical properties. However, TbInO3 single crystal was difficult to grow owing to the high melting point and serious volatilization of indium during the crystal growth. In this study, the volatilization of the indium element was effectively suppressed by controlling the growth atmosphere and pressure. The excess ratio of indium oxide was determined, and pure hexagonal TbInO3 crystal was obtained by the laser floating zone method. Systematic studies on the crystal structure and optical and ferroelectric properties were carried out. The structure distortion resulted in the improper geometric ferroelectric revealed by single crystal diffraction and Raman spectrum measurements. The topological vortex domains and P-E hysteresis loop demonstrated the presence of ferroelectricity. TbInO3 crystal has great potential application in vortex memory.

1. Introduction

The ABO3-type compounds, referred to as perovskites, always possess fascinating physical properties [1,2,3,4,5,6,7,8,9,10]. The structure of ABO3 perovskites, depending on the relative radii of A- and B-cations, can be distinguished by the Goldschmidt’s tolerance factor (t) given by (rA + rO)/ 2(rB + rO) [11]. An ideal perovskite is formed when t = 1. Many more complex structural families are derived from the cubic ABO3 perovskite. It has been reported that ABO3 formed in a low symmetric hexagonal structure in the narrow window of 0.83 ≤ t ≤ 0.85 [12,13,14,15,16,17]. This hexagonal structure provides a fancy platform for the lattice, charge, orbital, and spin. Among them, hexagonal RMnO3 (R: rare-earth) families have been widely studied owing to the intriguing magnetoelectric effect [18,19,20,21,22]. Compared with conventional multiferroic materials, the improper geometric ferroelectric mechanism that breaks inversion symmetry allows for the production of a two-dimensional triangular lattice of spins, which supports strong magnetoelectric coupling [23,24]. Hexagonal RInO3, isostructural with RMnO3, has also evoked a lot of interest in recent years owing to the coexistence of magnetism and improper geometric ferroelectricity [25,26,27,28,29,30,31]. Tohei et al. have predicted the existence of ferroelectricity in hexagonal GdInO3 and DyInO3 by first-principles calculations [32]. Tyagi et al. reported the compositional and structural tuning of electrical behavior in mixed rare earth indates [12,33,34]. The influence of the synthesis route and heat treatment on the crystal structure was also revealed [35]. Recently, we clarified the controversy of GdInO3 ferroelectricity between single crystal and polycrystalline [33,36]. The structural, magnetic and ferroelectric properties in GdInO3 and EuInO3 crystals were investigated [36,37].
In particular, TbInO3 is a quantum spin liquid candidate with a quasi-two-dimensional triangular spin-lattice, which is important for quantum computation applications [2,16,17]. Known quantum spin liquid candidate compounds are typically based on geometrically frustrated magnetic lattices, such as the kagome and triangular lattices [38]. The so-called centered honeycomb lattice structure of TbInO3 determines its fascinating properties. However, the Crystallographic Information File (CIF) of TbInO3 could not be found in Inorganic Crystal Structure Database (ICSD-for-WWW) or Crystallography Open Database (COD). Although the TbInO3 crystals have been obtained in previous studies [2,16,17], the crystallinity of that crystal looks not good from the photograph of the cleaved surface [2], and TbInO3 single crystal growth atmosphere, pressure, and the excess ratio of indium oxide is need to be optimized owing to the serious volatilization of indium at high temperature. Moreover, systematic studies on the crystal structure have not yet been carried out due to the lack of fabricated good single-crystal samples.
In the present work, pure phase TbInO3 single crystal was grown by the laser floating zone method. The optimal growth atmosphere, pressure and excess ratio of indium oxide were determined. The TbInO3 crystal structure was resolved, and lattice dynamics were well investigated. The optical and improper ferroelectric properties of TbInO3 crystal were studied. Besides, interesting topological vortex domains were discovered.

2. Experimental

2.1. Single Crystal Growth

Tb4O7 and In2O3 with 4N purity were used as raw materials for crystal growth. They were calcined at 500 °C for 4 h to eliminate the moisture and adsorbed gases. Tb4O7 and In2O3 were weighted by stoichiometric ratio, and excess In2O3 was added to compensate for the volatilization of indium during crystal growth. The ingredients were mixed well in a mortar and compressed into pellets. Pure TbInO3 polycrystalline was synthesized at 1500 °C in a muffle furnace by solid-state reaction method. A Φ 6 ×100 mm feed rod can be obtained after cold isostatic pressing and sintering.
The laser floating zone method was used for TbInO3 crystal growth. The feed rod and seed rod were aligned in a coaxial line for crystal growth, and counter-rotation was adopted to improve the homogeneity of the melt zone.

2.2. Characterization

Single crystal X-ray diffraction data were collected with a Bruker SMART APEX-II diffractometer. Data integration and global unit cell refinements were carried out by the INTEGRATE program of APEX2-2014 software [39]. Absorption corrections were done by the SCALE program. The structure was solved and refined by the SHELXTL crystallographic software package. Anisotropic thermal parameters of all atoms were also refined and converged to I > 2σ (I). The powder X-ray diffraction data were collected using a Panalytical X’Pert3 diffractometer at room temperature (Cu Kα radiation). Data was collected in the scanning range of 10−100° with a step size of 0.01° and a scanning speed of 0.4 s/step. The crystallinity of the TbInO3 crystal was evaluated by a real-time back-reflection Laue camera system (FDS Laue camera with PSL software). PL and PLE spectra of the TbInO3 crystal were recorded by a fluorescence spectrometer (OmniFluo990LSP-M, Zolix, Beijing, China). Raman spectrum was obtained in a back-scattering configuration by a LabRAM HR Evolution system from Horiba Jobin Yvon at room temperature, and a 633 nm laser was used as the excitation source.
A piece of cleaved ab plane of TbInO3 crystal was etched chemically in phosphoric acid at 180 °C for 30 min. The sample was then rinsed with clean water, and the domain patterns were observed under a Zeiss optical microscope. The Premier II Ferroelectric Test system (Radiant Technologies, Inc., Albuquerque, NM, USA) was employed to measure the electric polarization hysteresis loop and the positive-up-negative-down (PUND) method was adopted to get rid of leakage current and capacitance contribution [40,41,42].

3. Results and Discussion

3.1. Crystal Growth

In order to prevent the volatilization of indium element from the melt, the growth atmosphere and pressure were studied. Generally, the higher the growing atmosphere pressure, the more effective suppression of the volatilization of components. The maximum pressure of the growing atmosphere provided by the laser floating zone furnace is 10 MPa. Therefore, 9.5 MPa air, oxygen, argon, and nitrogen were respectively tried as growing atmosphere. The results showed that 9.5 MPa oxygen at a flow rate of 0.1 L/min was optimal for inhibiting the volatilization of indium.
Meanwhile, a faster growth rate is necessary to reduce the volatilization of indium. Different crystal growth rates were tried under an oxygen atmosphere of 9.5 MPa. When the crystal growth rate exceeded 20 mm/h, the crystal appeared to have poor crystalline quality and to crack. Crystal cracking is mainly caused by excessive growth rate and temperature gradient. When the crystal growth rate was slow (1–5 mm/h), volatilization of indium was quite serious in the crystal growth process. The optimal growth speed was determined as 12 mm/h.
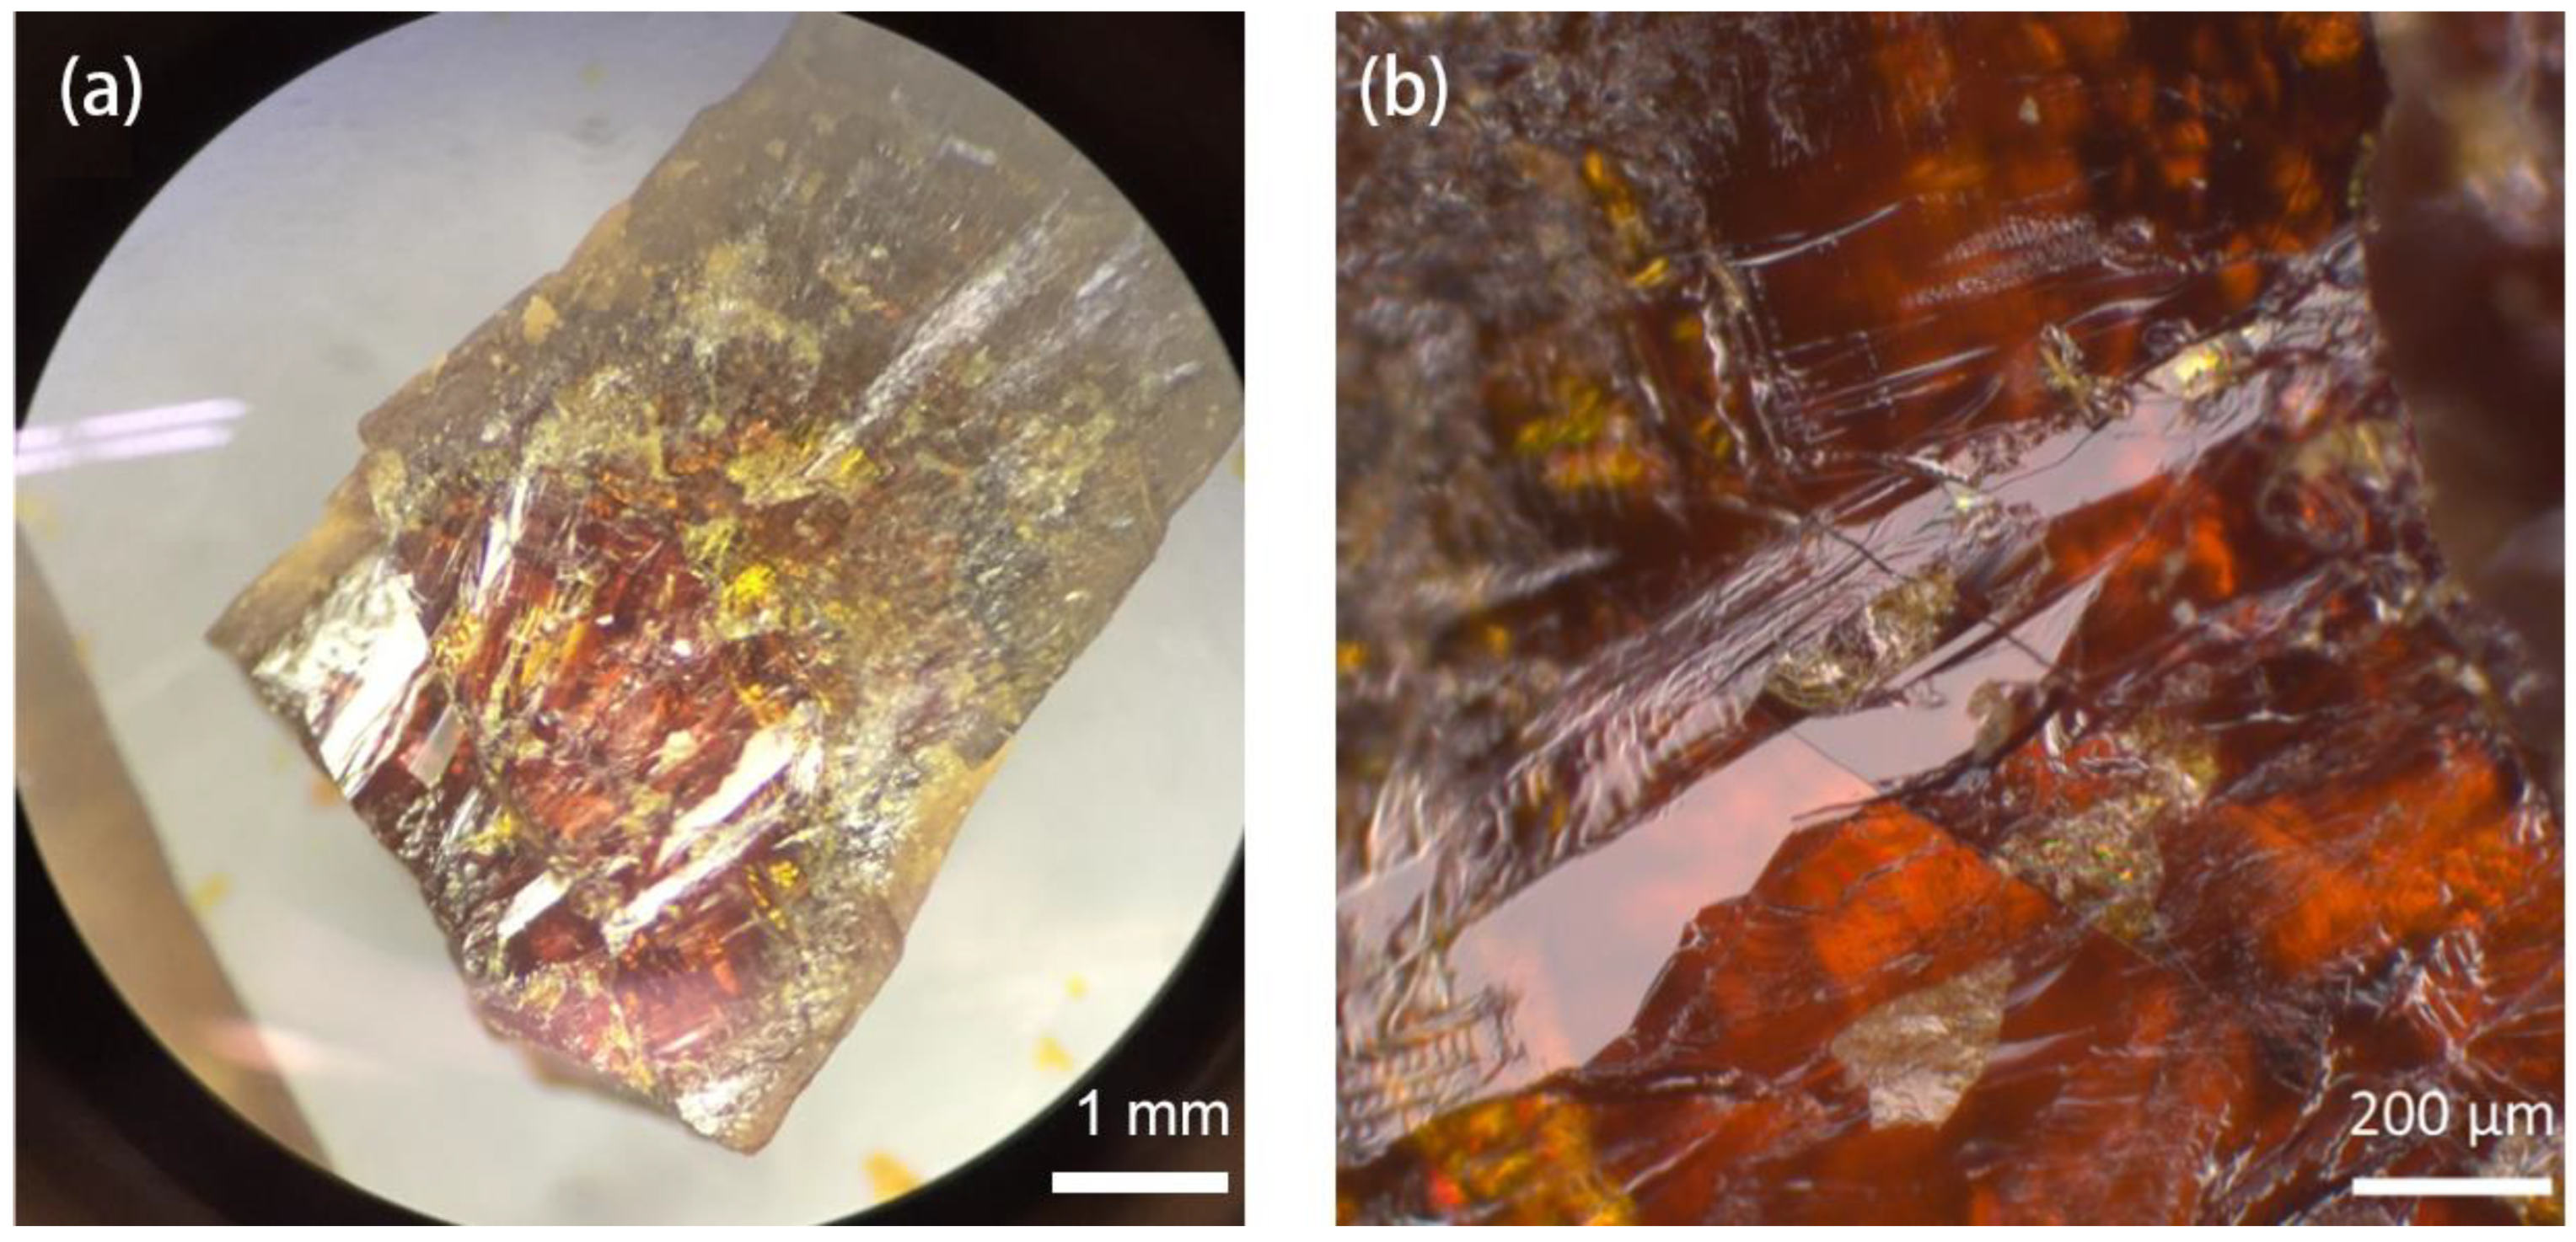
Corresponding compensation for In2O3 should be considered due to the serious volatilization of indium during the crystal growth process. The TbInO3 crystals were grown with extra In2O3 of 15 at.%, 10 at.%, and 5 at.% respectively. The crystallinity of crystal grown with an extra 5 at.% In2O3 was pretty poor. The second phase of In2O3 was observed in the TbInO3 crystal when the amount of In2O3 exceeded the stoichiometric ratio of 15 at.%, and the pure phase of TbInO3 crystal was obtained when the amount of In2O3 exceeded the stoichiometric ratio of 10 at.%, as shown in Figure 1. Therefore, an excess of 10.0 at.% of In2O3 is the suitable ratio and the TbInO3 crystal grown with this ratio is shown in Figure 2.

3.2. Crystal Structure and Laue Measurements

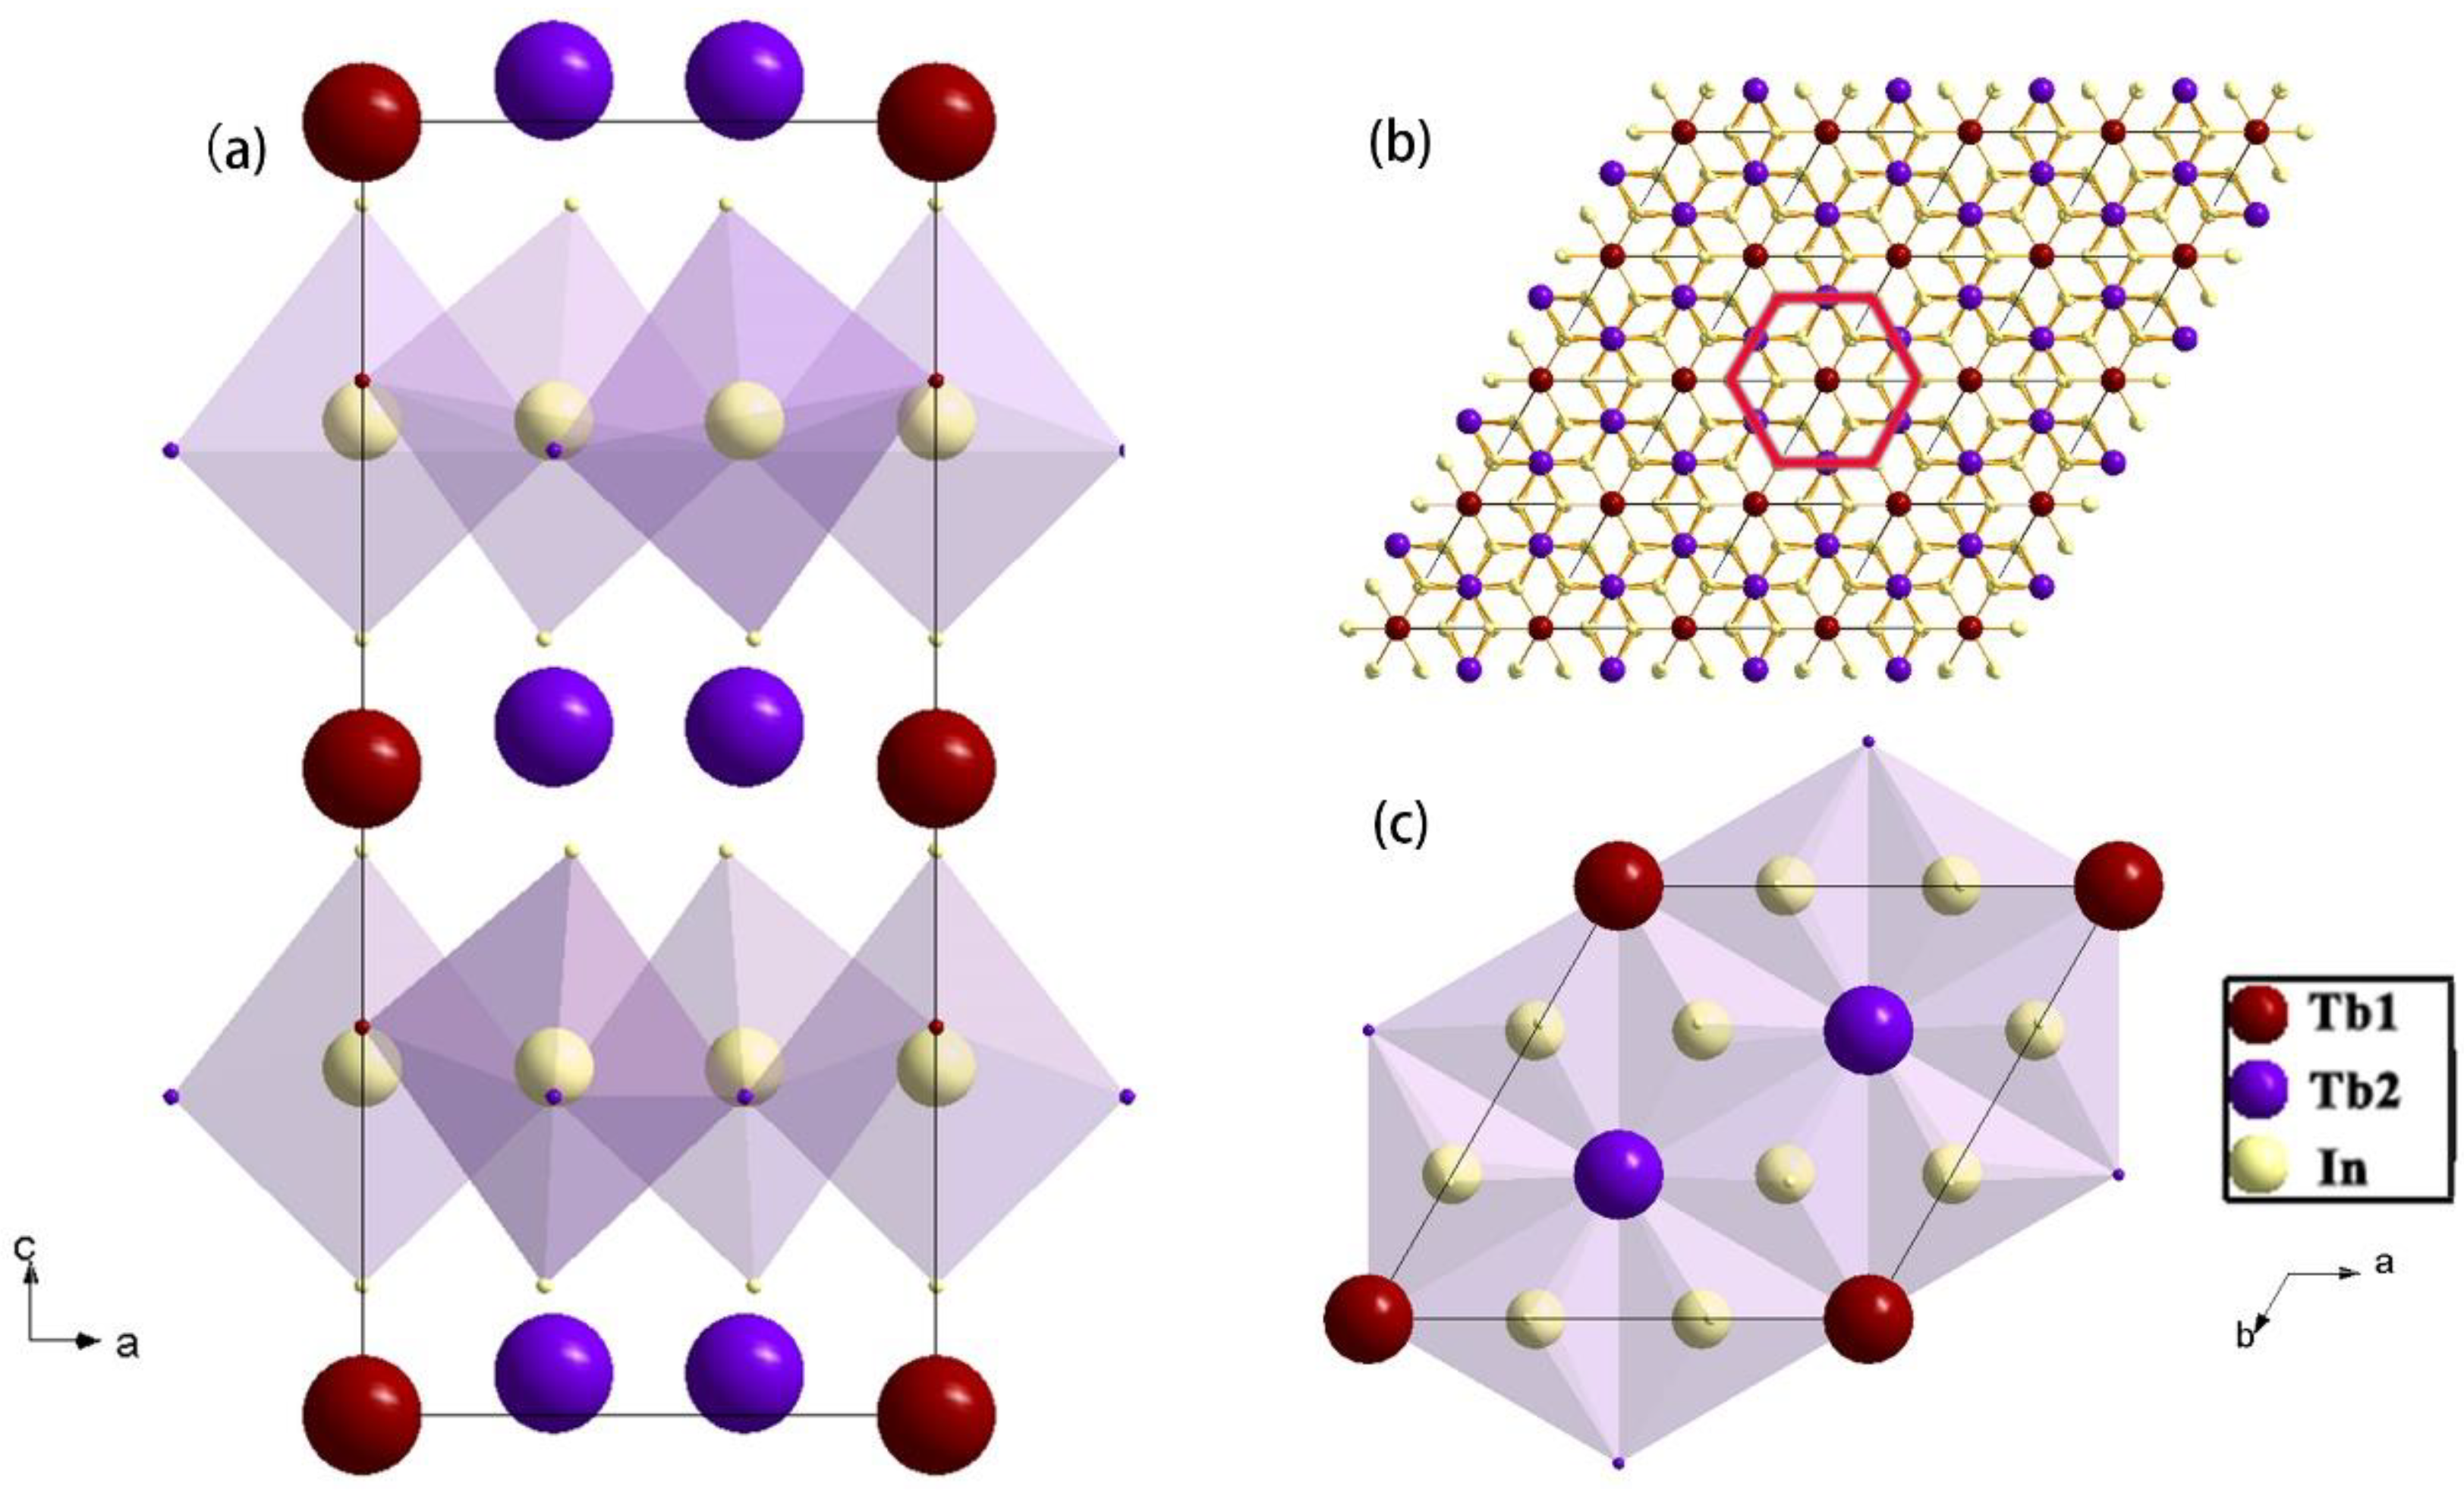
Resolved crystal data and structure refinement of TbInO3 are summarized in Table 1. TbInO3 crystallizes in the hexagonal space group P63cm with cell parameters a = 6.3088 (1) Å, c = 12.3067 (4) Å, and Z = 6. The atomic coordinates, isotropic thermal parameters, selected bond distances (Å) and angles (°) are listed in Tables S1 and S2 (Supporting Information). Further details of the crystal structure can be obtained from the Cambridge Crystallographic Data Centre (CCDC) using the depository number CSD 2234504. The Tb atoms were coordinated with seven O atoms, and the bond lengths ranged from 2.314 to 2.63 Å. The InO5 bipyramids with the In–O bond distances varying between 2.077 and 2.143 Å.
As shown in Figure 3a, InO5 triangular bipyramids were separated by Tb3+ ions layers. The InO5 bipyramids tilted, and the Tb3+ ions deviated from the mirror position, resulting in two unequal Wyckoff positions of 2a and 4b (Tb1 and Tb2). Along the c direction, Tb3+ ions presented up and down distortions, which caused ferroelectric polarization. This unusual driving mechanism has been referred to as “improper geometric ferroelectricity” [13,43]. As shown in Figure 3b,c, Tb3+ ions are arranged into a two-dimensional hexagonal structure in each layer of the ab plane. The Tb2 sites form a honeycomb structure, and the Tb1 sites sit at the center of each honeycomb cell. Four identical Tb3+ ions form a parallelogram, and the distances between nearest-neighbor Tb3+ ions pairs were 3.67 Å (Tb1-Tb2) and 3.65 Å (Tb2-Tb2), respectively. This honeycomb structure supports the coexistence of ferroelectricity and a spin liquid state in TbInO3.
Laue measurements were performed on TbInO3 single crystal. As shown in Figure 4, the bright and clear diffraction spots on the ab plane of the crystal indicated the pure phase and hexagonal symmetry of the as-grown TbInO3 crystal.

3.3. PL and PLE Spectra

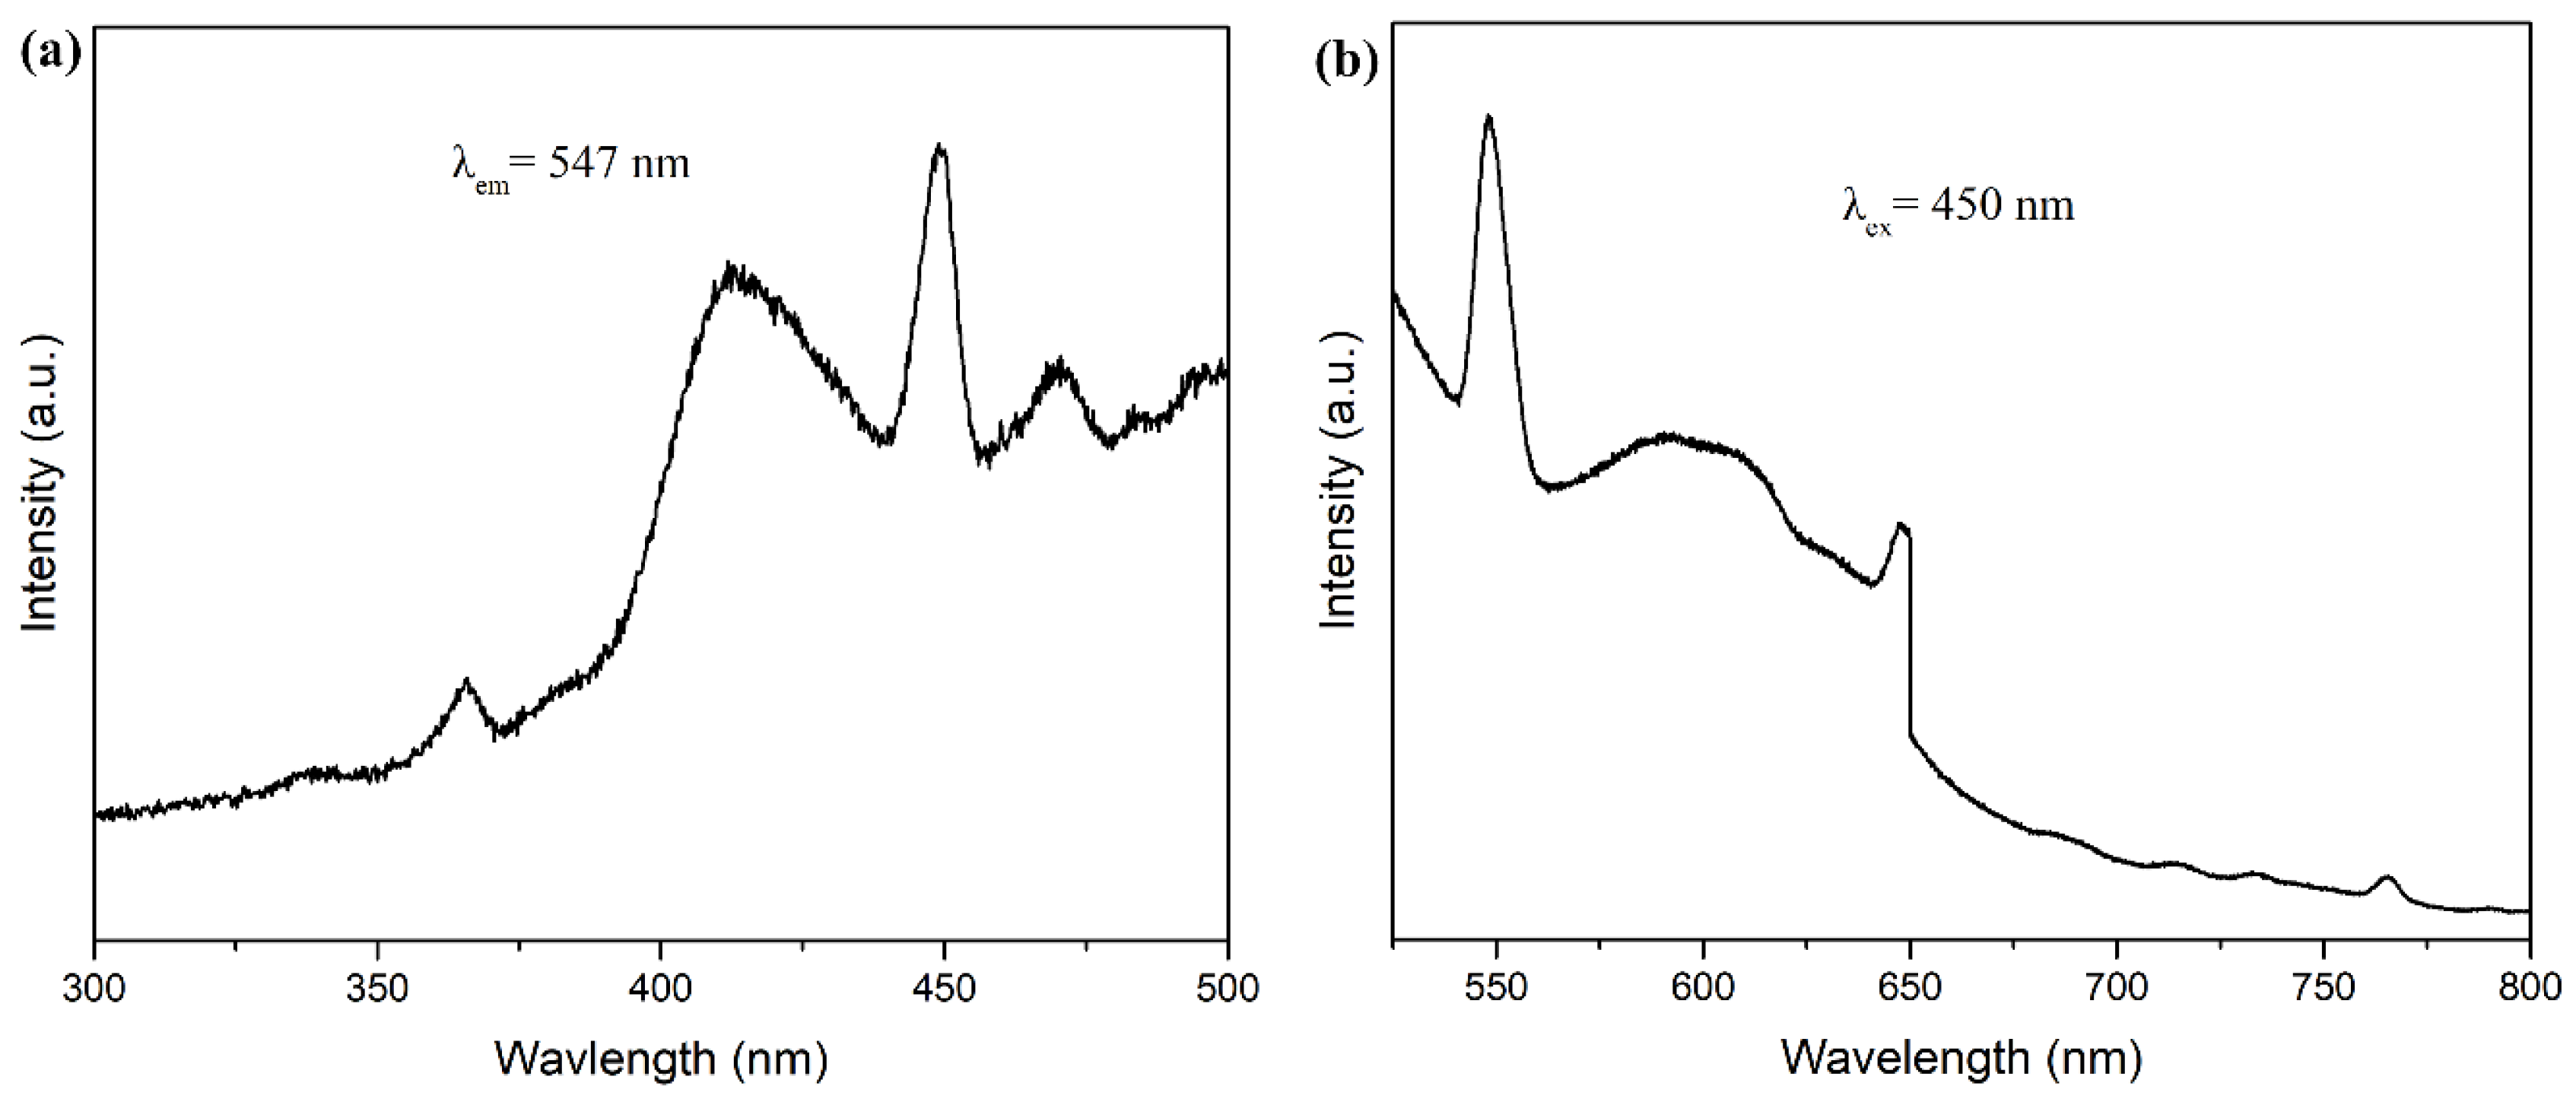
The PL and PLE spectra of the TbInO3 crystal are displayed in Figure 5. From the PLE spectrum (λem = 547 nm), four excitation bands centered at 365, 413, 450, and 470 nm could be observed (Figure 5a), originating from the 7F65D3, 7F55D3, 7F35D3, 7F65D4 transitions of Tb3+ ion, respectively. The strongest excitation peak was located at 450 nm, matching the blue LD chips. By exciting TbInO3 crystal under 450 nm, the emission peaks located at 547, 592, 623, and 648 nm were found in its PL spectra (Figure 5b), corresponding to the 5D47FJ (J = 5, 4, 3, 2) transitions of Tb3+ ion, respectively. Among them, the emission peaks centered at 592 and 623 nm overlapped and formed an intensive broad emission band covering the yellow and orange regions.

3.4. Raman Spectrum

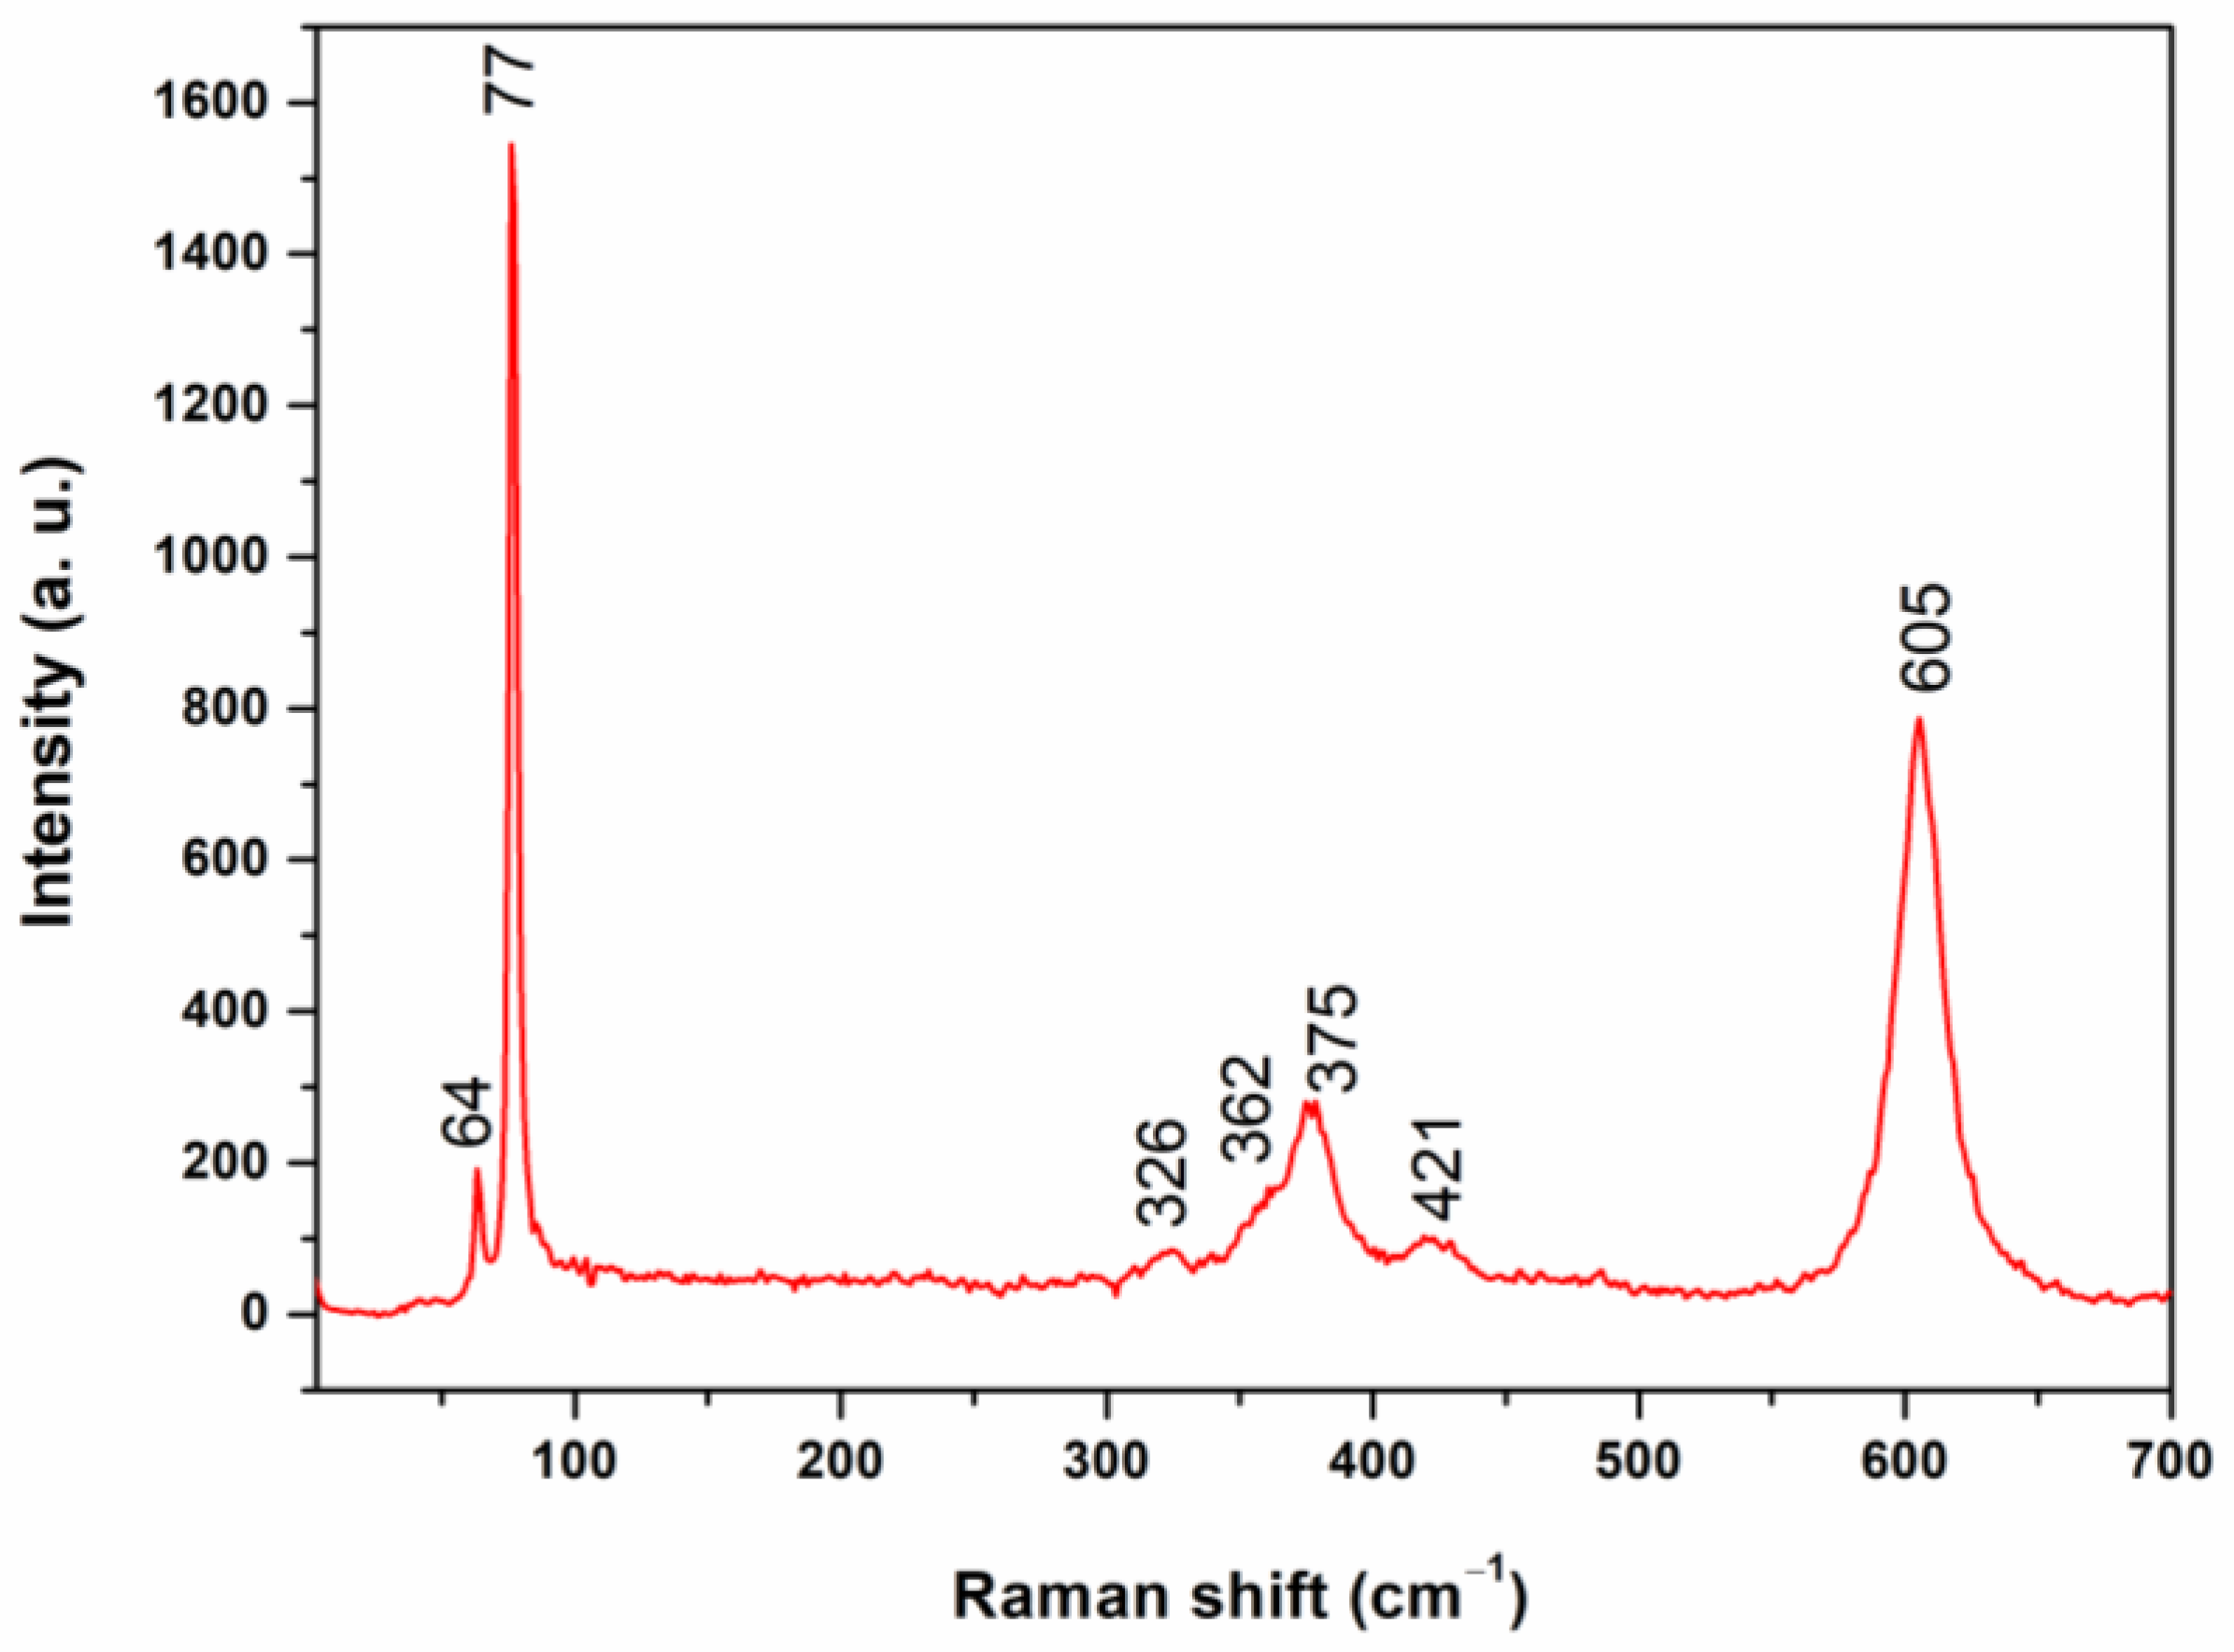
The measured Raman spectrum of the TbInO3 crystal is plotted in Figure 6. The observed prominent Raman lines and low level of background proved the good quality of the as-grown crystal [44]. According to the simple harmonic oscillator approximation, the motion relevant to heavy ions should have appeared at the low-frequency region [45]. Tb3+ ion is the heaviest in the unit cell, and the low wavenumber modes at 64 cm−1 and 77 cm−1 are attributed to the vibrations of Tb3+ ions perpendicular and parallel to the c-axis, respectively. The strongest Raman mode at ~77 cm−1 is attributed to the vibration of Tb3+ ions along the c direction, corresponding to the generation of ferroelectric polarization. The mode at ~326 cm−1 was assigned as the A1g symmetry, involving vibrations of O3(+z) − O4(−z) and O2(+x,y) − O1(−x,y). The Raman mode at ~362 cm−1 and 375 cm−1 belonged to the same E1g symmetry, involving the vibration of oxygen ions in the ab plane. These two modes were partially overlapped and resembled coupled quantum oscillators. The mode at ~421 cm−1 was related to the bending vibration of InO5 polyhedra, assigned as the A1g symmetry. The Raman mode at ~605 cm−1 originated from the O1(+z) − O2(−z) vibration of InO5 polyhedra. The InO5 polyhedra were compressed by the repulsion between the electron density of Tb3+ 4f electrons and that of apical oxygen anions, which influenced the phonon dynamics of the TbInO3 crystal structure.

3.5. Ferroelectric Properties

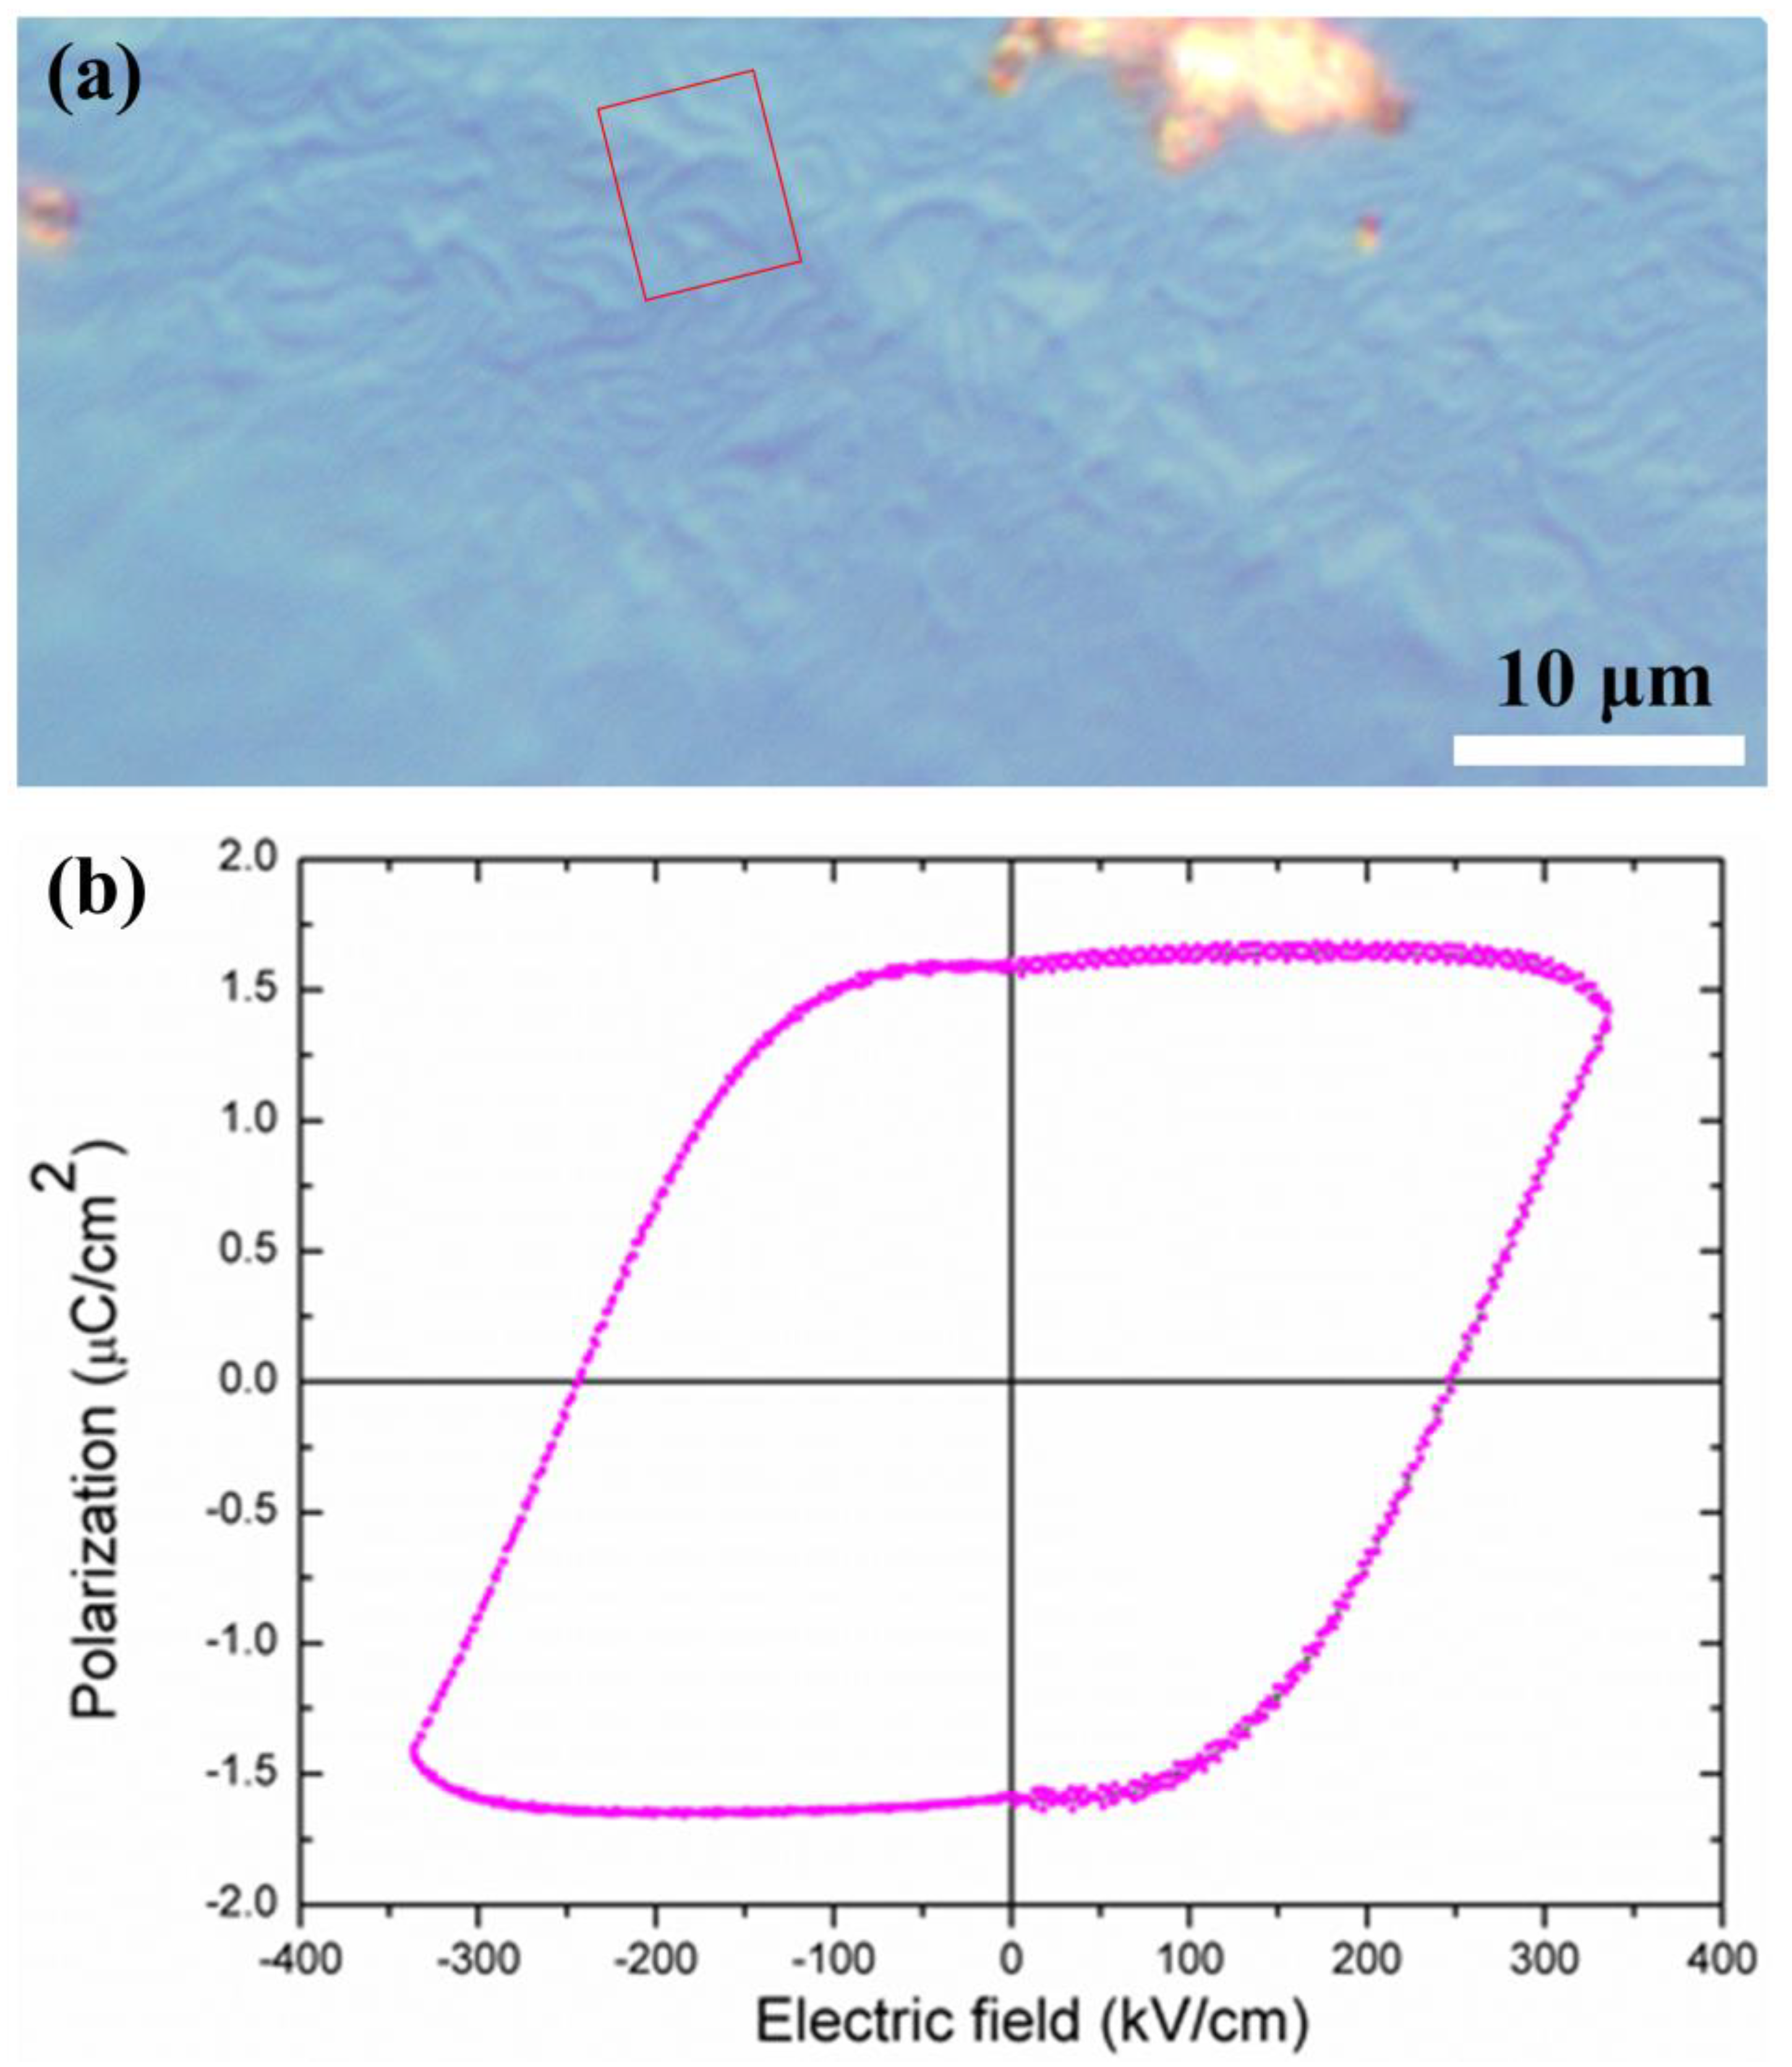
The interesting domain patterns on a surface of a chemically etched TbInO3 crystal were observed using optical microscopy (Carl Zeiss Microscopy GmbH, Göttingen, Germany), as shown in Figure 7a. The two rather yellow regions were damaged pits that were generated during the cleavage process and are likely the defect sites on the surface. The domains with a size of 4~5 µm appeared as cloverleaf patterns, three of which were incident on each vertex. The link between vertices formed the pairing of vortices and antivortices, which could be analyzed by the graph theory [46]. The vortices display topological features with Z2 × Z3 symmetry. Physically, Z3 is assigned to three structural antiphase domains, and Z2 corresponds to the ferroelectric + and − domains. This type of topological domain indicated the improper ferroelectricity of the TbInO3 crystal and supported the unique coupling between the ferroelectric and magnetic domain walls.
As shown in Figure 7b, the P-E hysteresis loop was measured at room temperature with the frequency of f = 166 Hz, which demonstrated the presence of switchable ferroelectric polarization. The saturated polarization and coercive field along the direction [001] were 1.68 µC/cm2 and 247 kV/cm, respectively. This improper ferroelectricity was caused by the structural distortion that intrinsically allows for the strong coupling between charge and spin, which provided great potential for vortex memory devices.

4. Conclusions

TbInO3 crystal was grown by the laser floating zone technique. The crystallographic data of TbInO3 were determined by single crystal diffraction, and the improper geometric ferroelectricity was mainly caused by up and down distortions of Tb3+ ions along the c direction. The lattice dynamics related to structure distortion were uncovered by Raman active vibration modes. The strongest excitation peak was located at 450 nm, and the emission peaks located at 547, 592, 623 and 648 nm were found in PL spectra. The topological vortex domains with a size of 4~5 µm were observed. The P-E hysteresis loops with saturated polarization of 1.68 µC/cm2 were measured by the PUND method and demonstrated the presence of ferroelectricity. Our experimental results indicate that TbInO3 crystal is a promising material for magnetoelectronic applications.

Supplementary Materials

The following supporting information can be downloaded at: https://www.mdpi.com/article/10.3390/cryst13020287/s1, Table S1: Refined atomic coordinates and isotropic displacement parameters for TbInO3; Table S2: Selected bond lengths (Å) and angles (deg.) of TbInO3.

Author Contributions

Conceptualization, C.M. and Y.L.; data curation, Y.W. and T.Z.; formal analysis, C.M. and C.Z.; funding acquisition, Y.L.; investigation, C.M., Y.W. and X.L.; methodology, C.M. and Y.W.; project administration, Y.L. and L.Z.; validation, C.M. and Y.W.; writing—original draft, C.M. and Y.W.; writing—review & editing, Y.L., S.-W.C. and L.Z. All authors have read and agreed to the published version of the manuscript.

Funding

The authors acknowledge the generous financial support from National Natural Science Foundation of China (51902143), the Natural Science Foundation of the Jiangsu Higher Education Institutes of China (19KJB430018), National Key Research and Development Program of China (2021YFB3501700), Key Research and Development Project of Jiangsu Province (BE2019033, BE2021040), Natural Science foundation of Jiangsu Province (BK20221226), Postgraduate Research & Practice Innovation Program of Jiangsu Province (SJCX21_1136, SJCX22_1255), and the U.S. DOE (DE-FG02-07ER46382).

Institutional Review Board Statement

Not applicable.

Informed Consent Statement

Not applicable.

Data Availability Statement

Not applicable.

Conflicts of Interest

The authors declare no conflict of interest.

References

  1. Stein, J.; Biesenkamp, S.; Cronert, T.; Frohlich, T.; Leist, J.; Schmalzl, K.; Komarek, A.C.; Braden, M. Combined Arrhenius-Merz Law Describing Domain Relaxation in Type-II Multiferroics. Phys. Rev. Lett. 2021, 127, 097601. [Google Scholar] [CrossRef] [PubMed]
  2. Kim, J.; Wang, X.; Huang, F.T.; Wang, Y.; Fang, X.; Luo, X.; Li, Y.; Wu, M.; Mori, S.; Kwok, D.; et al. Spin Liquid State and Topological Structural Defects in Hexagonal TbInO3. Phys. Rev. X 2019, 9, 031005. [Google Scholar] [CrossRef]
  3. Manz, S.; Matsubara, M.; Lottermoser, T.; Büchi, J.; Iyama, A.; Kimura, T.; Meier, D.; Fiebig, M. Reversible Optical Switching of Antiferromagnetism in TbMnO3. Nat. Photonics 2016, 10, 653–656. [Google Scholar] [CrossRef]
  4. Fiebig, M.; Lottermoser, T.; Meier, D.; Trassin, M. The Evolution of Multiferroics. Nat. Rev. Mater. 2016, 1, 16046. [Google Scholar] [CrossRef]
  5. Lilienblum, M.; Lottermoser, T.; Manz, S.; Selbach, S.M.; Cano, A.; Fiebig, M. Ferroelectricity in the Multiferroic Hexagonal manganites. Nat. Phys. 2015, 11, 1070–1073. [Google Scholar] [CrossRef]
  6. Bednorz, J.G.; Müller, K.A. Perovskite-Type Oxides—The New Approach to High-Tcsuperconductivity. Rev. Mod. Phys. 1988, 60, 585–600. [Google Scholar] [CrossRef]
  7. Moritomo, Y.; Asamitsu, A.; Kuwahara, H.; Tokura, Y. Giant Magnetoresistance of Manganese Oxides with a Layered Perovskite Structure. Nature 1996, 380, 141–144. [Google Scholar] [CrossRef]
  8. Cohen, R.E. Origin of Ferroelectricity in Perovskite Oxides. Nature 1992, 358, 136–138. [Google Scholar] [CrossRef]
  9. Cheong, S.-W.; Mostovoy, M. Multiferroics a Magnetic Twist for Ferroelectricity. Nat. Mater. 2007, 6, 13–20. [Google Scholar] [CrossRef]
  10. Zhang, Y.; Shimada, T.; Kitamura, T.; Wang, J. Ferroelectricity in Ruddlesden-Popper Chalcogenide Perovskites for Photovoltaic Application: The Role of Tolerance Factor. J. Phys. Chem. Lett. 2017, 8, 5834–5839. [Google Scholar] [CrossRef]
  11. Panwar, N.; Singh, K.; Kanwar, K.; Bitla, Y.; Kumar, S.; Puli, V.S. Low-Temperature Magnetic and Magnetocaloric Properties of Manganese-Substituted Gd0.5Er0.5CrO3 Orthochromites. Crystals 2022, 12, 263. [Google Scholar] [CrossRef]
  12. Grover, V.; Shukla, R.; Jain, D.; Deshpande, S.K.; Arya, A.; Pillai, C.G.S.; Tyagi, A.K. Complex GdSc1–xInxO3 Oxides: Synthesis and Structure Driven Tunable Electrical Properties. Chem. Mater. 2012, 24, 2186–2196. [Google Scholar] [CrossRef]
  13. Van Aken, B.B.; Palstra, T.T.; Filippetti, A.; Spaldin, N.A. The Origin of Ferroelectricity in Magnetoelectric YMnO3. Nat. Mater. 2004, 3, 164–170. [Google Scholar] [CrossRef]
  14. Katsufuji, T.; Masaki, M.; Machida, A.; Moritomo, M.; Kato, K.; Nishibori, E.; Takata, M.; Sakata, M.; Ohoyama, K.; Kitazawa, K.; et al. Crystal Structure and Magnetic Properties of Hexagonal RMnO3 (R = Y, Lu, and Sc) and the Effect of Doping. Phys. Rev. B 2002, 66, 134434. [Google Scholar] [CrossRef]
  15. Li, J.; Sleight, A.W.; Subramanian, M.A. Determination of the Local Environment of Mn3+ and In3+ in the YInO3–YMnO3 Solid Solution, Which Exhibits an Intense Blue Color. Chem. Mater. 2016, 28, 6050–6053. [Google Scholar] [CrossRef]
  16. Kim, M.G.; Winn, B.; Chi, S.; Savici, A.T.; Rodriguez-Rivera, J.A.; Chen, W.C.; Xu, X.; Li, Y.; Kim, J.W.; Cheong, S.W.; et al. Spin-Liquid-Like State in Pure and Mn-Doped TbInO3 with a Nearly Triangular Lattice. Phys. Rev. B 2019, 100, 024405. [Google Scholar] [CrossRef]
  17. Clark, L.; Sala, G.; Maharaj, D.D.; Stone, M.B.; Knight, K.S.; Telling, M.T.; Wang, X.; Xu, X.; Kim, J.; Li, Y.; et al. Two-Dimensional Spin Liquid Behaviour in the Triangular-Honeycomb Antiferromagnet TbInO3. Nat. Phys. 2019, 15, 262–268. [Google Scholar] [CrossRef]
  18. Fan, F.; Gao, Z.; Ponet, L.; Wang, J.; Huang, H.; Artyukhin, S.; Hong, J.; Cheong, S.-W.; Wang, X. Visualization of Large-Scale Charged Domain Walls in Hexagonal Manganites. Appl. Phys. Lett. 2021, 118, 072901. [Google Scholar] [CrossRef]
  19. Wang, X.; Yang, D.; Zhang, H.-M.; Song, C.; Wang, J.; Tan, G.; Zheng, R.; Dong, S.; Cheong, S.-W.; Zhang, J. Anisotropic Resistance Switching in Hexagonal Manganites. Phys. Rev. B 2019, 99, 054106. [Google Scholar] [CrossRef]
  20. Lin, S.-Z.; Wang, X.; Kamiya, Y.; Chern, G.-W.; Fan, F.; Fan, D.; Casas, B.; Liu, Y.; Kiryukhin, V.; Zurek, W.H.; et al. Topological Defects as Relics of Emergent Continuous Symmetry and Higgs Condensation of disorder in Ferroelectrics. Nat. Phys. 2014, 10, 970–977. [Google Scholar] [CrossRef] [Green Version]
  21. Geng, Y.; Das, H.; Wysocki, A.L.; Wang, X.; Cheong, S.W.; Mostovoy, M.; Fennie, C.J.; Wu, W. Direct Visualization of Magnetoelectric Domains. Nat. Mater. 2014, 13, 163–167. [Google Scholar] [CrossRef] [PubMed]
  22. Cichy, K.; Świerczek, K. Influence of Doping on the Transport Properties of Y1−xlnxMnO3+Δ (Ln: Pr, Nd). Crystals 2021, 11, 510. [Google Scholar] [CrossRef]
  23. Dong, C.; Chen, R.; Liu, Y.; Liu, C.; Zhu, H.; Ke, J.; Liu, W.; Yang, M.; Wang, J. Field-Induced Magnetic Phase Transitions and Rich Phase Diagram of HoMnO3 Single Crystal. Crystals 2019, 9, 419. [Google Scholar] [CrossRef]
  24. Balli, M.; Roberge, B.; Fournier, P.; Jandl, S. Review of the Magnetocaloric Effect in RMnO3 and RMn2O5 Multiferroic Crystals. Crystals 2017, 7, 44. [Google Scholar] [CrossRef]
  25. Yin, X.; Li, Y.; Wang, G.; Hu, J.; Xu, C.; Lu, Q.; Zhong, Y.; Zhao, J.; Zhao, X.; Zhang, Y.; et al. Magnetic Properties of the Quasi Two-Dimensional Centered Honeycomb Antiferromagnet GdInO3. Phys. Rev. B 2021, 104, 134432. [Google Scholar] [CrossRef]
  26. Kaiwart, R.; Dwivedi, A.; Shukla, R.; Velaga, S.; Grover, V.; Poswal, H.K. High Pressure Structural Evolution of Cubic Solid Solution YbInO3. J. Appl. Phys. 2021, 130, 035902. [Google Scholar] [CrossRef]
  27. Hartley, P.; Egdell, R.G.; Zhang, K.H.L.; Hohmann, M.V.; Piper, L.F.J.; Morgan, D.J.; Scanlon, D.O.; Williamson, B.A.D.; Regoutz, A. Experimental and Theoretical Study of the Electronic Structures of Lanthanide Indium Perovskites LnInO3. J. Phys. Chem. C Nanomater. Interfaces 2021, 125, 6387–6400. [Google Scholar] [CrossRef]
  28. Yu, Y.; Lin, N.; Wang, H.; Xu, R.; Ren, H.; Zhao, X. First Principles Study of Ferroelectric Hexagonal Compounds RInO3 (R = Dy, Er, and Ho): Electronic Structure, Optical and Dielectric Properties. RSC Adv. 2020, 10, 4080–4086. [Google Scholar] [CrossRef]
  29. Romanov, A.N.; Haula, E.V.; Shashkin, D.P.; Korchak, V.N. Broadband near-Ir Photoluminescence of Trigonal-Bipyramidal Coordinated Cu2+ Impurity Center in YGaO3, YInO3 and GdInO3 Hexagonal Phases. J. Lumin. 2020, 228, 117652. [Google Scholar] [CrossRef]
  30. Öztürk, E.; Karacaoglu, E. The Effect of Eu3+-Doping on the Photoluminescent Properties of ReInO3 (Re = Er, Sm) Type Phosphors. Mater. Today Commun. 2020, 25, 101556. [Google Scholar] [CrossRef]
  31. Ye, M.; Kung, H.H.; Rosa, P.F.S.; Rosenberg, E.; Kim, J.; Xu, X.H.; Bauer, E.D.; Fisk, Z.; Fisher, I.R.; Cheong, S.W.; et al. Crystal-Field Excitations and Quadrupolar Fluctuations of 4f-Electron Systems Studied by Polarized Light Scattering. J. Phys. Conf. Ser. 2022, 2164, 012054. [Google Scholar] [CrossRef]
  32. Tohei, T.; Moriwake, H.; Murata, H.; Kuwabara, A.; Hashimoto, R.; Yamamoto, T.; Tanaka, I. Geometric Ferroelectricity in Rare-Earth Compounds RGaO3 and RInO3. Phys. Rev. B 2009, 79, 144125. [Google Scholar] [CrossRef]
  33. Shukla, R.; Grover, V.; Deshpande, S.K.; Jain, D.; Tyagi, A.K. Synthesis and Structural and Electrical Investigations of a Hexagonal Y1−XGdXInO3 (0.0 ≤ x ≤ 1.0) System Obtained Via Metastable C-Type Intermediates. Inorg. Chem. 2013, 52, 13179–13187. [Google Scholar] [CrossRef]
  34. Shukla, R.; Sayed, F.N.; Grover, V.; Deshpande, S.K.; Guleria, A.; Tyagi, A.K. Quest for Lead Free Relaxors in YIn1−XFeXO3 (0.0 ≤ x ≤ 1.0) System: Role of Synthesis and Structure. Inorg. Chem. 2014, 53, 10101–10111. [Google Scholar] [CrossRef]
  35. Shukla, R.; Grover, V.; Srinivasu, K.; Paul, B.; Roy, A.; Gupta, R.; Tyagi, A.K. Rare Earth Indates (Re: La–Yb): Influence of the Synthesis Route and Heat Treatment on the Crystal Structure. Dalton Trans. 2018, 47, 6787–6799. [Google Scholar] [CrossRef]
  36. Li, Y.; Wang, Y.; Tan, W.; Wang, W.; Zhang, J.; Kim, J.W.; Cheong, S.-W.; Tao, X. Laser Floating Zone Growth of Improper Geometric Ferroelectric GdInO3 Single Crystals with Z6 Topological Defects. J. Mater. Chem. C 2018, 6, 7024–7029. [Google Scholar] [CrossRef]
  37. Wu, Y.; Li, Y.; Zhou, C.; Chen, H.; Cheong, S.-W.; Li, Y.; Tao, X.; Zhang, L. Novel Geometric Ferroelectric EuInO3 Single Crystals with Topological Vortex Domains. Cryst. Growth Des. 2023. [Google Scholar] [CrossRef]
  38. Savary, L.; Balents, L. Quantum Spin Liquids: A Review. Rep. Prog. Phys. 2017, 80, 016502. [Google Scholar] [CrossRef]
  39. Zhang, J.; Zhang, Z.; Zhang, W.; Zheng, Q.; Sun, Y.; Zhang, C.; Tao, X. Polymorphism of BaTeMo2O9: A New Polar Polymorph and the Phase Transformation. Chem. Mater. 2011, 23, 3752–3761. [Google Scholar] [CrossRef]
  40. Chai, Y.S.; Oh, Y.S.; Wang, L.J.; Manivannan, N.; Feng, S.M.; Yang, Y.S.; Yan, L.Q.; Jin, C.Q.; Kim, K.H. Intrinsic Ferroelectric Polarization of Orthorhombic Manganites Withe-Type Spin Order. Phys. Rev. B 2012, 85, 184406. [Google Scholar]
  41. Feng, S.M.; Chai, Y.S.; Zhu, J.L.; Manivannan, N.; Oh, Y.S.; Wang, L.J.; Yang, Y.S.; Jin, C.Q.; Kim, K.H. Determination of the Intrinsic Ferroelectric Polarization in Orthorhombic HoMnO3. New J. Phys. 2010, 12, 073006. [Google Scholar] [CrossRef] [Green Version]
  42. Scott, J.F.; Kammerdiner, L.; Parris, M.; Traynor, S.; Ottenbacher, V.; Shawabkeh, A.; Oliver, W. Switching Kinetics of Lead Zirconate Titanate Submicron Thin-Film Memories. J. Appl. Phys. 1988, 64, 787–792. [Google Scholar] [CrossRef]
  43. Ederer, C.; Spaldin, N.A. A New Route to Magnetic Ferroelectrics. Nat. Mater. 2004, 3, 849–851. [Google Scholar] [CrossRef] [PubMed]
  44. Zhao, S.; Yu, T.; Wang, Z.; Wang, S.; Wei, L.; Chen, X.; Wang, S. Flux Method Growth of Large Size Group IV–V 2d Gep Single Crystals and Photoresponse Application. Crystals 2021, 11, 235. [Google Scholar] [CrossRef]
  45. Paul, B.; Chatterjee, S.; Gop, S.; Roy, A.; Grover, V.; Shukla, R.; Tyagi, A.K. Evolution of Lattice Dynamics in Ferroelectric Hexagonal ReInO3 (Re = Ho, Dy, Tb, Gd, Eu, Sm) Perovskites. Mater. Res. Express 2016, 3, 075703. [Google Scholar] [CrossRef]
  46. Chae, S.C.; Horibe, Y.; Jeong, D.Y.; Rodan, S.; Lee, N.; Cheong, S.W. Self-Organization, Condensation, and Annihilation of Topological Vortices and Antivortices in a Multiferroic. Proc. Natl. Acad. Sci. USA 2010, 107, 21366–21370. [Google Scholar] [CrossRef] [Green Version]
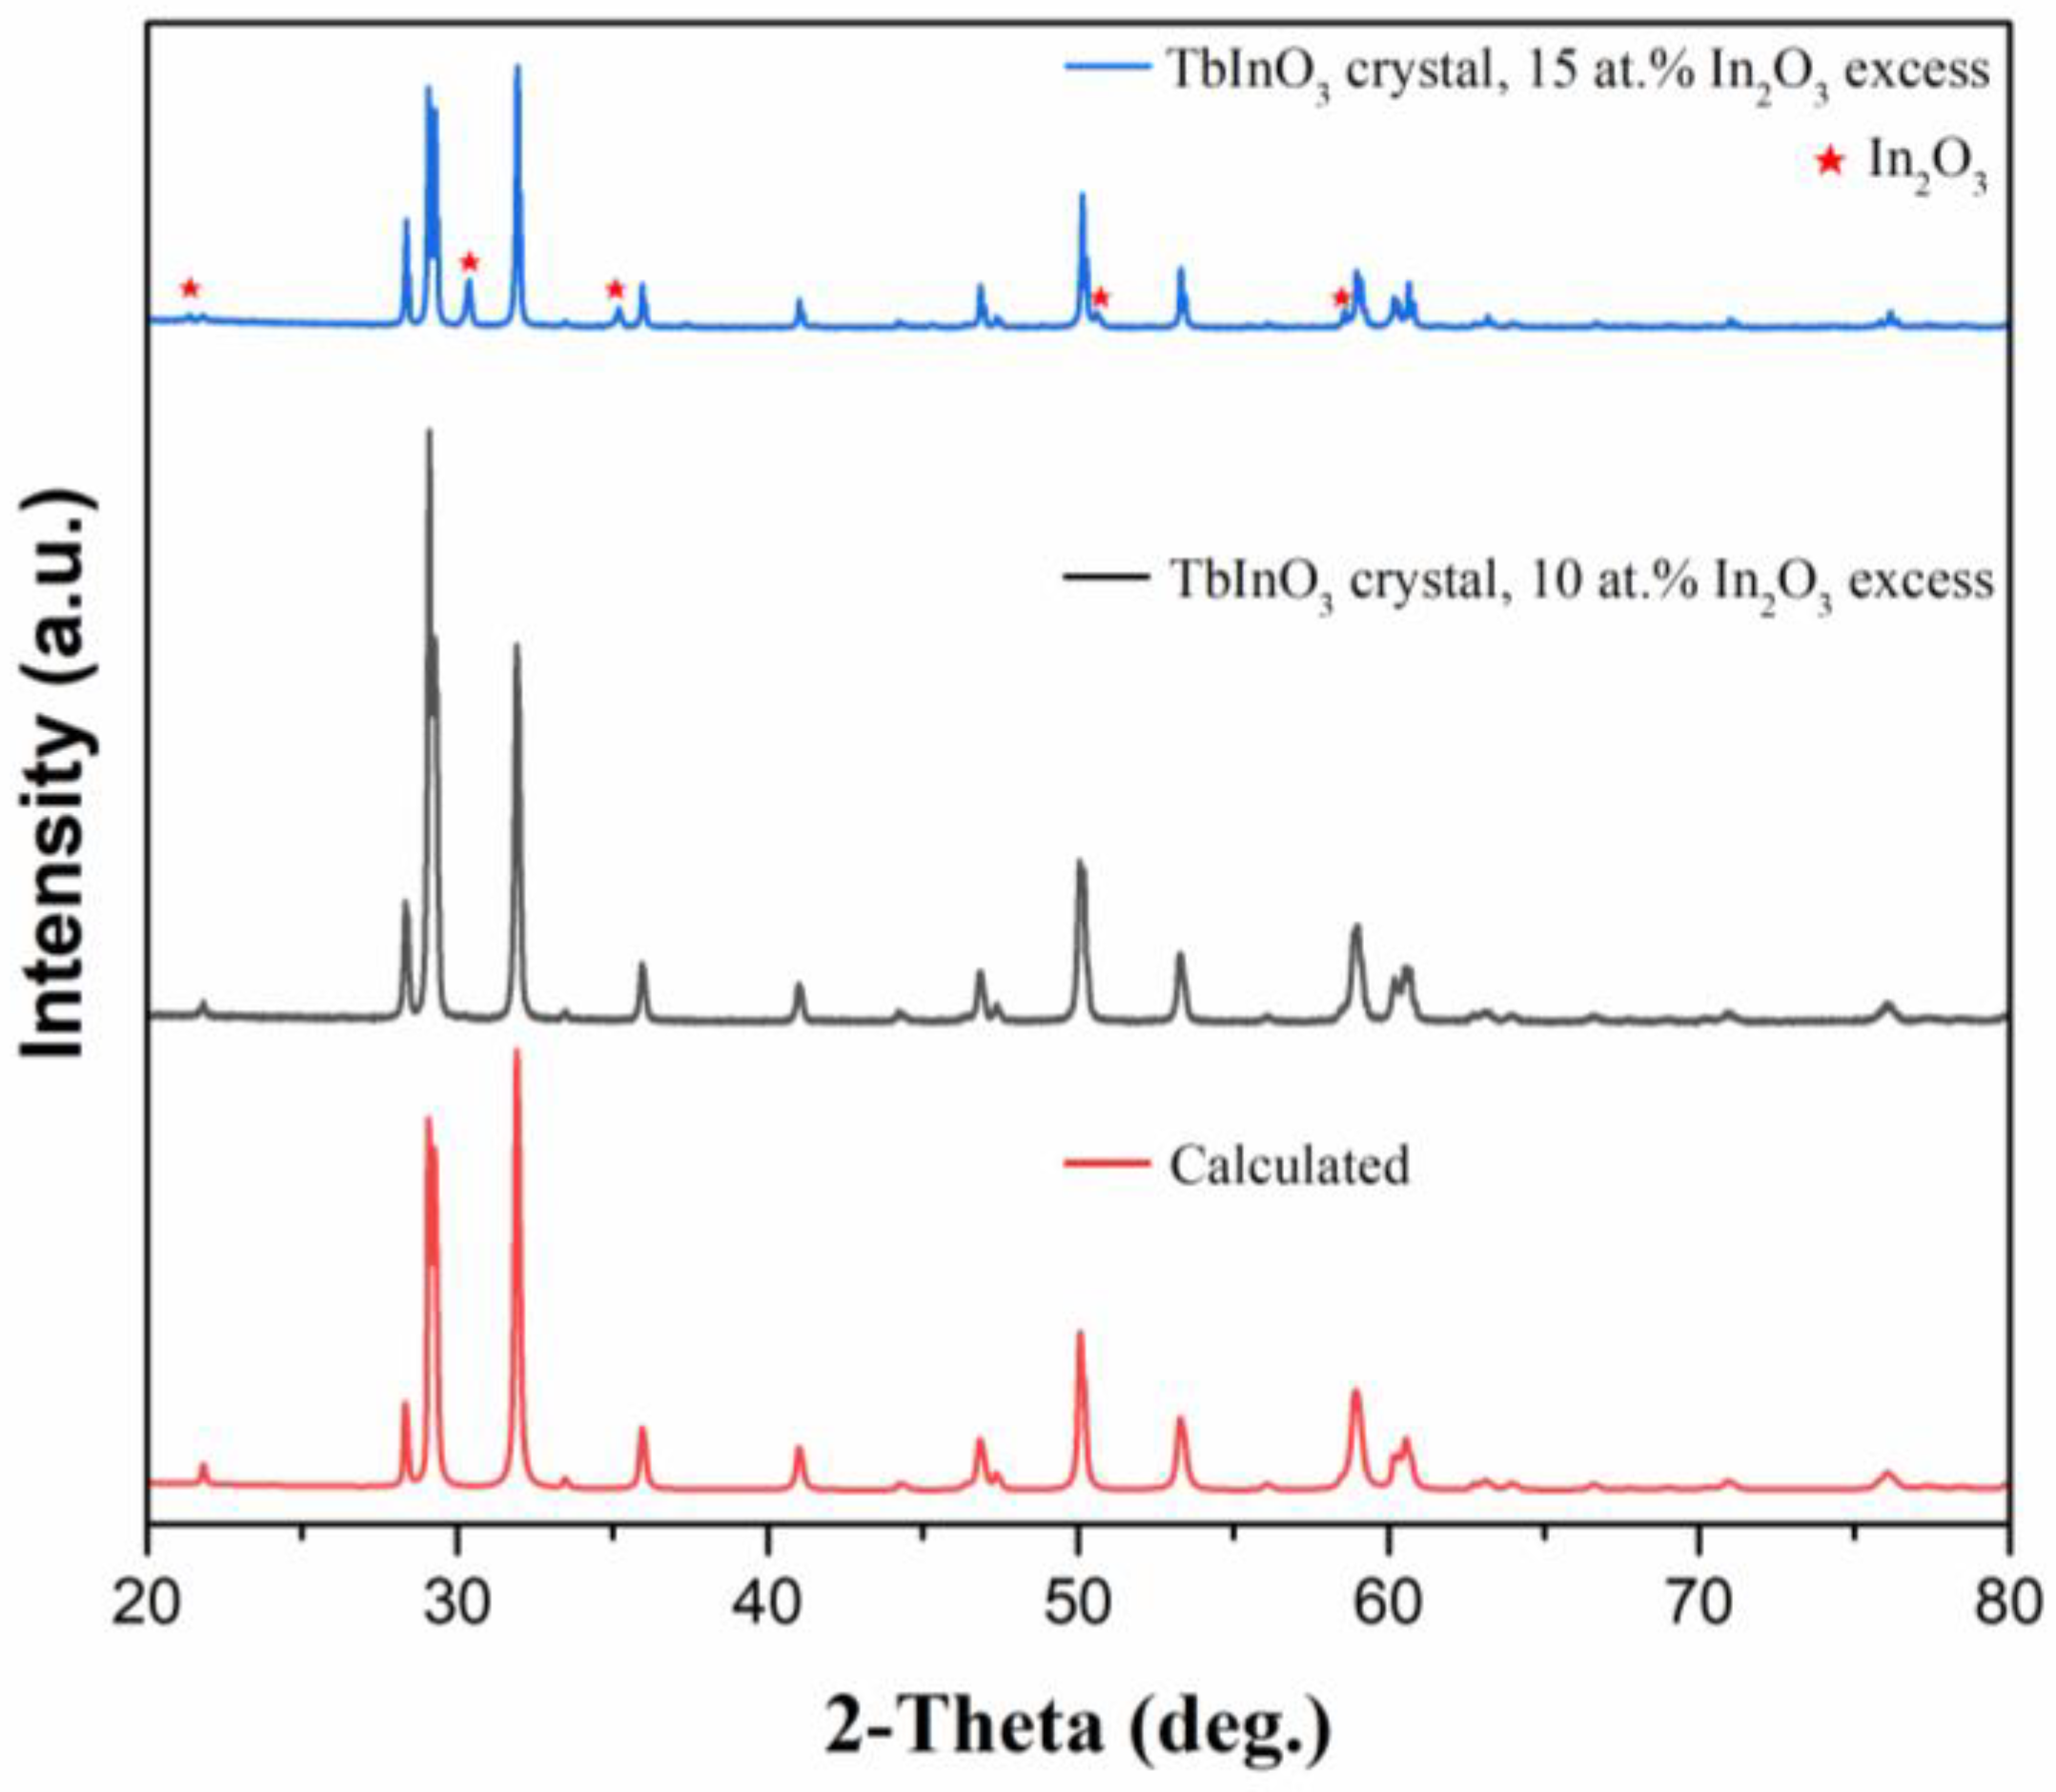
Figure 1. XRD of TbInO3 crystals.
Crystals 13 00287 g001
Figure 2. (a) Photograph of as-grown boule of TbInO3. (b) The cleaved surface of TbInO3 crystal.
Crystals 13 00287 g002
Figure 3. (a) Crystal structure of TbInO3 in the [010] projection. Tb ions with two different sites (Tb1 and Tb2). (b) Tb3+ ions form a two-dimensional hexagonal lattice in the ab plane. (c) Nearest-neighbor Tb1-Tb2 and Tb2-Tb2 pairs.
Crystals 13 00287 g003
Figure 4. Laue patterns on ab plane of the TbInO3 crystal.
Crystals 13 00287 g004
Figure 5. (a) Normalized PLE spectrum (λem = 547 nm). (b) Normalized PL spectrum (λex = 450 nm).
Crystals 13 00287 g005
Figure 6. Raman spectrum of TbInO3 crystal at room temperature.
Crystals 13 00287 g006
Figure 7. (a) Optical microscope image of chemically etched TbInO3 crystal surface. (b) Electric polarization (P) versus electric field (E) hysteresis loops at room temperature.
Crystals 13 00287 g007
Table 1. Crystal data and structure refinement for TbInO3.
FormulaTbInO3
FW (g·mol−1)321.74
radiation wavelengthMo Kα 0.71073 Å
crystal systemhexagonal
space group, ZP63cm, 6
a (Å)6.3088 (1) Å
c (Å)12.3067 (4) Å
V3)424.20 (2) Å3
ρcalc (g·cm−3)7.557
absorp coeff (mm−1)32.71
R(int)0.081
GOF on F21.257
R1 (I > 2σI) a0.0415
wR2 (I > 2σI) a0.0847
R1 (all data) a0.0449
wR2 (all data) a0.0885
a R1 = ∑||Fo| − |Fc||/∑|Fo|; wR2 = [∑[w(Fo2Fc2)2]/∑[w(Fo2)2]]1/2, and w = 1/[σ2Fo2 + (A·P)2 + B·P], P = (Fo2 + 2Fc2)/3; A and B are weight coefficients.
Disclaimer/Publisher’s Note: The statements, opinions and data contained in all publications are solely those of the individual author(s) and contributor(s) and not of MDPI and/or the editor(s). MDPI and/or the editor(s) disclaim responsibility for any injury to people or property resulting from any ideas, methods, instructions or products referred to in the content.