Article

Ion-Beam Synthesis of Structure-Oriented Iron Nanoparticles in Single-Crystalline Rutile TiO2

by
Iskander R. Vakhitov
1,2,*,
Nikolay M. Lyadov
1,2,
Vladimir I. Vdovin
3,
Anton K. Gutakovskii
3,
Vladimir I. Nuzhdin
2,
Lenar R. Tagirov
1,2 and
Rustam I. Khaibullin
1,2
1
Institute of Physics, Kazan Federal University, Kazan 420008, Russia
2
Zavoisky Physical-Technical Institute, FRC Kazan Scientific Centre of RAS, Kazan 420029, Russia
3
Rzhanov Institute of Semiconductor Physics, The Siberian Branch of the RAS, Novosibirsk 630090, Russia
*
Author to whom correspondence should be addressed.
Crystals 2023, 13(2), 355; https://doi.org/10.3390/cryst13020355
Submission received: 22 December 2022 / Revised: 6 February 2023 / Accepted: 14 February 2023 / Published: 18 February 2023

Abstract

:
Magnetic nanoparticles embedded into semiconductors have current perspectives for use in semiconducting spintronics. In this work, 40 keV Fe+ ions were implanted in high fluences of (0.5 ÷ 1.5) × 1017 ion/cm2 into an oxide semiconductor and single-crystalline TiO2 plates of rutile structure with (100) or (001) face orientations. Microstructure, elemental-phase composition, and magnetic properties of the Fe-ion-implanted TiO2 were studied by scanning and transmission electron microscopies (SEM and TEM), X-ray photoelectron (XPS) and Rutherford backscattering (RBS) spectroscopies, as well as vibrating-sample magnetometry (VSM). The high-fluence ion implantation results in the formation of magnetic nanoparticles of metallic iron beneath the irradiated surface of rutile. The induced ferromagnetism and observed two- or four-fold magnetic anisotropy are associated with the endotaxial growth of Fe nanoparticles oriented along the crystallographic axes of TiO2.

1. Introduction

Dilute magnetic semiconductors (DMSs), obtained by the doping of magnetic elements into nonmagnetic semiconductors, are promising materials in emerging and evolving fields of science and technology, such as spintronics and magnetooptical electronics [1,2,3].
DMSs may be used for next-generation spintronics-based multifunctional devices due to the presence of room-temperature ferromagnetism and semiconducting properties [4,5]. Different methods have been developed for the synthesis of DMS systems, such as pulse laser deposition (PLD), atomic layer deposition (ALD), chemical vapor deposition (CVD), sputtering and oxygen plasma assisted molecular beam epitaxy (MBE), etc. Among them, ion implantation is a promising method [6,7]. Ion implantation allows us to modify almost all physical and chemical properties of the surface layer of an irradiated solid. During the last decade, ZnO, SnO2, In2O3, and TiO2 were among the most studied DMSs, due to their specific features utilizable in semiconducting and photocatalytic devices [8,9,10,11,12,13,14,15,16,17]. In particular, TiO2 has received considerable attention since the pioneering discovery of ferromagnetism exhibited at approximately 400 K in cobalt-doped TiO2 films by Matsumoto et al. [18], and it has attained a unique position as a host material for magnetic doping due to its incomparable characteristics (non-toxicity, low cost, high stability and exotic optical, electronic and magnetic properties). Pure titanium dioxide without impurities is an optically transparent diamagnetic material. Doping by transition metals helps in controlling the structural, electrical, optical, and magnetic properties of TiO2 drastically [19]. However, the main challenge in DMS systems is that the doped 3d metals can segregate to form magnetic clusters or secondary phases. As a result, there are many discussions about the intrinsic or extrinsic origin of room-temperature ferromagnetism in these systems [20].
Many research groups have undertaken numerous efforts to explore the structural, optical, and magnetic properties of pure or 3d metal-doped TiO2 in different possible prospects, for example [21,22,23,24,25]. It has been established that the structural state of the 3d impurity and the observed ferromagnetic behavior strongly depend on the fabrication method and growth conditions of doped TiO2 samples and realize most often the form of nanoparticles or thin films. In the last decade, the effect of implantation of 3d ions accelerated to high energies of 150–400 keV on the modification of the structural and magnetic properties of thin single-crystal films TiO2 of rutile or TiO2 of anatase [26,27,28,29,30,31,32,33,34,35] has also been intensively studied, including our early investigations of 40 keV energy implantation with ions of cobalt [36,37,38,39], iron [40], nickel [41], or vanadium [42]. Comprehensive spectroscopic studies have shown that the 3d dopant in the implanted TiO2 region can be either in the oxidation state +2,+3 in the form of a Ti cations substitution, or in the neutral state in the form of a dispersion of metallic nanoparticles. In general, both the microstructure and the magnetic behavior of 3d ions implanted in TiO2 strongly depend on the ion implantation regimes (ion energy, flux, and fluence), the crystallographic orientation of the TiO2 single-crystal substrate, as well as the temperature during ion irradiation and/or post-implantation annealing. In particular, at room temperature, anisotropic ferromagnetism with in-plane magnetic anisotropy was observed when single-crystal TiO2 samples were implanted with cobalt [25,34,37], iron [30,34,40], or nickel [32,33,41] ions at high implantation fluences, more than 1016 ions/cm2. In most cases, the observed magnetic anisotropy was related to metal nanoclusters coherently grown in the TiO2 crystal lattice, but not to a solid solution of indirectly exchange-coupled magnetic 3d ions. In fact, the features of the microstructure that lead to the appearance of in-plane magnetic anisotropy have not yet been studied in detail and have not been finally established.
In this work, 40 keV Fe ions were implanted into the single crystal (100) and (001) TiO2 plates at different implantation fluences in order to investigate the evolution of the magnetic behavior of rutile with increasing concentrations of iron implant. Previously, we have investigated this TiO2 Fe system using the ferromagnetic resonance (FMR) technique [40]. A strong room-temperature FMR signals with the in-plane magnetic crystalline anisotropy for both orientations were observed. Below we present the results of our detailed structural and static magnetic studies of Fe ion-implanted plates of TiO2 rutile to establish the source of the observed anisotropic ferromagnetism and to elucidate the potentials of its practical applications.

2. Experimental Part

Accelerated to the energy of 40 keV, Fe+ ions were implanted into single-crystalline (100) and (001) face-oriented plates of titanium dioxide (TiO2) with the rutile structure at a fluence of (0.5–1.5) × 1017 ion/cm2 at an ion current density of 8 μA. The implantation was carried out on the ILU-3 ion accelerator at room temperature of the irradiated substrate in the vacuum of 10−5 torr. The substrate sputtering induced by the ion irradiation was controlled and taken into account. A step between the irradiated and intact areas of the sample was measured by the DektakXT profilometer (Bruker Nano GmbH, Berlin, Germany). The sputtering coefficient was calculated to be equal to α = 0.77 atoms/ion considering the step value (~10 nm), density of rutile (9.58 × 10²² atom/cm3), and the fluence value (1.5 × 10¹⁷ ion/cm2).
Surface morphology and chemical element composition of TiO2 samples were investigated using an EVO 50 XVP scanning electron microscope (SEM) (Carl Zeiss AG, Oberkochen, Germany) equipped with an energy-dispersive X-ray (EDX) spectrometer (Oxford Inca Energy-350, Oxford Instruments, Abingdon, UK). The microstructures of the implanted layers were characterized by high-resolution transmission electron microscopy (HRTEM) (TITAN 80–300, 300 kV, FEI, Eindhoven, The Netherlands). The distribution of chemical elements in the samples was examined in scanning (STEM) mode using an energy-dispersive X-ray (EDX) detector. TEM samples were prepared in cross-section by mechanical polishing and subsequent ion thinning. In addition to HRTEM study, depth profiles of Fe implant distribution were obtained by Rutherford backscattering spectroscopy (RBS) in random mode of the helium ions probing beam with the energy of 2.0 MeV on the accelerator complex HVEC EN-Tandem (High Voltage Engineering Europa B.V., Amersfoort, The Netherlands). The chemical state of the implanted iron and its distribution at different depths of the sample were studied by X-ray photoelectron spectroscopy (XPS) (SPECS GmbH, Berlin, Germany) utilizing ion etching. The layer-by-layer etching was carried out using a 3 keV Ar+ ion beam. The depth profile between the etched and non-etched areas was controlled by the Bruker DektakXT profilometer. The results showed that the average etching rate was approximately 0.08 nm/s and did not principally depend on the crystal lattice orientation of the TiO2 plates. XPS spectra were recorded after every etching session using a Phoibos 150 hemispherical energy analyzer (SPECS GmbH, Berlin, Germany) and the data were processed using CasaXPS software [43]. The binding energy was calibrated to the carbon C1s peak at 284.8 eV and the background subtraction was carried out according to the Shirley method. The magnetic properties of the samples were studied utilizing the vibrating sample magnetometry option of the Physical property measurement system (PPMS-9) (Quantum Design, San Diego, CA, USA). The magnetization curves were recorded by scanning the magnetic field up to 5 kOe in the plane of the samples (in-plane measurement geometry) at room temperature. The value of the measured magnetic moment was normalized to the layer thickness and the area of specimens under magnetic study in order to calculate the magnetization of the composite layer containing iron nanoparticles. The accurate values of the area were determined using the scanner and the layer thickness (40 nm) was taken from TEM data. The thermomagnetic curves were registered during heating of the samples, preliminarily cooled to liquid helium temperature either in zero (zero-field cooling, ZFC mode) or in a low magnetic field (100 Oe) (field cooling, FC mode). In addition, angular dependences of magnetic hysteresis loops of the samples giving the remanence and coercivity fields were recorded at room temperature using an experimental home-made coercive magnetometer.

3. Results and Discussion

Surface morphology and elemental composition of TiO2 rutile plates before and after ion implantation were studied in detail by SEM methods. Analysis of the SEM images (see Figure S1 of the Supplementary Material) shows that the surface of the rutile plates remains smooth, without microscale swelling and any neoplasms on the surface after intense ion irradiation. Moreover, the iron implant is homogenously distributed over the surface of the implanted TiO2 samples according to EDX element mapping taken at submicron scale (see Figure S1 of the Supplementary Materials). The atomic concentrations of chemical elements, including the Fe implant, in the studied TiO2 samples were estimated from the EDX microanalysis data, and their values are given in Table 1. The table shows that the iron content increases monotonously from 5 to 11 at.% by increasing the implantation fluence. On the contrary, the content of structure-forming oxygen decreases from 70 to 58 at.% with an increase in fluence at an almost constant Ti content (~26–27 at.%) in all samples. This means that the main radiation defect in the TiO2 plates implanted with Fe+ ions with an energy of 40 keV is an oxygen vacancy. A small carbon content (~2–4 at.%) on the surface is associated with uncontrolled contamination of the samples surface during ion implantation [44].
It is important to note that the Table shows the mean values of the atomic concentration of each chemical element, obtained as a result of averaging the thickness of the layer in which the characteristic X-ray radiation is generated during EDX measurements. According to our calculations within the framework of the CASINO program [45], for an electron beam energy of 10 keV used to record the EDX spectra, the thickness of the generation layer of the K- and L-lines of titanium and iron is approximately equal to 150–200 nm. Taking into account the thickness of the surface layer modified by implantation (~60–70 nm, as will be shown below), the actual values of the iron impurity concentration in the implanted layer should be two to three times higher. A really high value of the iron impurity concentration at the maxim level of 30–35 at.% in TiO2 samples implanted with the highest fluence of 1.5 × 10¹⁷ ion/cm2 has been confirmed by the RBS and XPS measurements presented below.
Figure 1 shows depth distribution profiles of iron impurity in the TiO2 plates implanted with the fluence of 1.5 × 10¹⁷ ion/cm2 which were obtained from the analysis of RBS and XPS spectra. For comparison, the depth profile of the impurity distribution calculated using the SRIM (stopping and range of ions in matter) algorithm [46] and substrate sputtering during ion implantation is presented in the form of a continuous dotted curve. The substrate sputtering effect was taken into account according to Equation (11) from reference [39]. The calculated SRIM profile has a Gaussian shape with the maximum concentration ~38 at.% at the peak position (Rp) at a depth of 17.5 nm.
As it can be seen from the RBS and XPS distribution profiles for the odd orientation of the substrate (see Figure 1a), the positions of the iron concentration maxima almost coincide as can be seen in the case of the calculated value of Rp within the framework of the SRIM algorithm. In the case of the (001)-oriented rutile, the impurity concentration maxima are shifted deeper into the sample compared with the calculated SRIM profile. In general, most of the implanted iron is localized in the surface region with a thickness of approximately 50–60 nm for both orientations of the irradiated rutile plates. The extended tails are also observed in the XPS distribution profiles, up to a depth of 90 nm and 120 nm for the (100)- and (001)-oriented samples, respectively. This trend indicates impurity diffusion deep into the substrate bulk during the high-fluence implantation. Note that the tails can also be detected by RBS depth profiles which exhibit a tendency of slow decreasing to a depth of approximately 60–70 nm. This is the measurement limit in the RBS method for these samples due to the overlap of deeper iron energy channels with the spectral channels from the surface titanium.
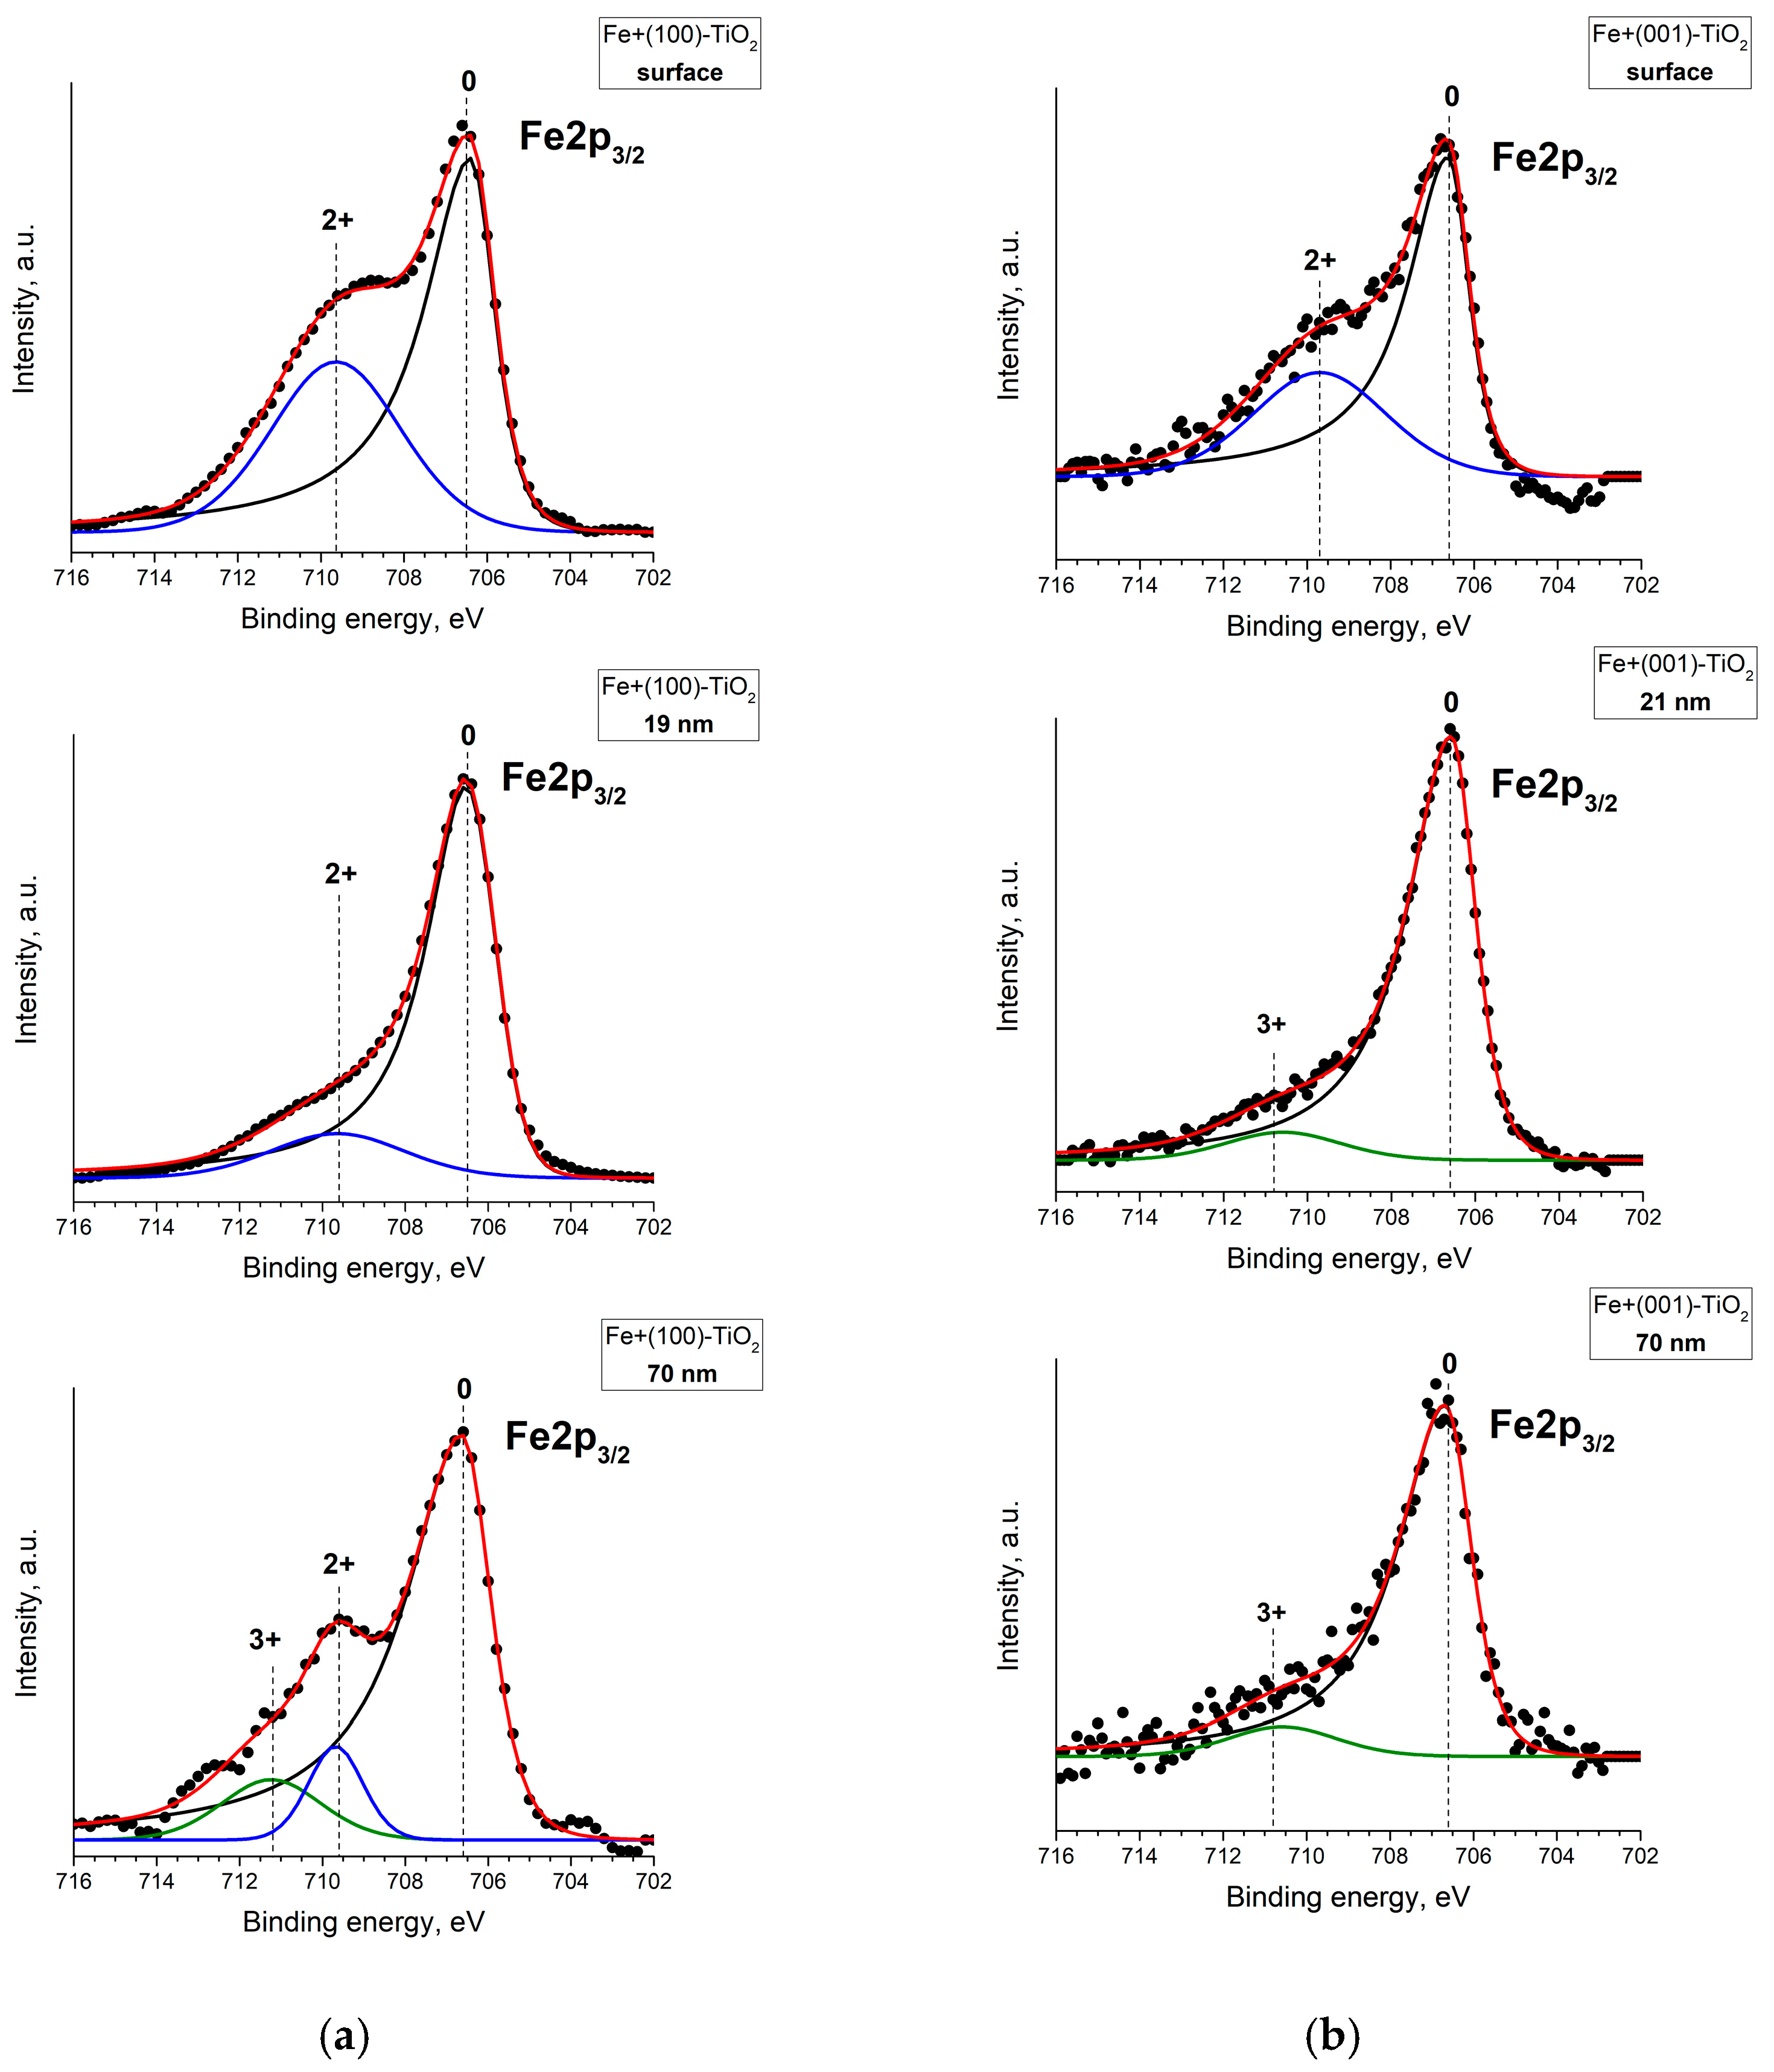
Figure 2 shows high-resolution XPS spectra for samples implanted with a fluence of 1.5 × 10¹⁷ ion/cm2 at different depths of the analysis. Fe 2p peaks were fitted with a set of components considering curve-fitting parameters (binding energy, line shape of peak, full width at half maximum, and others [47]). For the sake of clarity, only the Fe 2p3/2 region of binding energies is presented.
For all spectra shown in Figure 2, the main peak can be found at ~706.6 eV which is attributed to metallic iron [47]. The second peak, which appears at a binding energy of ~709.6 eV, can be referred to as the Fe2+ state of the implant. The third peak is found only for the XPS spectrum recorded in the tail of iron distribution at the depth of 70 nm. The binding energy value of the third peak is ~711.1 eV and is related to the Fe3+ state [47]. As can be seen in Figure 2, most of the implanted impurity is in the metallic state since the Fe0 component is dominant in all presented spectra. On the other hand, a part of the iron implant is in the Fe2+ oxidized state on the surface of the sample or at the maxima of the impurity depth distributions, as shown in Figure 1. This trend persists for both orientations of TiO2 substrates with implanted iron impurity. The oxidized part of the implanted iron seems to be directly related to the presence of a large number of oxygen atoms knocked out from the rutile lattice sites during ion irradiation. Note that oxidation cannot be associated with the diffusion of atmospheric oxygen into the surface layer of the samples, since, as shown by our magnetic studies presented below, the magnetic parameters of the iron-implanted TiO2 plates do not change for a long time (more than three years) while samples have been stored under ambient conditions. Finally, our deconvolution of the XPS spectra shows that a small fraction of the impurity located in the tail of the depth distribution is in the Fe3+ state for both orientations of the TiO2 plates. This is due to the presence of paramagnetic Fe3+ ions in the lattice sites of rutile, which was earlier established by magnetic resonance studies of TiO2 samples implanted with Fe ions [40].
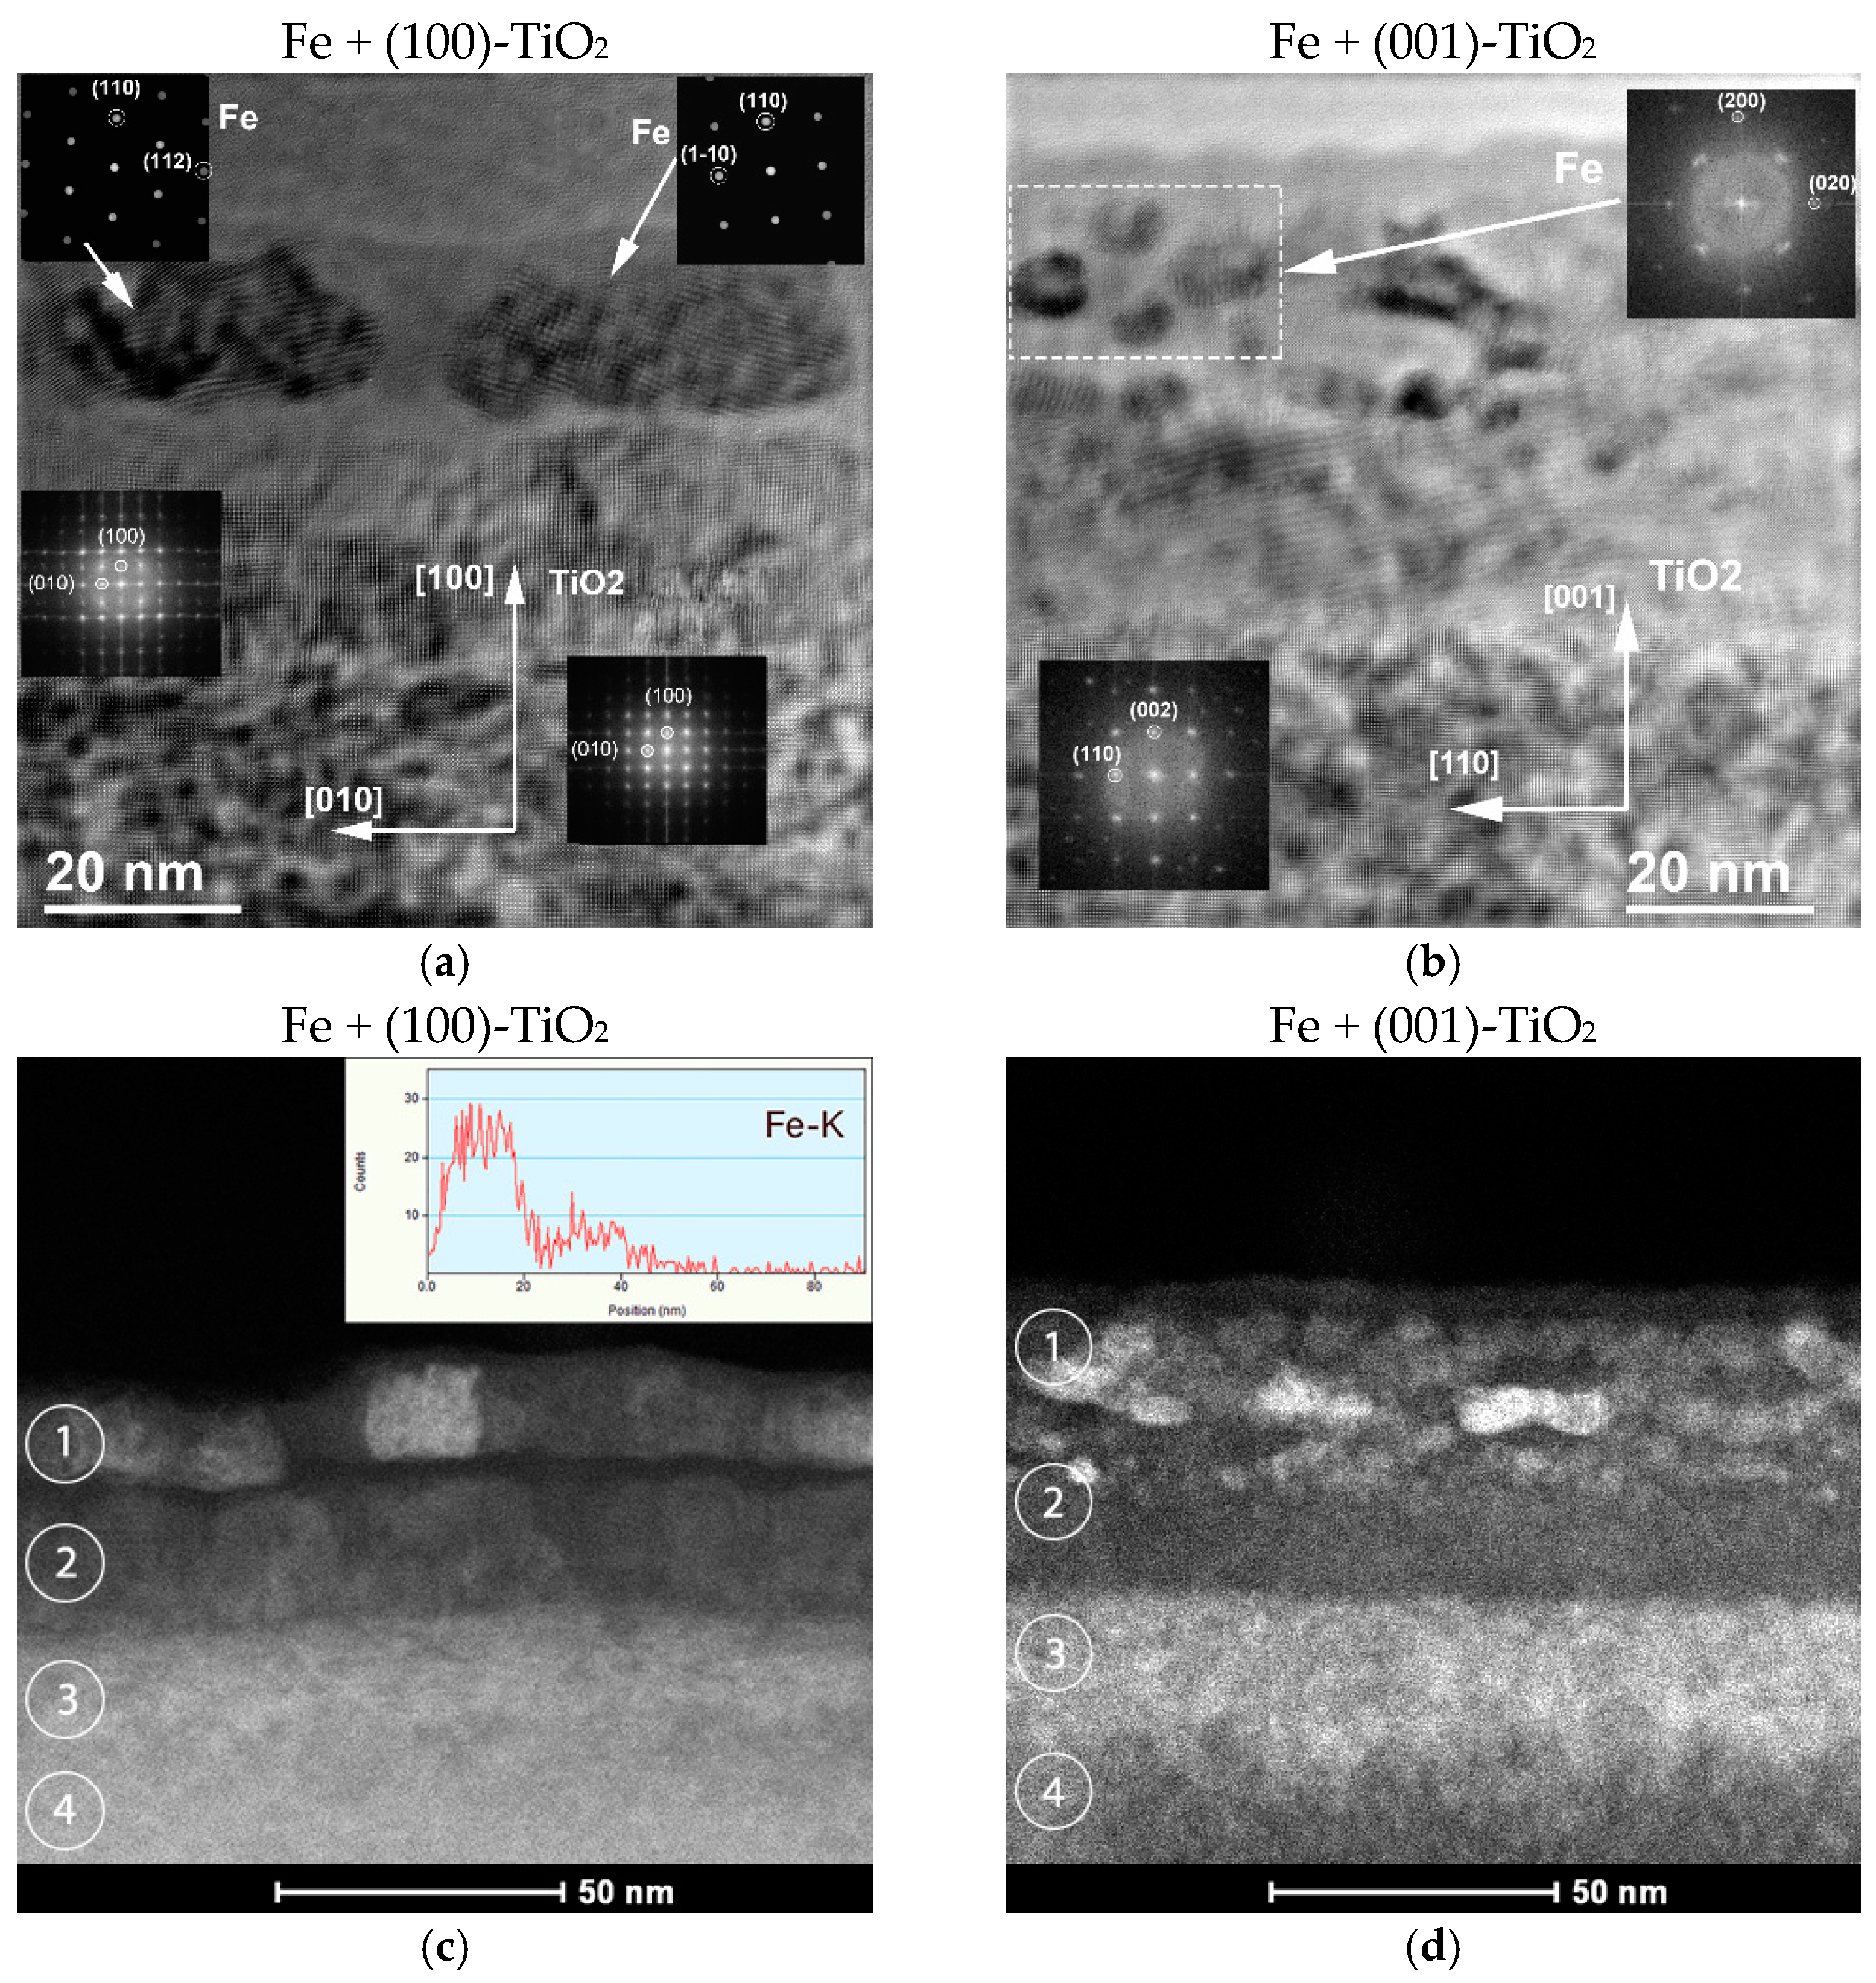
The high-fluence implantation with iron ions significantly changes the phase composition of the implanted rutile. Analysis of the cross-sectional HRTEM and STEM images (see Figure 3) clearly indicates the formation of nanoparticles of the α-phase metallic iron in the surface region of the TiO2 plates implanted with the fluence of 1.0 × 10¹⁷ ion/cm2. Namely, the nanoparticles of α-phase iron with sizes of 12–18 nm were clearly observed in the surface layer with the 20 nm thickness in the (100)-oriented TiO2 plate (Figure 3a). As follows from the analysis of the fast Fourier transform (FFT) patterns shown in the insets, these nanoparticles (NPs) are embedded into the rutile lattice in two orientations rotated relative to each other at an angle of 54.7° in the (100) plane (see the left and right nanoparticles on the HRTEM image in Figure 3a). For the planes perpendicular to the surface of rutile plate, the following relations are fulfilled:
Fe [−112] || TiO2 [010] for left nanoparticle (minority, 33% of the observed NPs).
Fe [1-10] || TiO2 [010] for right nanoparticle (majority, 67% of the observed NPs).
Fe (110) || TiO2 (100) for both nanoparticles.
The growth of nanoparticles with a wide size distribution in the range of 4–12 nm was observed in a TiO2 plate in the (001) orientation (Figure 3b). It was noted that iron nanoparticles with large sizes of 10–12 nm are located closer to the surface, while smaller particles with sizes of 4–8 nm are located in a deeper layer at a distance of 20–40 nm from the sample surface. As follows from the analysis of the FFT patterns, all ion-synthesized nanoparticles have the same growth orientation relative to the rutile lattice at the following axis ratios:
Fe [010] || TiO2 [110] and Fe [100] || TiO2 [001].
The depth distribution of iron implants in implanted TiO2 samples was examined in the STEM scanning mode using an energy dispersive X-ray (EDX) detector. Analysis of the STEM images clearly shows that large iron nanoparticles (white spots on STEM images) are located in the 20 nm thick surface layer of the (100)-TiO2 sample (Figure 3c), while for the (001)-TiO2, smaller nanoparticles in a wide range of sizes are observed in a layer with a thickness of approximately 40 nm (Figure 3d). The EDX line scan profiles of the (100)-TiO2 and (001)-TiO2 samples show that the iron implant is distributed non-monotonically from the surface down to a depth of 60–70 nm (see inset in Figure 3c and also Figure S2 of the Supplementary Material). Note that the EDX depth mapping of iron is in an agreement with the depth profiles of iron obtained by XPS and RBS.
Taking into account the experimental results of TEM, as well as XPS and RBS studies in implanted TiO2 samples, four characteristic regions can be distinguished (marked with numbered circles 1–4 in Figure 3c,d). The first region, a surface layer with a thickness of approximately 20 nm, is an almost completely amorphized rutile matrix containing both structure-oriented α-Fe nanoparticles (most) with large sizes of 10–18 nm and fine magnetite nanoparticles, Fe3O4 (a smaller part), since our XPS data unambiguously indicate the oxidized state of some of the implanted iron impurities. This fact was partially confirmed by a detailed analysis (not shown) of the FFT patterns from individual small nanoparticles in the surface layer, which shows that their point reflections can be attributed to the crystal structure of Fe3O4. The second region (layer), located at a depth of 20 to 40 nm, is a partially disordered rutile lattice with an increased iron content, either in the form of small Fe nanoparticles (4–8 nm in size) or in the form of a dispersion of iron atoms (Fe0) and ions (Fe2+ or Fe3+). Further, a third deeper region (40–70 nm) is clearly visible, where the rutile lattice is in a stressed state according to the analysis of the positions of rutile point reflections in the FFT pattern corresponding to this region (see inset in the middle part of Figure 3a). The iron impurity content (Fe0 atoms or Fe3+ ions) in this region is minimal, less than 5 at.% according to XPS data for the iron depth (see Figure 2). Finally, the fourth region is an unmodified titanium dioxide substrate, where there is no iron impurity at a depth of more than 100 nm.
From the microscopic data presented above, an obvious question arises: how are structure-oriented iron nanoparticles formed in the first, almost completely amorphous, surface layer of implanted rutile? Although the mechanism of coherent growth of iron nanoparticles with a given crystallographic orientation is not entirely clear, we will discuss two possible scenarios. In the first case, the process of nucleation of α-Fe precipitates oriented along the rutile axes can occur at the initial stage of ion implantation, when the implanted surface layer is still in the crystalline state. With a subsequent increase in the implantation fluence, a homogeneous growth of precipitates with an already-defined crystalline structure occurs due to the diffusion of implanted iron atoms to the nuclei of the new phase, while the TiO2 crystalline matrix passes into an amorphous state as a result of intense ion irradiation. In the second scenario, when the first layer is already amorphous, the formation of oriented iron nanoparticles can occur due to the epitaxial growth of iron crystallites on the TiO2 crystalline regions located in the second, deeper layer. Such TiO2 crystalline regions, which are in close contact with iron nanoparticles, have been observed using HR TEM (see Figure S3a in the Supplementary Materials). In addition, analysis of the FFT pattern taken from a selected region, containing both the iron nanoparticles from the first surface layer and the TiO2 crystal region from the second deeper layer, confirms that the lattices of the iron nanoparticles and rutile matrix match each other closely (Figure S3b in the Supplementary Materials).
Evolution of the magnetic response with increasing the implantation fluence of iron at room temperature of measurements is presented in Figure 4. At the lowest fluence of the implantation, 0.5 × 10¹⁷ ion/cm2, the samples exhibit superparamagnetic behavior. With a further increase in the amount of implanted iron, the magnetic response becomes stronger, and the samples exhibit ferromagnetic properties, characterized by a wide magnetic hysteresis loop. Finally, in the case of the irradiation fluence of 1.5 × 10¹⁷ ion/cm2, the strongest ferromagnetic response was recorded. It is clearly seen that the hysteresis loops are much wider (i.e., the coercive field is higher) for the (100)-oriented samples rather than (001)-oriented ones. This aspect is probably related to the presence of a part of the iron oxide phase on the surface and in the depth of the sample, according to XPS measurements.
With the purpose of further study of the impact of the implantation fluence on the magnetic properties, temperature dependences of the magnetic moment of the samples were recorded in the ZFC and FC modes. Figure 5 shows thermomagnetic curves for (100)- and (001)-oriented TiO2 samples implanted with different implantation fluences of iron ions. It is clearly seen that the ZFC curves for the samples implanted with the low fluence of 0.5 × 10¹⁷ ion/cm2 reveal distinct peaks (shown by arrows in Figure 5) at characteristic temperatures of Tb ≅ 50 K or Tb ≅ 26 K for the (100)- and (001)-TiO2 samples, respectively. Here, Tb is the so-called blocking temperature of a magnetic single-domain nanoparticle [48]. At temperatures below Tb, the magnetic moment of the nanoparticle is “blocked” in random (or along the applied magnetic field) directions during measurement, and a difference is observed between the ZFC and FC curves. On the contrary, at temperatures above Tb, magnetic single-domain nanoparticles are in the superparamagnetic regime with a Langevin-like temperature dependence on the magnetic moment for both the ZFC and FC modes. In our case, the observation of peaks in the ZFC curves unambiguously indicates the formation of an ensemble of superparamagnetic α-Fe nanoparticles in TiO2 samples implanted at a low implantation fluence. Furthermore, a broaden peak of the ZFC curves indicates the size distribution of these nanoparticles. Measurements of the magnetization curves of TiO2 samples implanted with low-fluence confirm their transition from superparamagnetic to ferromagnetic state as the temperature decreases from 300 to 10 K (see Figure S4 in the Supplementary Materials).
Knowing the value of the blocking temperature (Tb), we can calculate the average diameter (d) of ion-synthesized iron nanoparticles using the well-known relation [48,49]:
KeffV = 25 kBTb,
where the effective anisotropy constant Keff. = K1/4 for single-domain particles with the first order cubic anisotropy constant K1 > 0 (as it is for the bulk Fe α-phase), kB is the Boltzmann constant, and V = πd3/6 is the (spherical) nanoparticle volume, respectively. Taking the experimental values Tb = 50 K and 26 K and the cubic anisotropy constant of K1 = 5.5 × 10⁴ J/m3 [50] for the bulk Fe α-phase at low temperatures, the mean diameters of iron nanoparticles d are found to be approximately 13 nm and 10 nm in (100)- and (001)-TiO2 samples, respectively. Note that these nanoparticle size estimates are consistent with our aforementioned TEM study.
Furthermore, with an increase in the implantation fluence to a value of 1.0 × 10¹⁷ ion/cm2, the blocking temperature on the ZFC curves becomes much higher, above 300 K. As it was shown in Figure 4, these samples exhibit ferromagnetic behavior at room temperature with a clearly observed magnetic hysteresis loop. It is also worth noting that the FC curves for these samples have a more or less monotonic behavior depending on temperature, which is typical of ferromagnetic materials. These experimental observations mean that with an increase in the implantation fluence, the concentration of iron nanoparticles in the implanted surface layer increases too, and they either begin to interact with each other through magnetic dipole–dipole interactions or they agglomerate into large clusters. The effect of interparticle interactions on the value of Tb and the shape of thermomagnetic curves has been repeatedly discussed in the literature [see Ref. [49] and references therein]. It has been reliably established that with an increase in the concentration of magnetic nanoparticles and/or their agglomeration, the peak temperature (Tb) shifts towards higher values, and at the same time, the ZFC curve broadens and becomes flatter, as is observed in our thermomagnetic measurements. TiO2 plates implanted with a maximum fluence of 1.5 × 10¹⁷ ion/cm2 demonstrate stronger ferromagnetic ordering since the values of the total magnetic moment on the FC curve increase significantly and, at the same time, the ZFC curve does not tend to zero by decreasing the observation temperature. However, small inflection points in the ZFC curves in the low temperature region of 25–100 K for the TiO2 plates implanted with the fluence of (1.0 ÷ 1.5) × 1017 ion/cm2 indicate the presence the superparamagnetic iron nanoparticles that are not included in the ferromagnetic order.
Another interesting feature was observed in the angular dependences of parameters of the magnetic hysteresis loops (remanence and coercivity field) for rutile plates implanted with the middle or highest fluences (Figure S5 of the Supplementary Materials). For example, Figure 6 shows the experimental values of the ratio of the remanent magnetic moment (Jr) to the saturation moment (Js) taken at various orientations of the scanning magnetic field applied in the plane of the TiO2 plates with respect to the principial axes of sample under study.
Namely, in Figure 6, the orientations of the applied magnetic field were changed from the [010]-axis (azimuthal angle φ = 0o) to the [001] crystallographic direction (φ = 90o), and so on in the case of the (100)-TiO2 substrate, and from the [100]-axis to the [010] direction, and so on in the case of the (001)-TiO2 plate, respectively. It is clearly seen that the (100)-oriented samples reveal the two-fold symmetry of the ferromagnetic response, while the (001)-oriented plates of TiO2 show four-fold magnetic anisotropy. Taking into account the tetragonal symmetry of rutile, in which [100] and [001] are the axes of second and fourth order symmetry, respectively, we can conclude that the ion-synthesized nanoparticles are coherently embedded into the rutile matrix.

4. Conclusions

The microstructure and magnetic response of the single-crystalline TiO2 plates heavily implanted with iron ions were investigated in detail. Most of the Fe implant was found in the metallic state in the form of α-Fe nanoparticles. The iron-implanted samples exhibit first a superparamagnetic behavior at room temperature followed by a ferromagnetic behavior while increasing the fluence of iron ions. Furthermore, two- or four-fold magnetic crystalline anisotropy was observed in the (100)- and (001)-planes of the TiO2 plates, respectively. The induced ferromagnetism and the observed anisotropy are referred to the coherent growth of iron nanoparticles oriented along the particular crystallographic axes of the tetragonal structure of rutile TiO2. As a consequence, the growth of the iron nanoparticles oriented towards the crystal structure of the host oxide matrix and the observed in-plane magnetocrystalline anisotropy of the samples reflect the symmetry of the crystal structure of rutile substrates. High-resolution TEM measurements support these findings. Iron nanoparticles are embedded in the rutile lattice primarily in two orientations: Fe (110), [1-10] || TiO2 (100), [010] for the (100) face-oriented TiO2 plate and Fe (100), [010] || TiO2 (001), [110] for the (001)-oriented TiO2, respectively. At last, the possibility to create an endotaxial structure of Fe with anisotropic magnetic behavior within the semiconductor TiO2 matrix by ion implantation has particular interest for spintronics applications [3].

Supplementary Materials

The following supporting information can be downloaded at: https://www.mdpi.com/article/10.3390/cryst13020355/s1, Figure S1. SEM images and EDX spectra of the surface of (100)-TiO2 plate before and after implantation with Fe ions; Figure S2. Cross-section STEM image with EDX elemental mapping of the (001)-face oriented TiO2 plate implanted with Fe ions; Figure S3. Cross-section HR TEM and STEM images with FFT pattern of (100)-TiO2 plate implanted with Fe ions; Figure S4. In-plane magnetization curves measured at different temperatures for (100)-TiO2 and (001)-TiO2 plates implanted with Fe ions to the different fluences; Figure S5. In-plane magnetization curves measured with the magnetic field applied along different crystallographic directions of the TiO2 plates implanted with Fe+ ions to the fluence of 1.5 × 10¹⁷ ion/cm2.

Author Contributions

Conceptualization, I.R.V. and R.I.K.; methodology, I.R.V., V.I.N., L.R.T. and R.I.K.; formal analysis, I.R.V.; investigation, I.R.V., N.M.L., V.I.V. and A.K.G.; writing—original draft preparation, I.R.V.; supervision, R.I.K. and L.R.T.; project administration, R.I.K. All authors have read and agreed to the published version of the manuscript.

Funding

The reported study was funded by the Russian Science Foundation (project number 22-19-00712, https://rscf.ru/project/22-19-00712/).

Institutional Review Board Statement

Not applicable.

Informed Consent Statement

Not applicable.

Data Availability Statement

All relevant data are presented in the manuscript. Any other details about data or raw data are available upon request from the corresponding author.

Acknowledgments

Authors greatly acknowledge V.F. Valeev (from Zavoisky Physical-Technical Institute, FRC Kazan Scientific Centre of RAS, Russia) for carrying out iron ion implantation in TiO2, and to M. Doebili (from the Laboratory of Ion Beam Physics, ETH Zürich, Switzerland) for RBS analysis. XPS measurements were taken under the Kazan Federal University Strategic Academic Leadership Program (PRIORITY-2030).

Conflicts of Interest

The authors declare no conflict of interest.

References

  1. Dietl, T. Spintronics and ferromagnetism in wide-band-gap semiconductors. AIP Conf. Proc. 2005, 772, 56–64. [Google Scholar] [CrossRef] [Green Version]
  2. Chambers, S.A. Ferromagnetism in doped thin-film oxide and nitride semiconductors and dielectrics. Surf. Sci. Rep. 2006, 61, 345–381. [Google Scholar] [CrossRef]
  3. Hirohata, A.; Yamada, K.; Nakatani, Y.; Prejbeanu, I.-L.; Diény, B.; Pirro, P.; Hillebrands, B. Review on spintronics: Principles and device applications. J. Magn. Magn. Mater. 2020, 509, 166711. [Google Scholar] [CrossRef]
  4. Gupta, A.; Zhang, R.; Kumar, P.; Kumar, V.; Kumar, A. Nano-Structured Dilute Magnetic Semiconductors for Efficient Spintronics at Room Temperature. Magnetochemistry 2020, 6, 15. [Google Scholar] [CrossRef] [Green Version]
  5. Coey, J.M.D.; Chambers, S.A. Oxide Dilute Magnetic Semiconductors—Fact or Fiction? MRS. Bull. 2011, 33, 1053–1058. [Google Scholar] [CrossRef]
  6. Ryssel, H.; Ruge, I. Ion Implantation; Wiley: Chichester, UK, 1986. [Google Scholar]
  7. Potzger, K. Ion-beam synthesis of magnetic semiconductors. Nucl. Instruments Methods Phys. Res. Sect. B Beam Interact. Mater. Atoms 2012, 272, 78–87. [Google Scholar] [CrossRef]
  8. Afify, N.; Abbady, G.; Hamad, D.; Abdelbaki, R.F.; Yousef, E.S.; Shaaban, E.R.; Abd-el Salam, M.N. The effective role of dilute Co on SnO2 nanoparticles: Structural, optical and magnetic characterization properties for spintronics. Sens. Actuator Phys. 2021, 331, 112984. [Google Scholar] [CrossRef]
  9. Morozov, I.G.; Belousova, O.V.; Blanco-Andujar, C.; Ortega, D.; Kuznetsov, M.V. Structural, optical, magnetic, and XPS properties of SnOx nanoparticles. Solid State Sci. 2022, 126, 106854. [Google Scholar] [CrossRef]
  10. Ahsan, H.F.; Lal, K.; Saleem, M.; Mustafa, G.M.; Khan, M.A.; Haidyrah, A.S.; Atiq, S. Tuning the dielectric behavior and energy storage properties of Mn/Co co-doped ZnO. Mater. Sci. Semicond. Process. 2021, 134, 105977. [Google Scholar] [CrossRef]
  11. Naseem, S.; Pinchuk, I.V.; Luo, Y.K.; Kawakami, R.K.; Khan, S.; Husain, S.; Khan, W. Epitaxial growth of cobalt doped TiO2 thin films on LaAlO3 substrate by molecular beam epitaxy and their opto-magnetic based applications. Appl. Surf. Sci. 2019, 493, 691–702. [Google Scholar] [CrossRef]
  12. Waseem, S.; Anjuma, S.; Zeeshan, T.; Mustafa, L.; Kayani, Z.N.; Majid, F.; Warsi, A.; Shah, S.I. Pulsed laser deposited Cobalt doped Ti0.9Fe0.1-xO2 thin films: Structural, morphological, magnetic, optical and electrical properties. Ceram. Int. 2021, 47, 8555–8565. [Google Scholar] [CrossRef]
  13. Chen, H.; Zhang, Y.; Wu, Z.; Qin, Z.; Wu, S.; Hu, W. Substrate temperature dependence of chemical state and magnetoresistance characteristics of Co–TiO2 nanocomposite films. Trans. Nonferrous Met. Soc. China 2020, 30, 2502–2509. [Google Scholar] [CrossRef]
  14. Ho, J.; de Boer, T.; Braun, P.M.; Leedahl, B.; Manikandan, D.; Murugan, R.; Moewes, A. Origin and control of room temperature ferromagnetism in Co,Zn-doped SnO2: Oxygen vacancies and their local environment. J. Mater. Chem. C 2020, 8, 4902–4908. [Google Scholar] [CrossRef]
  15. Garnet, N.S.; Ghodsi, V.; Hutfluss, L.N.; Yin, P.; Hegde, M.; Radovanovic, P.V. Probing the Role of Dopant Oxidation State in the Magnetism of Diluted Magnetic Oxides Using Fe-Doped In2O3 and SnO2 Nanocrystals. J. Phys. Chem. C 2017, 121, 1918–1927. [Google Scholar] [CrossRef]
  16. Jiang, F.; Chen, D.; Zhou, G.; Wang, Y.; Xu, X. The dramatic enhancement of ferromagnetism and band gap in Fe-doped In2O3 nanodot arrays. Sci. Rep. 2018, 8, 2417. [Google Scholar] [CrossRef] [PubMed] [Green Version]
  17. Dhamodaran, M.; Karuppannan, R.; Murugan, R.; Boukhvalov, D.W.; Pandian, M.S.; Perumalsamy, R. Morphology controlled synthesis of Fe and Mn co-doped In2O3 nanocubes and their Dopant-Atom effects on electronic structure and magnetic properties. J. Magn. Magn. Mater. 2022, 560, 169547. [Google Scholar] [CrossRef]
  18. Matsumoto, Y.; Murakami, M.; Shono, T.; Hasegawa, T.; Fukuruma, T.; Kawasaki, M.; Ahmet, P.; Chikyow, T.; Koshihara, S.; Koinuma, H. Room-Temperature Ferromagnetism in Transparent Transition Metal-Doped Titanium Dioxide. Science 2001, 291, 854–856. [Google Scholar] [CrossRef]
  19. Dietl, T. A ten-year perspective on dilute magnetic semiconductors and oxides. Nat. Mater. 2010, 9, 965–974. [Google Scholar] [CrossRef] [Green Version]
  20. Yakout, S.M. Room Temperature Ferromagnetism: Nonmagnetic Semiconductor Oxides and Nonmagnetic Dopants. J. Electron. Mater. 2021, 50, 1922–1941. [Google Scholar] [CrossRef]
  21. Vokoun, D.; Svatuška, M.; Olejníček, J.; Kohout, M.; Drahokoupil, J.; Rameš, M.; Vejpravová, J.; Mantlíková, A.; Fekete, L.; Kopeček, J.; et al. Ni–TiO2 nanocomposite films and their magnetic properties. Phys. B Condens. Matter. 2016, 503, 44–50. [Google Scholar] [CrossRef]
  22. Darapaneni, P.; Moura, N.S.; Harry, D.; Cullen, D.A.; Dooley, K.M.; Dorman, J.A. Effect of Moisture on Dopant Segregation in Solid Hosts. J. Phys. Chem. C 2019, 123, 12234–12241. [Google Scholar] [CrossRef]
  23. Vokoun, D.; Vronka, M.; Rameš, M.; Olejníček, J.; Kohout, M.; Heczko, O. Ni nanoparticles in TiO2 films and their magnetic properties. Physica B Condens. Matter. 2020, 578, 411862. [Google Scholar] [CrossRef]
  24. Saadaoui, H.; Luo, X.; Salman, Z.; Cui, X.Y.; Bao, N.N.; Bao, P.; Zheng, R.K.; Tseng, L.T.; Du, Y.H.; Prokscha, T.; et al. Intrinsic Ferromagnetism in the Diluted Magnetic Semiconductor Co:TiO2. Phys. Rev. Lett. 2016, 117, 227202. [Google Scholar] [CrossRef] [Green Version]
  25. Zhang, H.; Huang, W.; Lin, R.; Wang, Y.; Long, B.; Hu, Q.; Wu, Y. Room temperature ferromagnetism in pristine TiO2 nanoparticles triggered by singly ionized surface oxygen vacancy induced via calcining in different air pressure. J. Alloy Compd. 2021, 860, 157913. [Google Scholar] [CrossRef]
  26. Joshi, S.R.; Padmanabhan, B.; Chanda, A.; Shukla, N.; Malik, V.K.; Kanjilal, D.; Verma, S. Anisotropic super-paramagnetism in cobalt implanted rutile-TiO2 single crystals. J. Magn. Magn. Mater. 2018, 465, 122–127. [Google Scholar] [CrossRef] [Green Version]
  27. Shutthanandan, V.; Thevuthasan, S.; Heald, S.M.; Droubay, T.; Engelhard, M.H.; Kaspar, T.C.; McCready, D.E.; Saraf, L.; Chambers, S.A. Room-temperature ferromagnetism in ion-implanted Co-doped TiO2 rutile. Appl. Phys. Lett. 2004, 84, 4466–4468. [Google Scholar] [CrossRef]
  28. Luk, W.Y.; Wong, S.P.; Ke, N.; Li, Q.; Lindner, J.K.N. Structural and magnetic properties of cobalt implanted TiO2 thin films. Proc. SPIE 2006, 6415, 162–170. [Google Scholar] [CrossRef]
  29. Zhu, S.; Wang, L.M.; Zu, X.T.; Xiang, X. Optical and magnetic properties of Ni nanoparticles in rutile formed by Ni ion implantation. Appl. Phys. Lett. 2006, 88, 43107. [Google Scholar] [CrossRef] [Green Version]
  30. Zhou, S.; Talut, G.; Potzger, K.; Shalimov, A.; Grenzer, J.; Skorupa, W.; Helm, M.; Fassbender, J.; Čižmár, E.; Zvyagin, S.A.; et al. Crystallographically oriented Fe nanocrystals formed in Fe-implanted TiO2. J. Appl. Phys. 2008, 103, 83907. [Google Scholar] [CrossRef]
  31. Cheng, F.; Ding, B.; Pan, F.; Yao, S.; Potzger, K.; Zhou, S. Investigation on the structural and magnetic properties of Co+ implanted rutile TiO2. Nucl. Instruments Methods Phys. Res. Sect. B Beam Interact. Mater. Atoms. 2012, 286, 180–183. [Google Scholar] [CrossRef]
  32. Ding, B.; Cheng, F.; Pan, F.; Fa, T.; Yao, S.; Potzger, K.; Zhou, S. The correlation between structure and magnetism of Ni-implanted TiO2 annealed at different temperatures. J. Magn. Magn. Mater. 2012, 324, 33–36. [Google Scholar] [CrossRef]
  33. Cruz, M.M.; da Silva, R.C.; Pinto, J.V.; Borges, R.P.; Franco, N.; Casaca, A.; Alves, E.; Godinho, M. Formation of oriented nickel aggregates in rutile single crystals by Ni implantation. J. Magn. Magn. Mater. 2013, 340, 102–108. [Google Scholar] [CrossRef] [Green Version]
  34. Silva, C.; Costa, A.R.G.; da Silva, R.C.; Alves, L.C.; Ferreira, L.P.; Carvalho, M.D.; Franco, N.; Godinho, M.; Cruz, M.M. Magnetic and electrical characterization of TiO2 single crystals co-implanted with iron and cobalt. J. Magn. Magn. Mater. 2014, 364, 106–116. [Google Scholar] [CrossRef]
  35. Cortie, D.L.; Khaydukov, Y.; Keller, T.; Sprouster, D.J.; Hughes, J.S.; Sullivan, J.P.; Wang, X.L.; Le Brun, A.P.; Bertinshaw, J.; Callori, S.J.; et al. Enhanced Magnetization of Cobalt Defect Clusters Embedded in TiO2−δ Films. ACS Appl. Mater. Interfaces 2017, 9, 8783–8795. [Google Scholar] [CrossRef] [PubMed]
  36. Khaibullin, R.I.; Tagirov, L.R.; Rameev, B.Z.; Ibragimov, S.Z.; Yildiz, F.; Aktaş, B. High Curie-temperature ferromagnetism in cobalt-implanted single-crystalline rutile. J. Phys. Condens. Matter. 2004, 16, L443. [Google Scholar] [CrossRef]
  37. Khaibullin, R.I.; Ibragimov, S.Z.; Tagirov, L.R.; Popok, V.N.; Khaibullin, I.B. Formation of anisotropic ferromagnetic response in rutile (TiO2) implanted with cobalt ions. Nucl. Instruments Methods Phys. Res. Sect. B Beam Interact. Mater. Atoms. 2007, 257, 369–373. [Google Scholar] [CrossRef]
  38. Akdogan, N.; Nefedov, A.; Zabel, H.; Westerholt, K.; Becker, H.-W.; Somsen, C.; Gök, Ş.; Bashir, A.; Khaibullin, R.; Tagirov, L. High-temperature ferromagnetism in Co-implanted TiO2 rutile. J. Phys. D Appl. Phys. 2009, 42, 115005. [Google Scholar] [CrossRef] [Green Version]
  39. Achkeev, A.A.; Khaibullin, R.I.; Tagirov, L.R.; Mackova, A.; Hnatowicz, V.; Cherkashin, N. Specific features of depth distribution profiles of implanted cobalt ions in rutile TiO2. Phys. Solid State 2011, 53, 543–553. [Google Scholar] [CrossRef]
  40. Okay, C.; Vakhitov, I.R.; Valeev, V.F.; Khaibullin, R.I.; Rameev, B. Magnetic Resonance Study of Fe-Implanted TiO2 Rutile. Appl. Magn. Reson. 2017, 48, 347–360. [Google Scholar] [CrossRef]
  41. Vakhitov, I.R.; Lyadov, N.M.; Valeev, V.F.; Nuzhdin, V.I.; Tagirov, L.R.; Khaibullin, R.I. Effects of nickel ions implantation and subsequent thermal annealing on structural and magnetic properties of titanium dioxide. J. Phys. Conf. Ser. 2014, 572, 012048. [Google Scholar] [CrossRef] [Green Version]
  42. Vakhitov, I.R.; Shemukhin, A.A.; Gumarov, A.I.; Lyadov, N.M.; Nuzhdin, V.I.; Faizrakhmanov, I.A.; Okay, C.; Rameev, B.Z.; Tagirov, L.R.; Khaibullin, R.I. Structural and magnetic studies of TiO2 rutile implanted with vanadium ions. Mater. Res. Express 2019, 6, 116103. [Google Scholar] [CrossRef]
  43. Fairley, N.; Fernandez, V.; Richard-Plouet, M.; Guillot-Deudon, C.; Walton, J.; Smith, E.; Flahaut, D.; Greiner, M.; Biesinger, M.; Tougaard, S.; et al. Systematic and collaborative approach to problem solving using X-ray photoelectron spectroscopy. Appl. Surf. Sci. Adv. 2021, 5, 100112. [Google Scholar] [CrossRef]
  44. Was, G.S.; Taller, S.; Jiao, Z.; Monterrosa, A.M.; Woodley, D.; Jennings, D.; Kubley, T.; Naab, F.; Toader, O.; Uberseder, E. Resolution of the carbon contamination problem in ion irradiation experiments. Nucl. Instruments Methods Phys. Res. Sect. B Beam Interact. Mater. Atoms. 2017, 412, 58–65. [Google Scholar] [CrossRef]
  45. Drouin, D.; Couture, A.R.; Joly, D.; Tastet, X.; Aimez, V.; Gauvin, R. CASINO V2.42—A Fast and Easy-to-use Modeling Tool for Scanning Electron Microscopy and Microanalysis Users. Scanning 2007, 29, 92–101. [Google Scholar] [CrossRef] [PubMed]
  46. Ziegler, J.F.; Ziegler, M.D.; Biersack, J.P. SRIM—The stopping and range of ions in matter (2010). Nucl. Instrum. Methods Phys. Res. Sect. B Beam Interact. Mater. Atoms. 2010, 268, 1818–1823. [Google Scholar] [CrossRef] [Green Version]
  47. NIST X-ray Photoelectron Spectroscopy Database, NIST Standard Reference Database Number 20; National Institute of Standards and Technology: Gaithersburg, MD, USA, 2000. [CrossRef]
  48. Bean, C.P.; Livingston, J.D. Superparamagnetism. J. Appl. Phys. 1959, 30, S120–S129. [Google Scholar] [CrossRef]
  49. Majetich, S.A.; Sachan, M. Magnetostatic interactions in magnetic nanoparticle assemblies: Energy, time and length scales. J. Phys. D Appl. Phys. 2006, 39, R407–R422. [Google Scholar] [CrossRef]
  50. Kittel, C. Introduction to Solid State Physics; Wiley: New York, NY, USA, 1976. [Google Scholar]
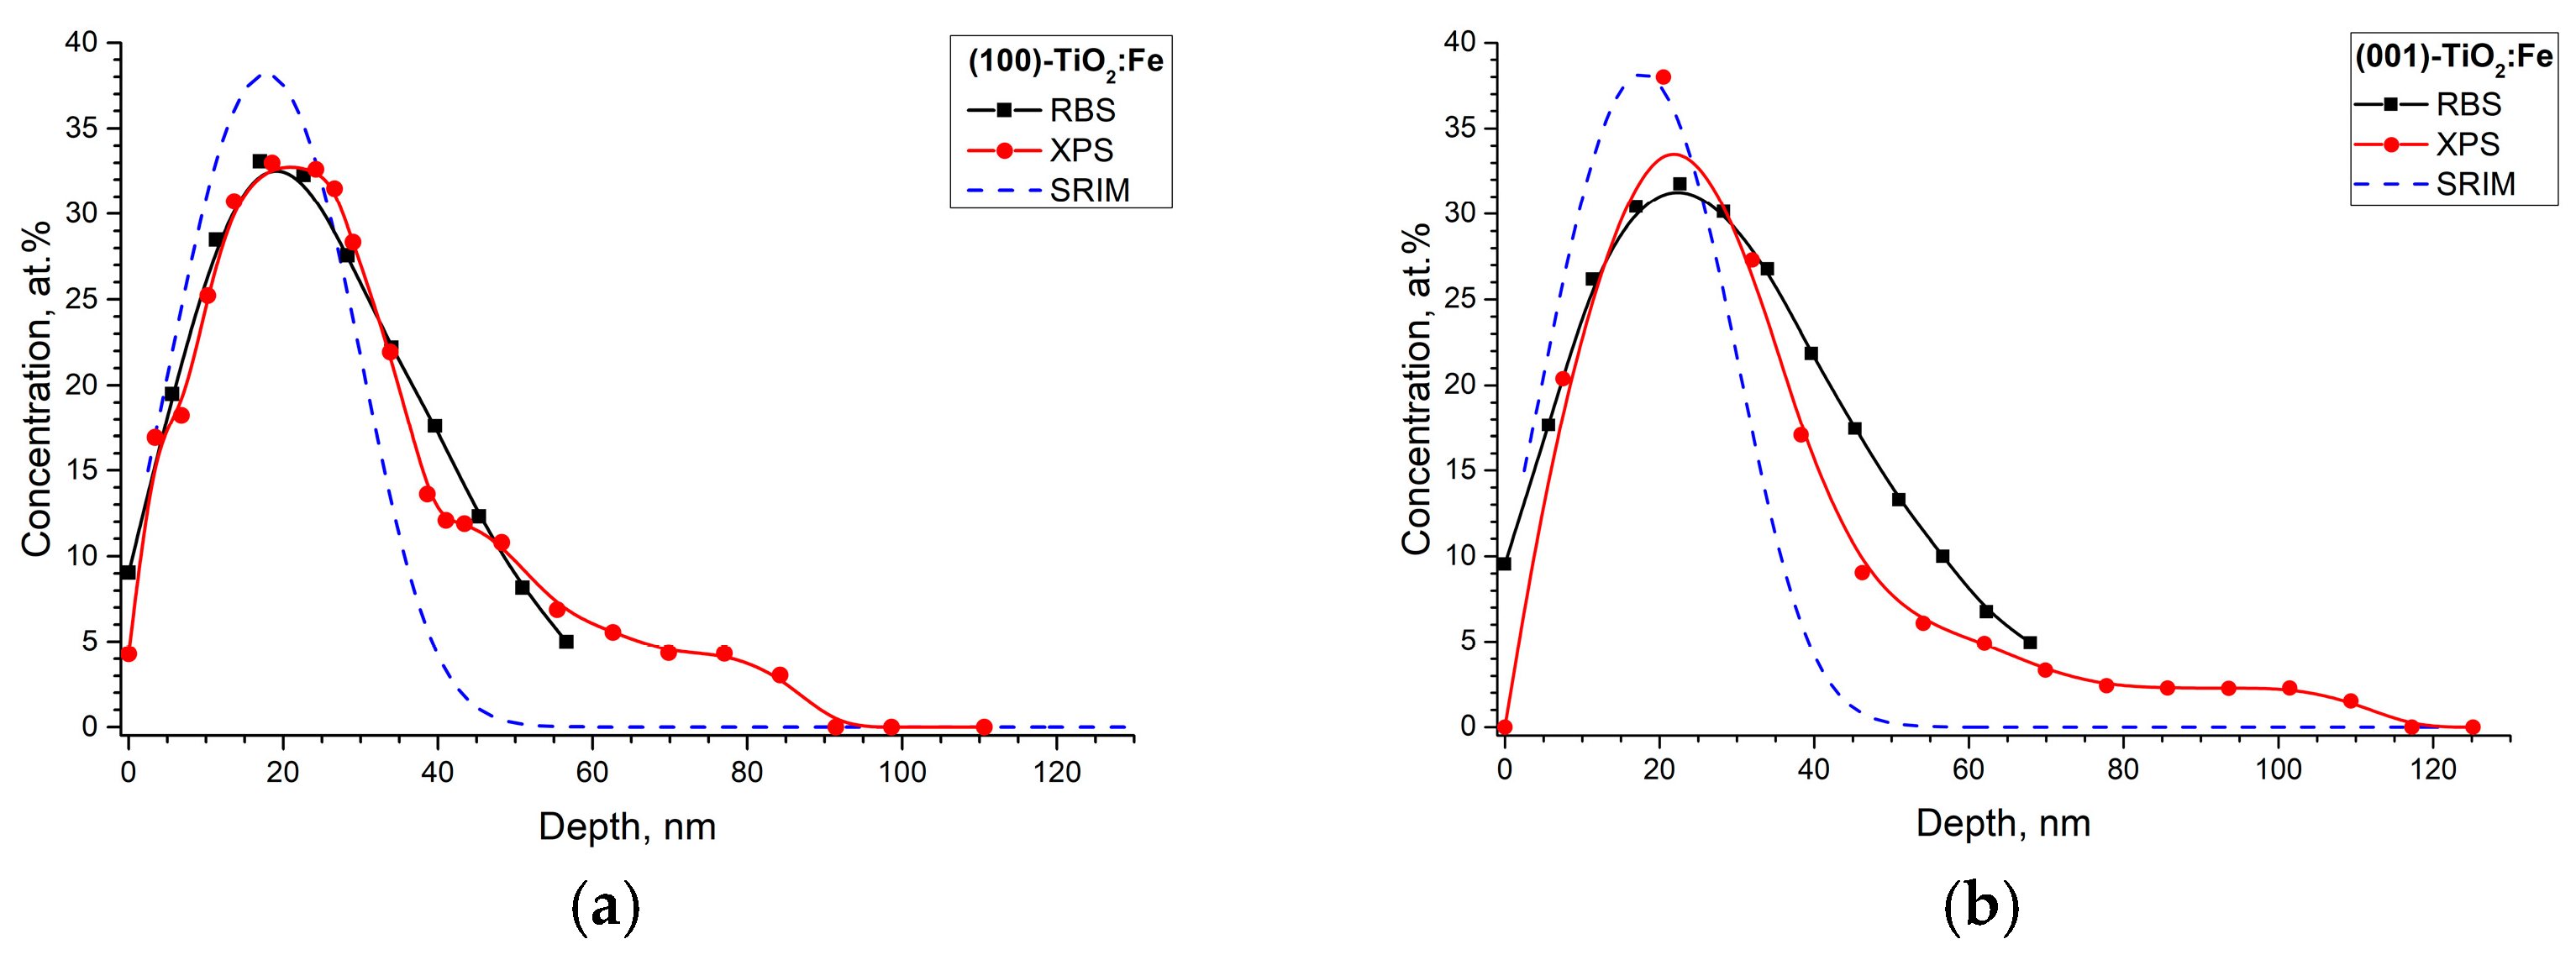
Figure 1. Depth distribution profiles of the iron impurity in (a) (100)- and (b) (001)-TiO2 plates implanted with the fluence of 1.5 × 10¹⁷ ion/cm2 calculated from the RBS (black squares) and XPS (red circles) spectra. The blue dotted line shows the theoretical impurity distribution profile calculated using the SRIM algorithm, taking into account sputtering of the substrate during ion irradiation.
Crystals 13 00355 g001
Figure 2. The Fe 2p XPS spectra of (a) (100)- and (b) (001)-oriented TiO2 implanted with a fluence of 1.5 × 10¹⁷ ion/cm2 as a function of the etching depth. Experimental spectra (black points) were deconvoluted into the components (colored lines) which are related to the different valence states of iron: Fe0—black, Fe2+—blue, and Fe3+—green lines, respectively. The overall fit of the components is shown by the red line.
Crystals 13 00355 g002
Figure 3. Panels (a,b)—cross-section HRTEM images of (100)-TiO2 (a) and (001)-TiO2 (b) plates implanted with iron ions to the fluence of 1.0 × 10¹⁷ ion/cm2. Crystallographic orientation of the cross-section in panel (a) is (001) for TiO2 matrix, as well (1-11) or (001) for left or right nanoparticles with corresponding FFT patterns (see insets); for (b) cross-section orientation is (1-10) for TiO2 and (001) for the selected group of Fe nanoparticles. Panels (c,d)—cross-section STEM images of the same Fe ion-implanted (100)-TiO2 (c) and (001)-TiO2 (d) plates. Inset on panel (c) shows the STEM-EDS depth profile of iron distribution taken along the [100]-direction, where the zero position of the profile corresponds to the sample surface. The four characteristic regions of TiO2 with different iron contents are marked by the numbered circles 1–4, respectively.
Crystals 13 00355 g003
Figure 4. Evolution of the magnetic response with increasing the implantation fluence for the Fe ion-implanted TiO2 plate with (100) and (001) face orientations, (a,b), respectively. Here, the magnetic field was applied along the [010]-axis of TiO2 for both orientations of rutile plates.
Crystals 13 00355 g004
Figure 5. Thermomagnetic curves taken in ZFC (blue line) and FC (black line) modes at a low magnetic field of 100 Oe for TiO2 samples implanted with Fe ions at different implantation fluences. Here, the blocking temperature (Tb) is marked by the arrow.
Crystals 13 00355 g005
Figure 6. In-plane dependence of the ratio of the remanent magnetic moment (Jr) to the saturation moment (Js) on the azimuth angle φ for the (100)- and (001)-TiO2 plates implanted with Fe ions to the fluence of 1.5 × 10¹⁷ ion/cm2.
Crystals 13 00355 g006
Table 1. The content of chemical elements both in the original TiO2 plate and in the TiO2 samples implanted with Fe ions at different fluences.
No.Plate OrientationFluence, Ion/cm2Elemental Composition, at. %Fe/Ti
COTiFe
1(100)-1.8870.3627.75--
2(100)0.5 × 10172.8565.8427.204.110.15
3(001)2.1365.128.184.60.16
4(100)1.0 × 10174.6861.6826.037.610.29
5(001)3.0761.0427.398.50.31
6(100)1.5 × 10174.1258.7726.710.40.39
7(001)2.6358.8126.911.660.43
Disclaimer/Publisher’s Note: The statements, opinions and data contained in all publications are solely those of the individual author(s) and contributor(s) and not of MDPI and/or the editor(s). MDPI and/or the editor(s) disclaim responsibility for any injury to people or property resulting from any ideas, methods, instructions or products referred to in the content.