Article

Prediction of Crack Propagation of Nano-Crystalline Coating Material Prepared from (SAM2X5): Experimentally and Numerically

1
State Key Laboratory of Solidification Processing, School of Materials Science and Engineering, Northwestern Polytechnical University, Xi’an 710072, China
2
Chemical Engineering and Petroleum Industries Department, Al-Mustaqbal University College, Babylon 51001, Iraq
*
Author to whom correspondence should be addressed.
Crystals 2023, 13(2), 365; https://doi.org/10.3390/cryst13020365
Submission received: 28 January 2023 / Revised: 11 February 2023 / Accepted: 13 February 2023 / Published: 20 February 2023
(This article belongs to the Section Crystal Engineering)

Abstract

:
The fracture and crack growth of materials can be practically and conveniently predicted through numerical analysis and linear elastics fracture mechanics. On this basis, the current study aims to present experimental work supported by a numerical technique for mimicking the crack propagation by Version 5.6 of COMSOL Multiphysics (version 5.6), used for the simulation of the coating made from Fe-based amorphous material with a thickness of 300 µm. The paper shows the effects of mixed-mode loading on cohesive zone parameters attained from load-crack mouth opening displacement (CMOD) curves. The microstructure dominates the fracture, which in mode I is altered from all-transgranular cleavage to nearly all-intergranular structure in mode II. Two common criteria for failure are linked to the mixed-mode results: Maximum energy release rate criterion (Maximum G) and maximum tensile stress criterion (Maximum S). However, distinguishing between the two criteria is made impossible by the large scatter in the data. The stress intensity factor is the basis for the. The stress intensity factor is the leading parameter facilitated by the singular element and should be estimated with accuracy. With the aim of comparing each criterion and illustrating the numerical schemes’ robustness, a number of examples are presented. It can be concluded that the Maximum G and Maximum S were successful and accurate in predicting the propagation of the Fe-based amorphous material prepared on mild steel.

1. Introduction

As a result of their desirable characteristics, including wear resistance, excellent corrosion, high strength, and low cost, Fe-based metallic glasses (SAM2X5) are being broadly acknowledged as a new category of functional and structural materials [1,2,3]. Nonetheless, the intrinsic limitations of Fe-based metallic glasses in bulk form when coating structural materials have restricted the application of these materials [4]. The use of Fe-based metallic glasses in coating structural applications is one possible method of taking advantage of their enhanced characteristics. Moreover, improved properties have also been noted in metallic glass matrices embedded by nanocrystalline partial phases [5]. Some of the areas where Fe-based metallic glass coatings are currently being applied include ship manufacturing, boiler fireboxes, the nuclear industry, and the auto industry [6,7,8,9]. The metallic glasses based on Fe have also been noted to exhibit an enhanced degree of hardness and produce strength values that could be matched with the crystalline types of comparable compositions [10,11,12]. Notwithstanding, the main disadvantages of Fe-based metallic glasses are their poor fracture toughness and low ductility. This is why efforts are in progress to deal with these weaknesses [13,14,15,16,17]. To improve these materials, there is a need to develop techniques for accurately measuring fracture toughness while also improving the processing of materials. Indentation has been employed as a measure of Fe-based metal glass toughness [18,19,20]. On the other hand, testing for notch toughness has been done on materials with non-standard geometry [15,21,22]. Even though it is popularly employed in limited-size samples, for brittle materials, the indentation fracture test is not dependable owing to the crack arrest condition that is not properly defined, making the analysis complicated in comparison to the standardized tests’ rapid through-crack propagation [23,24]. In mechanical properties like Young’s modulus and strain-stress, this could result in severe discrepancies. As a result, more accurate results can be obtained when fracture toughness is measured using standardized methods such as three-point bending. The calculation of Young’s modulus was achieved on the basis of the beam bending theory for an unsupported prismatic beam with a rectangular cross-section using Equation (1) below [25]:
E = L 3 m 4 b d 3  
where 𝐿 denotes the support length, 𝑚 the load-displacement curve’s slope, 𝑏 the specimen’s width, and 𝑑 is the specimen’s thickness.
Crack growth resistance and fracture toughness constitute vital material properties describing ductile and brittle material resistance against crack propagation [25,26,27,28,29,30]. Several scholars, including Khan and Al-Shayea [31], Aliha et al. [32,33,34], Al-Shayea [35], Chang et al. [36], Lanaro et al. [37], and Ke et al. [38] conducted studies and determined the mixed-mode and mode II fracture toughness of numerous breakable materials using the BD specimen. The SCB specimen was applied by Khan and Al-Shayea [39], Ayatollahi et al. [33,40] in analyzing the Mode II fracture. The use of BD or SCB specimen presents numerous benefits when studying brittle metals’ Mode II fracture, including that the procedure for setting up the test is easy, geometry and loading configuration is simple, it involves compressive loads application as opposed to tensile loads, and the possibility for introducing various mode mixes from pure Mode I to pure Mode II in a convenient manner through altering the crack orientation related to the applied load direction. While these researchers included a comparison of fracture toughness to brittle material for pre mode 1, pure mode 2, and mixture mode, they did not study the Fe-based amorphous material in two cases, experimental and numerical. However, here modeling by COSMOL Multiphysics was used to study the behaviour of this material. The present study delivers the experimental study and finite element analysis for modeling problems related to crack growth. This is accomplished through Version 5.6 of the COMSOL Multiphysics software. The basis of this model is the circumferential stress criterion and strain energy density criterion when presenting the paths from crack propagation acquired from different applications. Regarding the objective of modeling the propagation of cracks in material structures composed of several materials, cases of propagation in parts with additions are scrutinized. In civil engineering, this part can be fascinating in propagations for concrete or propagations in multilayer parts.

2. Experimental Work

2.1. Coating’s Fabrication and Characterization

Mild steel as substrate with the dimensions 65, 50, and 305 mm was used, as indicated in Figure 1. Acetone was used before it was dried substrate in the air, grit-blasted, and then coated. To bond the coating and the substrate, the Nickel Aluminium Composite Powder was used. For preparing the coating, C, B, Mo, Mn, Cr, Fe, and Si mixtures were used. An amorphous powder whose particles measured 25–45 μm was part of the thermal spray. The aim of preparing for coating and creating a powder coating whose thickness is 300 μm HVOF spraying device (JZY-250, Beijing Jiazhiyuan Scientific and Trading Co., Ltd., Beijing, China) was used. The thermal spraying procedure parameters were as follows: Stand-off distance 200 mm, compressed air pressure 700 kPa, and spraying voltage 34 V. After the spraying process, the wire electrical discharge machining (Partyline Limited, West Yorkshire, UK) was used to remove several samples to get the specimens needed for fracture toughness ready. The testing was accomplished through the use of a three-point fracture toughness device.

2.2. Microstructure Characterization

An X-ray diffractometer device was used for the inspection of the sprayed coating and powder microstructure. The device was supplied by XRD; X’ Pert PRO MPD, Philips, Eindhoven, Netherlands. A 2-h diffraction angle ranging from 20 to 80 degrees was used for initiating the X-ray diffraction. The measuring of fracture toughness was done using the bending method with three points. The obtained values are related to defects such as crystallinity that are always to be expected in BMGs’ synthesis. This is done with the aim of making sure that the values of fracture toughness obtained can be applied in practical predictions of parts made using our BMGs. The resulting mild steel’s structure toughness and structure wear of the Fe-bases amorphous were analyzed using the STM D5045 in three-point bending employing single-edge-notch bending (SENB) specimens, as illustrated in Figure 1. At the molded notch, a pre-crack of length 19.5 mm was introduced by tapping a new razor blade. The load point displacement was accurately measured using the clip page. To do the tests, the Instron® test machine equipped with a 20 KN load cell at a crosshead speed of 10 mm/min was used for the displacement-controlled tests. Together with this was an assessment of the loading rates’ impact on fracture toughness measurement. Six specimens were tested at each kind (mild steel with coating) loading content. For the Fe-based amorphous material on mild steel, a COMSOL Multiphysics (version 5.6) was employed for simulating the crack propagation.

3. Results and Discussion

3.1. Microstructural Characterization

At 7.9 g/cm3, the SAM2X5-600 samples used in the study’s bulk density corresponds with the results we obtained previously, which considered both the SAM2X5 powder (7.75 g/cm3) theoretical value and the structural relaxation occurring during the process of consolidation [41,42,43]. From Figure 2, the configuration for Fe-based amorphous for powder and as-spray coating can be seen. Even with the appearance of a hump, it can be seen the coating and powder of the Fe-based amorphous for powder, and as-spray coating is amorphous. When compared with the powder, the hump density diffusion relative to the amorphous coating is the same. Previous research [44] has proposed that the diffraction from the crystalline in the coating was the diffusion peak because the HVOF-deposited coating’s microstructure was nanocrystalline and amorphous. From this analysis, it can be inferred that the technique used in the preparation of the amorphous using HVOF spraying is effective, considering that it results in nearly no alterations to the powder’s initial amorphous structure and the phase structure of the Fe-base amorphous coating shifts.

3.2. Crack Growth Criteria

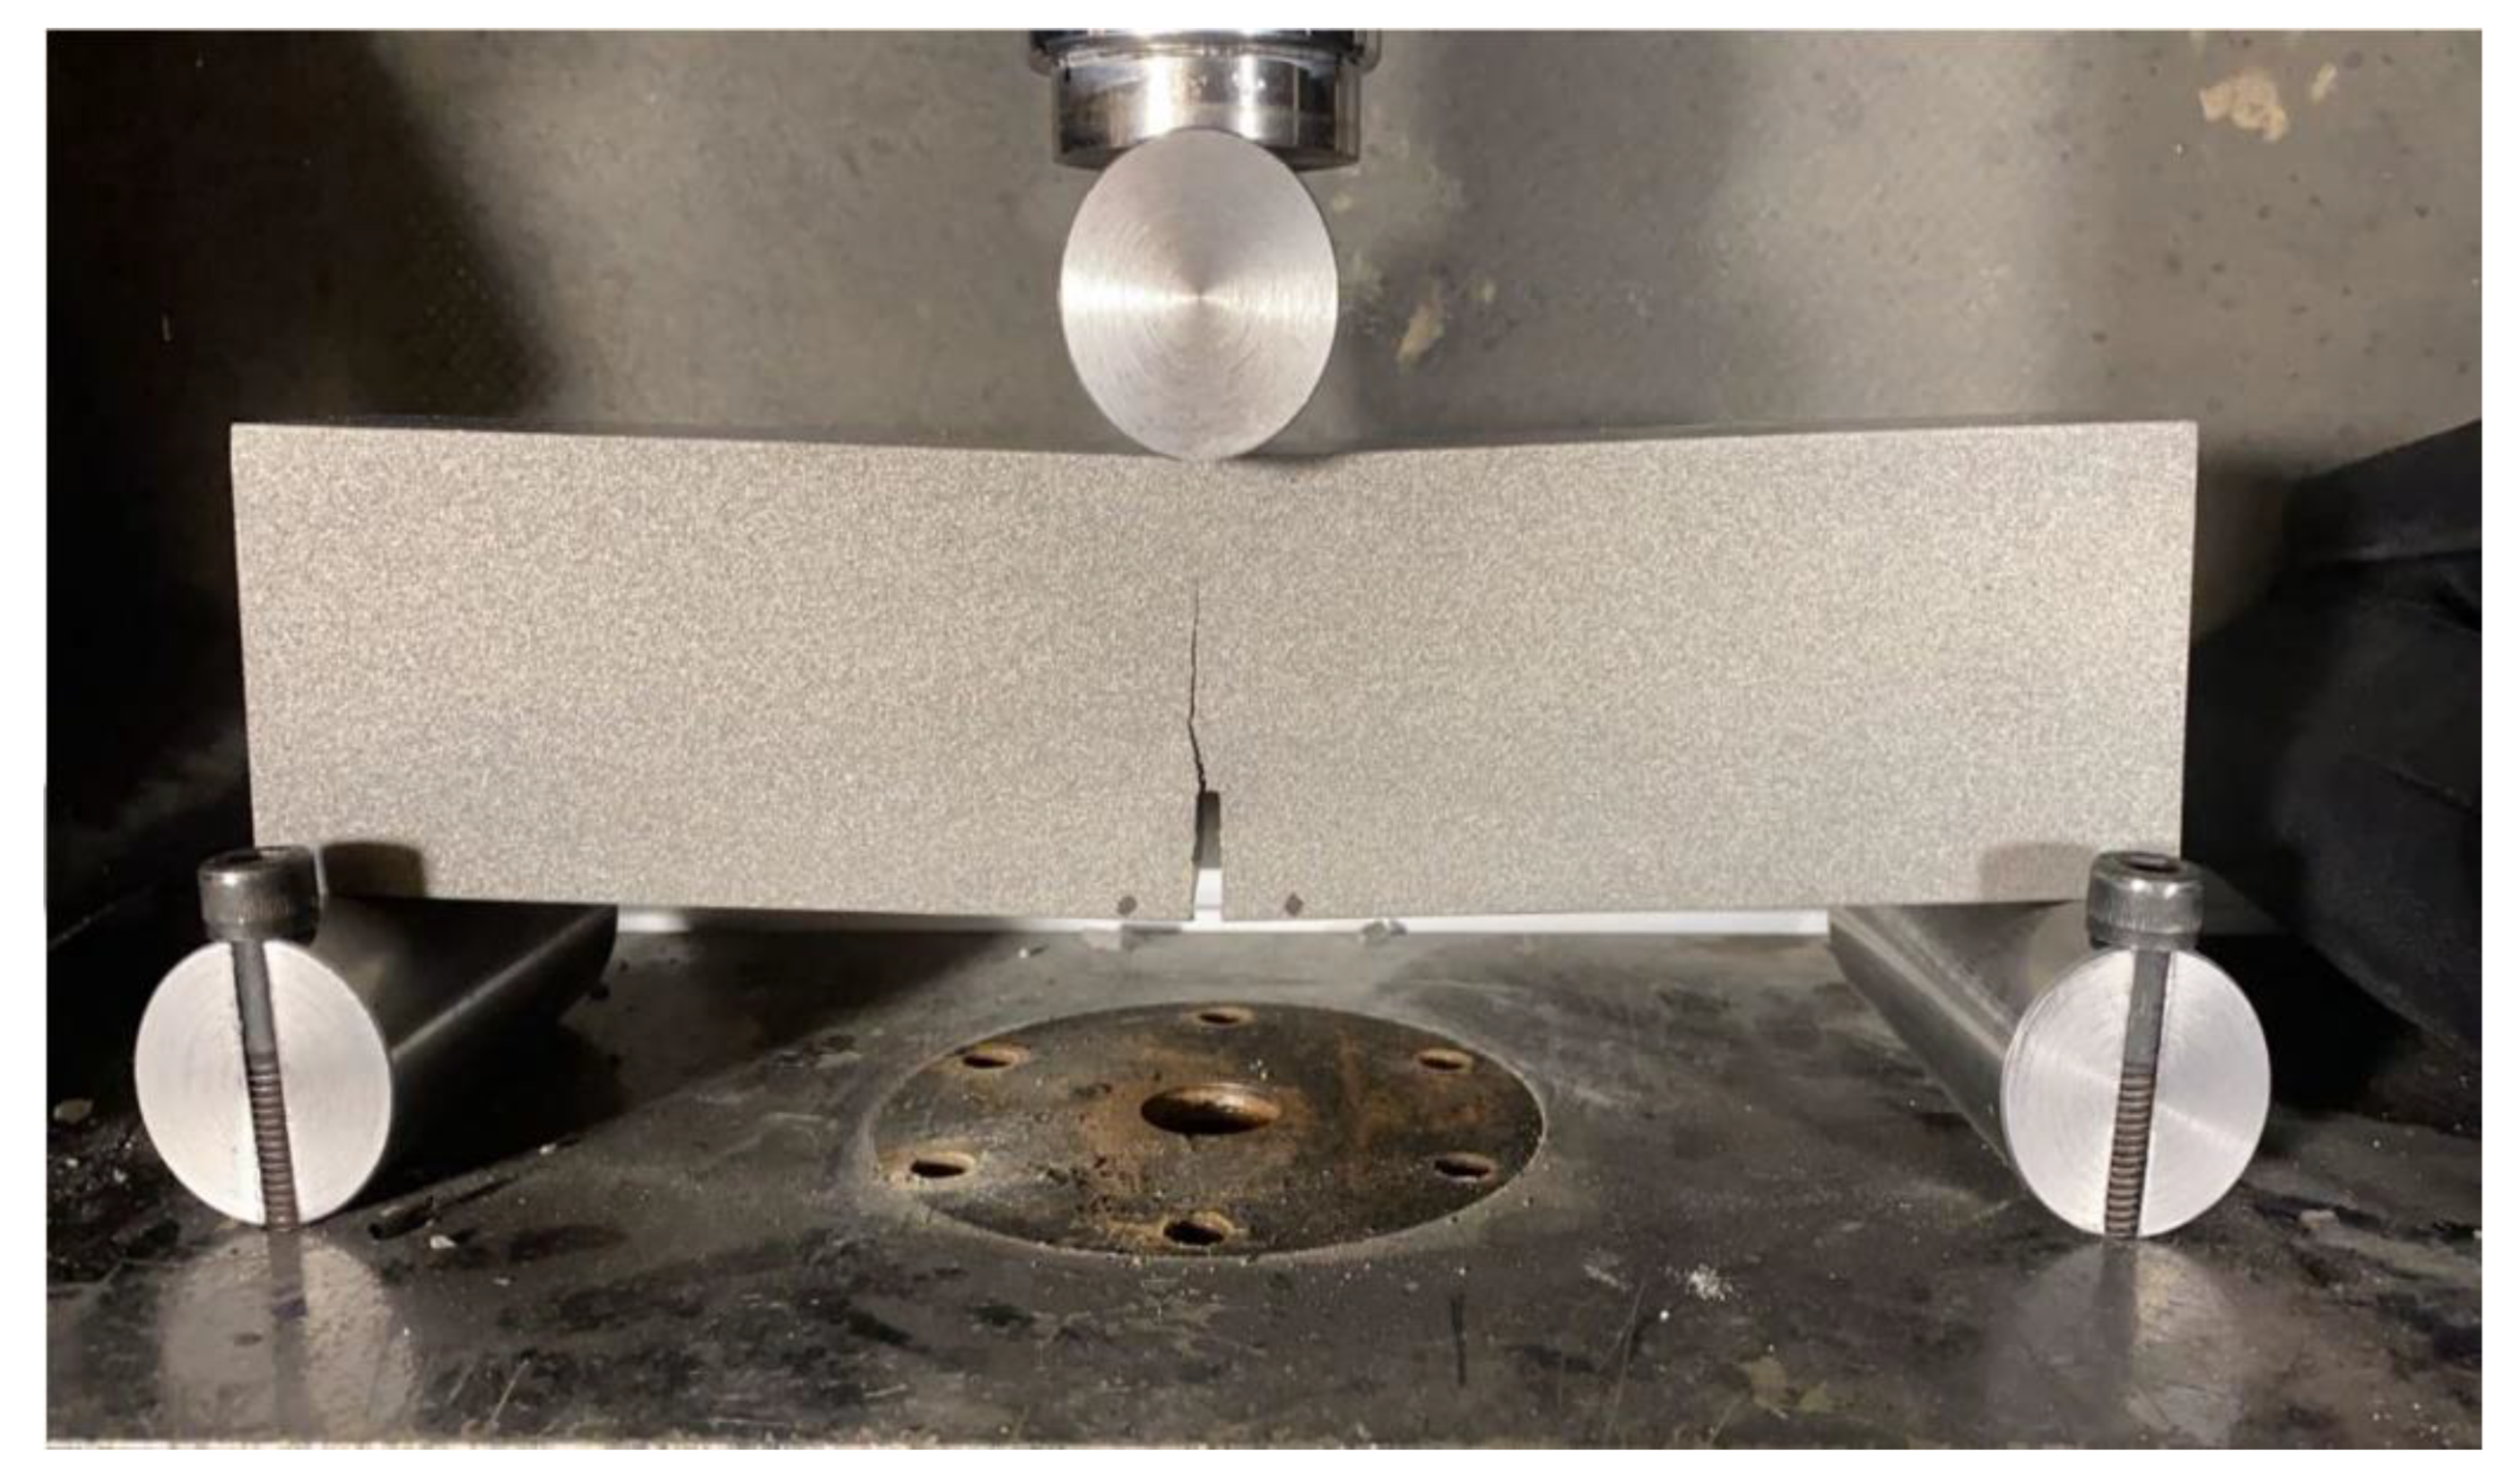
The experimental data of mode I and mode II crack propagation Fe-based amorphous material deposition on mild steel were adopted for the purpose of validating the COMSOL simulations by the present approach. In Figure 3, it can be seen that a functional beam is exposed to three-point bending conditions. Regarding this problem, the material gradient’s direction is parallel to the crack direction. In coating, some of the cracks are longitudinal, while others are horizontal. From the cracks propagated in the lamellae, it can be seen that the propagation of cracks is stalled when particles that have not yet melted are encountered. The rapid propagation of the course horizontal cracks fails the coating. To do further analysis of the coating’s failure, the in-situ monitoring of the coating during the bending testing is done. The commencement and propagation of cracks can be effectively monitored using acoustic emission (AE) [45]. Acoustic emission (AE) is a useful non-destructive method for monitoring crack start and progression. Coating failure information can be acquired by extracting the AE signal characteristics [46]. Numerous techniques can be employed when predicting the trajectory taken by the cracks, including the minimum strain energy density theory (Sih, 1974) and the maximum normal stress theory, also called the maximum circumferential stress theory (Erdogan and Sih, 1963). Erdogan and Sih (1963) introduced the maximum circumferential stress criterion (MCSC) for use in elastic materials. The criterion is based on the assumption that the propagation of the crack follows the direction of the highest circumferential stress (σθθ). Considering that the crack direction depends on the local stress area along a tiny ring whose radius (r) is located at the crack’s, this is local stress. The propagation cracks kinking angle (θ) can be found when the values of the stress intensity factor KI and KII are known:
t a n θ 2 = 1 4 K I K I I ± 1 4 K I K I I 2 + 8    
where: KI and KII are correspondingly the stress intensity factors analogous to mode I and mode II loading. Based on the minimum strain energy density criterion (MSEDC), Sih (1974) proposed the local strain energy’s critical value as the crack instability criterion. The direction taken by the crack propagation is defined by the minimum strain energy density around the crack’s tip. Solving Equations (3)–(7) can help determine the crack propagation angle (θ).
S θ = 0   ,         2 S 2 θ 0  
where:
S = d W d V r                     S = 1 π r a 11 K I 2 + 2 a 12 K 1 K I I + a 22 K I I 2    
with:
a 11 = 1 + v 8 E 3 4 v c o s θ 1 + c o s θ  
a 22 = 1 + v 8 E 4 1 v 1 c o s θ + 1 + c o s θ 3 c o s θ 1  
a 12 = 1 + v 8 E 2 s i n θ c o s θ 1 2 v  
where E denotes the elasticity modulus, ν is Poisson’s ratio, dW/dV elastic energy per unit volume V, and S stands the strain energy density’s intensity.

3.3. Calculating Stress Intensity Factors

Determining stress intensity factors forms the basis of fracture mechanics. For this reason, it is vital to design a numerical model with the capability to calculate such factors for various geometries of cracked structures under varying bounder settings. With regards to this paper, the stress intensity factors KI and KII are calculated using the displacement extrapolation technique (Phongthanapanich and Dechaumphai, 2004) as follows:
K I = E 3 1 + v 1 + k 2 π L 4 v b v d v c v e 2  
K I I = E 3 1 + v 1 + k 2 π L 4 v b v d v c v e 2  
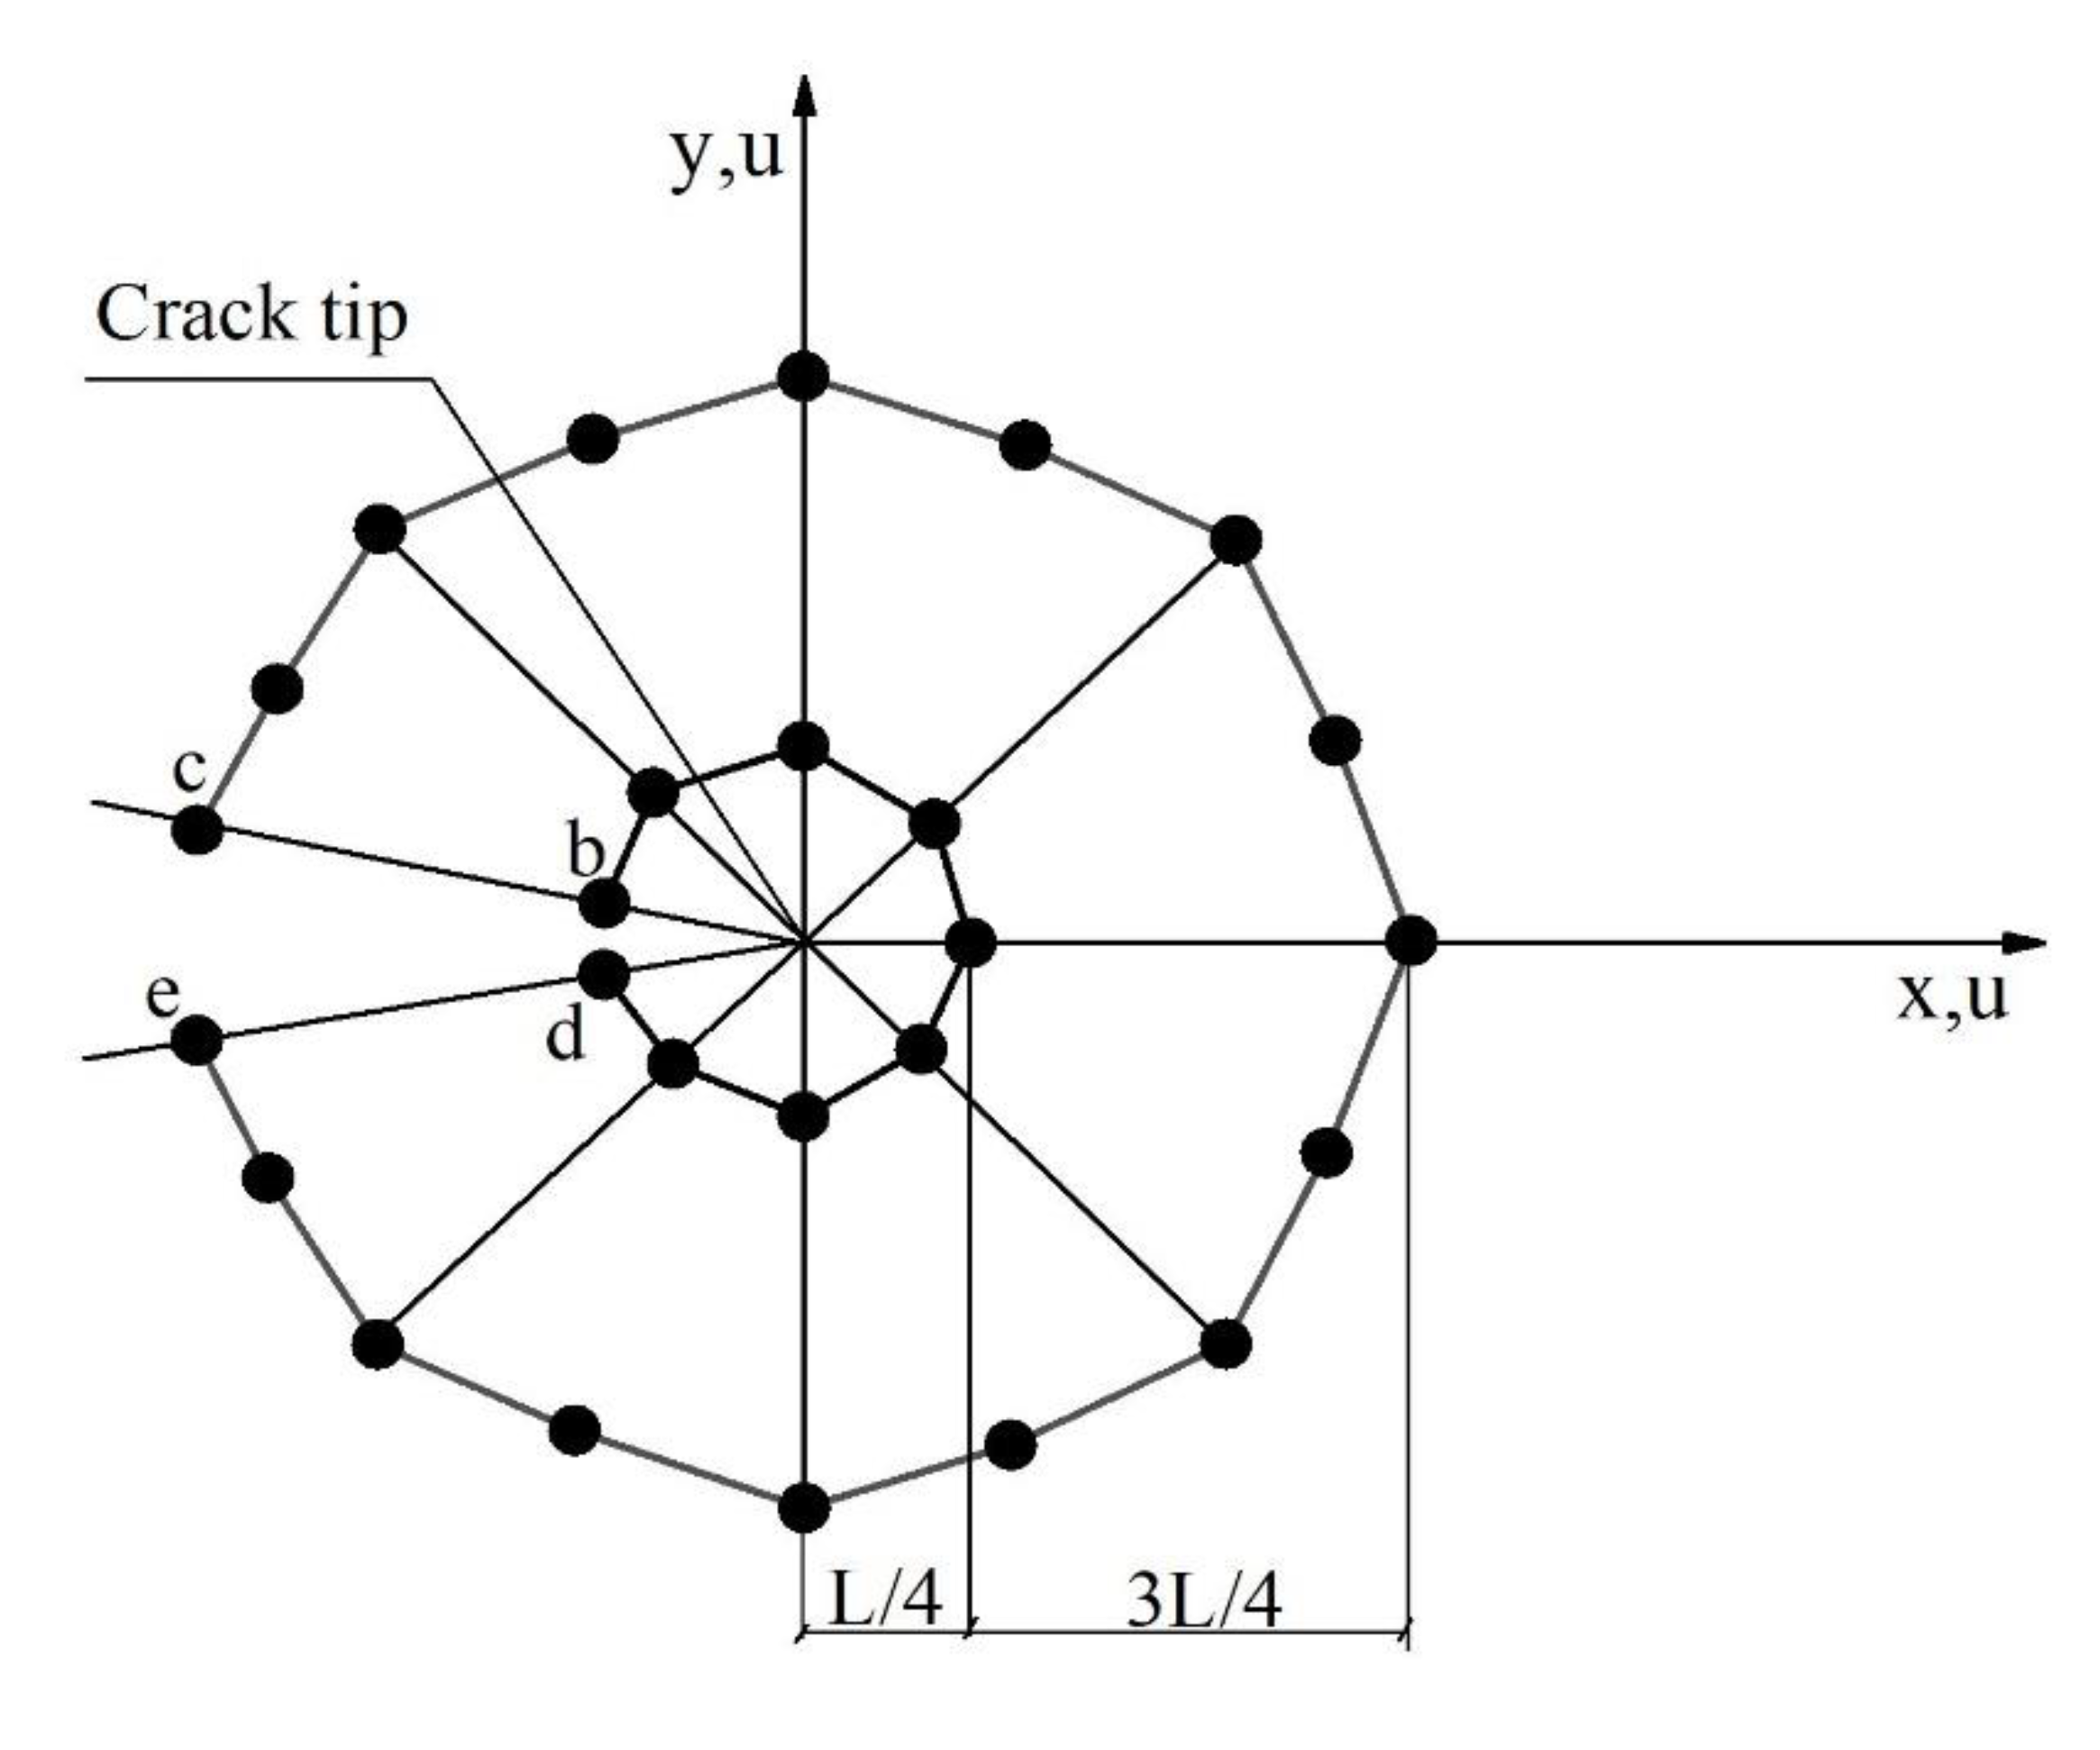
where: k = 3−4 ν for plane strain and k = (3 − ν)/(1 + ν) for plane stress, L represents the length of the element side linked tip of the crack, ui and vi (i = b, c, d, and e) denote the nodal displacements at nodes b, c, d, and e in the x and y directions, respectively (as represented in Figure 4).
To get an enhanced estimation of the field close to the tip of the crack, Barsoum (1977) has proposed distinctive quarter-point finite elements, where the mid-side node of the crack tip element shifts to a quarter of the element’s length.

3.4. Three Points Bend Geometry

The rectangular plate geometry, as illustrated in Figure 1, was considered for the analysis of the 2-dimensional finite element. For the present study, the properties of Fe-based amorphous materials were taken as E = 230 GPa, v = 0.3, and KIC = 1297 N/mm3/2, where E, ν, and KIC stand for Young’s modulus, Poisson’s ratio, and fracture toughness, respectively.
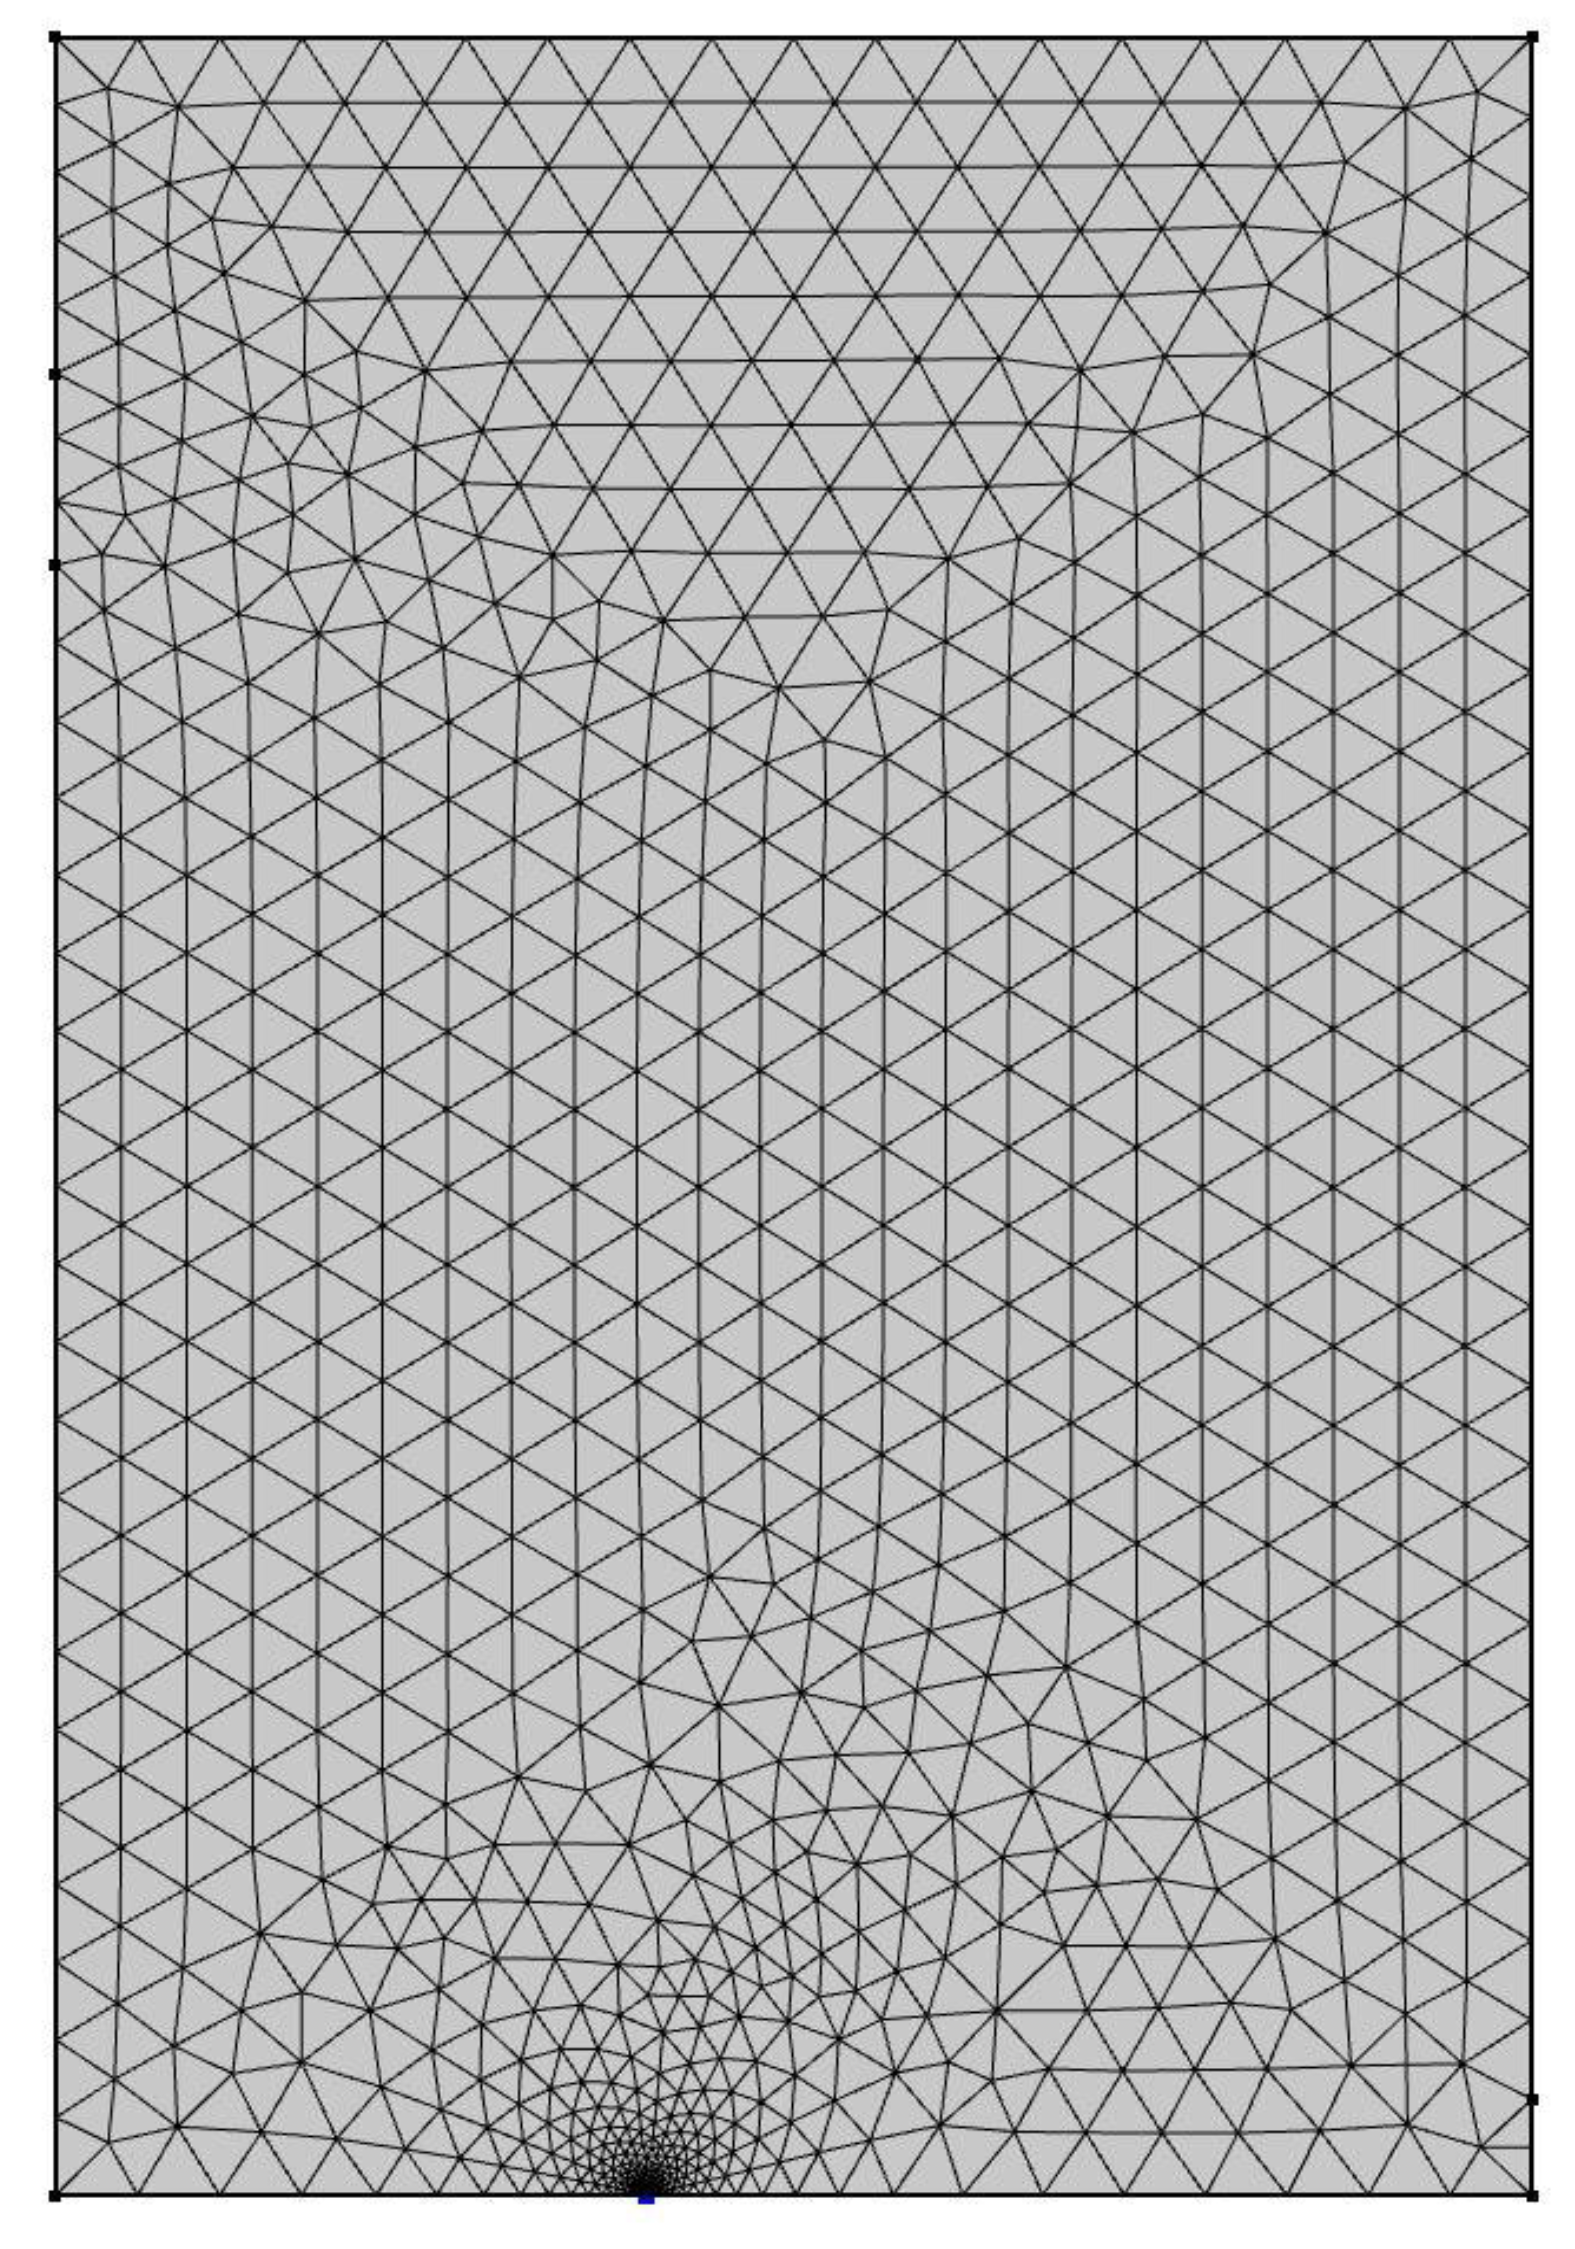
The broken plate is forced to submit under a constant load (P). The problem is modeled using the FE standard code COMSOL. To accomplish the cracked plate’s mesh generation, the element type ‘SIZE’ of COMSOL code is employed. This is a two-dimensional higher-order 8-node element with two degrees of freedom on each node (translations in the nodal x and y directions). At the crack tip areas, quadratic displacement behavior and the ability to form a triangular-shaped element are needed. Considering the singular character of the field of stress in the area around the crack, the singular elements are taken into consideration at each field of the tip of the crack, modeled with a fresh mesh. Figure 5 provides an illustration of a characteristic F model of a cracked plate.
The singular field adjacent to the tip of the crack is modeled using distinctive Barsoum-proposed special quarter-point singular elements. This mesh will be useful when calculating the stress intensity factors KI and KII by employing the displacement extrapolation technique applied in COMSOL software. Regarding this problem, the analytical stress factor is given in Equation (10) below (Ewalds and Wanhill 1989):
K I = F σ π a  
where F is the correction factor given by
F = 1.12 0.231 a w + 10.55 a w 2 21.72 a w 3 + 30.39 a w 4   w i t h   a w 0.6  
where F, also known as the geometry factor, denotes how a fracture system is shaped in response to the applied stress. The new crack tip stress field is affected by the shape of the cracked body, changing the value of the stress intensity factor. In general, the correction factor becomes a function of (a/w) if the edge fracture is located in a strip of finite width, w [47].
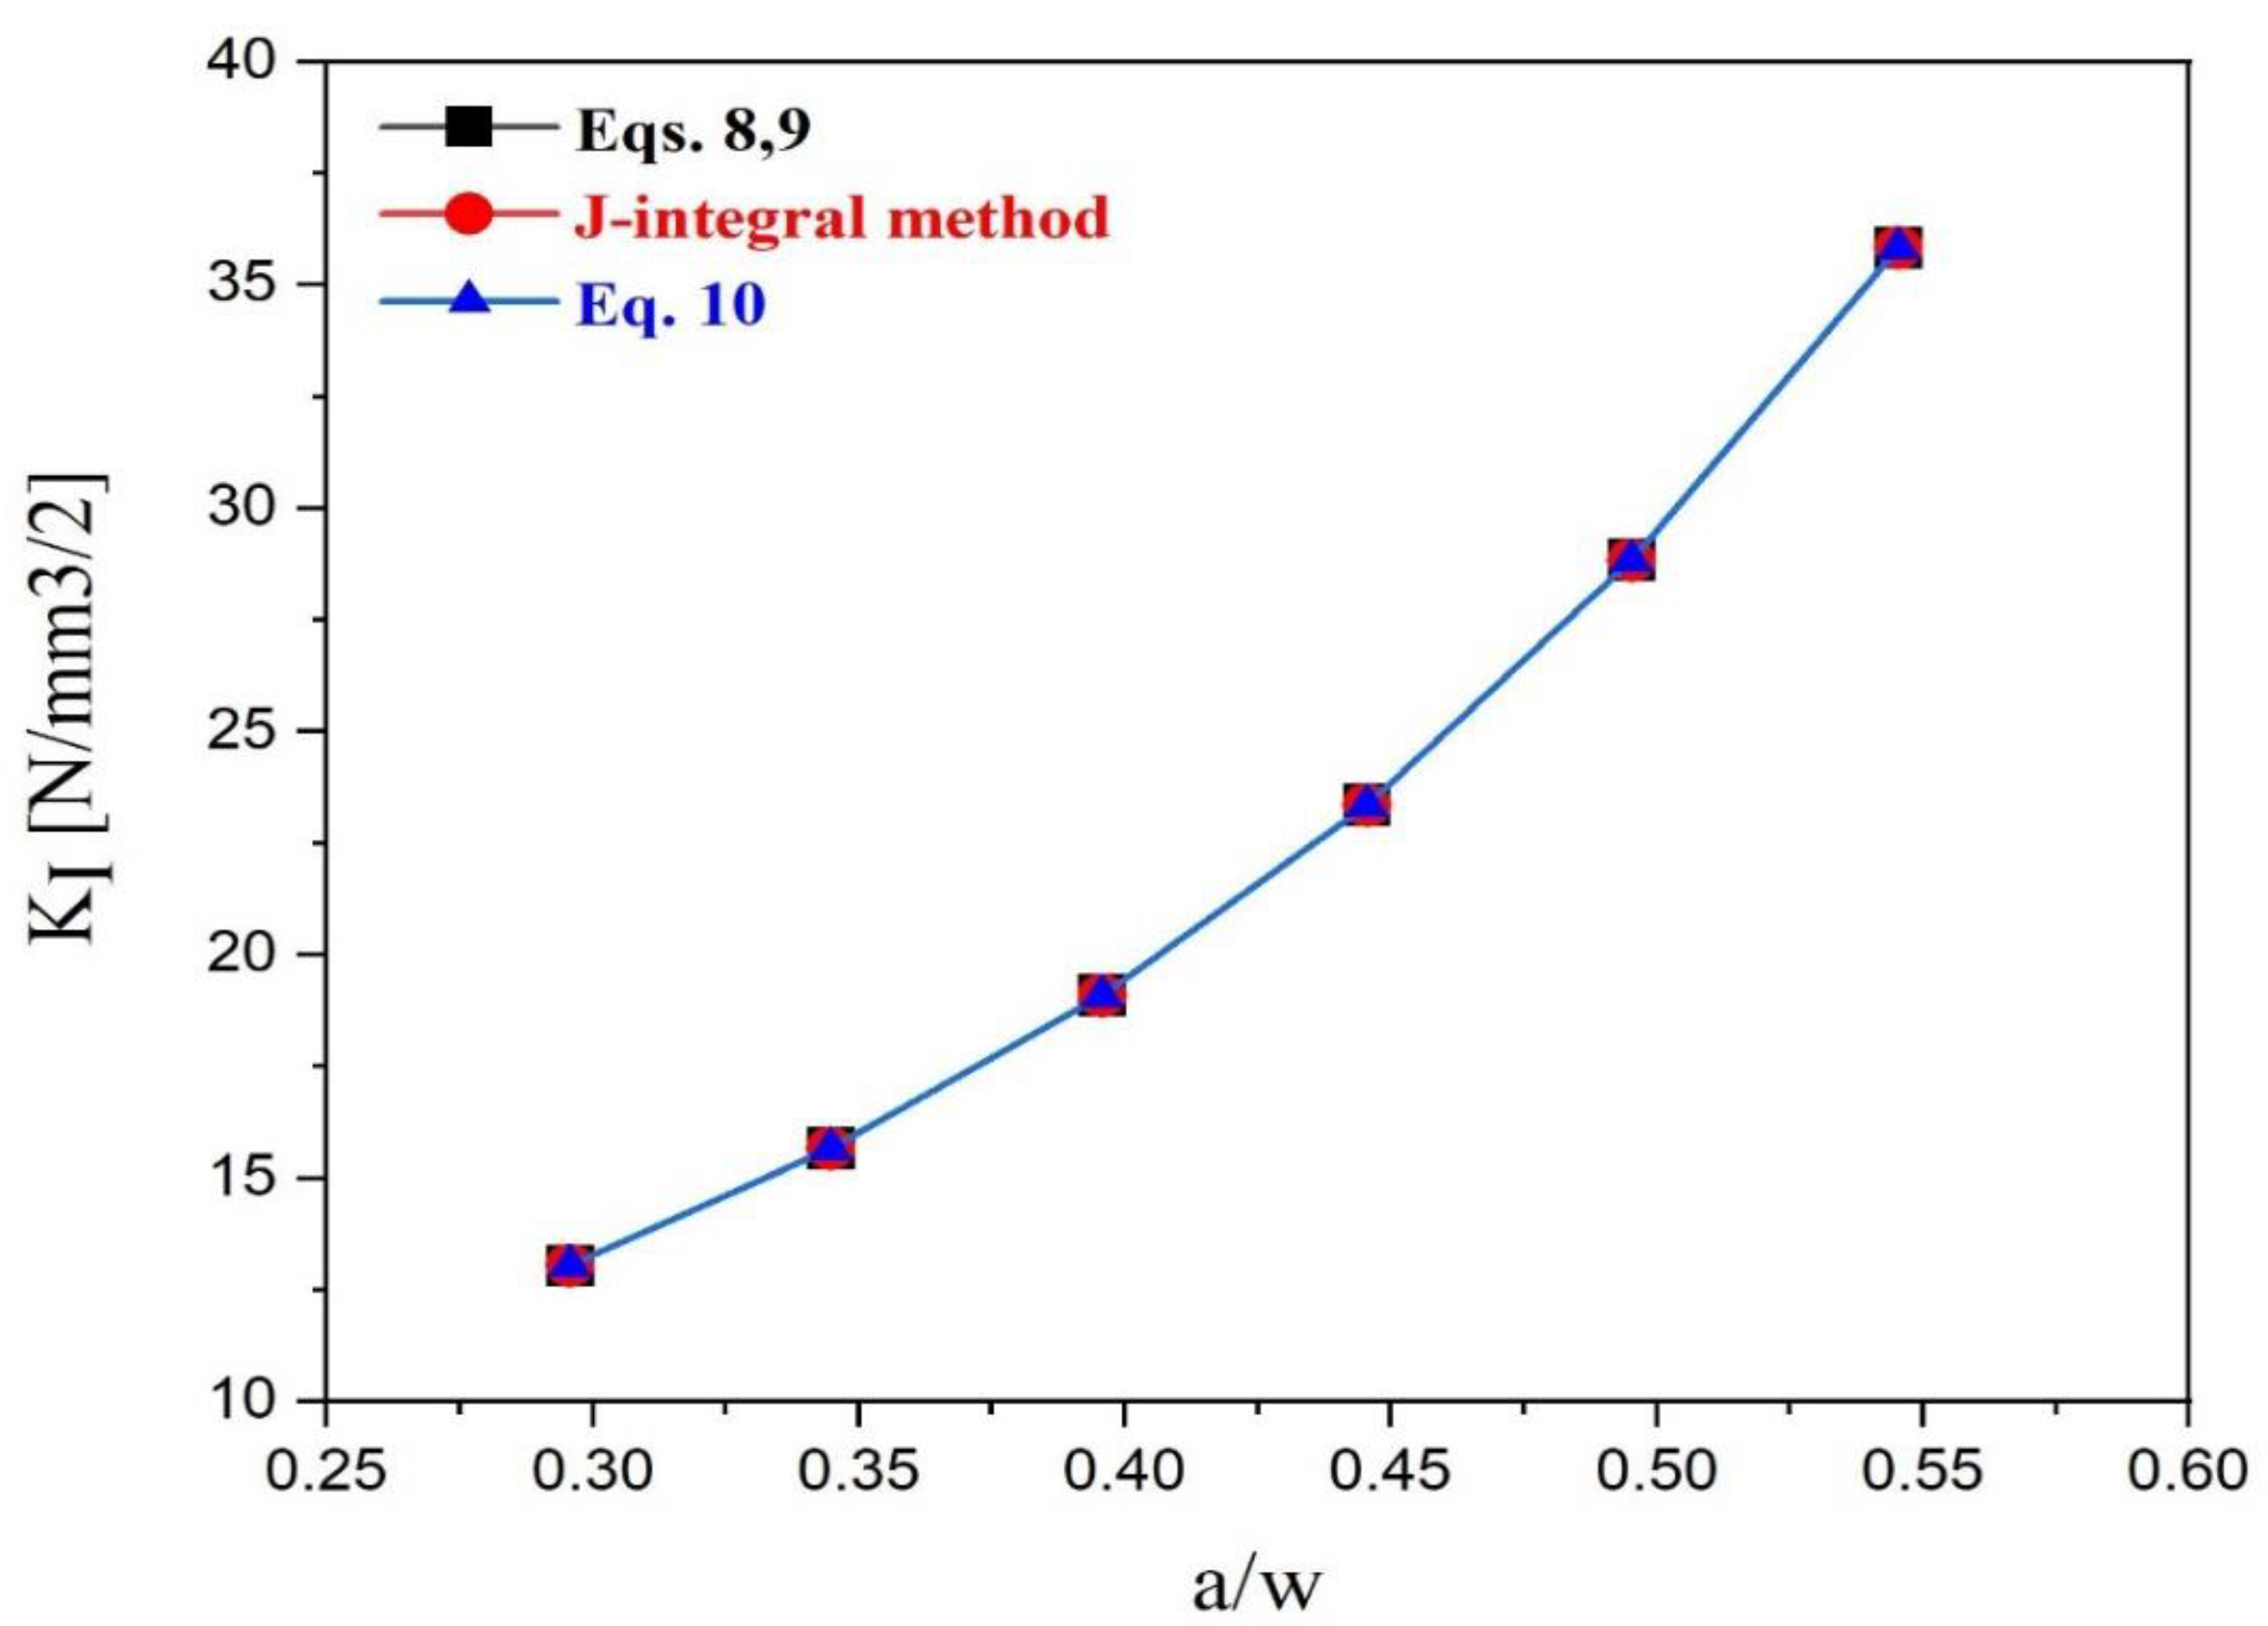
Once the stress intensity factor values are computed using the displacement extrapolation technique (Equations (8) and (9)) under plane stress conditions, the J-integral method (Rice, 1968) is used for comparing them with the numerical results and the solutions from the analysis (Equation (10)), as can be seen in Figure 6.
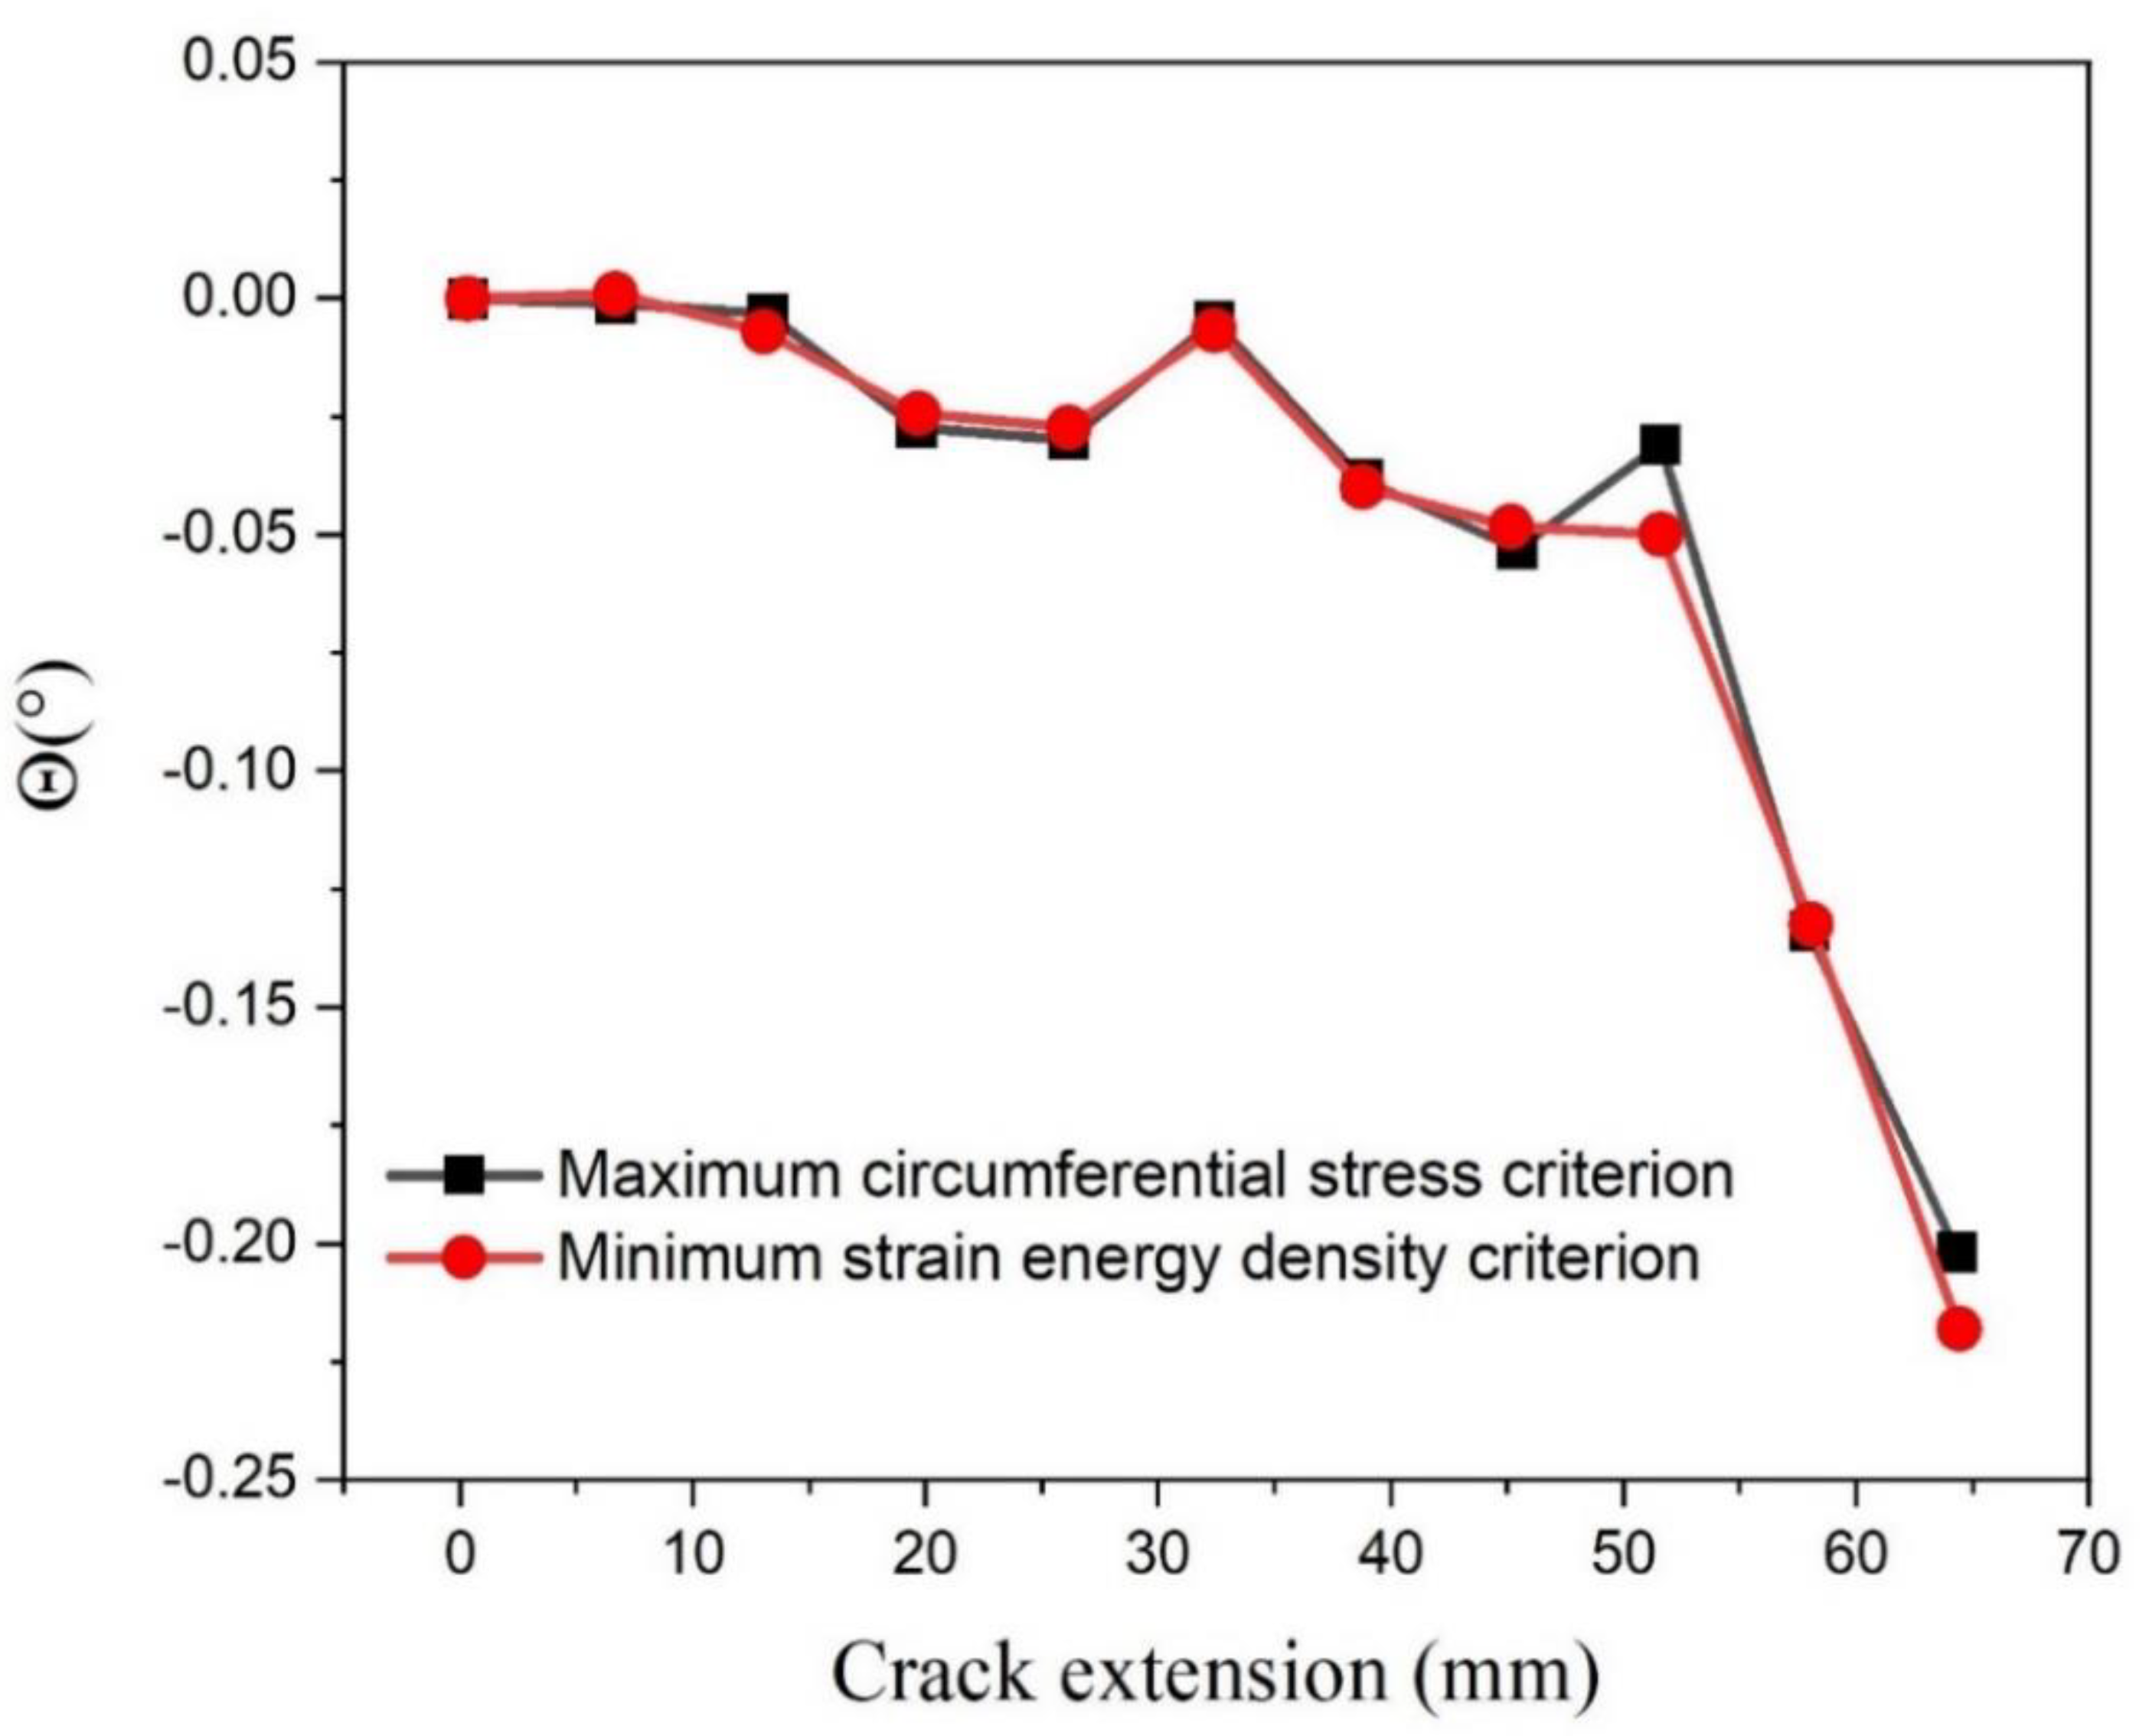
From the comparison, a good correlation between the three computations can be noted. These results make it possible to conclude that the used numerical model delivers a correct description of the deformation and stress area near the tip of the crack under pure mode 1 conditions. Estimating the stress intensity factors based on the extrapolation techniques makes it possible to determine the MCS criterion’s kinking angle using Equation (2). Resolving Equation (3) can also make it possible to determine this angle. Figure 7 provides an illustration of the differences between the estimated angles at each crack length increment. An excellent correspondence exists between the results attained through the use of these approaches. In the example above, there is a variance in the kinking angle θ between 0 and −0.25°. This means that the propagation of the crack occurs together with the opening mode (mode 1), as illustrated in Figure 8.
Figure 8 presents the last step of crack propagation attained using the MSED and MCS criteria. As anticipated, the propagation of the crack occurs horizontally, based on the mode I loading. The route of propagation is extremely consistent, and the concentric mesh sustains excellent precision at the crack’s tip. It’s somewhat a little bit different from the trajectory of the crack in Figure 3 because of that the COMSOL software gives the affected area. From the acquired results, it becomes possible to determine that using both benchmarks delivers an excellent way of determining the crack propagation pathway under mode 1 loading. An agreement can be noted between the final configuration and the last single edge’s evaluated crack plate employed by Alshoaibi and Ariffin (2006). Once outcomes were obtained from Alshoaibi and Ariffin (2006) employing the adaptive mesh structure, they were matched to those attained from FE software COMSOL, employing the MCS criterion.
The development of stress intensity factors KI and KII during the steps for stress propagation attained using the MSED criterion and MCS criterion is presented in Figure 9. From the curves plotted, an excellent agreement between these two approaches can be noted.
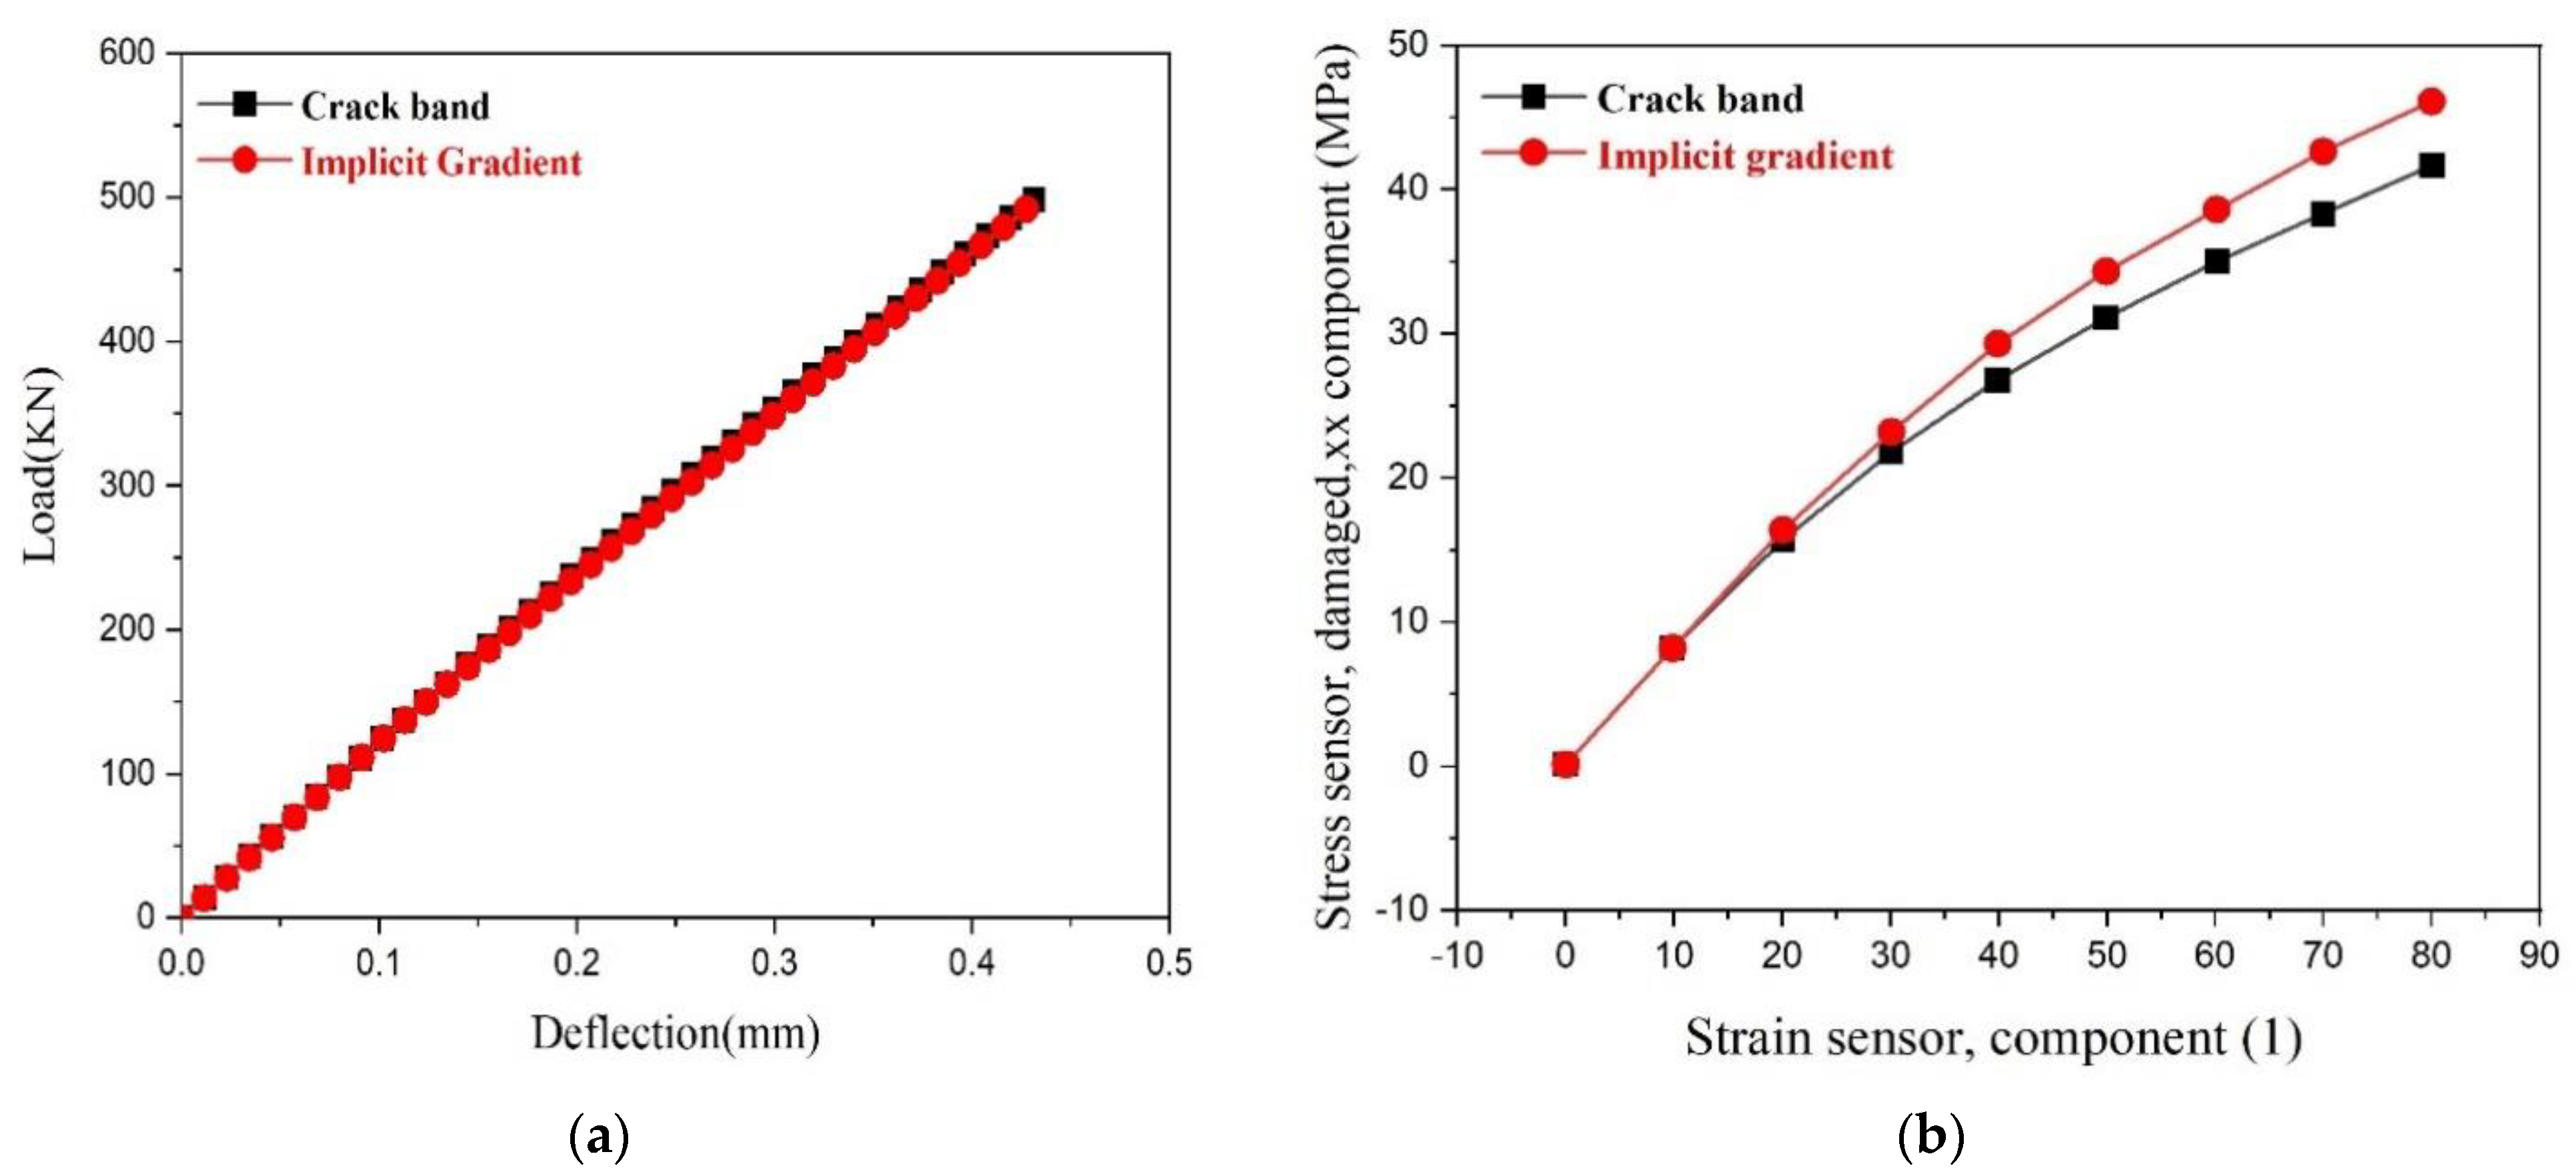
Figure 10a presents a comparison of MCSD and MSED criteria crack trajectories based on the crack band and implicit gradient methods. The overall trajectories are the same. Figure 10b provides an illustration of the differences in the stress-strain sensor, showing that the implicit gradient curve is more damaged in comparison to the crack band due to the initial crack’s angle θ. The variance in the initial load step could be attributed to crucial variances in the last crack trajectory, for example, with the loading of geometry that is more complex. Bouchard et al. (2003) and Bouchard (2000) have illustrated that for applications that are complicated, like the double-edge cracked plate with double holes, the results from the MCS local benchmark are more accurate in comparison to those from the MSED energy criterion. The former also has the advantage that it can be employed for materials that are elastic-plastic (Bocca et al., 1991; Baouch, 1998; Lebaillif and Recho, 2007).

3.5. Elastic Tangential Stress around the Crack Tip

According to Williams (1967), the elastic stresses surrounding the tip of the crack are presented as an infinite series expansion. The equations of the tip of the crack’s vicinity, after considering the initial three terms of mode I and mode II in the series expansion, can be as follows:
σ θ θ = 3 4 K I 2 π r c o s θ 2 + 1 3 c o s 3 θ 2 3 4 K I I 2 π r s i n θ 2 + s i n 3 θ 2 + T s i n 2 θ + 15 4 r 0.5   A 3 c o s θ 2 1 5 c o s 5 θ 2 + 15 4 r 0.5 B 3 s i n θ 2 s i n 5 θ 2 + O r
where r and θ denote the conventional crack tip coordinates. KΙ and KΙΙ represent the mode I and mode II stress intensity factors, correspondingly, and their matching terms are known as the singular stress terms. In Equation (12), T is a non-singular and constant stress term known as the T-stress. A3 and B3 are the third-order crack parameters. Generally, crack parameters 3 KT A, Ι (the mode I parameters) and 3 KB, ΙΙ (the mode II parameters) depend on the cracked specimen’s loading and geometry conditions. For each cracked configuration, K, Ι, ΙΙ, and T can readily be computed by the majority of fine element codes available commercially. Nonetheless, there is a need for an independent numerical method to determine the third-order crack parameters A3 and B3. Ayatollahi and Nejati [48,49] suggested FEOD technique is numerical and useful when determining the higher-order crack parameters and also K, Ι ΙΙ, and T. The same technique also provides a way of computing both the stress intensity and the higher-order terms’ coefficients through the use of the displacement field attained from finite element analysis. Regarding this technique, for a huge quantity of nodes around the tip of the crack, an over-determined set of simultaneous linear equations is obtained. Following this, through the use of the basic ideas in the least-squares method, Williams’s expansion coefficients can be computed with high precision for pure mode I, pure mode II, and mixed-mode I/II conditions. Regarding the present study, the SCB and BD specimen’s crack parameters are computed using the FEOD technique.
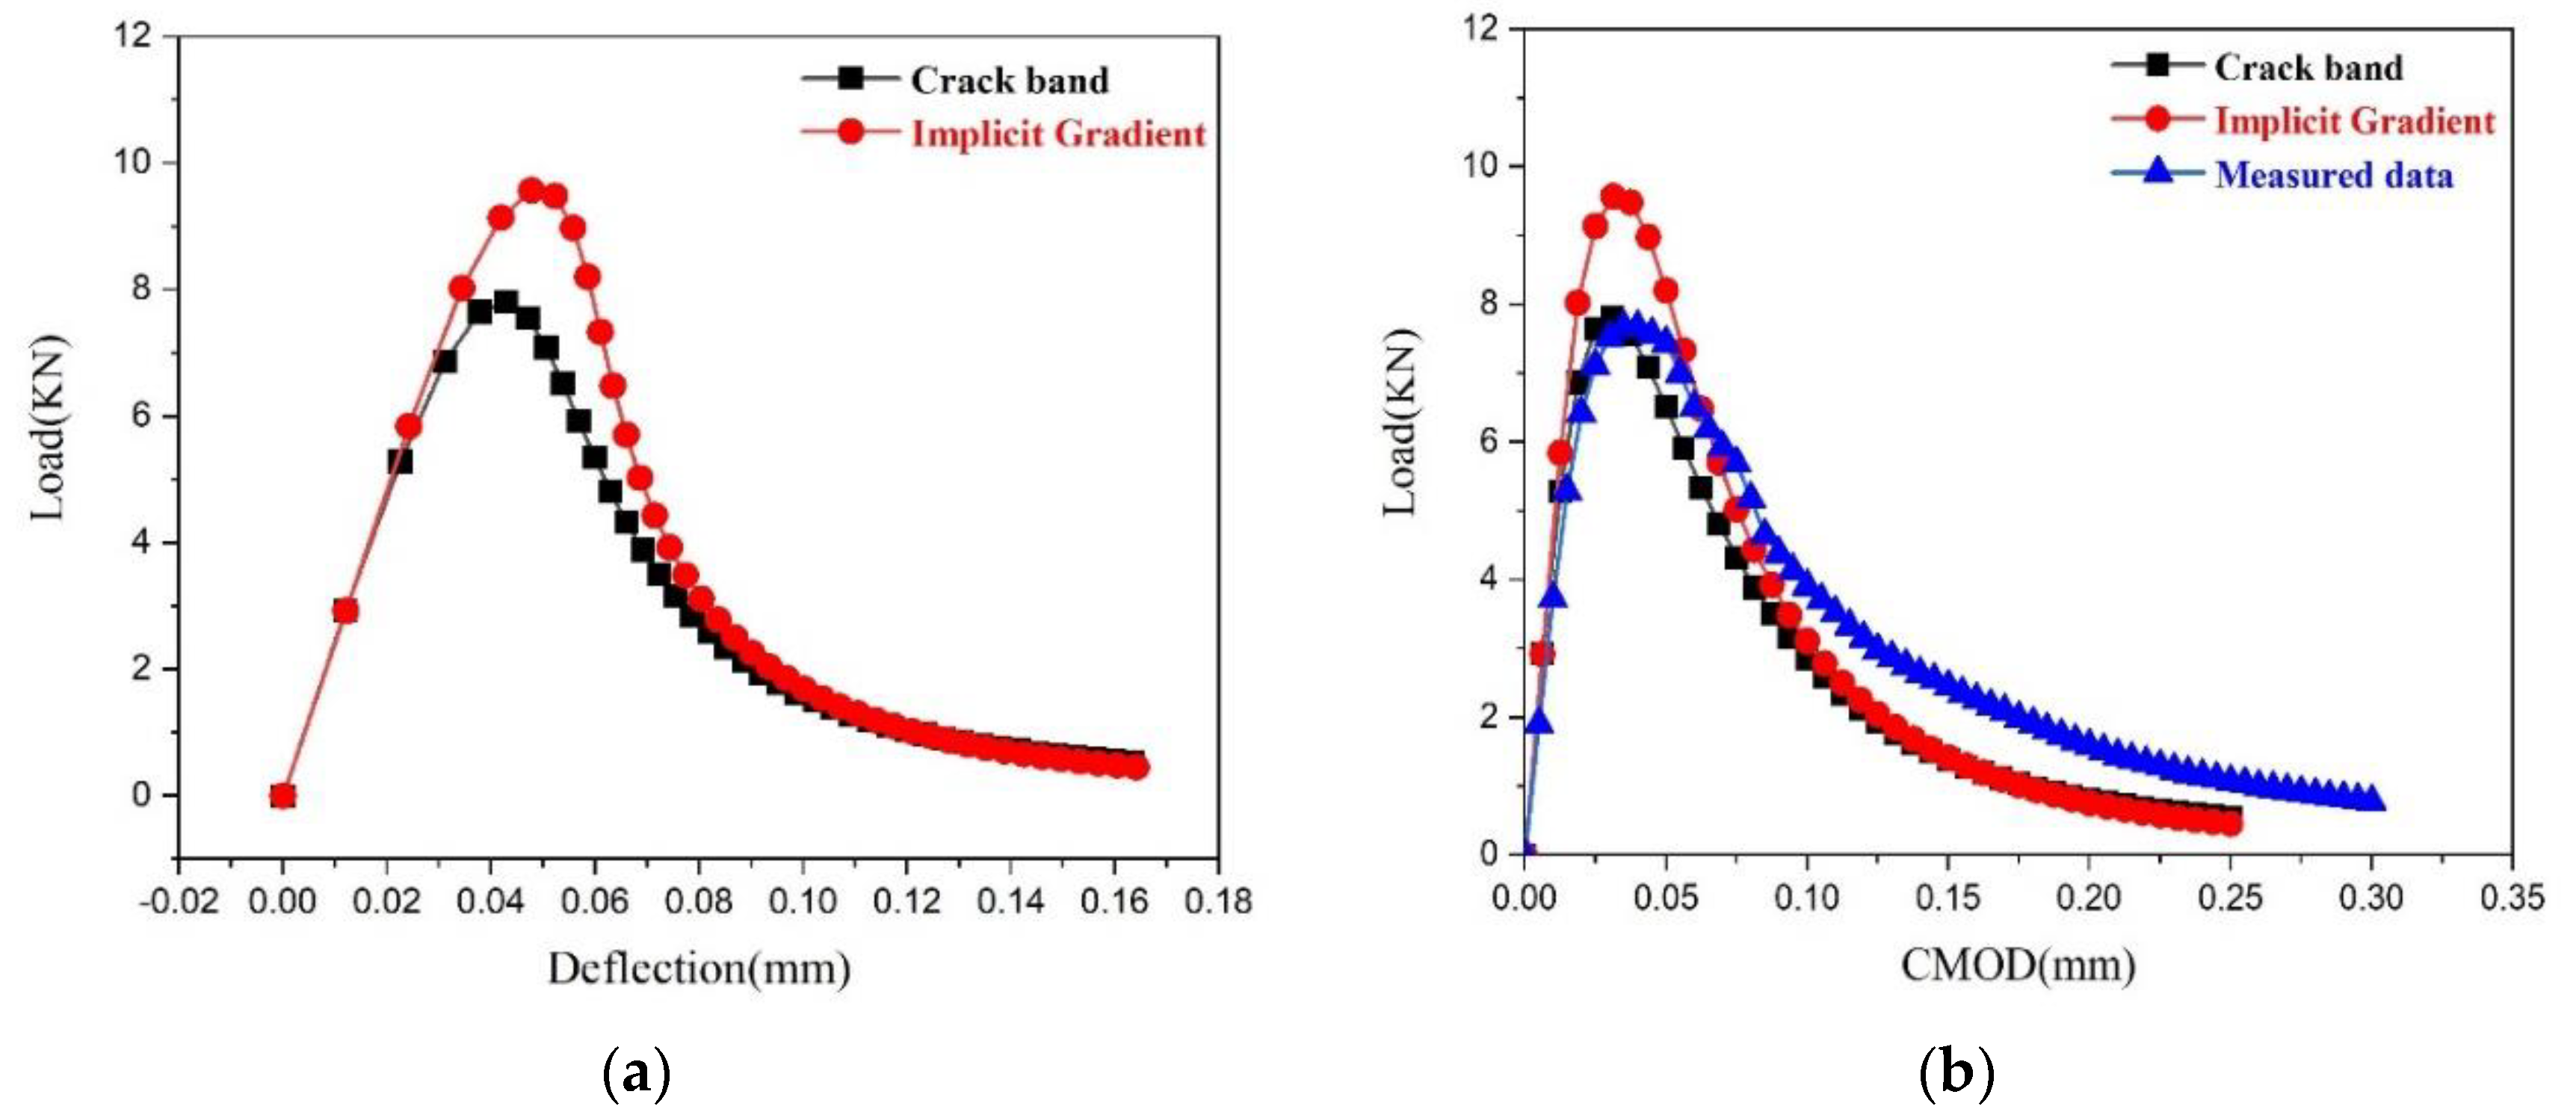
Single-edge notched beam (SENB) testing was used to measure the toughness of the mild steel and Fe-based samples. This was followed by plotting a curve of the matching load-displacement curves, as represented in Figure 11a. It is apparent that as the fraction of the implicit gradient increases, the flexural load also increases, indicating boosted fracture toughness. The fact that when compared to a crack band, the curve narrows implies that the crack extension was happening rapidly. In this case, the mild steel and Fe-based fracture toughness is evaluated using the nonlinear-elastic fracture mechanics technique, where the J-based crack extension resistance (JR) represents a function of the crack extension (Δa). Precisely, the J-integral at each measured crack length (a) could be articulated as in Equation (13) [50].
J = 1.9 A t o t B b  
where Atot is the aggregate area under the standard force-displacement curve, comprising the plastic and elastic contributing to the fracture.
As can be seen in Figure 11b, the predicted crack band values and results from the experiments indicate a good agreement with regard to peak load and load versus CMOD curve, confirming that the proposed model is effective, even though this is to the contrary in implicit gradient.

4. Conclusions

In this paper, two criteria and paths for crack growth were compared for different applications employing the strain energy density and maximum circumference stress benchmarks. Regarding each example, Barsoum (1977) proposed quarter-point finite elements are employed to attain the estimation of the area adjacent to the crack’s tip. Under mixed-mode loading and mode I, the stress intensity factors were determined using the finite element technique. The numerical calculations attained using the finite element technique show that this method can properly define the deformations and stress field to the tip of the crack. The insights above can help one to conclude that the two criteria deliver good results in relation to the propagation of the crack path, and between the two criteria, the results are noted to be close. A combination of finite element simulation and experiments indicates that large thermal stress located near pores triggers micro-cracks. This is a problem that could be resolved by introducing ductile phases with low yield stress and high toughness, which consume thermal stress, use a lot of energy, and hamper the beginning of micro-cracks during the SLM process.

Author Contributions

Conceptualization, H.A.-A.; methodology, H.A.-A.; software, H.A.-A.; validation, H.F. and M.A.-B.; formal analysis, H.A.-A.; investigation, H.A.-A.; resources, H.A.-A.; data curation, M.A.-B.; writing—original draft preparation, H.A.-A.; writing—review and editing, M.A.-B.; visualization, H.A.-A.; supervision, H.F.; project administration, H.F.; funding acquisition, H.F. All authors have read and agreed to the published version of the manuscript.

Funding

This work is supported by the National Defense Science Foundation (32102060303), the National Nature Science Foundation (51672220), the SKLSP Project (2019-TZ-04) of China, and the Fundamental Research Funds for the Central Universities of NPU (3102019GHXM002). Here we also express appreciation for the Analytical & Testing Center of Northwestern Polytechnical University.

Data Availability Statement

The code is available under the National Nature Science Foundation (51672220), the SKLSP Project (2019-TZ-04) of China, and the Fundamental Research Funds for the Central Universities of NPU (3102019GHXM002).

Conflicts of Interest

The authors declare no conflict of interest.

References

  1. Inoue, A.; Kong, F.L.; Man, Q.K.; Shen, B.L.; Li, R.W.; Al-Marzouki, F. Development and applications of Fe-and Co-based bulk glassy alloys and their prospects. J. Alloys Compd. 2014, 615, S2–S8. [Google Scholar] [CrossRef]
  2. Wang, W.H. The elastic properties, elastic models and elastic perspectives of metallic glasses. Prog. Mater. Sci. 2012, 57, 487–656. [Google Scholar] [CrossRef]
  3. Trexler, M.M.; Thadhani, N.N. Mechanical properties of bulk metallic glasses. Prog. Mater. Sci. 2010, 55, 759–839. [Google Scholar] [CrossRef]
  4. Inoue, A.; Kong, F.L.; Zhu, S.L.; Shalaan, E.; Al-Marzouki, F.M. Production methods and properties of engineering glassy alloys and composites. Intermet 2015, 58, 20–30. [Google Scholar] [CrossRef]
  5. Joshi, S.S.; Katakam, S.; Singh Arora, H.; Mukherjee, S.; Dahotre, N.B. Amorphous coatings and surfaces on structural materials. Crit. Rev. Solid State Mater. Sci. 2016, 41, 1–46. [Google Scholar] [CrossRef]
  6. Blink, J.; Farmer, J.; Choi, J.; Saw, C. Applications in the nuclear industry for thermal spray amorphous metal and ceramic coatings. Metall. Mater. Trans. A 2009, 40, 1344–1354. [Google Scholar] [CrossRef] [Green Version]
  7. Luding, R.; Thorpe, R. Electric arc spray coatings increase cost and reliability of power generation systems. Adv. Mater. Process. 2013, 171, 46–48. [Google Scholar]
  8. Cheng, J.B.; Liang, X.B.; Chen, Y.X.; Wang, Z.H.; Xu, B.S. High-temperature erosion resistance of FeBSiNb amorphous coatings deposited by arc spraying for boiler applications. J. Therm. Spray Technol. 2013, 22, 820–827. [Google Scholar] [CrossRef]
  9. Xu, P.; Zhang, C.; Wang, W.; Liu, L. Pitting mechanism in a stainless steel-reinforced Fe-based amorphous coating. Electrochim. Acta 2016, 206, 61–69. [Google Scholar] [CrossRef]
  10. Kozieł, T.; Zielińska-Lipiec, A.; Latuch, J.; Kąc, S. Microstructure and properties of the in situ formed amorphous-crystalline composites in the Fe–Cu-based immiscible alloys. J. Alloys Compd. 2011, 509, 4891–4895. [Google Scholar] [CrossRef]
  11. Suryanarayana, C.; Inoue, A. Iron-based bulk metallic glasses. Int. Mater. Rev. 2013, 58, 131–166. [Google Scholar] [CrossRef]
  12. Lu, Z.P.; Liu, C.T.; Thompson, J.R.; Porter, W.D. Structural amorphous steels. Phys. Rev. Lett. 2004, 92, 245503. [Google Scholar] [CrossRef] [PubMed]
  13. Li, X.; Kato, H.; Yubuta, K.; Makino, A.; Inoue, A. Improved plasticity of iron-based high-strength bulk metallic glasses by copper-induced nanocrystallization. J. Non. Cryst. Solids 2011, 357, 3002–3005. [Google Scholar] [CrossRef]
  14. Qiu, K.Q.; Pang, J.; Ren, Y.L.; Zhang, H.B.; Ma, C.L.; Zhang, T. Fe-based bulk metallic glasses with a larger supercooled liquid region and high ductility. Mater. Sci. Eng. A 2008, 498, 464–467. [Google Scholar] [CrossRef]
  15. Lewandowski, J.J.; Gu, X.J.; Shamimi Nouri, A.; Poon, S.J.; Shiflet, G.J. Tough Fe-based bulk metallic glasses. Appl. Phys. Lett. 2008, 92, 091918. [Google Scholar] [CrossRef] [Green Version]
  16. Yao, K.F.; Zhang, C.Q. Fe-based bulk metallic glass with high plasticity. Appl. Phys. Lett. 2007, 90, 061901. [Google Scholar] [CrossRef]
  17. Guo, S.F.; Liu, L.; Li, N.; Li, Y. Fe-based bulk metallic glass matrix composite with large plasticity. Scr. Mater. 2010, 62, 329–332. [Google Scholar] [CrossRef]
  18. Keryvin, V.; Vu, X.D.; Hoang, V.H.; Shen, J. On the deformation morphology of bulk metallic glasses underneath a Vickers indentation. J. Alloy Compd. 2010, 504, S41–S44. [Google Scholar] [CrossRef] [Green Version]
  19. Keryvin, V.; Hoang, V.H.; Shen, J. Hardness, toughness, brittleness and cracking systems in an iron-based bulk metallic glass by indentation. Intermet 2009, 17, 211–217. [Google Scholar] [CrossRef]
  20. Hess, P.A.; Poon, S.J.; Shiflet, G.J.; Dauskardt, R.H. Indentation fracture toughness of amorphous steel. J. Mater. Res. 2005, 20, 783–786. [Google Scholar] [CrossRef]
  21. Guo, S.F.; Chan, K.C.; Liu, L. Notch toughness of Fe-based bulk metallic glass and composites. J. Alloy. Compd. 2011, 509, 9441–9446. [Google Scholar] [CrossRef]
  22. Shamimi Nouri, A.; Gu, X.J.; Poon, S.J.; Shiflet, G.J.; Lewandowski, J.J. Chemistry (intrinsic) and inclusion (extrinsic) effects on the toughness and Weibull modulus of Fe-based bulk metallic glasses. Philos. Mag. Lett. 2008, 88, 853–861. [Google Scholar] [CrossRef]
  23. Kawashima, A.; Kurishita, H.; Kimura, H.; Zhang, T.; Inoue, A. Fracture toughness of Zr55Al10Ni5Cu30 bulk metallic glass by 3-point bend testing. Mater. Trans. 2005, 46, 1725–1732. [Google Scholar] [CrossRef] [Green Version]
  24. Chen, W.; Ketkaew, J.; Liu, Z.; Mota, R.M.O.; O’Brien, K.; da Silva, C.S.; Schroers, J. Does the fracture toughness of bulk metallic glasses scatter? Scr. Mater. 2015, 107, 1–4. [Google Scholar] [CrossRef] [Green Version]
  25. Phan, T.Q.; Kelly, J.P.; Kassner, M.E.; Eliasson, V.; Graeve, O.A.; Hodge, A.M. Bulk mechanical properties testing of metallic marginal glass formers. J. Metall. 2016, 2016, 8. [Google Scholar] [CrossRef] [Green Version]
  26. Anderson, T.L. Fracture Mechanics: Fundamentals and Applications; CRC: Boca Raton, FL, USA, 2017; ISBN 1498728146. [Google Scholar]
  27. Gao, D.Y. Nonconvex semi-linear problems and canonical duality solutions. In Advances in Mechanics and Mathematics; Springer: Berlin/Heidelberg, Germany, 2003; pp. 261–312. [Google Scholar]
  28. Kolednik, O.; Predan, J.; Fischer, F.D.; Fratzl, P. Improvements of strength and fracture resistance by spatial material property variations. Acta Mater. 2014, 68, 279–294. [Google Scholar] [CrossRef]
  29. Kolednik, O.; Predan, J.; Gubeljak, N.; Fischer, D.F. Modeling fatigue crack growth in a bimaterial specimen with the configurational forces concept. Mater. Sci. Eng. A 2009, 519, 172–183. [Google Scholar] [CrossRef]
  30. Sistaninia, M.; Kolednik, O. Effect of a single soft interlayer on the crack driving force. Eng. Fract. Mech. 2014, 130, 21–41. [Google Scholar] [CrossRef]
  31. Xia, Z.; Curtin, W.A.; Sheldon, B.W. A new method to evaluate the fracture toughness of thin films. Acta Mater. 2004, 52, 3507–3517. [Google Scholar] [CrossRef]
  32. Khan, K.; Al-Shayea, N.A. Effect of specimen geometry and testing method on mixed mode I–II fracture toughness of a limestone rock from Saudi Arabia. Rock Mech. rock Eng. 2000, 33, 179–206. [Google Scholar] [CrossRef]
  33. Aliha, M.R.M.; Ayatollahi, M.R.; Smith, D.J.; Pavier, M.J. Geometry and size effects on fracture trajectory in a limestone rock under mixed mode loading. Eng. Fract. Mech. 2010, 77, 2200–2212. [Google Scholar] [CrossRef]
  34. Aliha, M.R.M.; Ashtari, R.; Ayatollahi, M.R. Mode I and mode II fracture toughness testing for a coarse grain marble. In Proceedings of the Applied Mechanics and Materials; Trans Tech: Wollerau, Switzerland, 2006; Volume 5, pp. 181–188. [Google Scholar]
  35. Aliha, M.R.M.; Ayatollahi, M.R. On mixed-mode I/II crack growth in dental resin materials. Scr. Mater. 2008, 59, 258–261. [Google Scholar] [CrossRef]
  36. Al-Shayea, N. Comparing reservoir and outcrop specimens for mixed mode I–II fracture toughness of a limestone rock formation at various conditions. Rock Mech. Rock Eng. 2002, 35, 271–297. [Google Scholar] [CrossRef]
  37. Chang, S.-H.; Lee, C.-I.; Jeon, S. Measurement of rock fracture toughness under modes I and II and mixed-mode conditions by using disc-type specimens. Eng. Geol. 2002, 66, 79–97. [Google Scholar] [CrossRef]
  38. Lanaro, F.; Sato, T.; Stephansson, O. Microcrack modelling of Brazilian tensile tests with the boundary element method. Int. J. Rock Mech. Min. Sci. 2009, 46, 450–461. [Google Scholar] [CrossRef]
  39. Ke, C.-C.; Chen, C.-S.; Tu, C.-H. Determination of fracture toughness of anisotropic rocks by boundary element method. Rock Mech. Rock Eng. 2008, 41, 509–538. [Google Scholar] [CrossRef]
  40. Ayatollahi, M.R.; Aliha, M.R.M.; Hassani, M.M. Mixed mode brittle fracture in PMMA—an experimental study using SCB specimens. Mater. Sci. Eng. A 2006, 417, 348–356. [Google Scholar] [CrossRef]
  41. Kelly, J.P.; Fuller, S.M.; Seo, K.; Novitskaya, E.; Eliasson, V.; Hodge, A.M.; Graeve, O.A. Designing in situ and ex situ bulk metallic glass composites via spark plasma sintering in the super cooled liquid state. Mater. Des. 2016, 93, 26–38. [Google Scholar] [CrossRef] [Green Version]
  42. Graeve, O.A.; Saterlie, M.S.; Kanakala, R.; De La Torre, S.D.; Farmer, J.C. The kinetics of devitrification of amorphous alloys: The time–temperature–crystallinity diagram describing the spark plasma sintering of Fe-based metallic glasses. Scr. Mater. 2013, 69, 143–148. [Google Scholar] [CrossRef]
  43. Graeve, O.A.; Kanakala, R.; Kaufman, L.; Sinha, K.; Wang, E.; Pearson, B.; Rojas-George, G.; Farmer, J.C. Spark plasma sintering of Fe-based structural amorphous metals (SAM) with Y2O3 nanoparticle additions. Mater. Lett. 2008, 62, 2988–2991. [Google Scholar] [CrossRef]
  44. Zhang, J.; Liu, M.; Song, J.; Deng, C.; Deng, C. Microstructure and corrosion behavior of Fe-based amorphous coating prepared by HVOF. J. Alloy Compd. 2017, 721, 506–511. [Google Scholar] [CrossRef]
  45. Tran, V.-X.; Geniaut, S. Development and industrial applications of X-FEM axisymmetric model for fracture mechanics. Eng. Fract. Mech. 2012, 82, 135–157. [Google Scholar] [CrossRef]
  46. Zhou, M.; Yao, W.B.; Yang, X.S.; Peng, Z.B.; Li, K.K.; Dai, C.Y.; Mao, W.G.; Zhou, Y.C.; Lu, C. In-situ and real-time tests on the damage evolution and fracture of thermal barrier coatings under tension: A coupled acoustic emission and digital image correlation method. Surf. Coat. Technol. 2014, 240, 40–47. [Google Scholar] [CrossRef]
  47. Wang, C.H. Introduction to Fracture Mechanics; DSTO Aeronautical and Maritime Research Laboratory: Melbourne, Australia, 1996. [Google Scholar]
  48. Ayatollahi, M.R.; Nejati, M. An over-deterministic method for calculation of coefficients of crack tip asymptotic field from finite element analysis. Fatigue Fract. Eng. Mater. Struct. 2011, 34, 159–176. [Google Scholar] [CrossRef]
  49. Ayatollahi, M.R.; Nejati, M. Determination of NSIFs and coefficients of higher order terms for sharp notches using finite element method. Int. J. Mech. Sci. 2011, 53, 164–177. [Google Scholar] [CrossRef]
  50. Li, N.; Zhang, J.; Xing, W.; Ouyang, D.; Liu, L. 3D printing of Fe-based bulk metallic glass composites with combined high strength and fracture toughness. Mater. Des. 2018, 143, 285–296. [Google Scholar] [CrossRef]
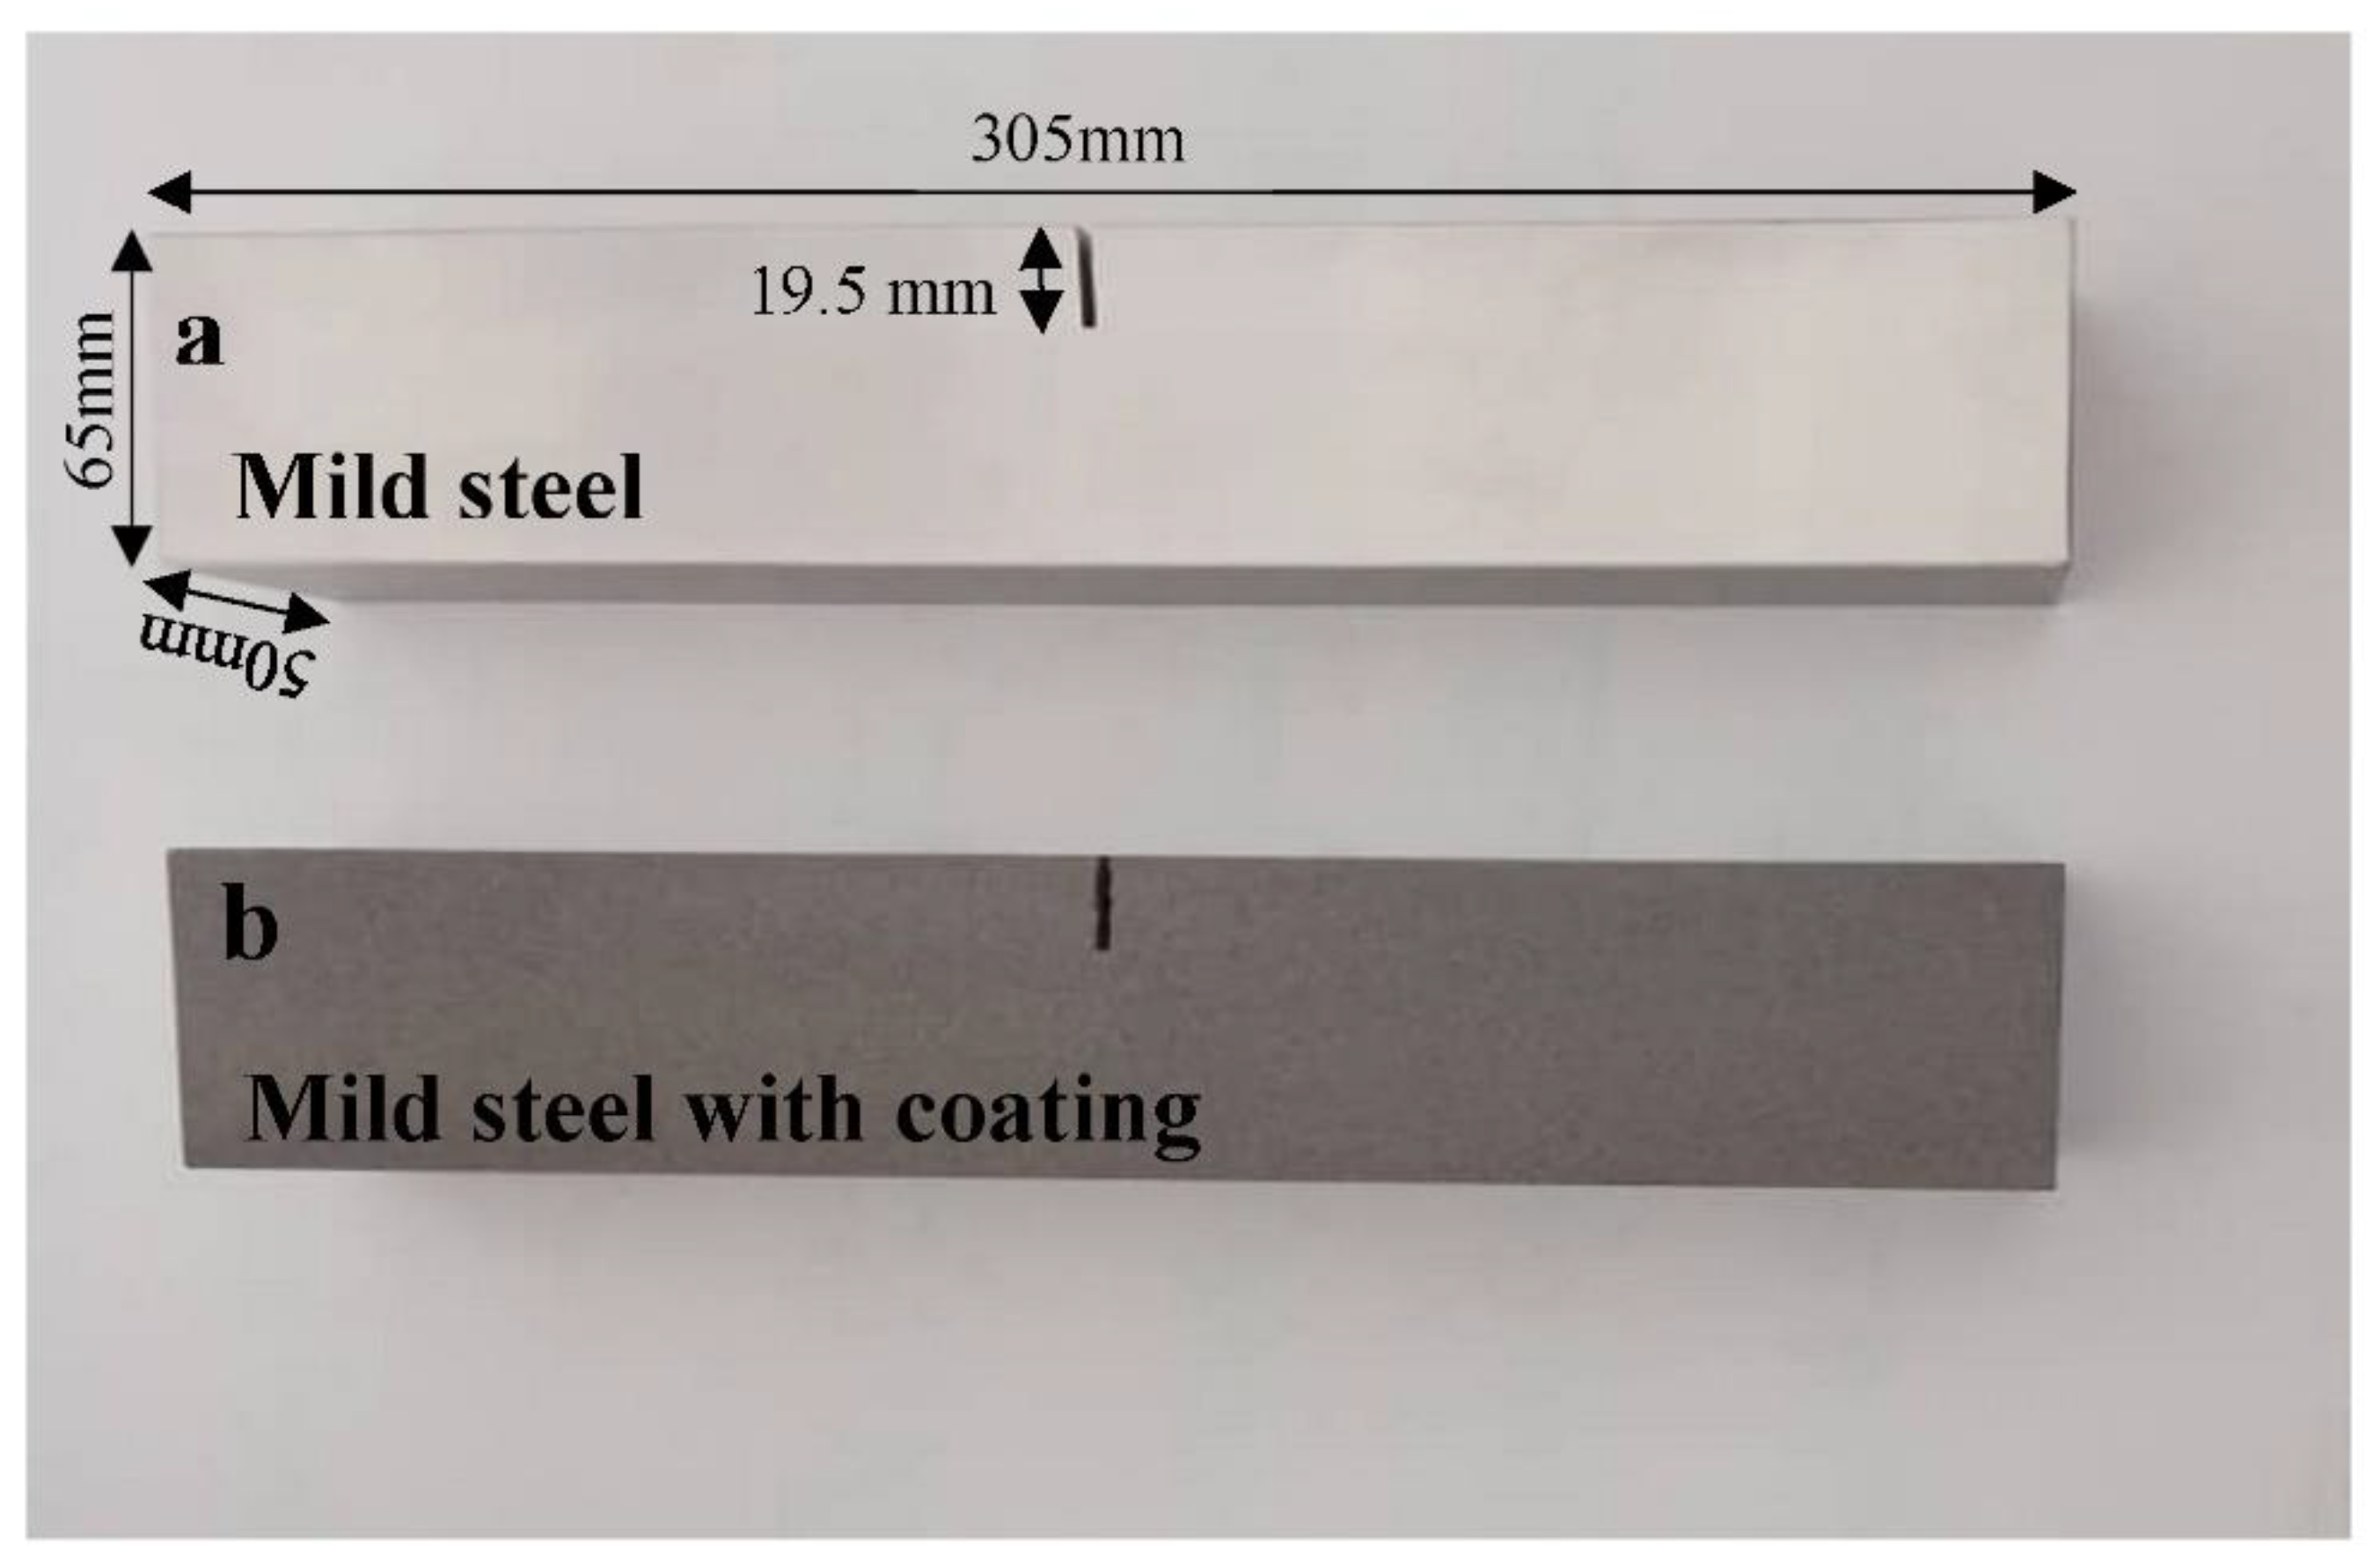
Figure 1. Single-edge-notch specimens (a) mild steel without coating (b) mild steel with coating.
Crystals 13 00365 g001
Figure 2. X-ray diffractometer (XRD) spectrum of powder and as-sprayed coating.
Crystals 13 00365 g002
Figure 3. The geometry of three-point bending conditions for a sample of Fe-based amorphous coating.
Crystals 13 00365 g003
Figure 4. Special elements are used for the displacement extrapolation method.
Crystals 13 00365 g004
Figure 5. The symmetry of the FE model of the cracked plate.
Crystals 13 00365 g005
Figure 6. Relationship between KI and the initial crack length size a/w.
Crystals 13 00365 g006
Figure 7. Evolution of kinking angle θ during crack propagation, comparison between the MCS and MSED criterion.
Crystals 13 00365 g007
Figure 8. Crack propagation path under mode I loading: For mild steel (a) strain crack band, (b) strain implicit gradient, (c) damage implicit gradient, for Fe-based amorphous (d) strain crack band, (e) strain implicit gradient, and (f) damage implicit gradient.
Crystals 13 00365 g008
Figure 9. Comparisons of SIFs for the single-edge angled crack.
Crystals 13 00365 g009
Figure 10. (a) Crack trajectories comparison for the single edge angled crack. (b) Variation of the stress-strain sensor.
Crystals 13 00365 g010
Figure 11. Curves of (a) load-displacement and (b) load and CMOD.
Crystals 13 00365 g011
Disclaimer/Publisher’s Note: The statements, opinions and data contained in all publications are solely those of the individual author(s) and contributor(s) and not of MDPI and/or the editor(s). MDPI and/or the editor(s) disclaim responsibility for any injury to people or property resulting from any ideas, methods, instructions or products referred to in the content.