Article

The Impact of Ammonium Fluoride on Structural, Absorbance Edge, and the Dielectric Properties of Polyvinyl Alcohol Films: Towards a Novel Analysis of the Optical Refractive Index, and CUT-OFF Laser Filters

by
Samer H. Zyoud
1,2,3,*,
Wissal Jilani
4,5,
Abdelfatteh Bouzidi
5,
Thekrayat H. AlAbdulaal
6,
Farid A. Harraz
7,8,
Mohammad S. Al-Assiri
7,9,
Ibrahim S. Yahia
3,6,10,11,
Heba Y. Zahran
6,10,11,
Medhat A. Ibrahim
12 and
Mohamed Sh. Abdel-wahab
13
1
Department of Mathematics and Sciences, Ajman University, Ajman P.O. Box 346, United Arab Emirates
2
Nonlinear Dynamics Research Center (NDRC), Ajman University, Ajman P.O. Box 346, United Arab Emirates
3
Center of Medical and Bio-Allied Health Sciences Research (CMBHSR), Ajman University, Ajman P.O. Box 346, United Arab Emirates
4
Department of Physics, Faculty of Science Sciences and Arts Dhahran Al Janoub, King Khalid University, P.O. Box 960, Abha 61421, Saudi Arabia
5
Laboratory of Materials for Energy and Environment and Modelling (LMEEM), Faculty of Sciences of Sfax, University of Sfax-Tunisia, B.P. 1171, Sfax 3038, Tunisia
6
Laboratory of Nano-Smart Materials for Science and Technology (LNSMST), Department of Physics, Faculty of Science, King Khalid University, P.O. Box 9004, Abha 61421, Saudi Arabia
7
Promising Centre for Sensors and Electronic Devices (PCSED), Advanced Materials and Nano-Research Centre, Najran University, P.O. Box 1988, Najran 11001, Saudi Arabia
8
Nanomaterials and Nanotechnology Department, Central Metallurgical Research and Development Institute (CMRDI), Cairo 11421, Egypt
9
Department of Physics, Faculty of Science and Arts, Najran University, P.O. Box 1988, Najran 11001, Saudi Arabia
10
Research Center for Advanced Materials Science (RCAMS), King Khalid University, P.O. Box 9004, Abha 61413, Saudi Arabia
11
Nanoscience Laboratory for Environmental and Biomedical Applications (NLEBA), Semiconductor Lab., Metallurgical Lab. 1., Department of Physics, Faculty of Education, Ain Shams University, Roxy, Cairo 11757, Egypt
12
Molecular Spectroscopy and Modeling Unit, National Research Centre, Spectroscopy Department, 33 El-Bohouth St., Dokki, Giza 12622, Egypt
13
Materials Science and Nanotechnology Department, Faculty of Postgraduate Studies for Advanced Sciences, Beni-Suef University, Beni-Suef 62511, Egypt
*
Author to whom correspondence should be addressed.
Crystals 2023, 13(3), 376; https://doi.org/10.3390/cryst13030376
Submission received: 3 February 2023 / Revised: 13 February 2023 / Accepted: 16 February 2023 / Published: 22 February 2023
(This article belongs to the Special Issue Advances in Multifunctional Nanocomposites)

Abstract

:
The new proton-conducting composite electrolyte films (PCCEFs) consisting of polyvinyl alcohol (PVA) with varying ammonium fluoride salt concentrations were created using an expanded liquid casting process. The X-ray diffraction (XRD) study confirms the composite electrolyte films (CEFs) formation. The improvement in AMF02 salt doping compared to the PVA matrix film approach resulted in decreased variation in the crystalline size values, thus explaining how [NH4+] and polymer PVA matrix films interact. The band gaps decrease when the AMF02 salt filler concentration increases due to increased crystallite size. The suggested composites evaluated successful CUT-OFF laser filters and attenuation, as well as limiting laser power systems. For the 11.11 wt% AMF02 doping salt, the highest DC conductivity was 73.205 × 10⁻⁹ (siemens/m) at ambient temperature. Our dielectric results demonstrate that the CEFs are usually suitable for optoelectronic systems. There is a huge need to develop low dielectric permittivity composite electrolyte films (CEFs) for microelectronic devices and the high-frequency region.

1. Introduction

Because of its potential ionic supercapacitor electrodes in battery packs, hydrogen fuel, photovoltaic panels, and electrochemistry displays, researchers worldwide are working to improve the conductivity proton of the composite electrolyte films (CEFs) [1,2]. The CEFs conduction of the proton is an essential part of the growth and advancement of fuel cell technology [3]. Various techniques improved the composite electrolyte’s ionic room temperature conductivity. The dissolution of inorganic components in the polymer chain is one such process. Polymers are frequently used to make PCCEFs [4,5]. polyvinyl alcohol (PVA) is a semi-crystalline nature substance with a hydrogen bond connected to methane carbons that can act as a hydrogen-bonded source. Some research teams have expanded the conductivities of PVA by adding various ammonium salts to begin preparing proton (H+)-conducting solid polymer electrolytes (SPEs).
Ammonium fluoride, abbreviated AMF02, seems to be a white crystalline solid salt of an inorganic substance that is regarded as a great hydrogen donor to a matrix phase. In five to six orders of magnitude, the ammonium salts showed a more specific conductivity than other alkaline salts [6]. The exceptional physical characteristics of organic polymers crosslinked with inorganic ammonium ions have piqued the interest of many researchers. PVA: NH4F, a proton-conducting polymer electrolytic cell, was investigated by K. P. Radha et al. [5]. The NMR approach investigated ionic diffusive motion, such as rotational motion and translation of the (NH4+/H+) cations and the (F/BF4−) anions [7]. N. Aziz et al. discovered that methylcellulose-doped ammonium fluoride is a proton conductor [8]. The authors employed polymer poly (ethylene oxide) as a polymer host in their research because of its superior degree of crystallinity. Hema et al. mentioned how proton-conducting polymer electrolytes are inferred from ammonium halide-doped PVA [9,10]. The study reported the boost in ionic conductivity amount in the order of 10−3 S/cm for PVA/NH4I, 10−4 S/cm for PVA/NH4Br, and 10−5 S/cm for PVA/NH4Cl proton-conducting SPEs [10]. Several studies have also shown that fluorine easily reduces the energy gap between the highest occupied (HOMO) molecular orbital and the lowest unoccupied (LUMO) molecular orbital, and shifts the excitation/emission on the way to the red region [11,12]. Maryam A. M. Saeed et al. [13] investigated the structural, electrical, and transport properties of PVA-based ready samples in the presence of higher ammonium salinity levels, frequency, and temperature to predict the system’s uses.
The latest research presents novel AMF02/PVA PCCEFs with various AMF02 concentrations, though the AMF02 filler effects on the microstructural, dielectric, and optical states were also investigated.

2. Specifics of the Experiment

2.1. Test Experimentation

All experimental supplies were obtained without further purification needed. Ammonium fluoride (Linear formula NH4F = AMF02) with a molar mass = 37.04 g/mol was supplied by Sigma-Aldrich Chemical Business, while polyvinyl alcohol was supplied by Loba Chemie (Mumbai) India (PVA). To proceed, 45 g of PVA polymer powder was suspended in 1 L of distilled water for 48 h with magnetic stirring at 80 °C. In the beakers, different amounts of AMF02 powders were dissolved in 10 mL of distilled water, and a 50 mL PVA solution matrix was added. The reaction mixture was dried in a glass Petri dish for 5 days in a dryer oven at 35 °C using the solution casting technique. Lastly, we collected the AMF02/PVA novel PCCEFs with various AMF02 concentration levels.

2.2. Equipment and Characteristics

To assess the unique proton-conducting CEF structures, X-ray patterns were recorded using a Shimadzu XRD-6000 laboratory diffractometer technique.
Using a JASCO V-570 spectrophotometer, the absorbance and transmittance of the AMF02/PVA new PCCEFs was comfortably within the UV–Vis and NIR extents.
The specific optical characteristics of the CEFs with varying AMF02 filler contents were evaluated using a green (532 nm) laser and a He-Ne (632.8 nm) laser with a power laser meter (model: Newport 1916-R).
A programmed automated FLUKE PM-6306 LCR meter was used over a frequency range of 100 Hz to 1 MHz attached to the specially designed holder to measure the AMF02 influence on the dielectric properties of the investigated CEFs at room temperature. The holder was designed on Teflon sheets with two tungsten wires as a two-electrode to allow the electric current to penetrate the film’s top surface. These calibrated and shielded cables are directly connected to the two-probe holder without any extra connection cables. The top circular electrode has a diameter of 0.5 cm. The composite electrolyte films used for dielectric properties are in the form of a square with dimensions of 2 × 2 cm2 and a thickness of about 0.16 mm. The dielectric parameters (real and imaginary components) were calculated.

3. Discussions and Consequences

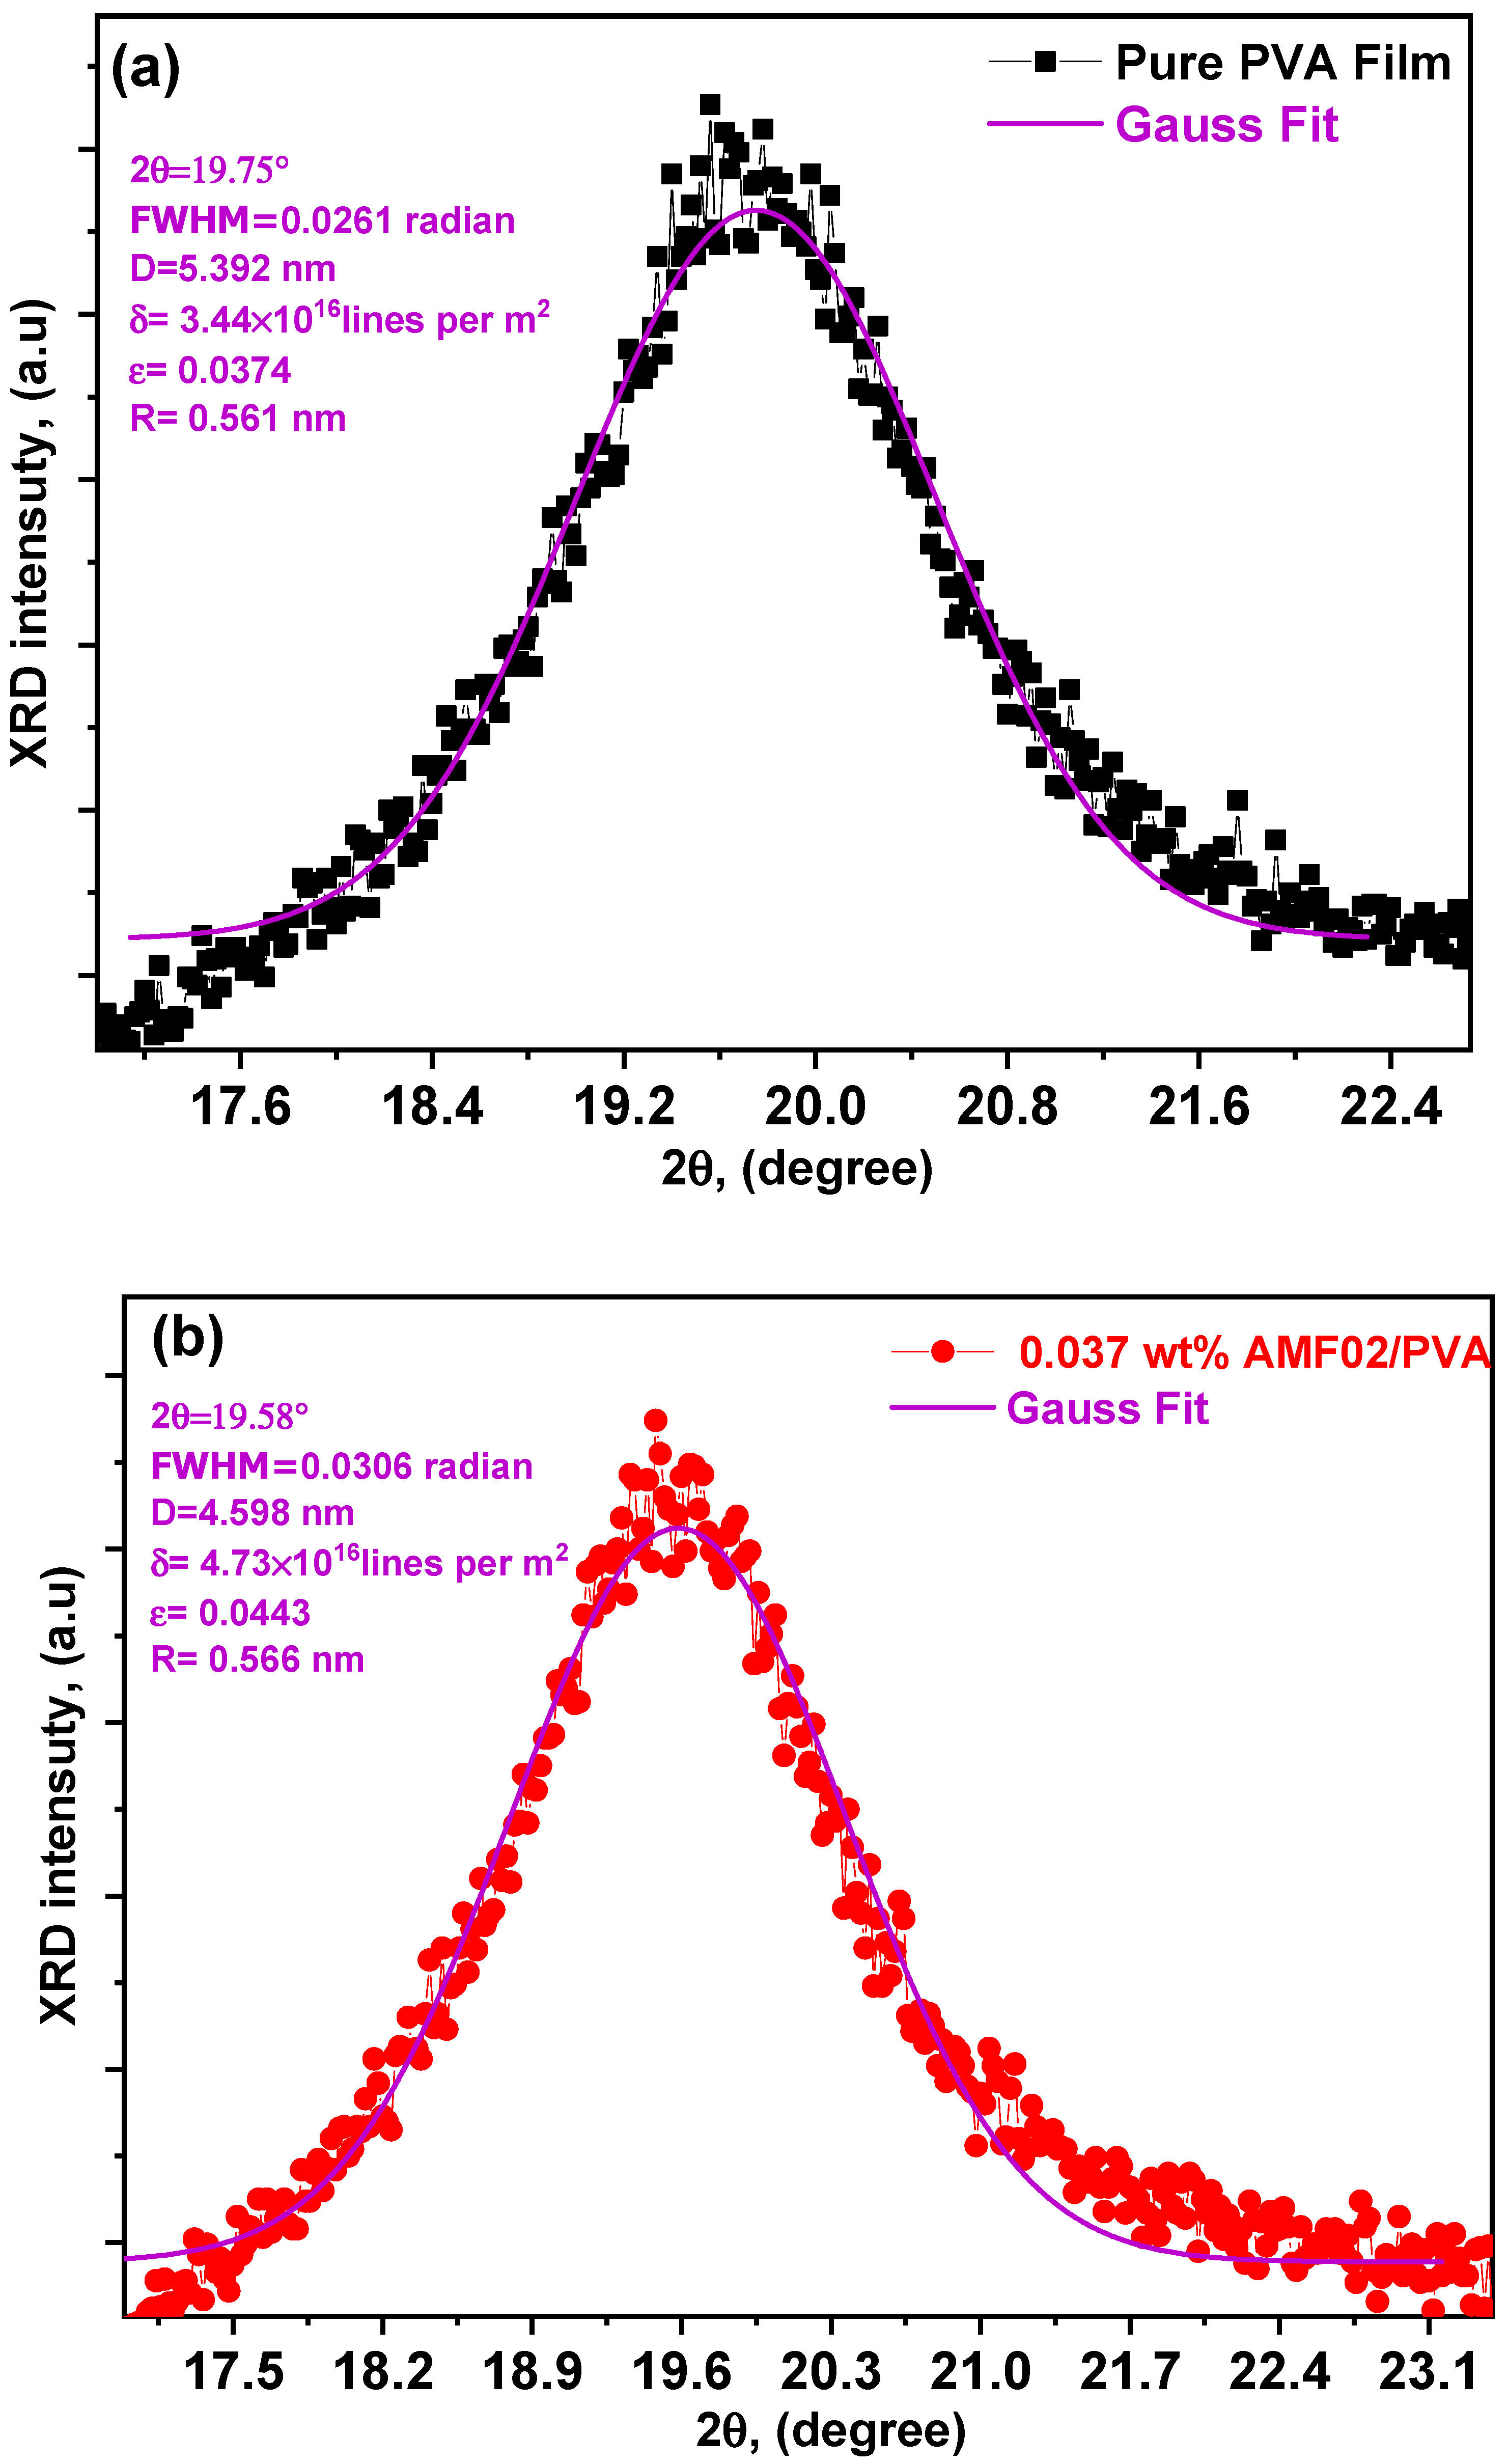
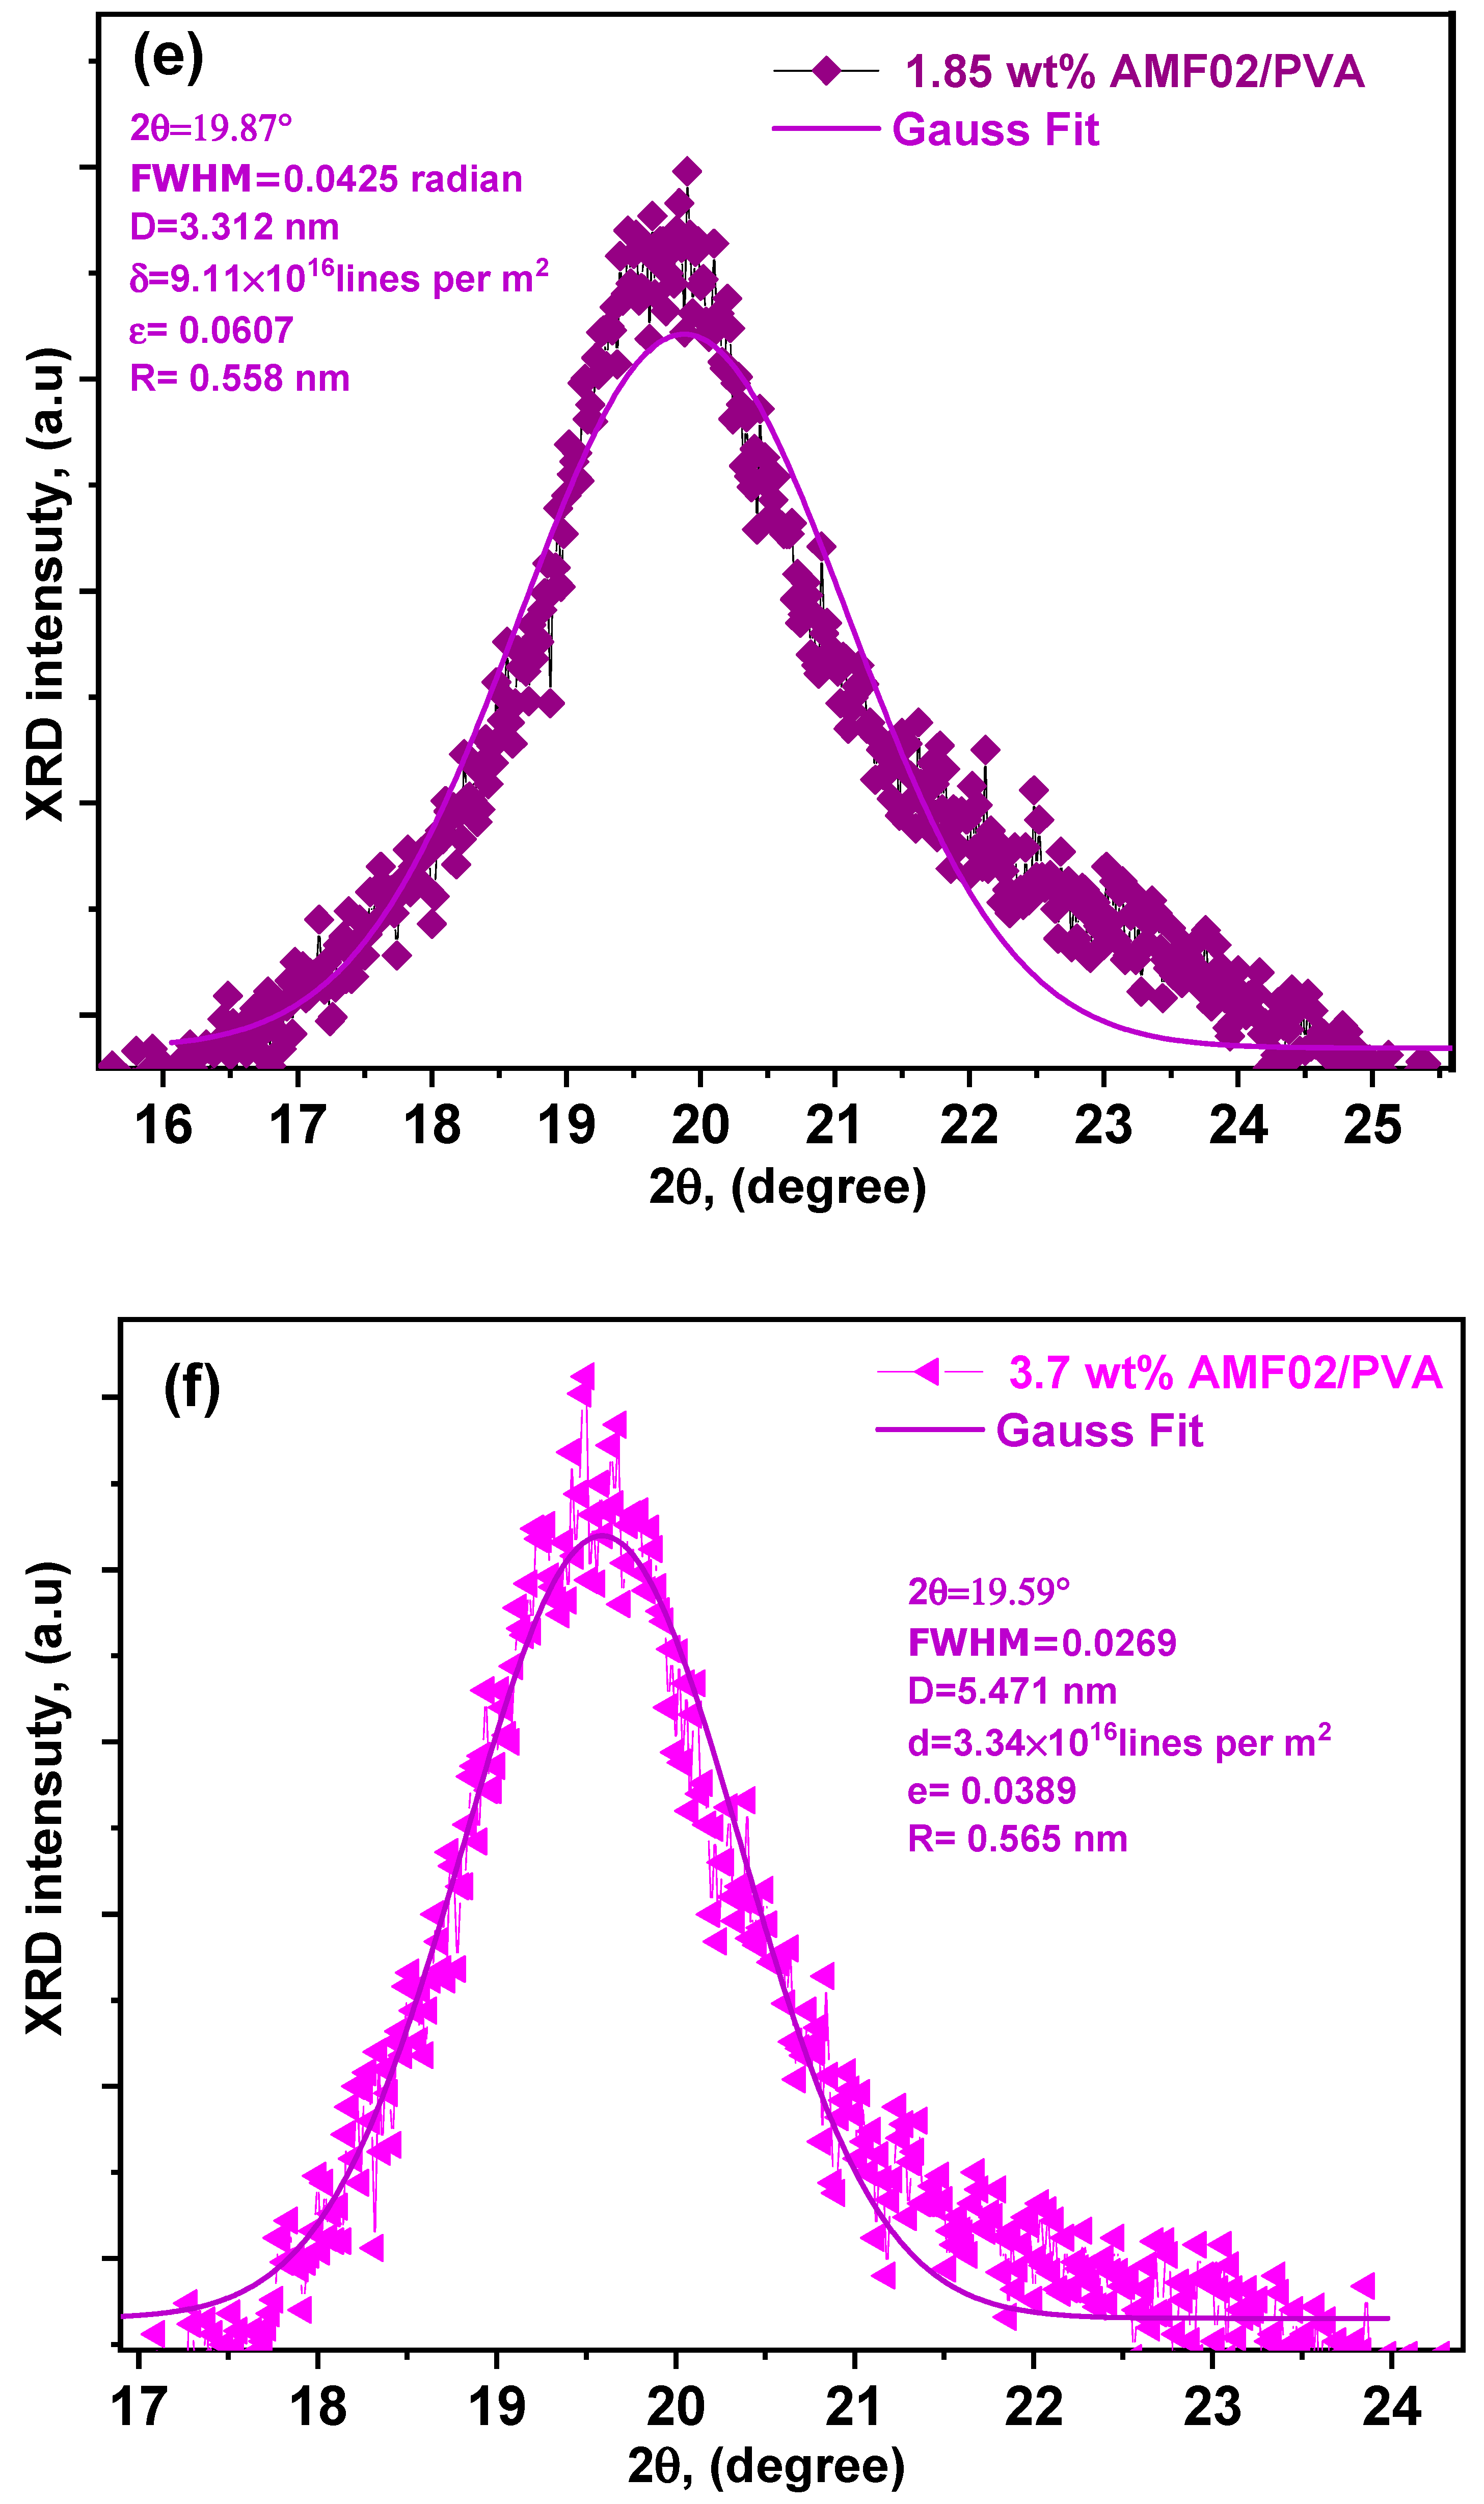
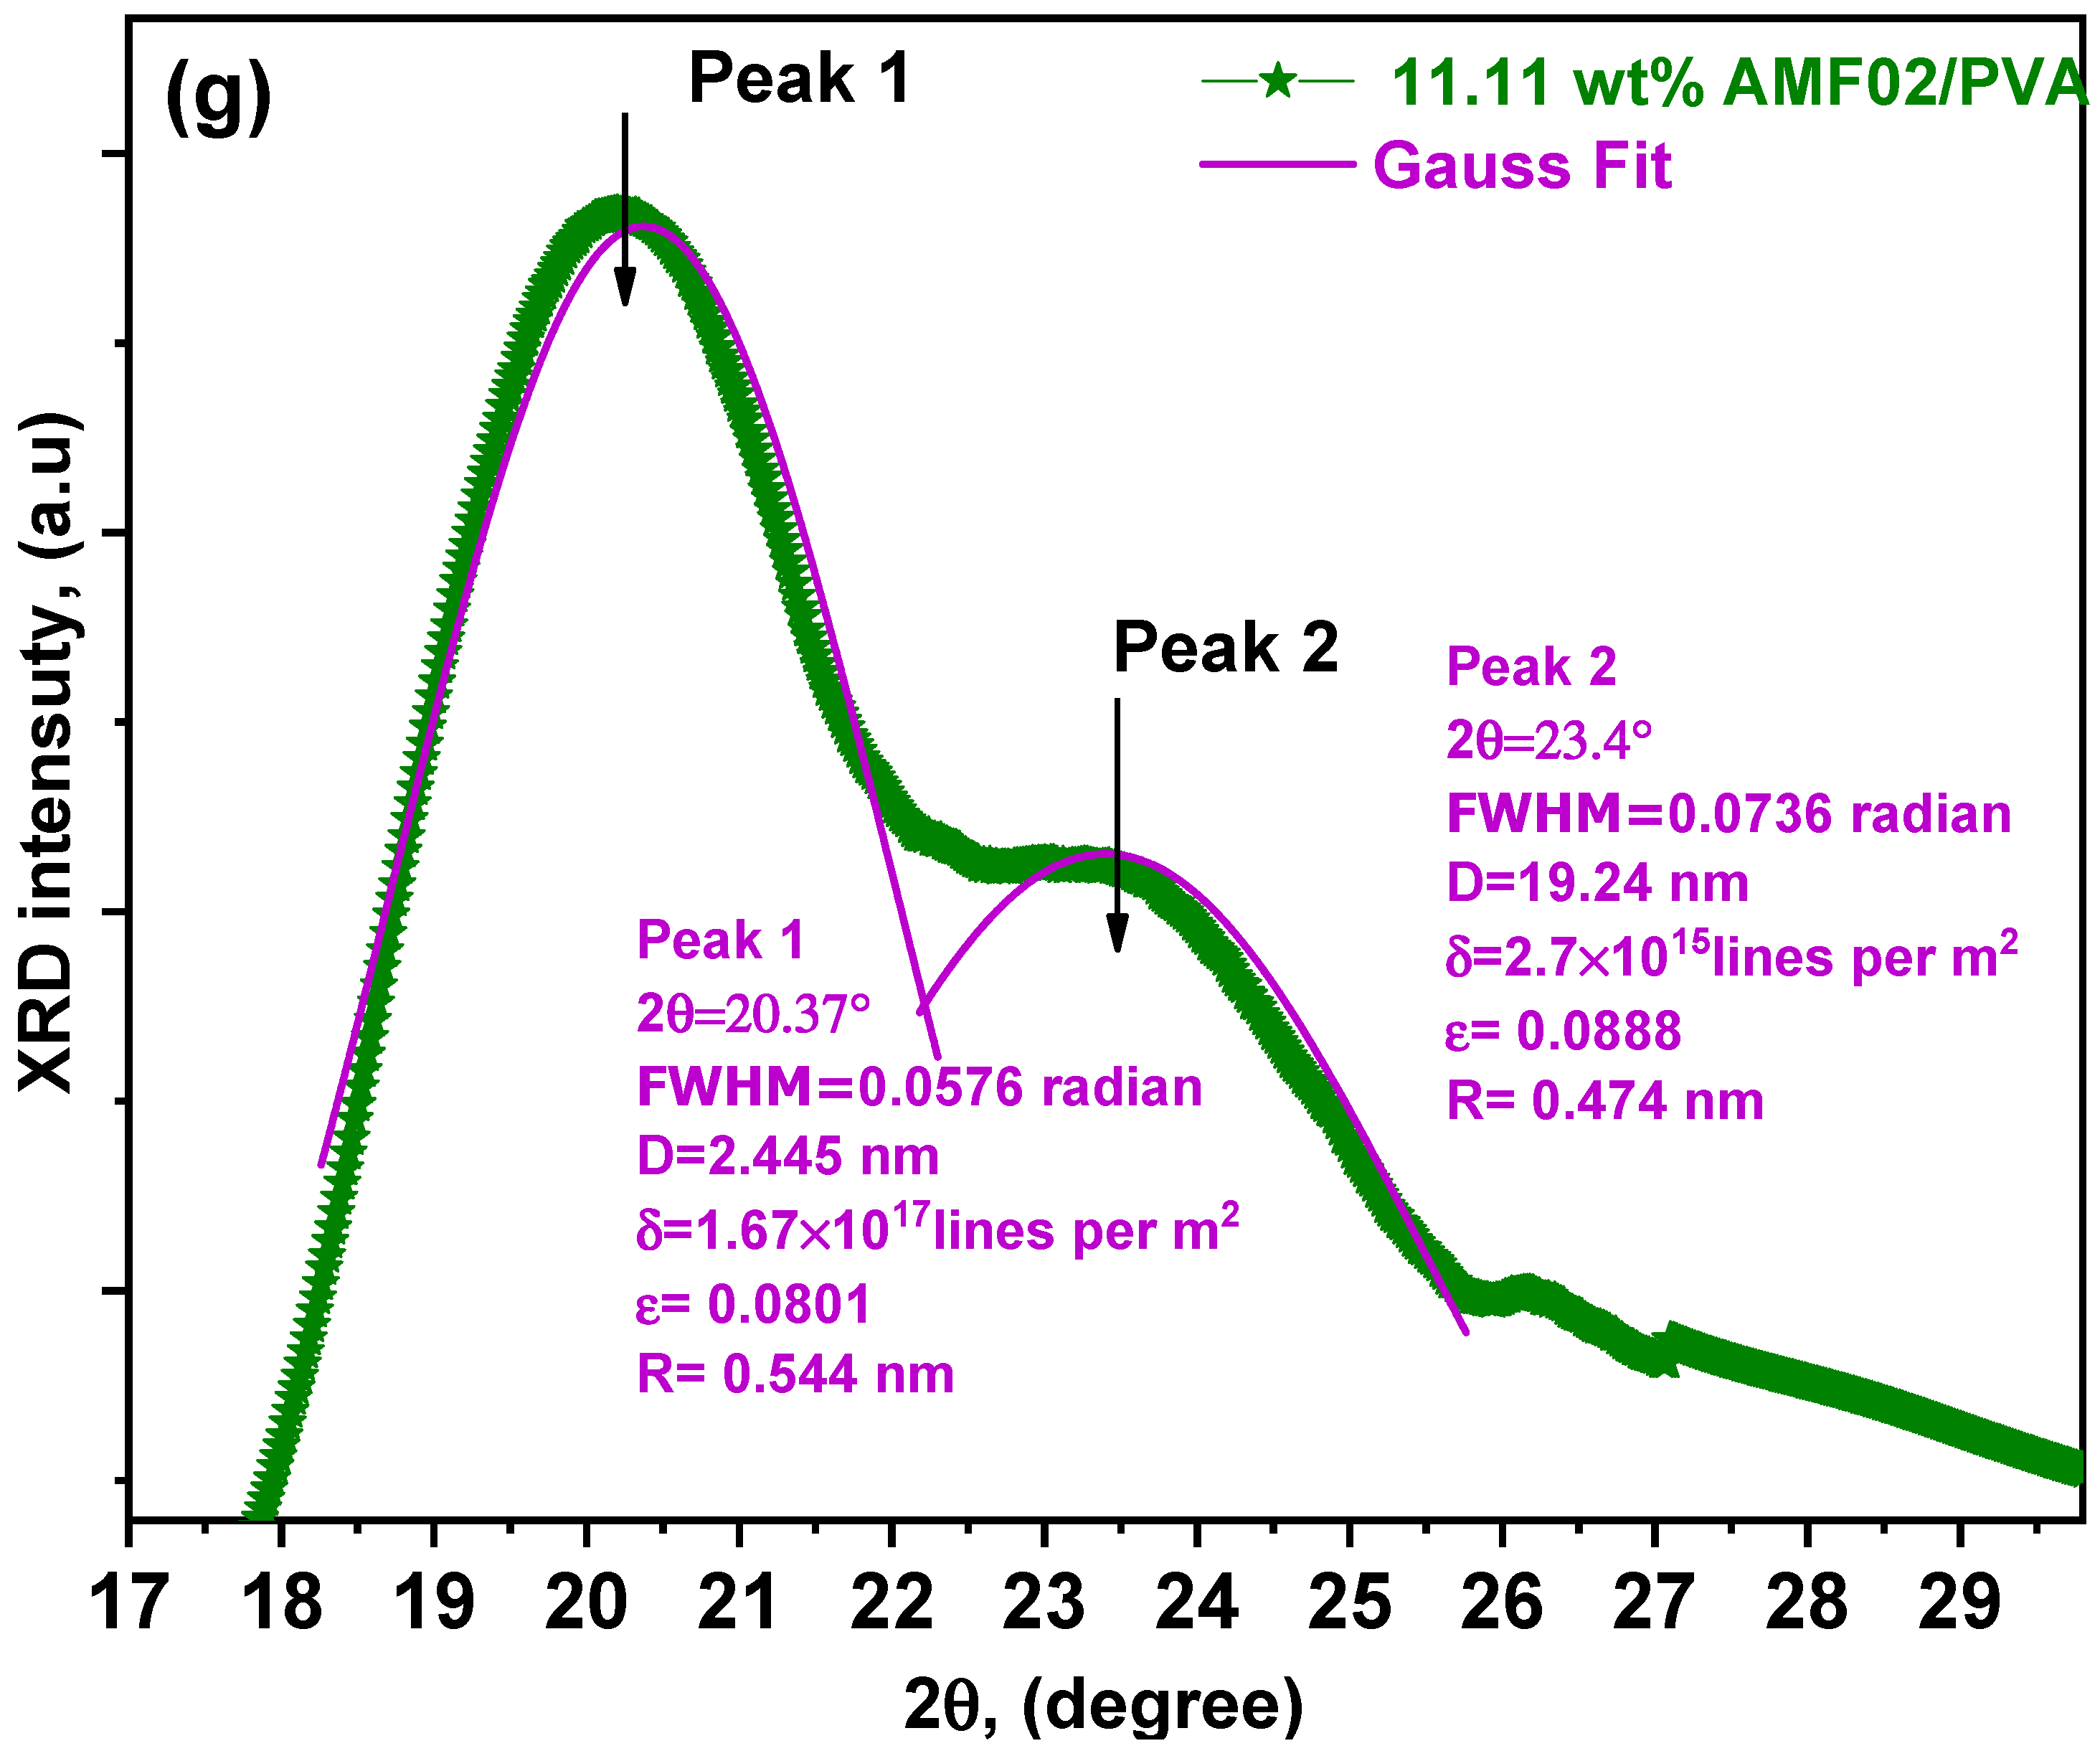
3.1. XRD Analysis of Innovative PCCEFs Made from AMF02/PVA

Figure 1 depicts the XRD charts for the new PCCEFs. A typical pure PVA film peak at approximately 19.66° corresponds to (101) monoclinic crystal planes with d-spaced 4.49Å, stating a semi-crystalline pure PVA nature [5,14]. The primary PVA chain contains OH groups, allowing strong intermolecular and intramolecular hydrogen bonding. No peak corresponds to AMF02 salt fillers above 11.11 wt% AMF02 in these CEFs. This implies that the polymer matrix dissociates completely in salt. Furthermore, a small new peak can be seen at about = 23.4° in the 11.11 wt% of AMF02 high doping in the PVA matrix associated with the AMF02 molecule [JCPDS: 71-2107]. This demonstrates incomplete salt destabilization in the PVA polymer matrix. K. P. Radha et al. interpreted this result [5]. The crystalline PVA peak position is changed to considerably higher angles, reducing the intensity with [NH4+] ions. A similar result was reported by several researchers [5,15]. The peak of the PVA matrix film was steadily extended by increasing the amount of [NH4+] ions until the crystalline peak began to disappear for the high-adding contents. The structural values, such as average crystallite size (using the Debye–Scherrer formula), average separation inter crystallite, microstrain, dislocation density, and stacking fault were calculated from XRD patterns using the relationships [16,17,18,19]:
D = k λ β cos θ
δ = 1 D 2
R = 5 λ 8 sin θ
ε = β 4 tan θ
where a crystallite’s size is defined by D ; k = 0.9 is a quantity associated with various aspects, such as crystal structure and the Miller index for reflecting crystallographic planes; λ is the wavelength of Cuk alpha radiation (=1.5406 Å); β is the FWHM; θ is the Bragg angle of the X-ray diffraction peak; and ε is the microstrain.
Figure 2a–g shows the Gauss fitting data of the XRD patterns. The structural parameters are calculated and indexed in Figure 2a–g. As presented in this figure, the crystalline size variation amounts decreased the soaring of AMF02 salt doping compared to the PVA matrix film approach. This might elucidate the impact of the contact between the [NH4+] ions and the polymer PVA matrix film [9,15], which detailed the strong dealings and adhesive marks between AMF02 doping salt and PVA matrix fragments, which create a boost in dielectric permittivity with the dopant [9]. Dielectric permittivity was particle size-dependent in previous work [20]. The microstrain rose as the [NH4+] ion contents in the PVA polymer matrix increased [15]. The innovative PCCEFs are characterized by combining crystal distortion and imperfection. The amorphous nature of the new proton-conducting composite electrolyte sheets is revealed by reducing the relative intensity with increasing FWHM of the characteristic peak [5]. In addition, the dislocation density increases with increasing AMF02 salt doping contrasted to the pure PVA film. Structural regularity can be applied to the main PVA molecule chain after adding the AMF02 salt fillers.

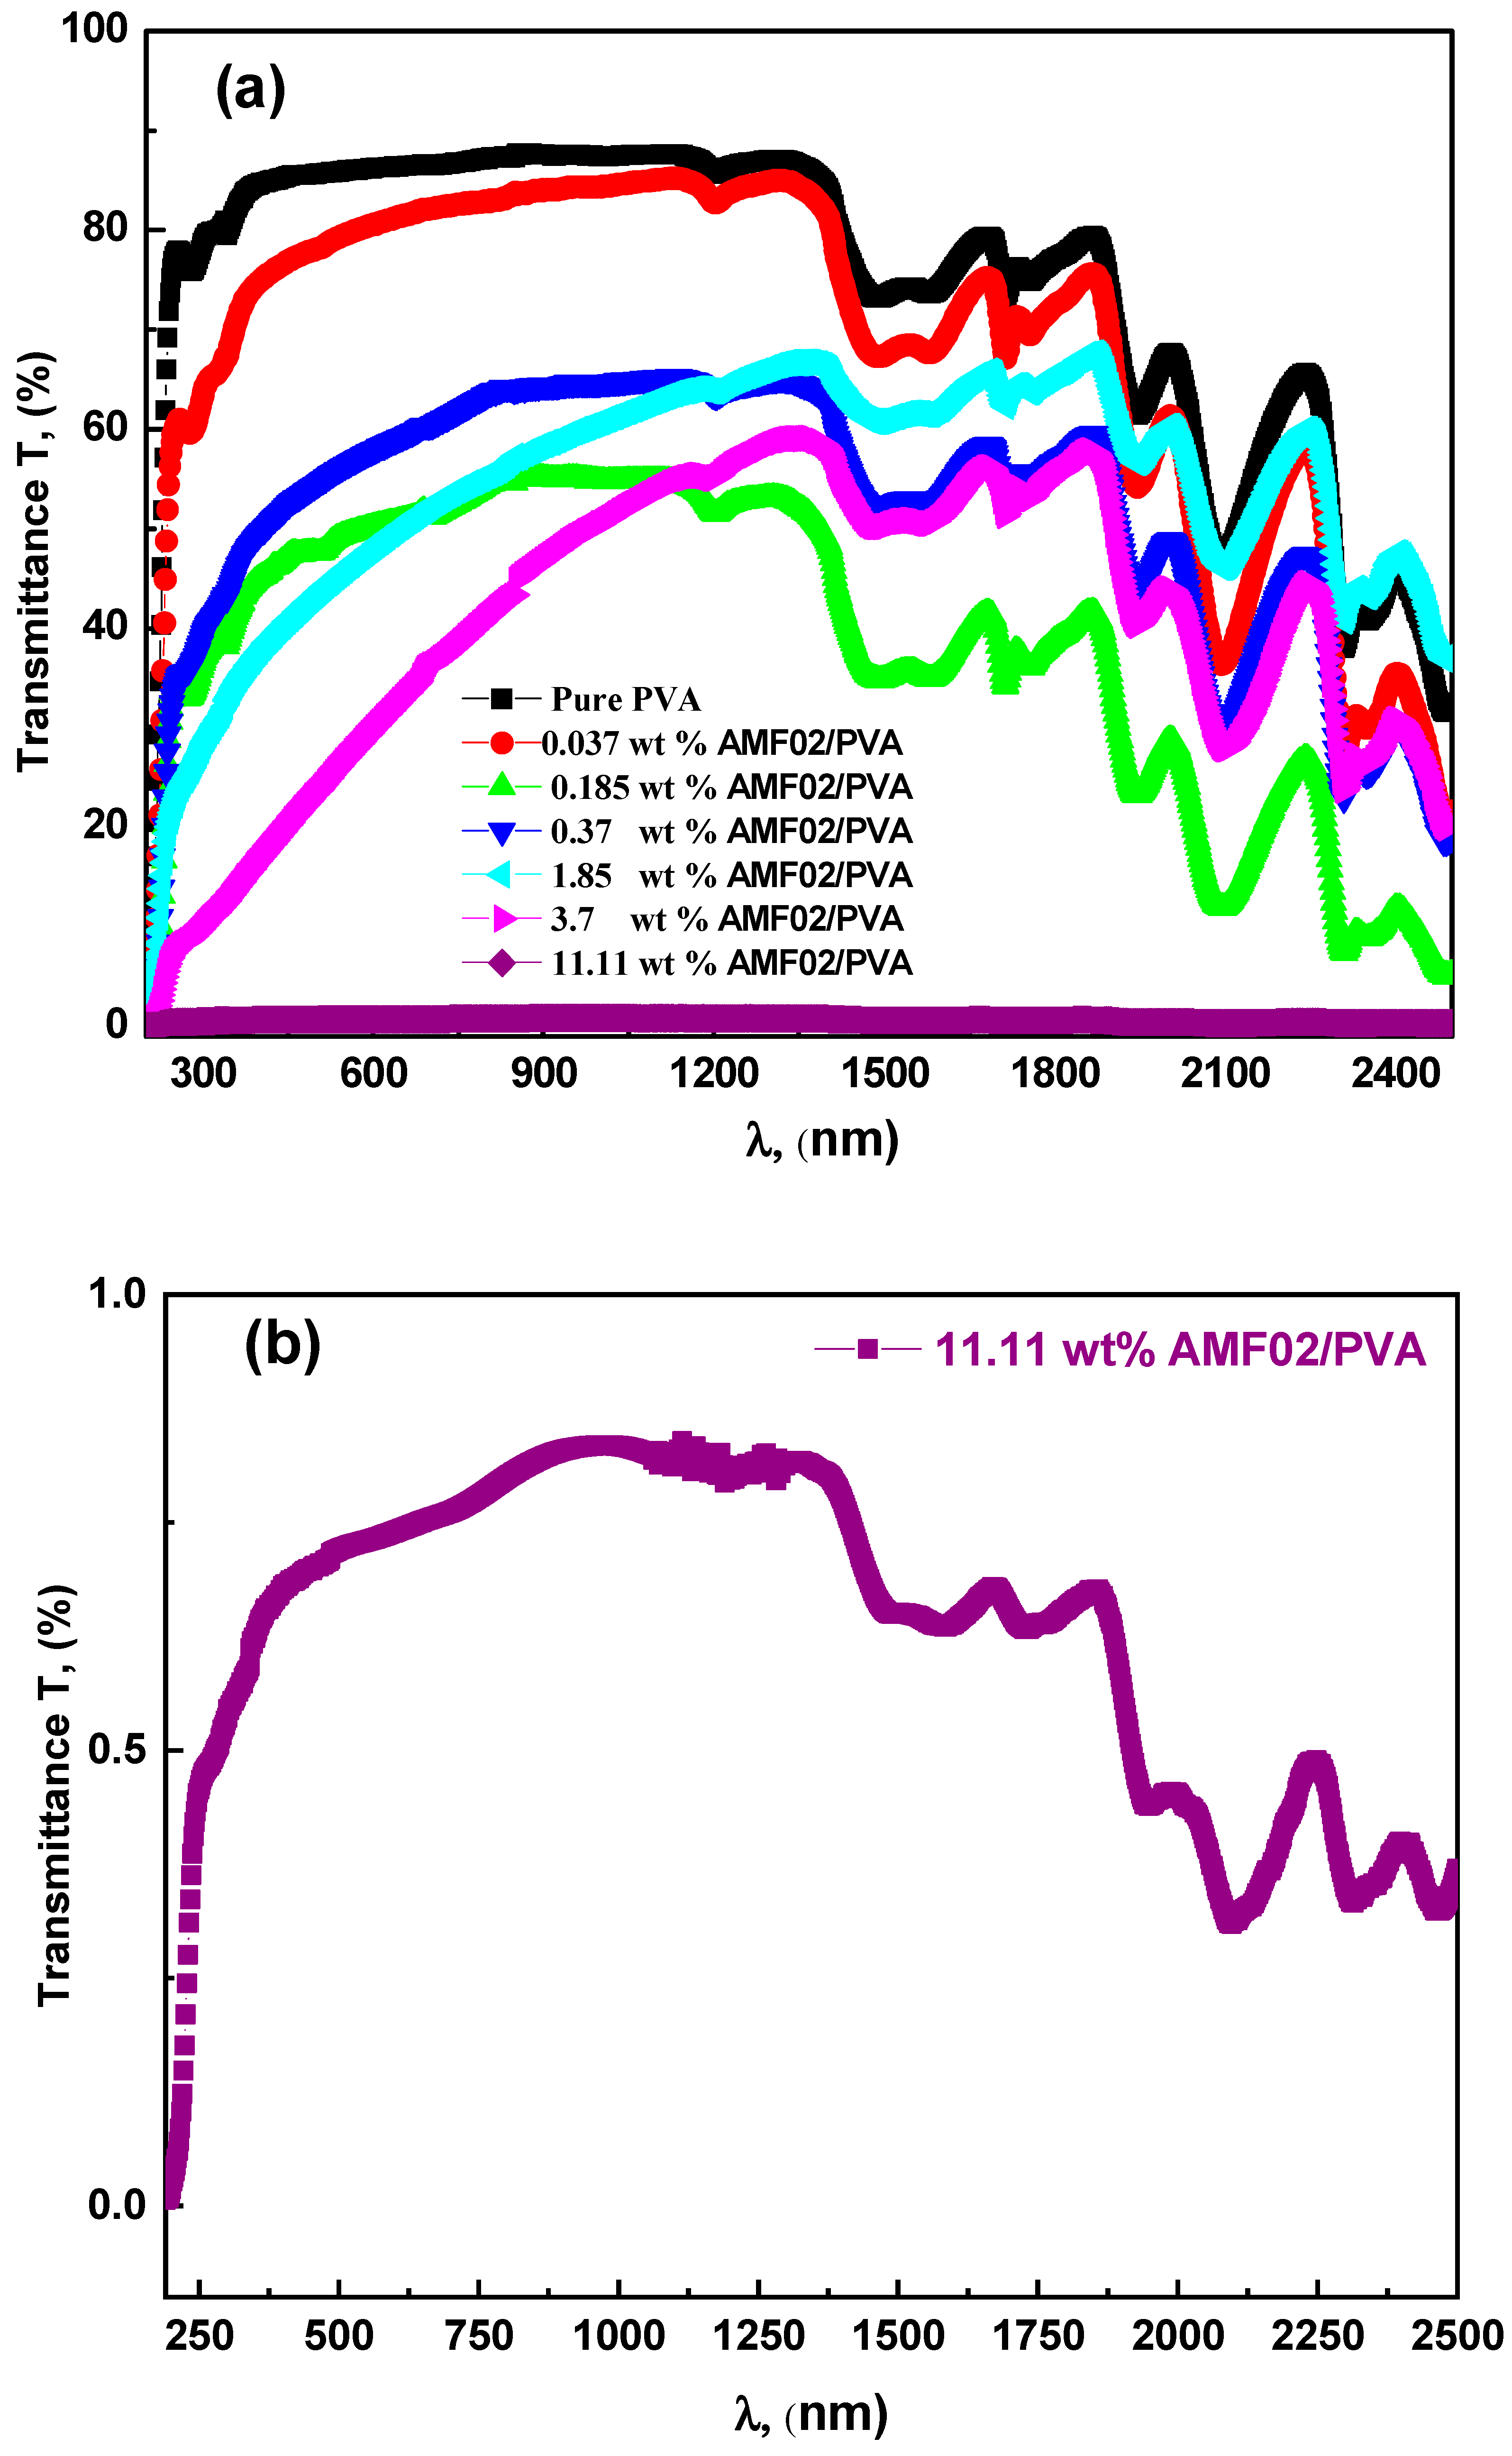
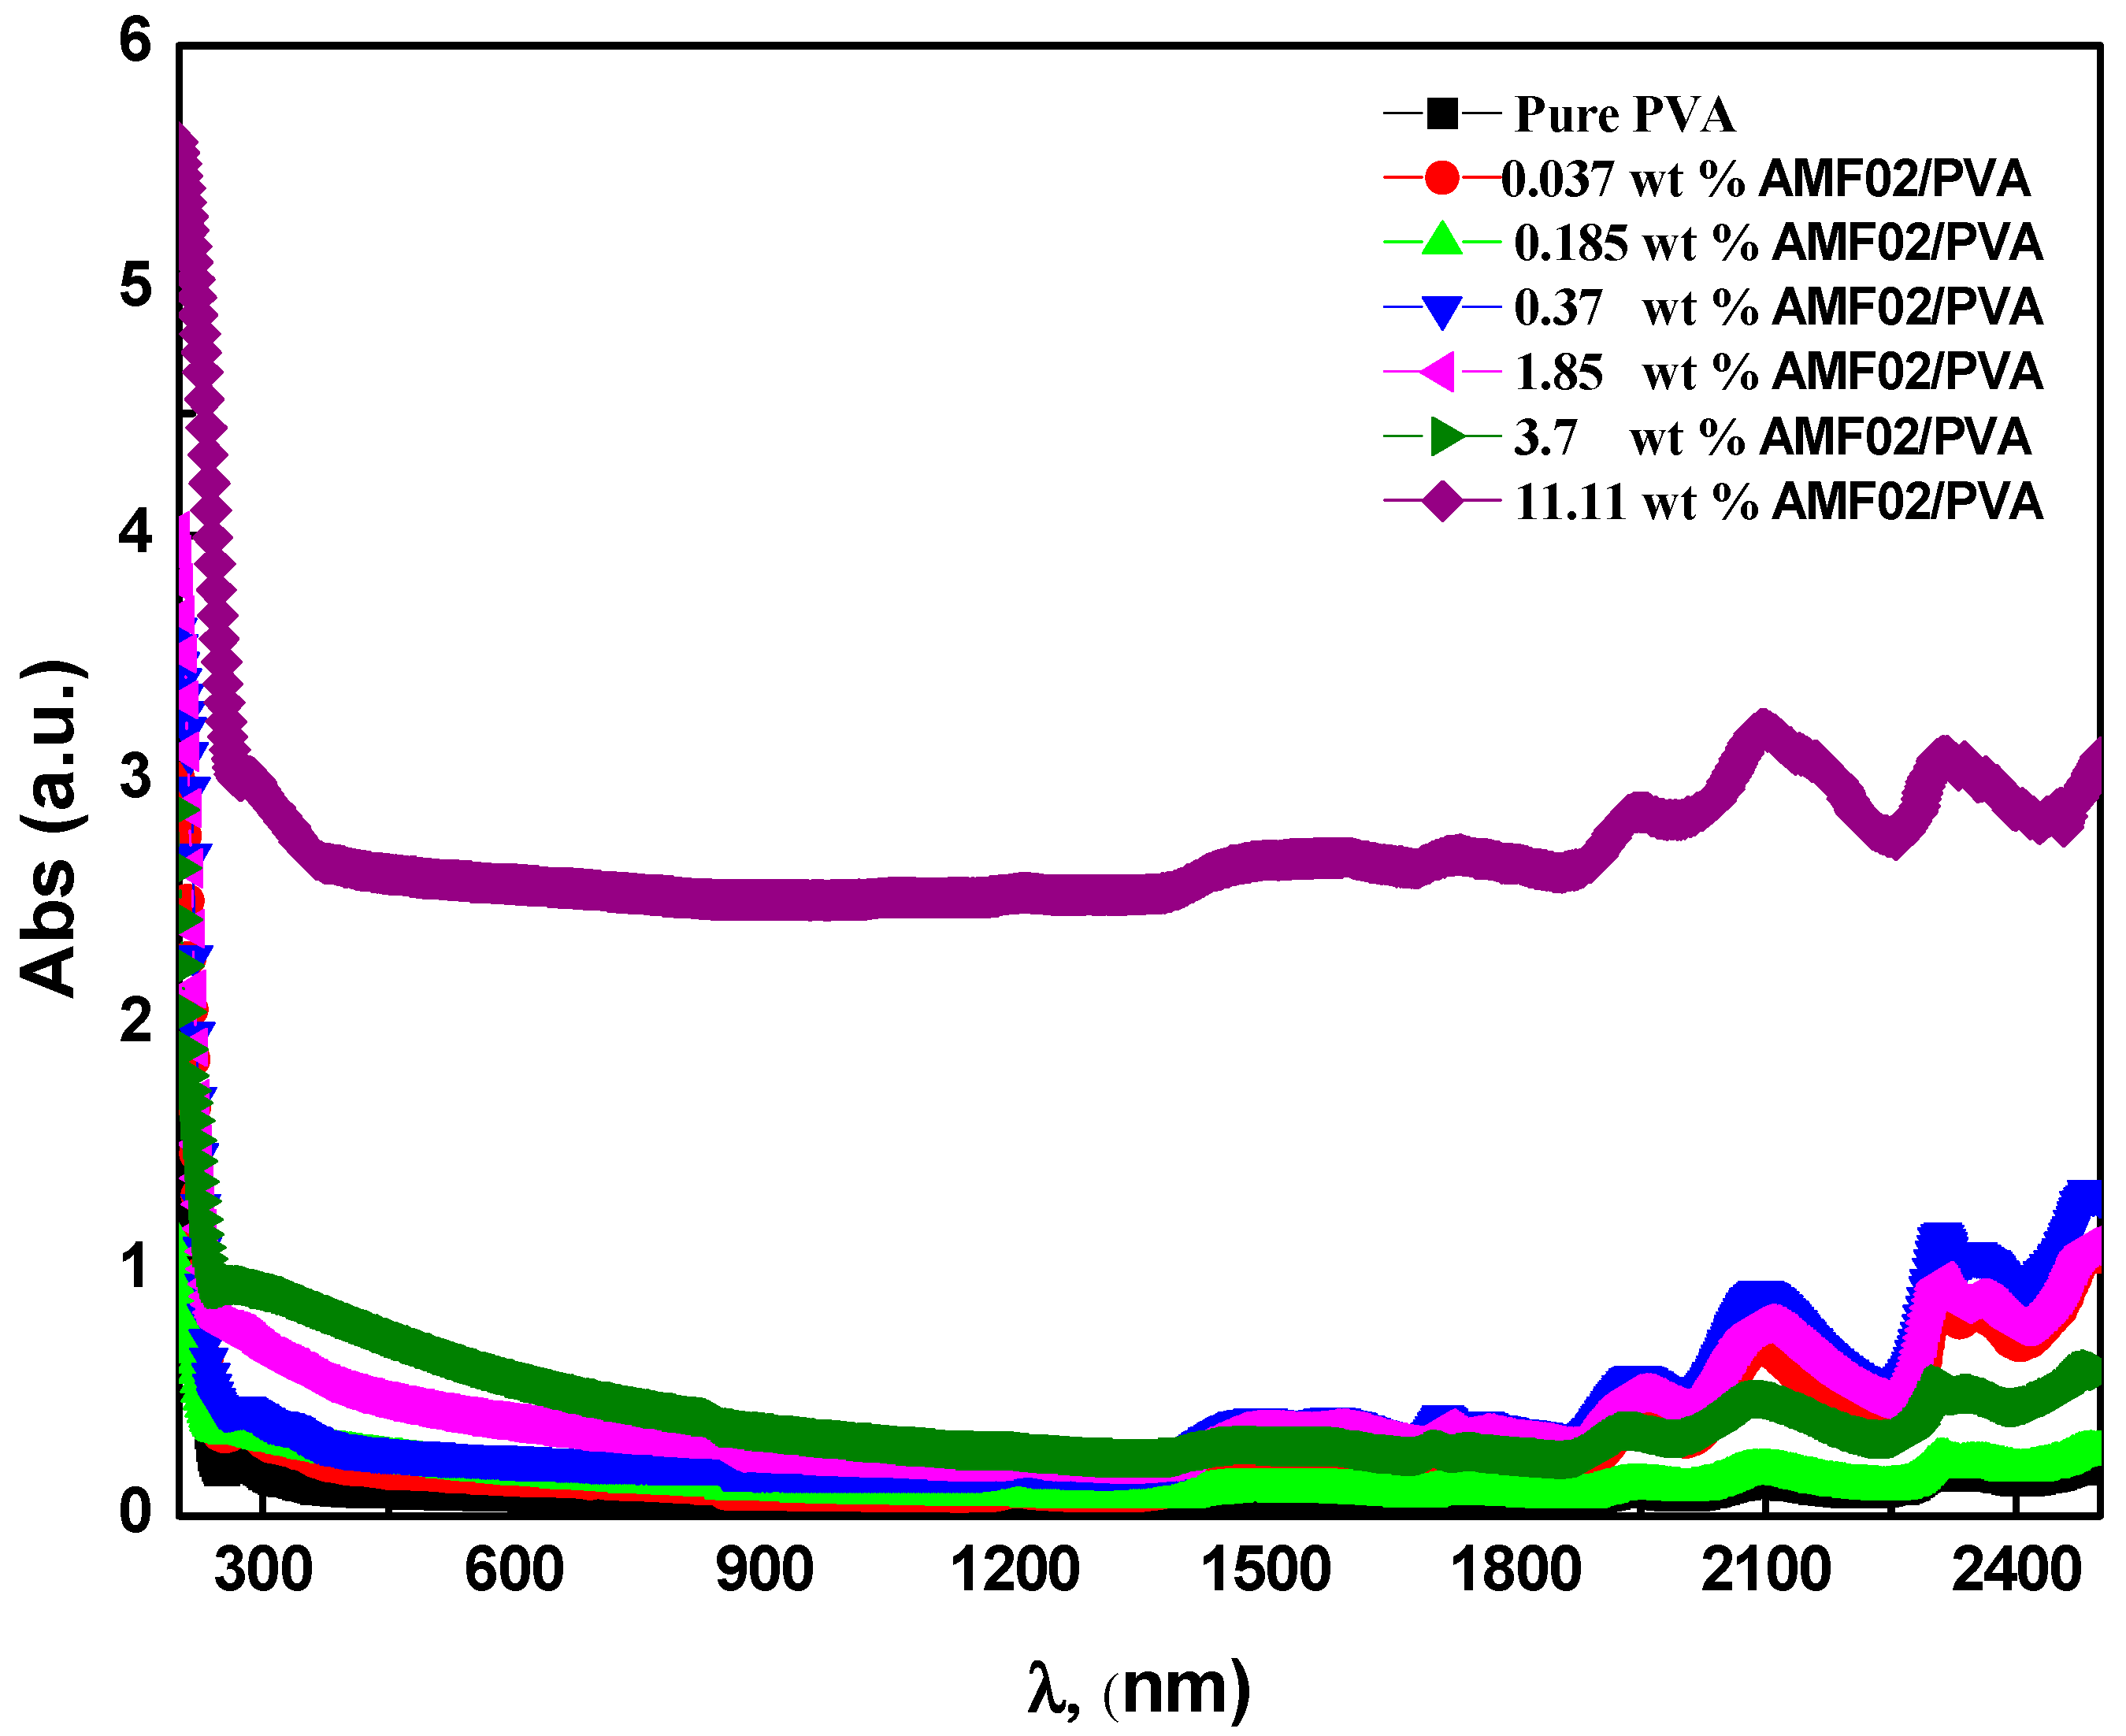
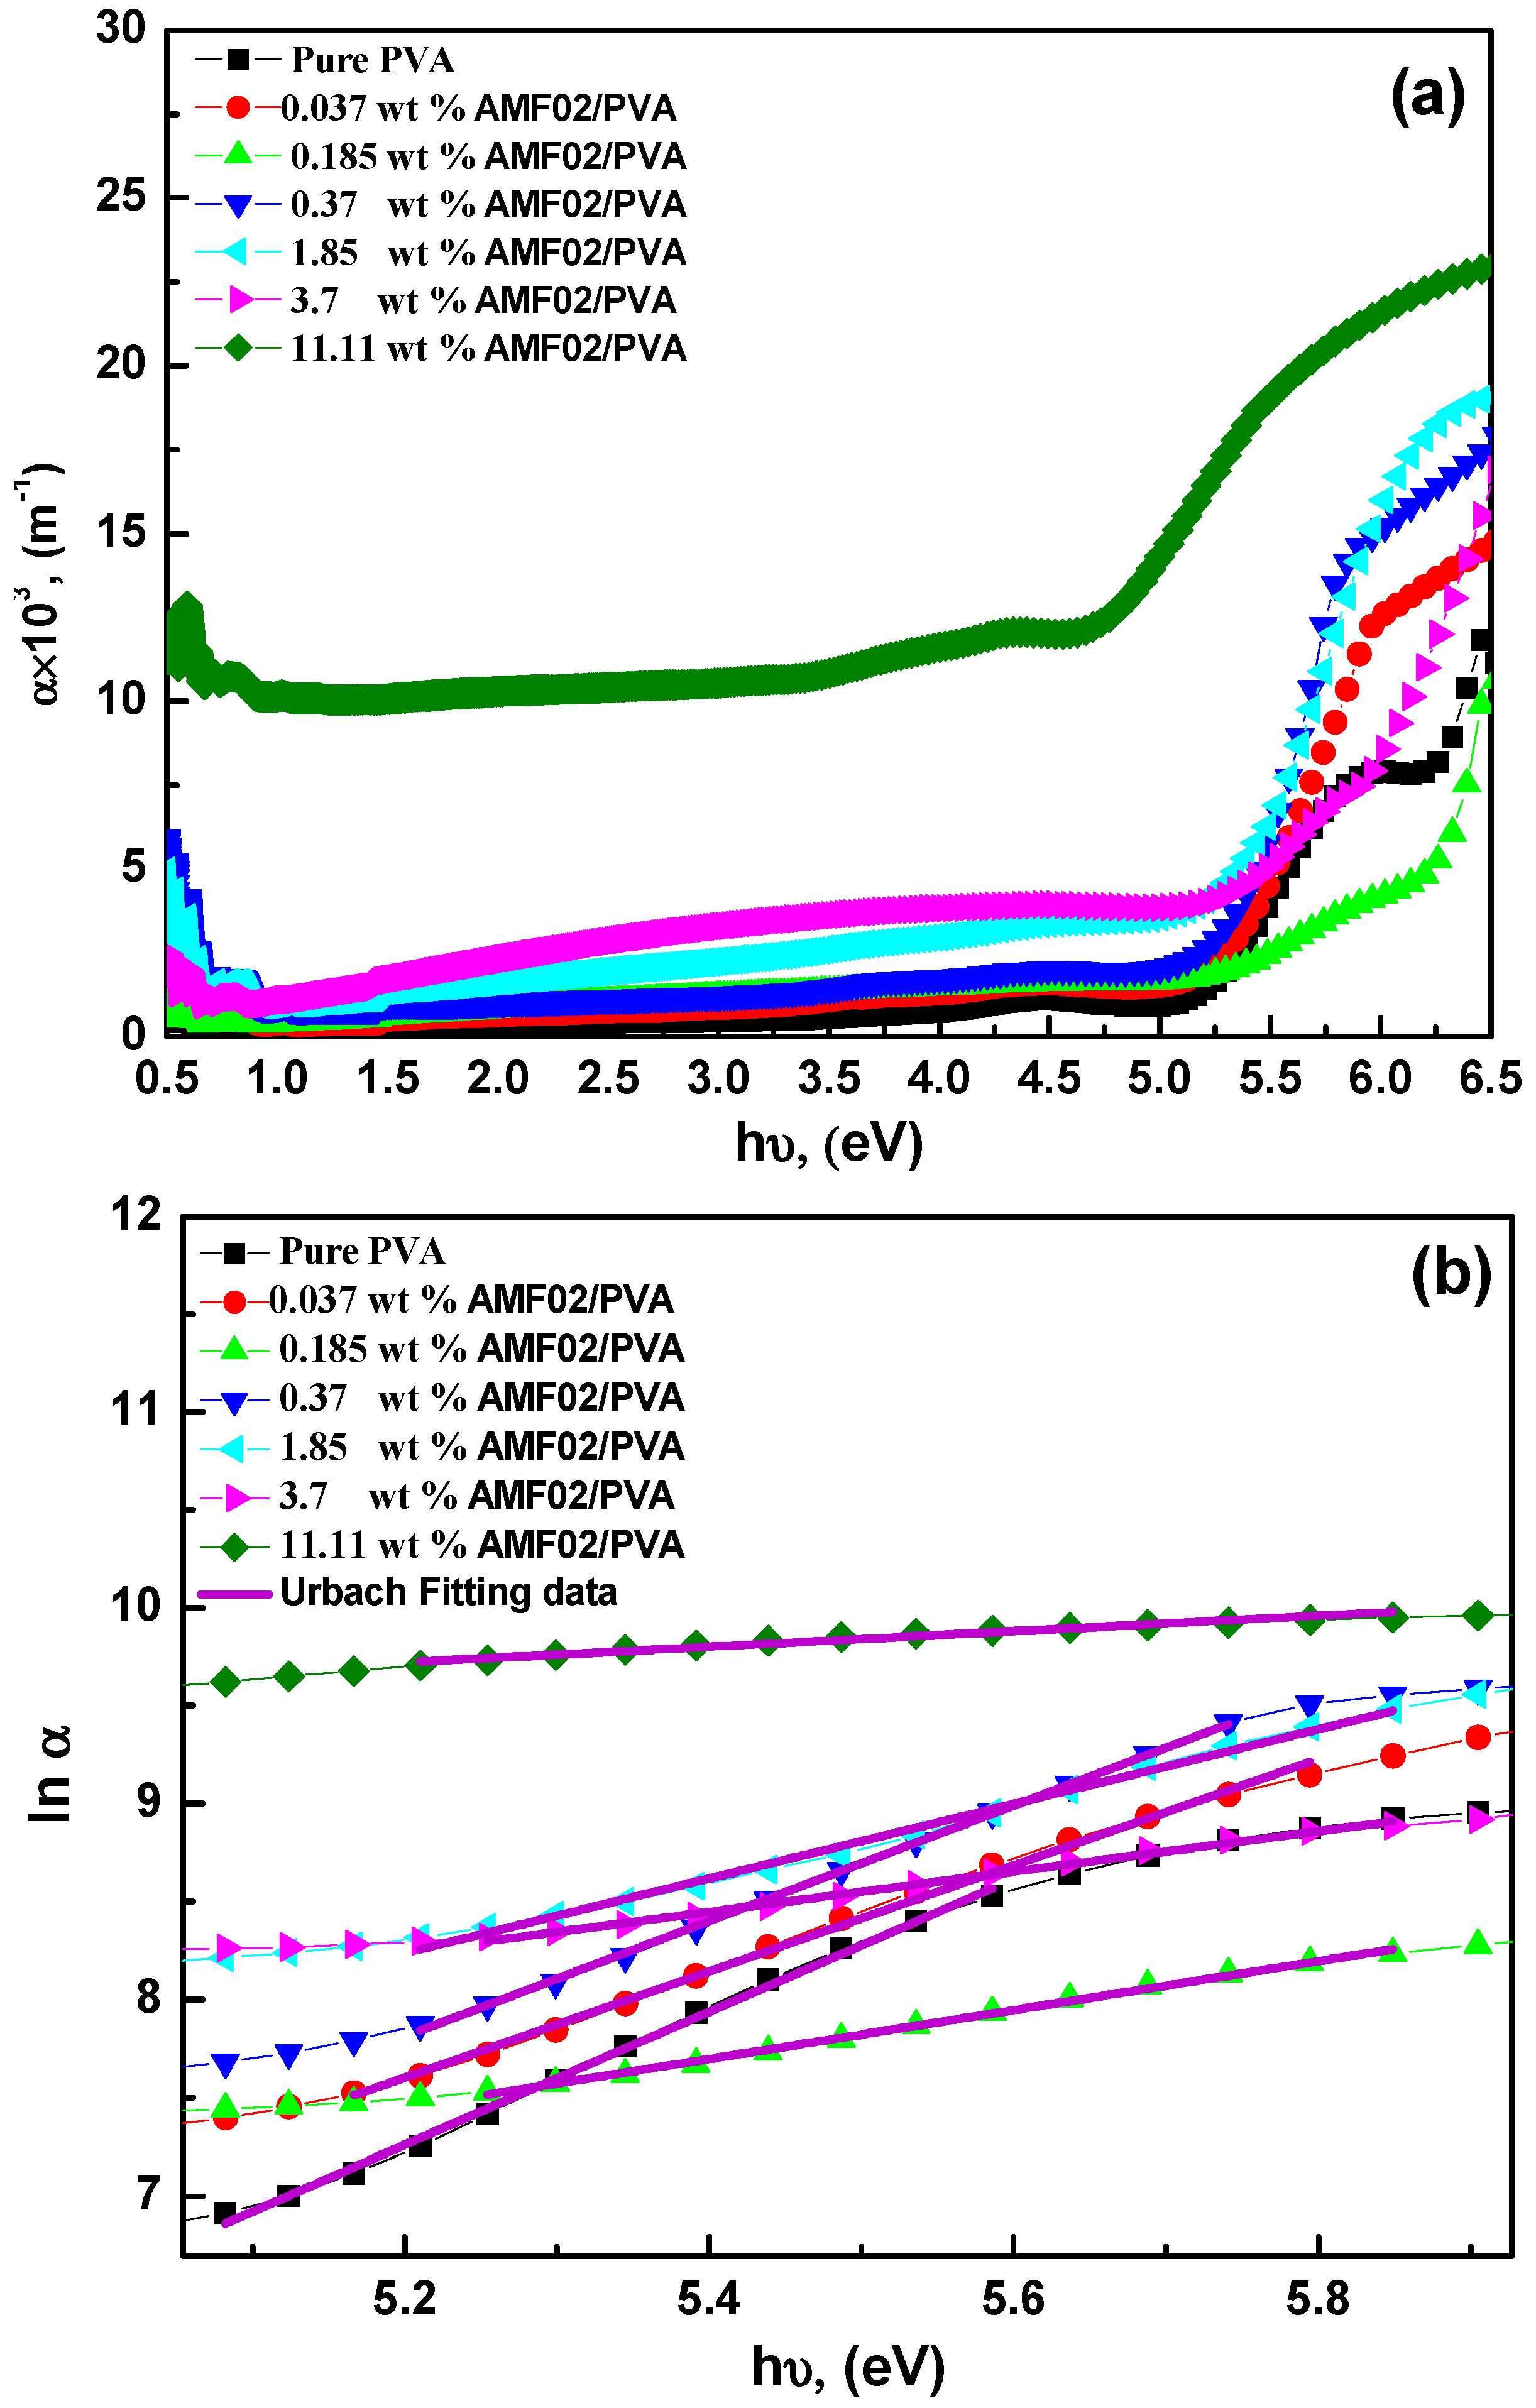
3.2. Optical Transmittance, Absorption, and Absorption Edge Examination for AMF02/PVA Novel Proton-Conducting Composite Electrolyte Films

The transmittance spectra of pure PVA and PVA-doped AMF02 CEFs are shown in Figure 3a,b. In spectral light, pure PVA film seems to have a high optical transparency of around 90% (see Figure 3a). As can be seen, the absorption coefficient effect causes a reduction in transmittance spectra after the addition of AMF02 salt fillers. The intermolecular bonds between hydroxyl and [NH4+] ions are produced to clarify it. These contribute to the emergence of new levels of energy gaps, with an improvement in AMF02 content [15]. This shows that the AMF02/PVA novel PCCEFs are transparent but well absorbed in the UV zone [21]. The specimen with 11.11 wt% AMF02 salt (see Figure 4) has a negligible absorption region that fluctuates only around 0 and 1 in the spectral range. This result is consistent with the findings of S.B. Aziz et al. [21]. The drop in transmission for innovative PCCEFs is due to a shift in the optical band gap caused by the polymer structure. Figure 4 depicts the optical UV-Vis-NIR absorption spectra of pure PVA and AMF02/ PVA new proton-conducting CEFs. It is apparent here that, as the concentration of AMF02 salt filler increases, so does the absorption, in line with the told Bi3TiO7 semiconductor [22]. This suggests that an electronic interaction between ions and PVA molecule [NH4+] ions activity in the new PCCEFs occurs as the AMF02 concentration increases [23].
Urbach’s formula defines α ( υ ) values at the lower absorption coefficient level α ( υ ) [24]:
α ( h υ ) = α o exp h υ E U
where α o , E U , and () are constants, the Urbach’s band lines energy, and photon energy, respectively. The proportion of power absorbed within a medium unit length is defined as a film’s absorption coefficient. The absorption coefficient is intended as [25]:
α = 2.303 A b s . t
where t is the film thickness. The absorption coefficient varies in the proportion to the light () incident and the Urbach energy (lnα vs. photon energy ()) plot for CEFs exemplified in Figure 5a,b. The absorption edge of the doped novel PCCEFs shifts toward the lower incident light energy. The measurement of optical absorption spectra can provide important information on the energy bandgap in the crystalline band structure and non-crystalline materials [26]. The redshift towards lower incoming light energy reveals a reduction in the optical bandgap of the doped new PCCEFs. The taken band tails energy using Urbach fitting standards data is presented in Figure 5b, and the obtained parameters are presented in Table 1. The major alteration in the band tail’s energy values proves a change in the doped novel PCCEFs band structure. The increase in Urbach energy indicates that the amorphous phase has improved, and AMF02 salt doping has created trapped conditions. The values of E U for the prepared samples are consistent with the value of previous workers [9,15]. The optical band gap ( E g ) is the most imperative property of inorganic and inorganic materials. Tauc’s model can be used to calculate the films’ bandgap energy E g [27,28]:
α h υ = B h υ E g m
where B, hυ, and Eg are quantities. The value m = 1/2 for indirect and m = 2 for directly permitted transitions. The outcomes were obtained by extending the linear component of Figure 6a,b; the standards for the indirect and direct band gaps are listed in Table 1. The prepared films’ indirect bandgap (Eg(ind)) was condensed from 5.08 eV to 2.86 eV by increasing the doping AMF02 salt. Meanwhile, the direct bandgap values vary from 5.25 eV for pure PVA film and 4.58 eV for 11.11 wt% of AMF02 film. The drop in Eg parameters is caused by the generation of the energy levels of the highest occupied (HOMOs) molecular orbitals and lowest unoccupied (LUMOs) molecular orbitals, growing the bandgap transition’s density of localized states [28]. These flaws are liable for the bandgap’s confined states, corresponding to ailment levels in larger experiments. This is connected to the formation of energy levels in films by boosting the salt doings [29,30,31,32]. The extinction coefficient ( k ) estimates the light fraction lost owed to the dispersal and absorption of the medium per unit distance [33]. The k λ is displayed in Figure 7. It was estimated using the following relation for AMF02/PVA novel PCCEFs [33]:
k = α λ 4 π
The rising AMF02 salt content increased the extinction coefficient at high wavelengths. The main disadvantage of any film structure for optical applications is indeed the high degree to which refractive indices materials are required when blended [21]. At high wavelengths, the scattering of the extinction coefficient can be explained as follows: photons with a low frequency, or photons with low energy, are referred to as “high wavelength.” These photons cannot transfer electrons from the valence band to the conductive strip and may lose energy due to scattering [21].

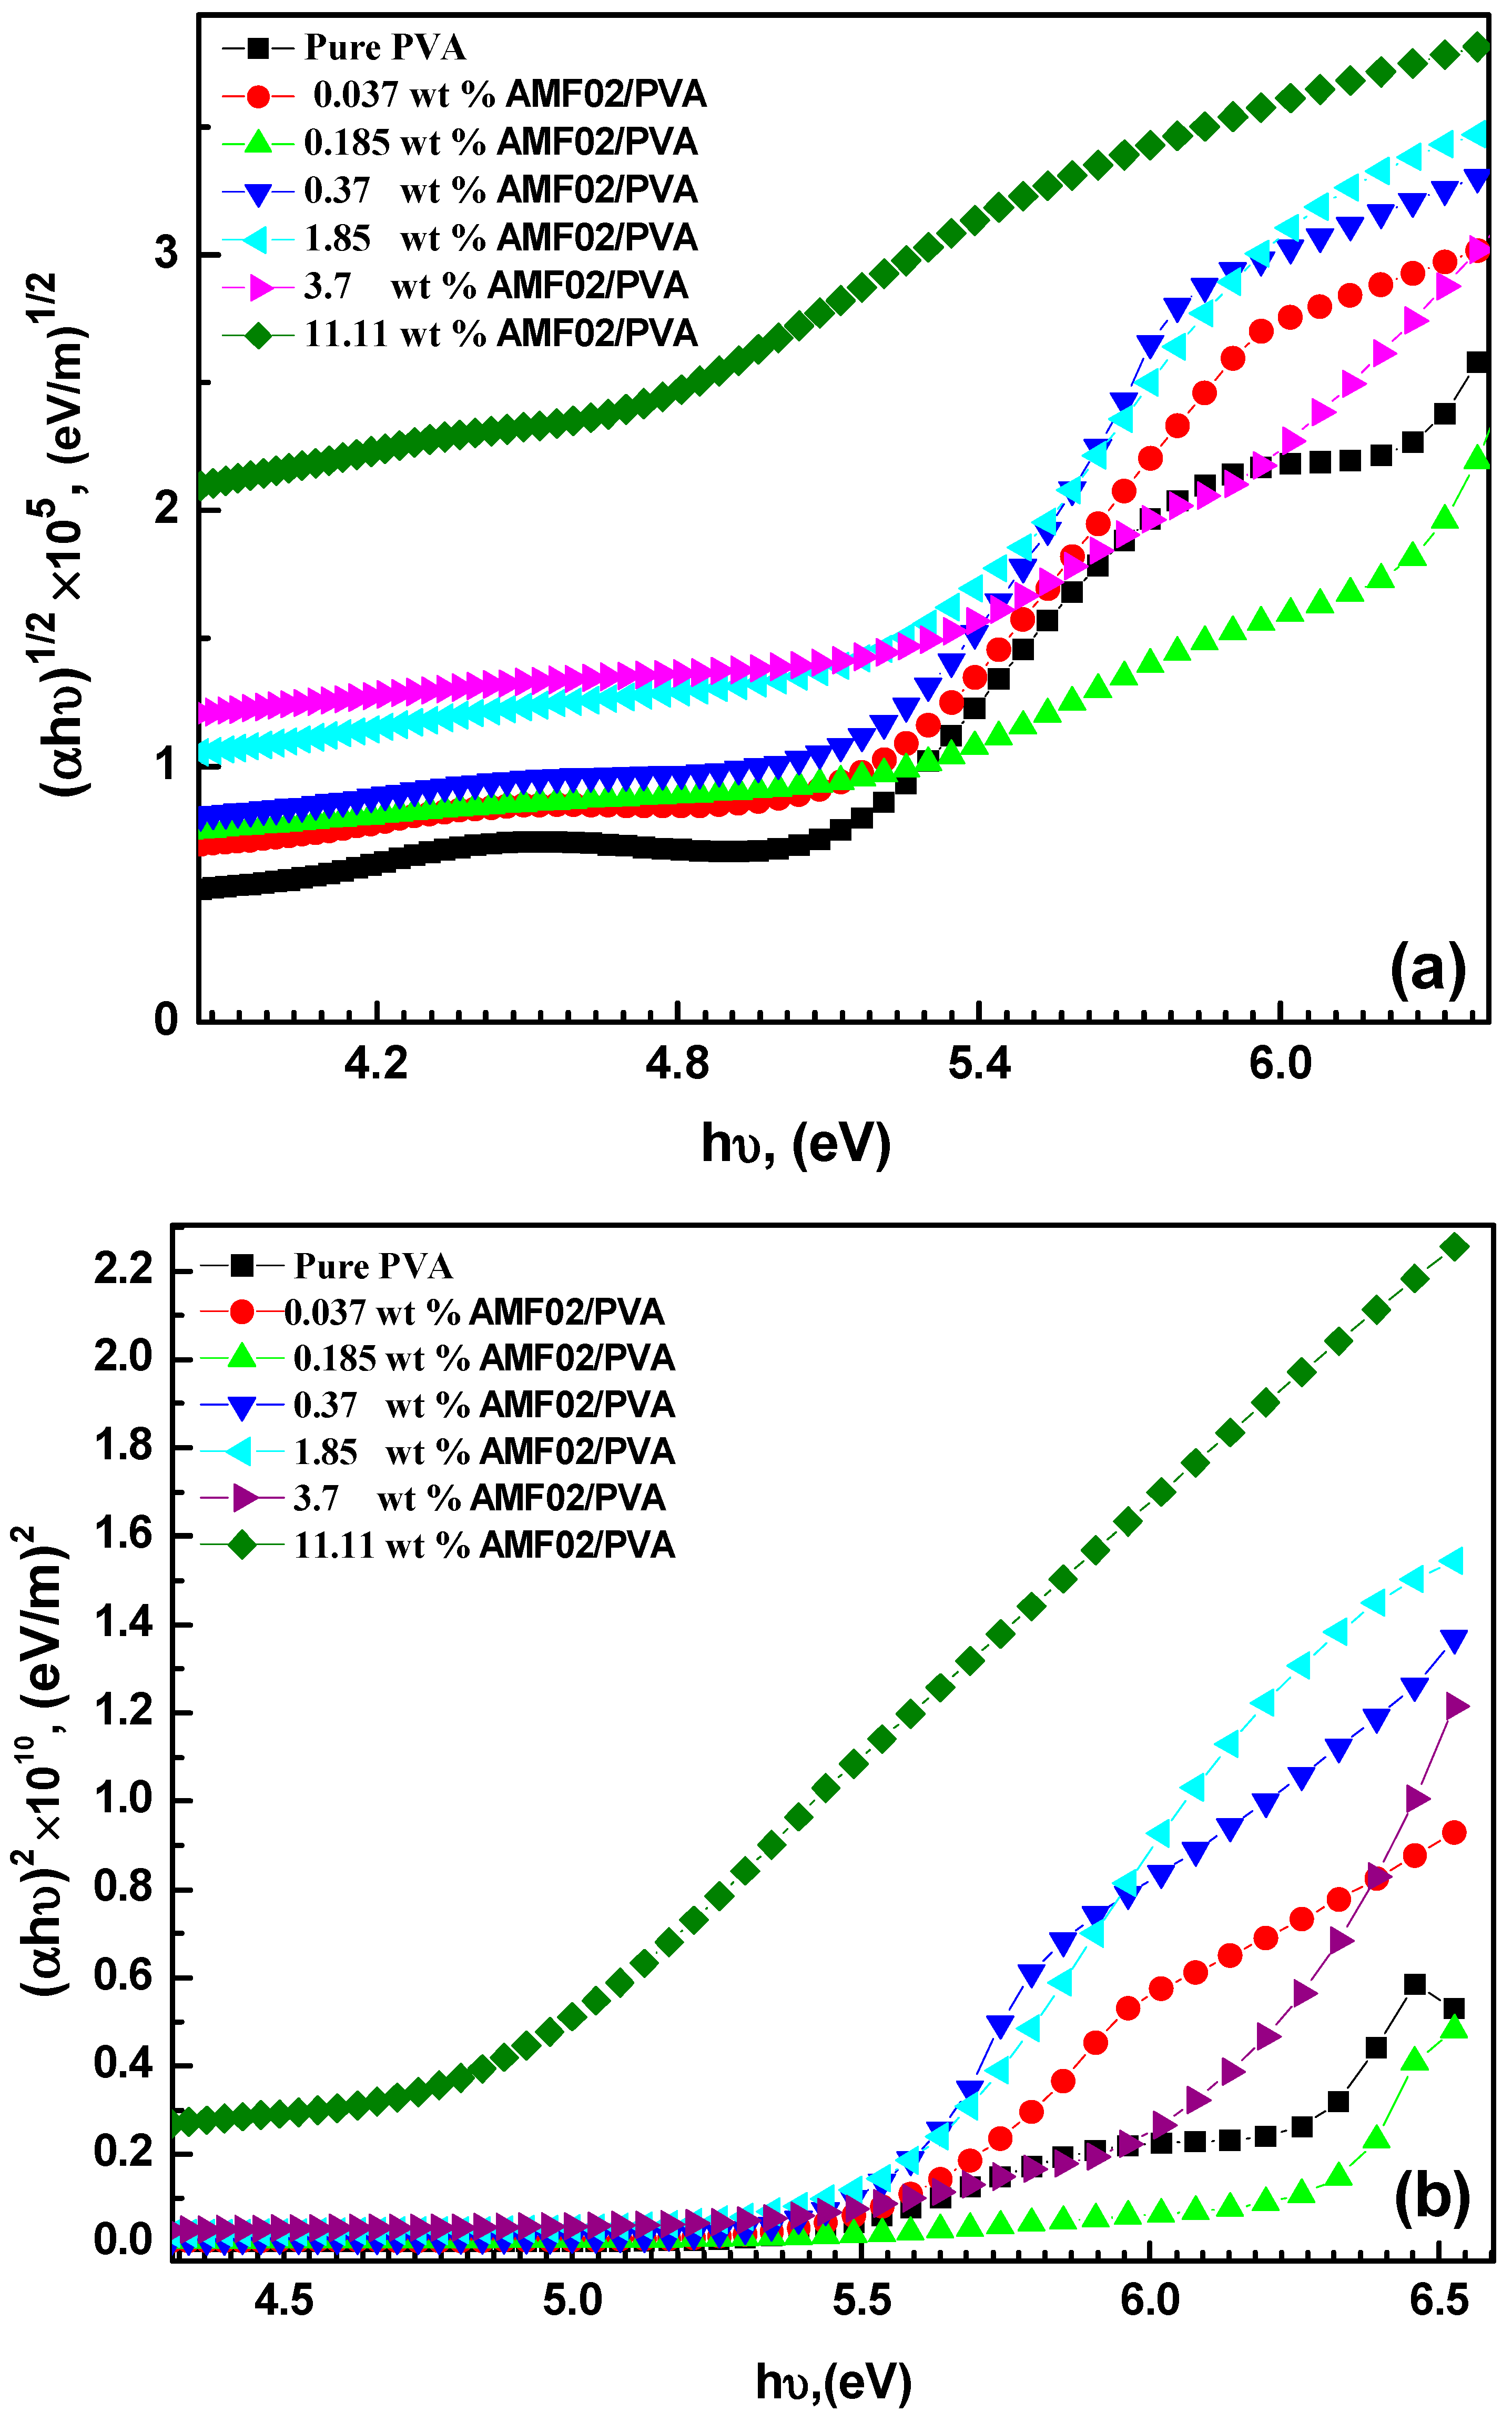
3.3. Bandgap Energy and the Refractive Index Relationships for AMF02/PVA Novel PCCEFs

Based on E g d / i n d , the Moss relationship is calculated as follows [34]:
n 4 E g   d / i n d = K ,     w i t h     K = 95   eV
where n and   E g d / i n d are the refractive index fingers and the direct/indirect energy gaps, respectively. Using the Moss relation for direct/indirect band gaps, the n values of the films were obtained with the AMF02 salt filler effect. The obtained n values displayed in Figure 8a,b are denoted in Table 2A,B. By analyzing the calculated refractive index, the n value obtained for the direct bandgap (Table 2B) varies from 2.062 (for pure PVA) to 2.134 (for 11.11 wt% of AMF02 salt). Meanwhile, for the indirect bandgap (Table 2A), the n values change from 2.079 (for the pure PVA) to 2.4 (for 11.11 wt% of AMF02 salt). Our calculated refractive index values are presented in Figure 8a,b. For the Moss relation, the refractive index increases with AMF02 salt filler for both bandgap transitions attributed to the reflection appropriate to the set free carrier generation [9,35]. The Reddy’s relation is calculated from equation [36]:
E g   i n d e n = 36.3
With Reddy’s relation and for both indirect and indirect bandgap transition, the obtained n values for AMF02/PVA novel PCCEFs are illustrated in Figure 8a,b. The gained n values are denoted in Table 2A,B. The refractive index increases for indirect bandgap transition (i.e., for direct bandgap) and rises in AMF02 salt filler. Similar results were reported by other works [9,37]. The attributes of the acquired refractive indices disagree with each relation, which is advantageous considering the intention for the AMF02/PVA new PCCEFs to be potential optical device candidates. The Anani et al. relationship has recently been computed using the equation [38]:
n 4 = 1 + A E g d   o r   i n d 2 ,
where A is an analytically steady approximates to 40.8 eV. The n values calculated with Anani’s relation for the AMF02/PVA novel PCCEFs for direct and indirect bandgap transitions are shown in Figure 8a,b. Their calculated values are denoted in Table 2A,B. Kumar–Singh’s relation is computed from [39]:
n = 3.3668 E g 0.32234
The n values for AMF02/PVA novel proton-conducting CEFs were divided with Kumar–Singh’s correlation. The grown n amounts shown in Figure 8a,b are embodied in Table 2A,B. From the estimates in the tables, the n value changes as the AMF02 salt fillers are increased. For all the binary compound materials, Herve and Vandamme propose that the refractive index is [40]:
n = 1 + A E d   o r   i n d + B 2 1 / 2
where A is the hydrogen ionization energy identical to 13.6 eV, and B is equal to 3.4 eV. As shown in Figure 8a and for each relation, the refractive index strengthened linearly with expanding AMF02 salt content. The application of the CEFs as an anti-reflective coating will be expanded as the refractive index rises. Therefore, M. Cabuk et al. [41] are correct. The findings indicate that the offered films are mostly beneficial for optoelectronic devices.

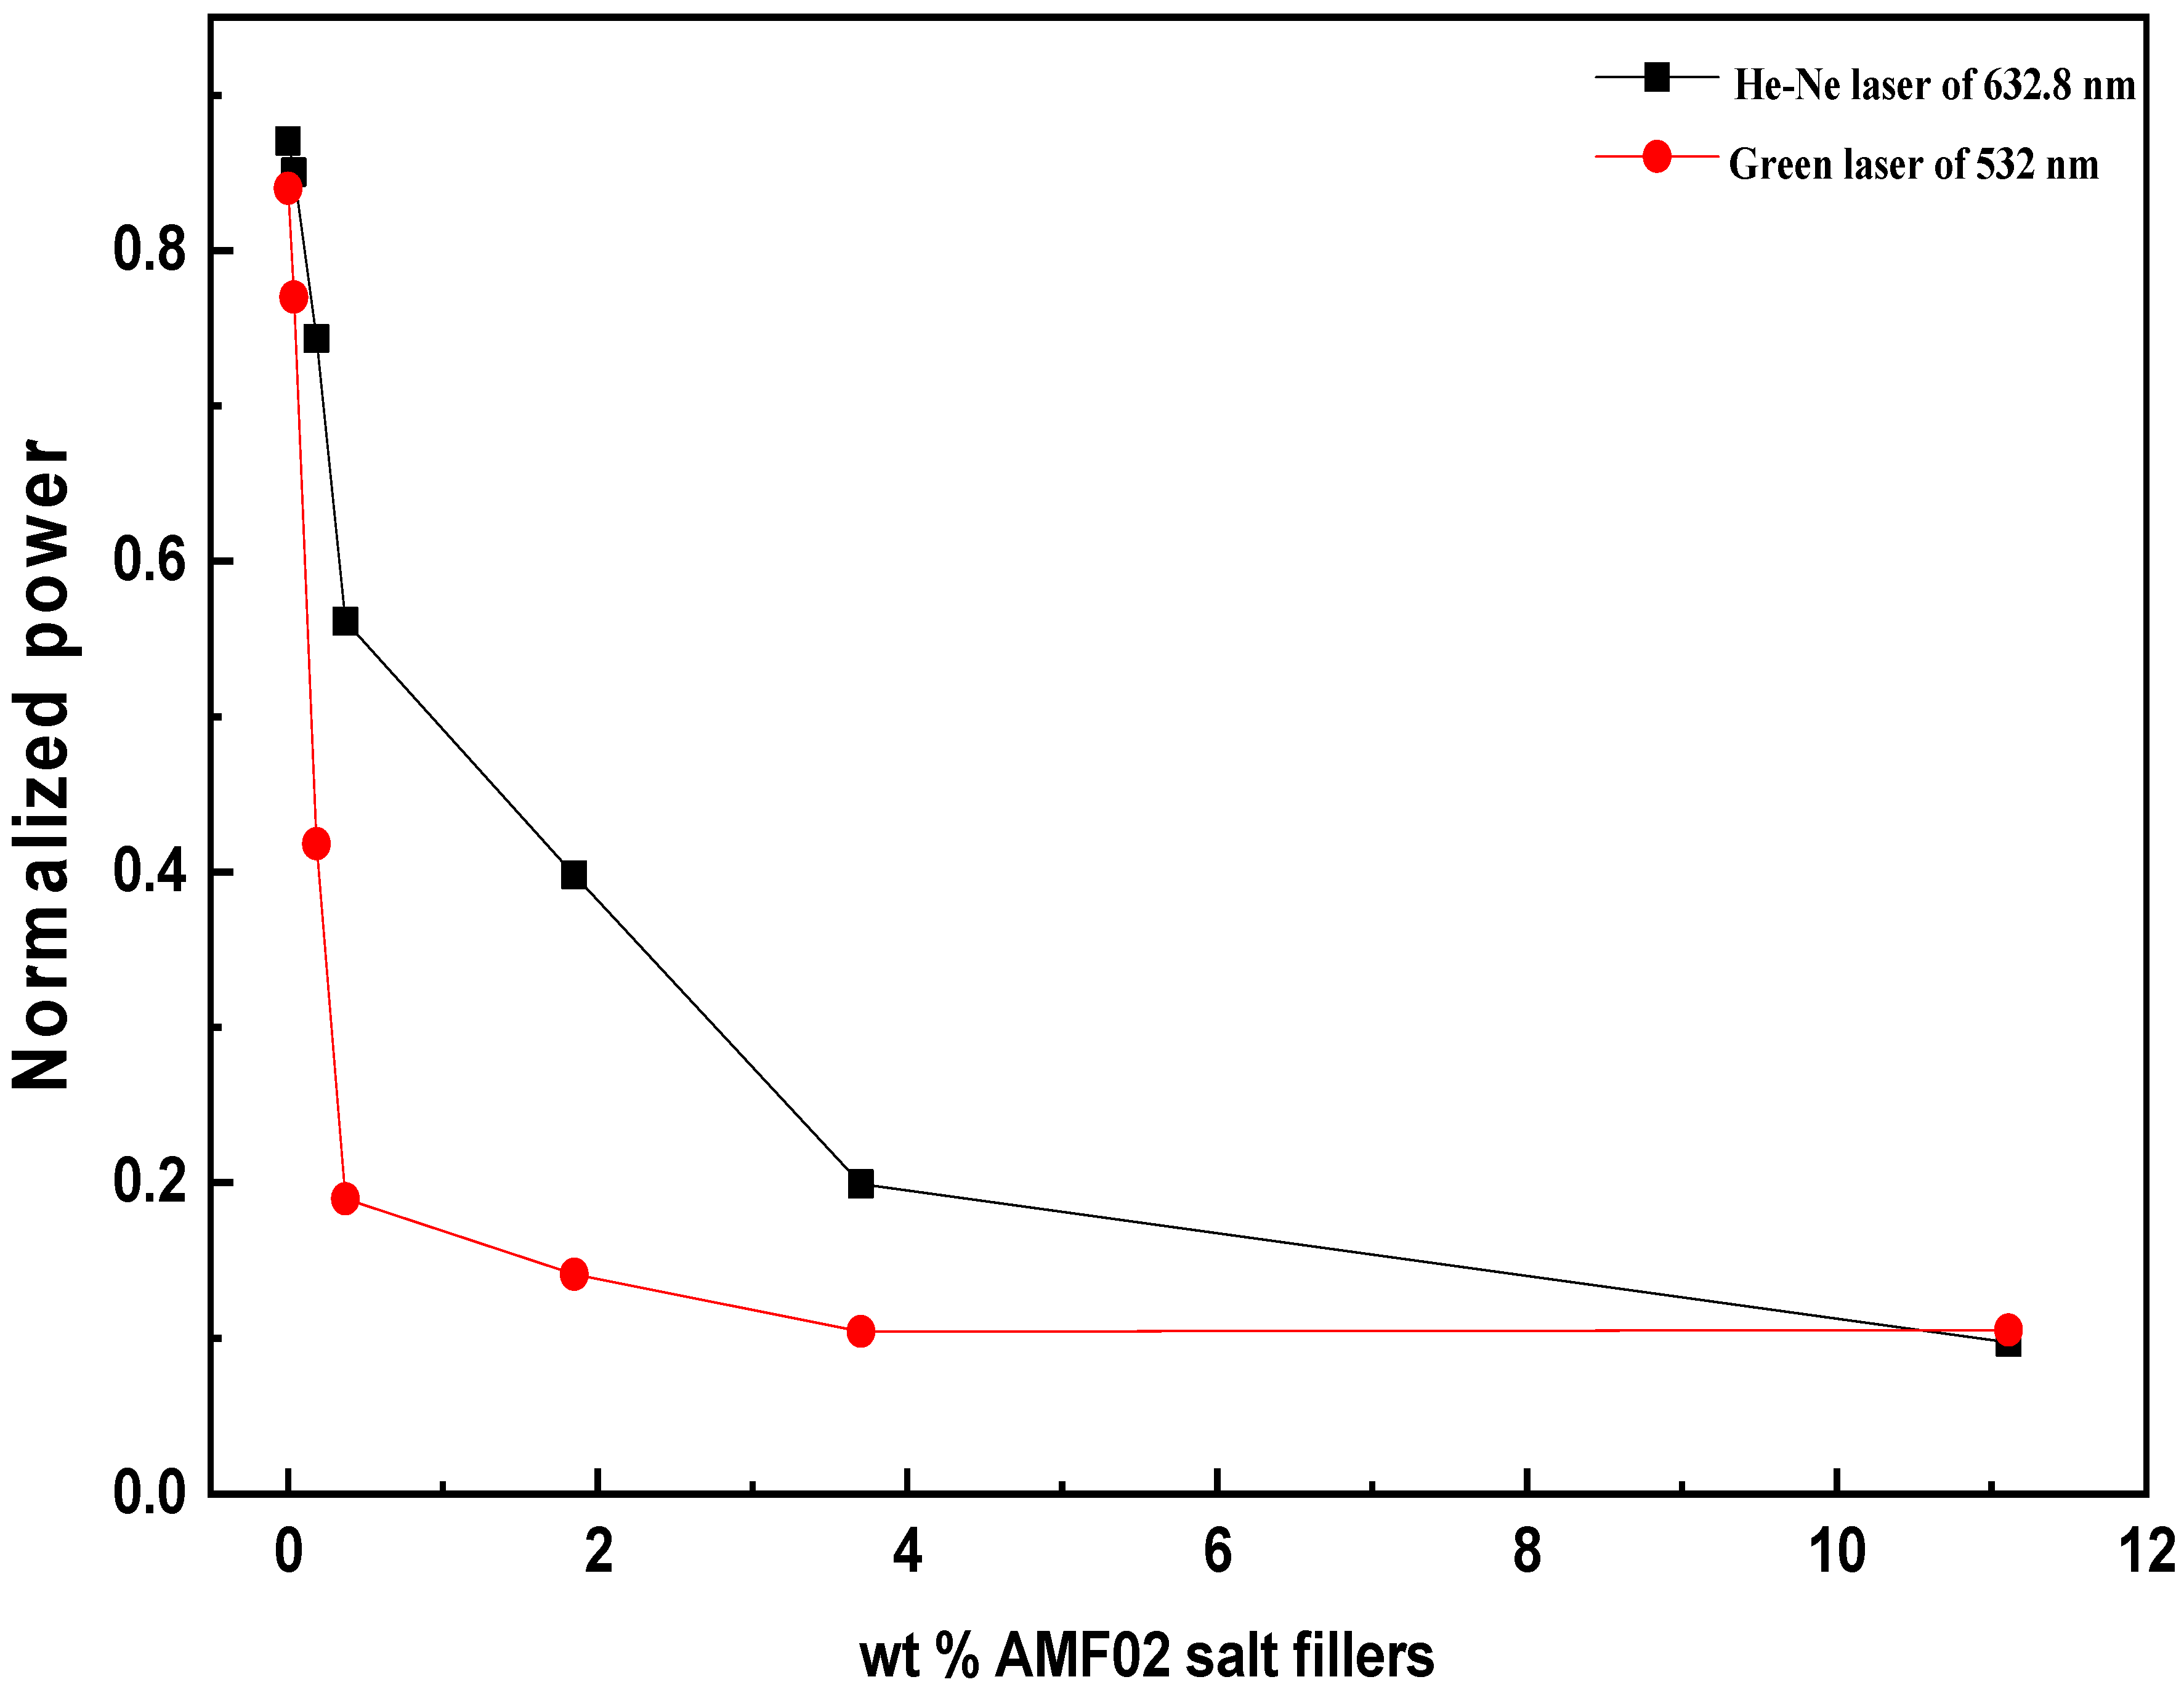
3.4. Laser Power Attenuation Analysis for AMF02/PVA Novel PCCEFs

The standard curve (shown in Figure 9) denotes how the normalizing power is related to the AMF02 salt concentration. Analyzing the data of this figure, the pure PVA film denoted a high normalizing power for the two laser sources used [9]. When applied to the red He-Ne laser, the pure PVA film’s obtained values and AMF02/PVA novel proton-conducting CEFs are higher than the applied green laser beam. Previously, similar laser characteristics were found when the PVA matrix was doped with a high concentration of CuCl2 [42] salt, BiI3 nanoparticles [43], and CdI2 salt filler [44]. The suggested novel PCCEFs were used to assess efficient CUT-OFF laser filters, and attenuate and limit the laser power devices [45].

3.5. Frequency Necessity of Electric Permittivity ε′, Dielectric Loss ε″, and Loss Tangent tan δ for AMF02/PVA Novel PCCEFs

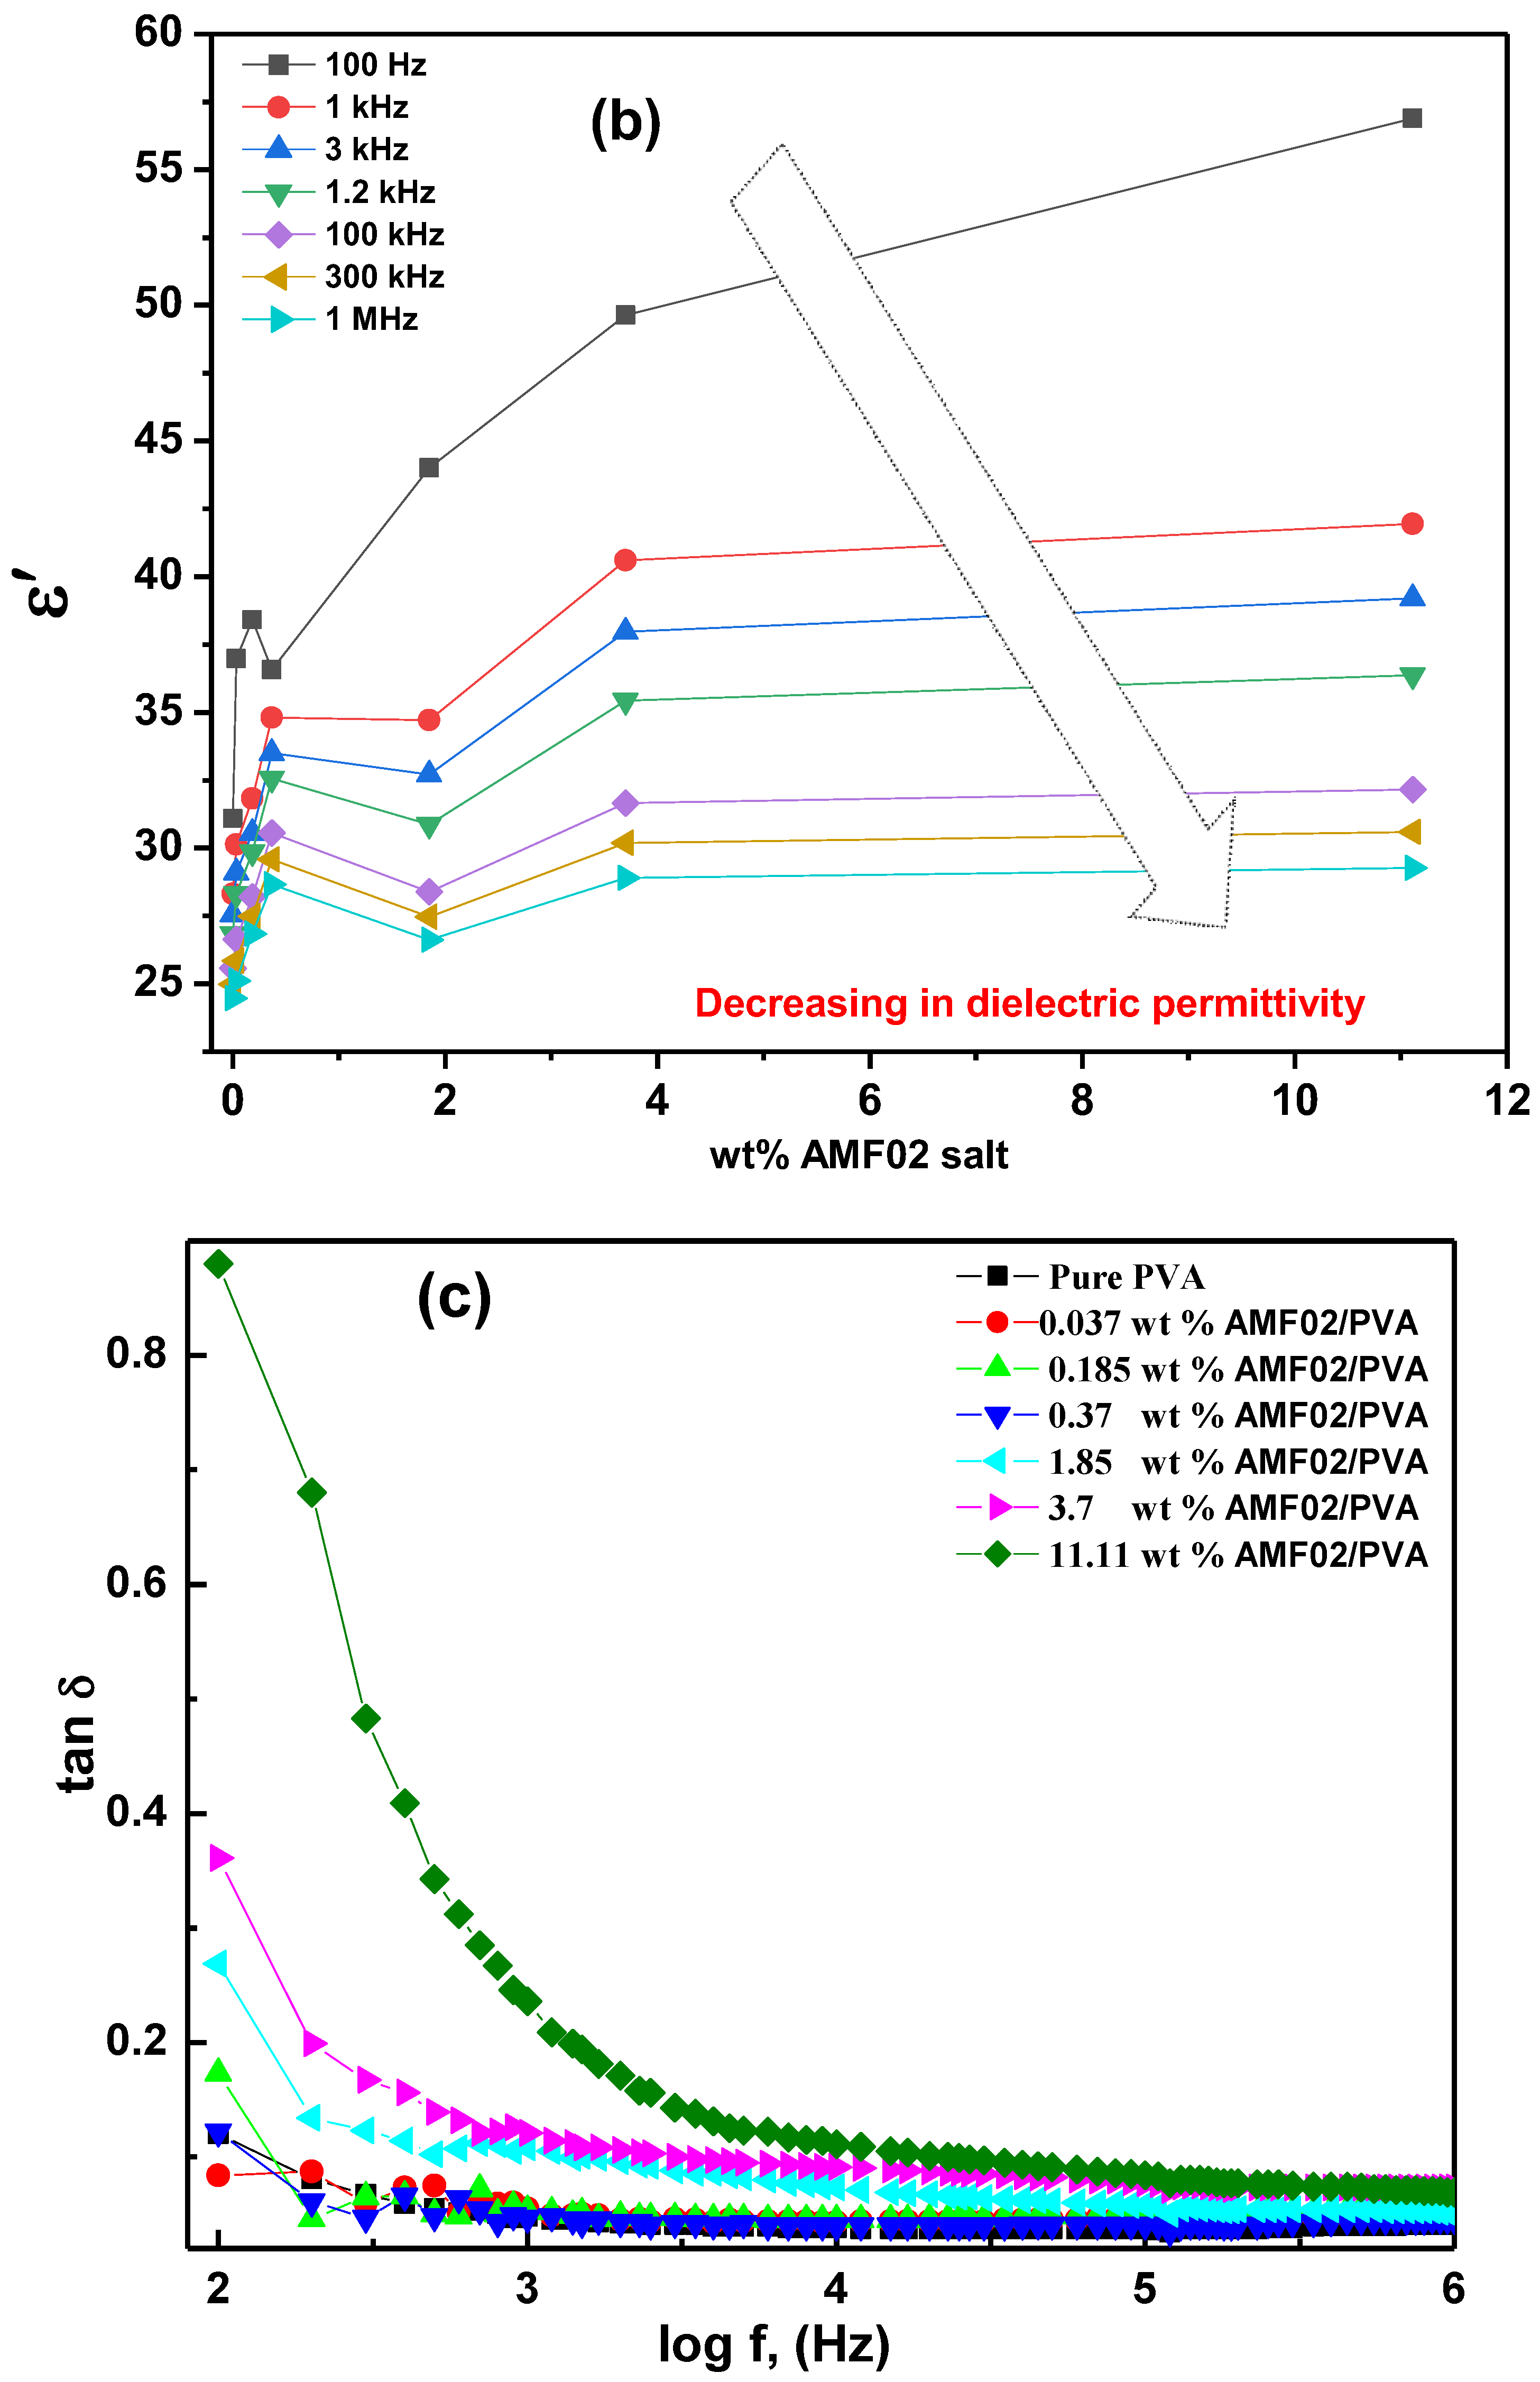
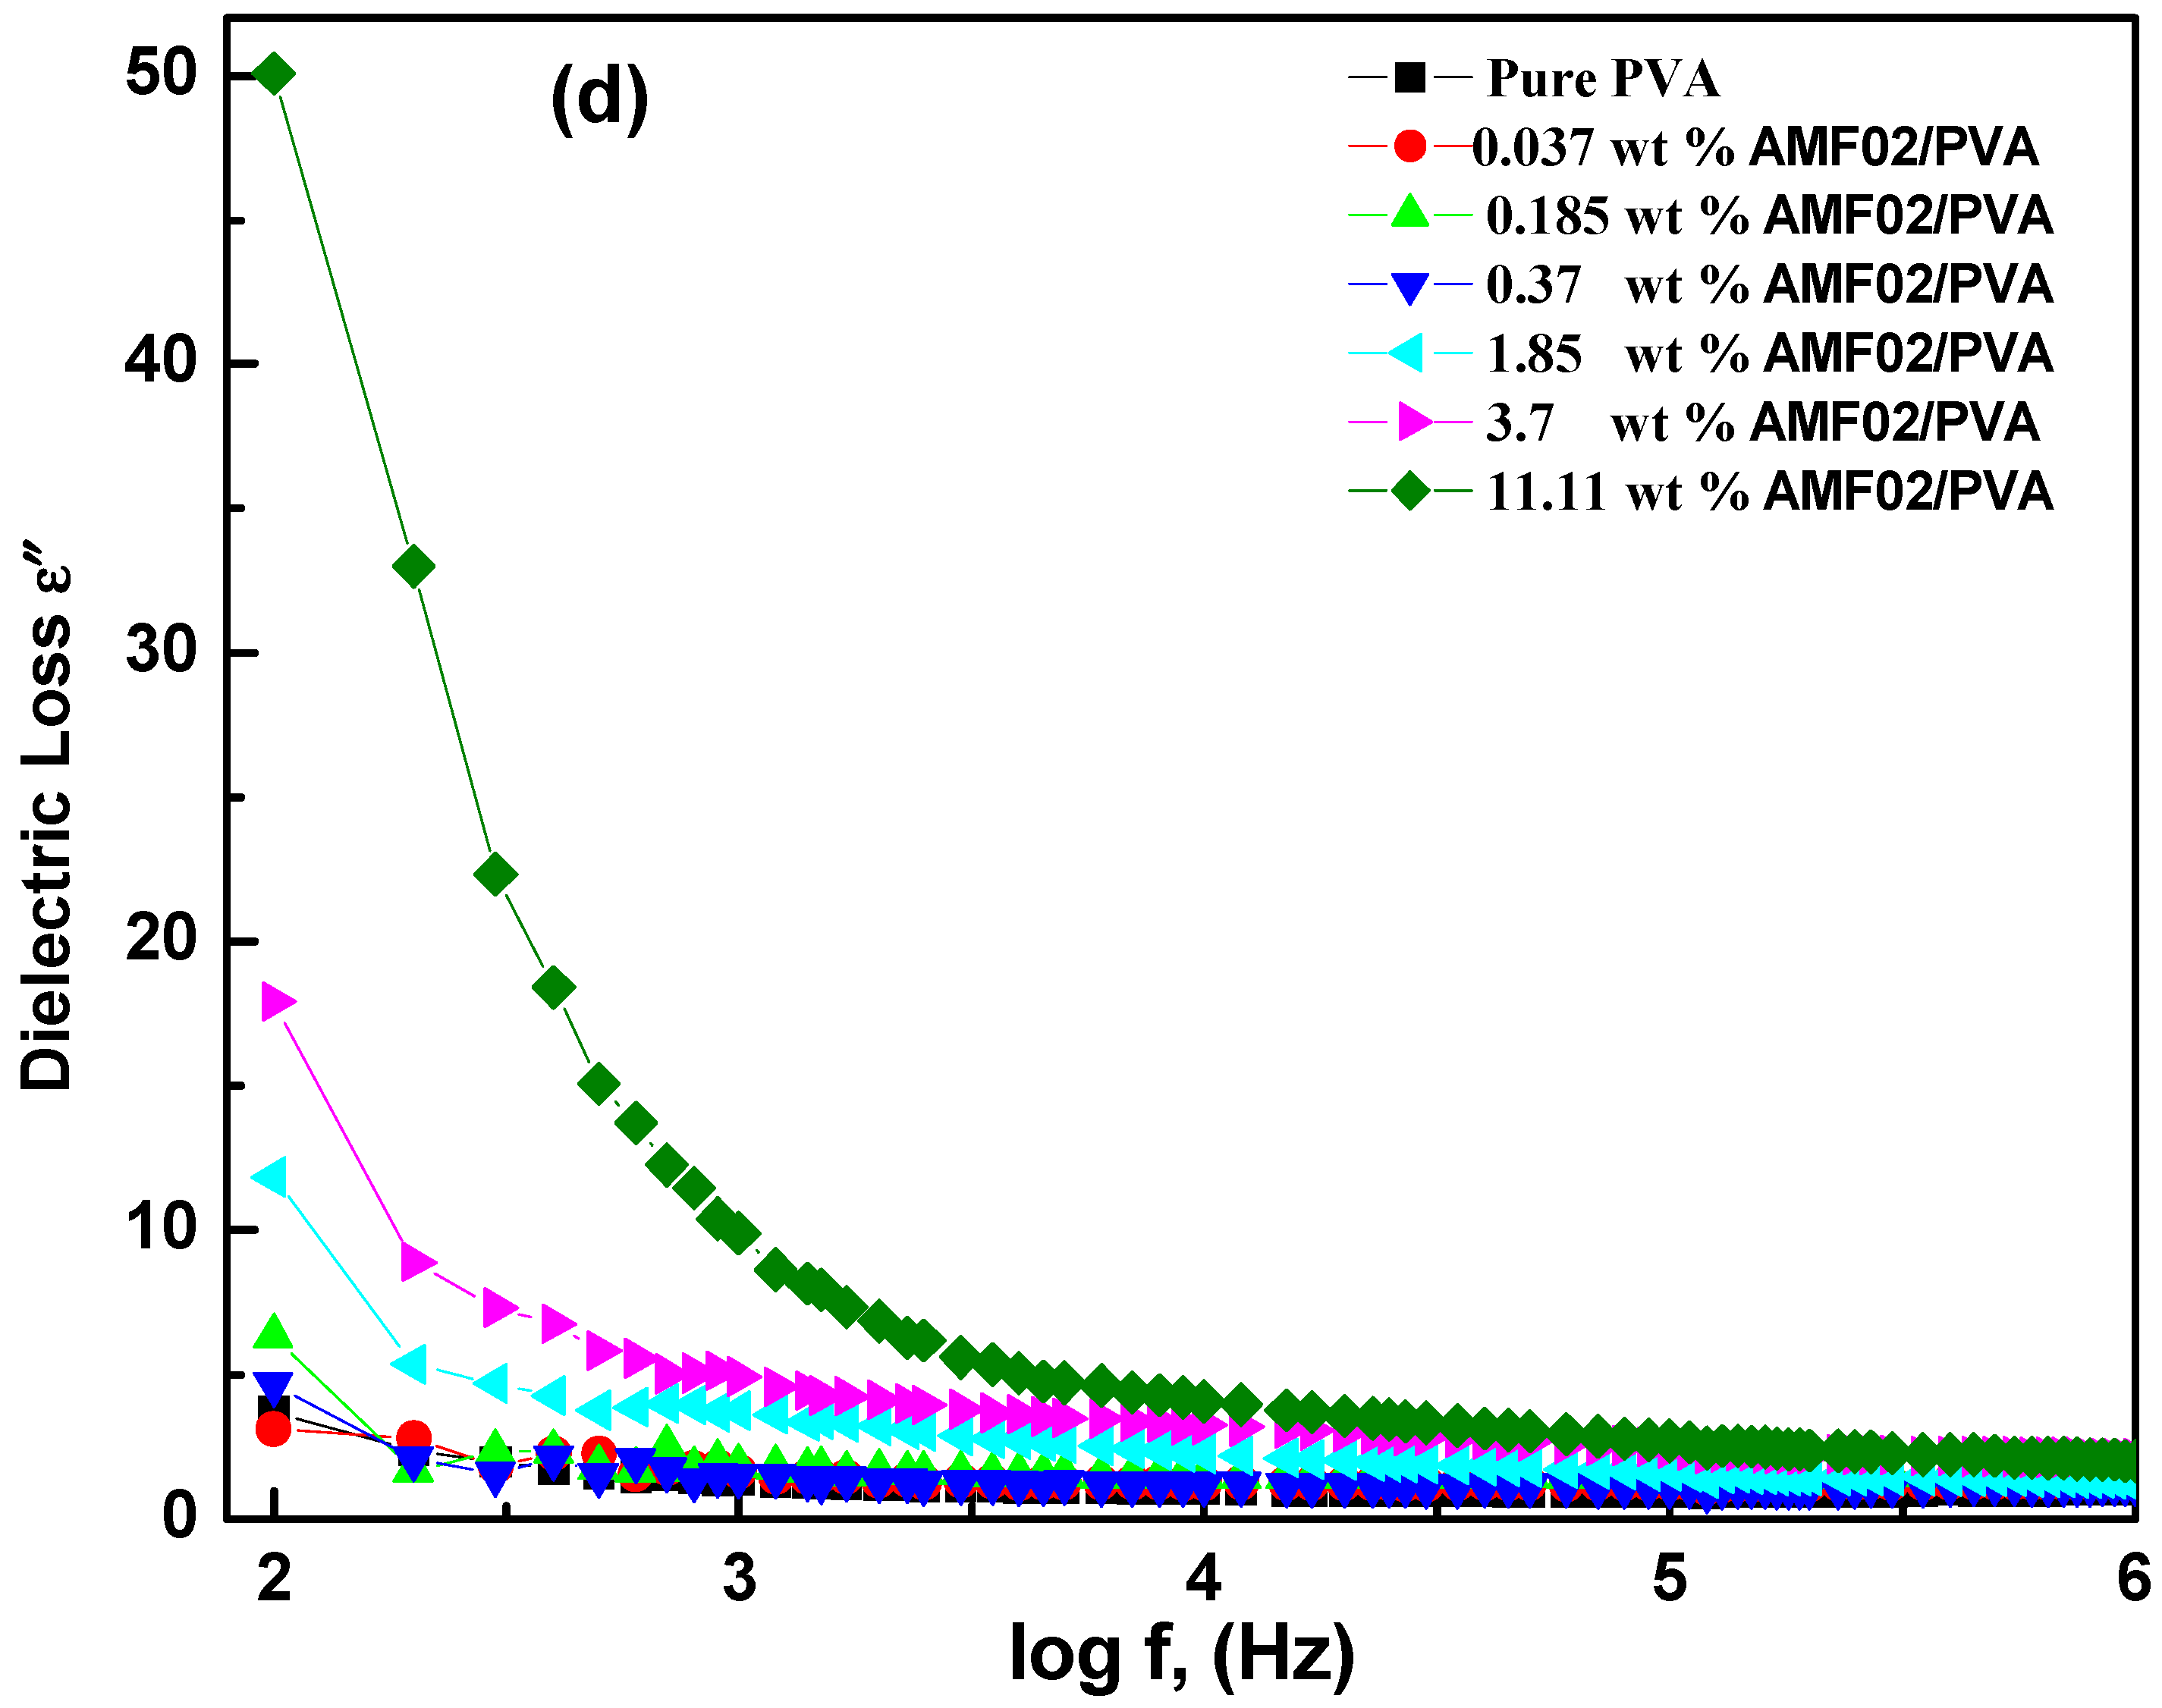
3.5.1. Frequency Dependence of ε′, ε″, and tan δ at Various AMF02 Salt Fillers

The real and imaginary components of the complex (ɛ*) permittivity and complex (M*) electric module were determined to make use of the relations between the real (Z′) components and the (Z″) imaginary components of the complex (Z*) impedance [46,47].
ε = 1 ω C 0 Z Z 2 + Z 2 ,   ε = 1 ω c 0 Z Z 2 + Z 2 ,
M = ε ε 2 + ε 2 = ω C 0 Z ,   M = ε ε 2 + ε 2 = ω C 0 Z ,
ε = ε tan δ
where M real and M imaginary are elements of M*, and where the ε and the ε , respectively, are dielectric permittivity and dielectric loss. In this case, C 0 = ε 0 A t ,   indicates the capacitance of vacuum (where the thickness t and area A are of the AMF02/PVA novel PCCEFs), and ω = 2πf, where ω is the angular frequency, and f is the frequency in Hertz. The dielectric permittivity ε′ and dielectric loss ε″ frequency dependency for AMF02/PVA novel PCCEF samples integrated at various AMF02 salt concentration levels are illustrated in Figure 10a,d. It should be noticed that, relative to other tests, the device with 11.11 wt% AMF02/PVA film exhibits the highest dielectric permittivity. This performance can be enlightened based on decreasing electrical polarization owed to decreasing directional polarization (dipole retort) and ionic polarization (extension and shrinkage of oaths between ions) in the AMF02/PVA novel PCCEF samples. Therefore, dielectric permittivity decreases due to the loose [NH4+] ion carriers. This can be correlated with the predominance of the ε and the ε due to the amorphous regions in the structure. As a result, this is reported in other works [48]. Due to the device’s high-loading carrier and amorphous aspect, the rise in dielectric permittivity can be explained [49]. According to Figure 10a,d, mobile ions gather at the conductor and electrolyte interface for a while in a soft-frequency area, indicating an electric reversal. The ε and the ε   are obtained. Nevertheless, a rapid regular electrical field reversal occurs at the high-frequency zone, excluding ionic diffusion in the pitch direction. In addition, polarization leads to decreases owing to the aggregation of the load, and thus decreases both ε′ and ε″ [50]. C.S. Ramya et al. [51] similarly demonstrated that the upsurge in dielectric permittivity specifies a fractional rise in the charge carriers’ unique proton-conducting composite electrolyte layer. The variation of ɛ’ values versus the wt% of AMF02 salt levels at selected applied frequencies is represented in Figure 10b. As demonstrated, the dielectric permittivity increases with the picked frequency and decreases with the wt% of AMF02 salt levels in the novel proton composite electrolyte films. This increase in ε′ can increase polar group mobility and sample carrier concentration, commonly observed in polar dielectrics [50]. To understand the relaxation processes deeply, tan δ data vs. the applied frequency at various AMF02 salt fillers was plotted for the AMF02/PVA CEFs, as shown in Figure 10c. It is critical to remember that only initial ε″ peaks with a sharper character have been recorded at high frequencies. The tan δ also decreases with frequency and adds AMF02 salt fillers.

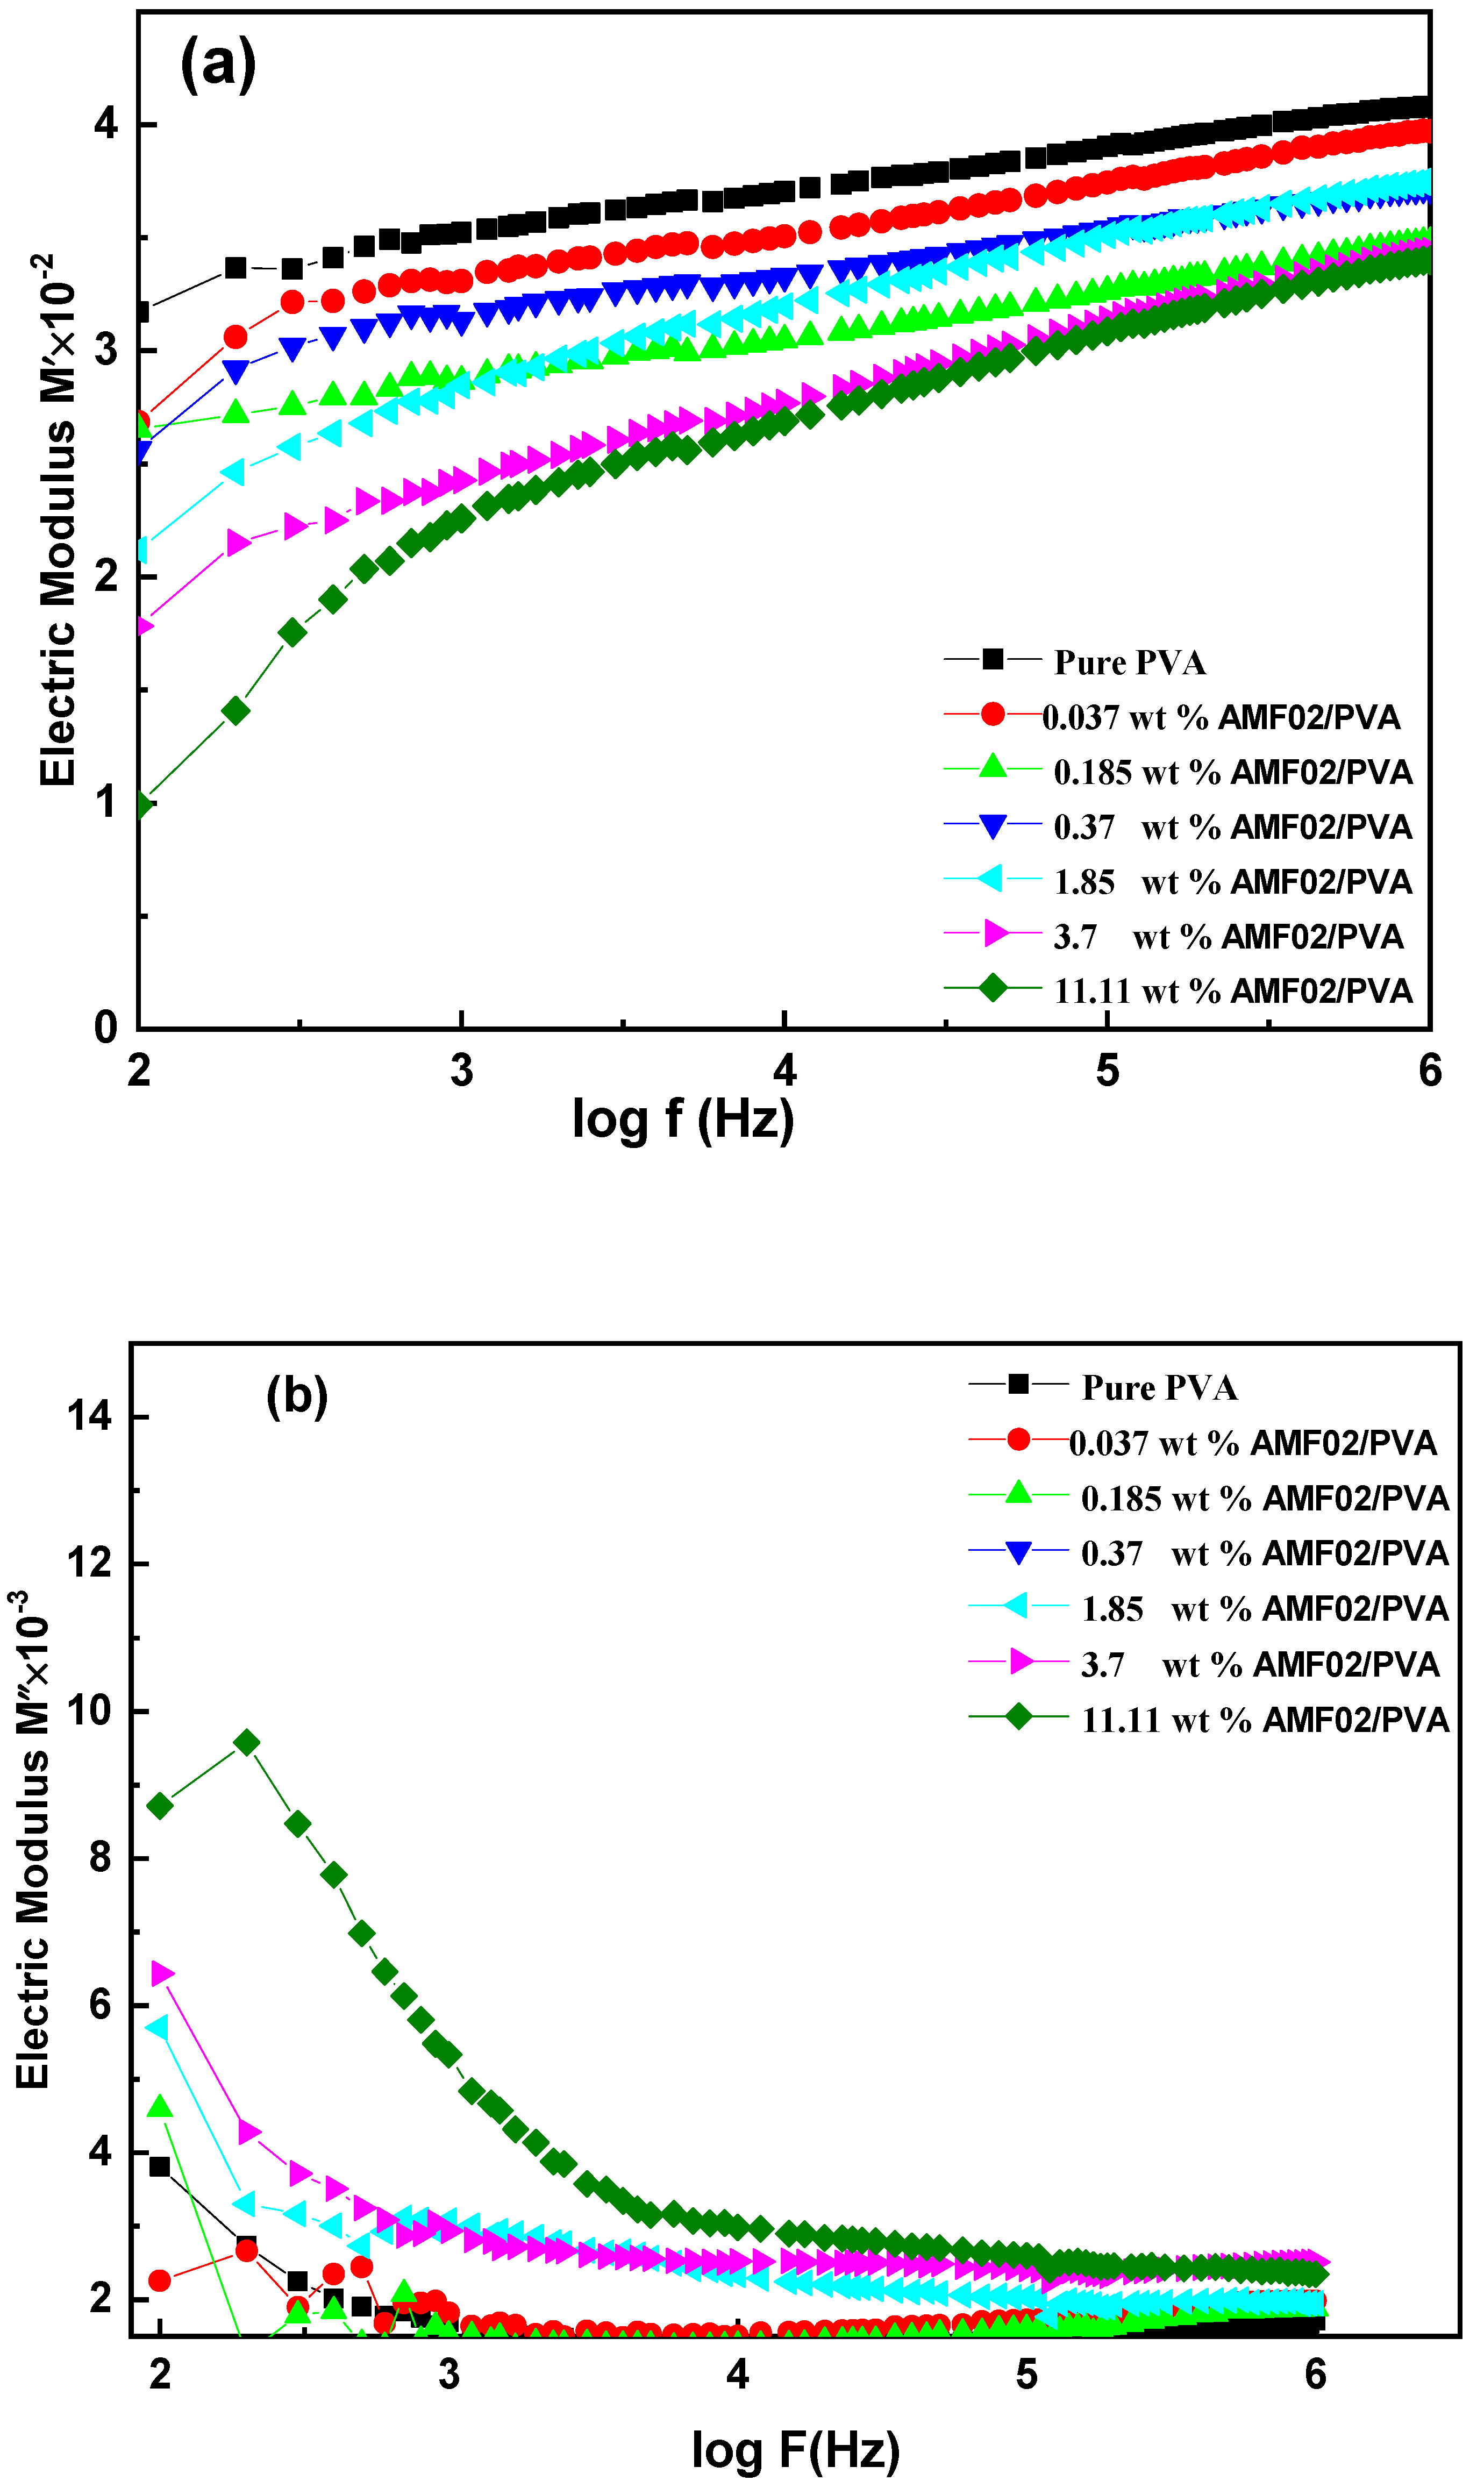
3.5.2. Frequency Dependence of Electric Modulus Analysis at Various AMF02 Salt Fillers

For all composite electrolyte film samples, and at room temperature [52,53], Figure 11a,b confirms the electric modulus’s real and imaginary elements against the applied frequency. The M′ values are increased through frequency rise, and the highest value in the higher frequency range is achieved. The M″ spectra reveal the highest level of relaxation, confirming the ionic nature of the matter. The low-frequency side of the peak shows long-distance mobility. As shown in Figure 11a, the M′ standards for pure PVA and PVA doped with AMF02 CEFs in the low-frequency region decreased, suggesting electrode polarization elimination. This result agrees with that of M.I. Mohammed et al. [9]. The reduction in M′ values is due to improved AMF02 salt filler resistance to the sample and increased polarization of the electrodes [54]. The removal of a peak in the M′ diagram is because M′ in M* equals ε   in complex permittivity; i.e., M′ epitomizes the material’s aptitude to store energy [9]. In the high-frequency area, a low value of M” is seen because of the large value of the electrode capacitance formation. However, the unique beginning of the emergence peaks is differentiated with increasing AMF02 salt fillers in the low-frequency field. The frequency accompanying each peak is erased towards higher standards of the applied frequency as the AMF02 salt fillers expand.

3.5.3. Frequency Dependence of AC Conductivity

For the tested films, the wt% of AMF02 salt fillers depending on the σac AC conductivity at various frequencies have been studied [55]:
σ T o t a l . A C ω = t Z A
where Z is the leisurely impedance, t is the film thickness, and A is the effective area of AMF02-doped PVA composite electrolyte sheets beneath the top holder electrode. Former research has revealed that the AC frequency conductivity stood utilized to calculate the DC conductivity [56]. By extrapolation of the Y-axis area from the result of the AC conductivity spectrum, the DC conductivity can be planned. As the AC conductivity extends into the higher frequency field, the increasing mobility of the carriers increases as well [44,57,58]. The frequency necessity of the AC conductivity σAC(ω) is shown to take the form [37]:
σ A C ω = B ω S + σ D C ω
where ω is the angular frequency, B is the relentless, s is the frequency exponent, and the DC conductivity of the CEFs is σ D C , respectively. The AC conductivity discrepancy vs. frequency for pure PVA and PVA-doped AMF02 salt fillers CEFs is shown in Figure 12. The conductivity of the CEFs appears to increase with increasing AMF02 concentrations and frequency [35]. The AC conductivity demonstrated dependency as a power relation on the frequency of the applied field. The σDC and s parameter variations are gathered in Table 3. The frequency exponent parameter s obtained using the Jonscher power law, shadowed by the distribution region of AC conductivity, can take the value range of 0 < s   ≤ 1 [59,60,61]. The frequency exponent action governs the primary AC conduction method. Equated to the pure PVA film, adding AMF02 salt filler increases DC conductivity, resulting in a substantially sophisticated number of free ions. This is due to an intensification in the concentration of mobile ions and the charge carrier for the examined sample moving in the nebulous polymer matrix. As a result, conductivity rises [62]. For the composite electrolyte film incorporating 11.11 wt% of AMF02, the chief DC conductivity of 73.205 × 10⁻⁹ (siemens/m) was accomplished. The S parameter value increases slightly after adding AMF02 salt filler to the PVA matrix [63]. The relationship between the σDC and the Eg of these CEFs is explained. It also demonstrates that the increase in σDC with the addition of charge is almost linear [64]. The charge transfer processes in CEFs are essential for fundamental research and technological implications.

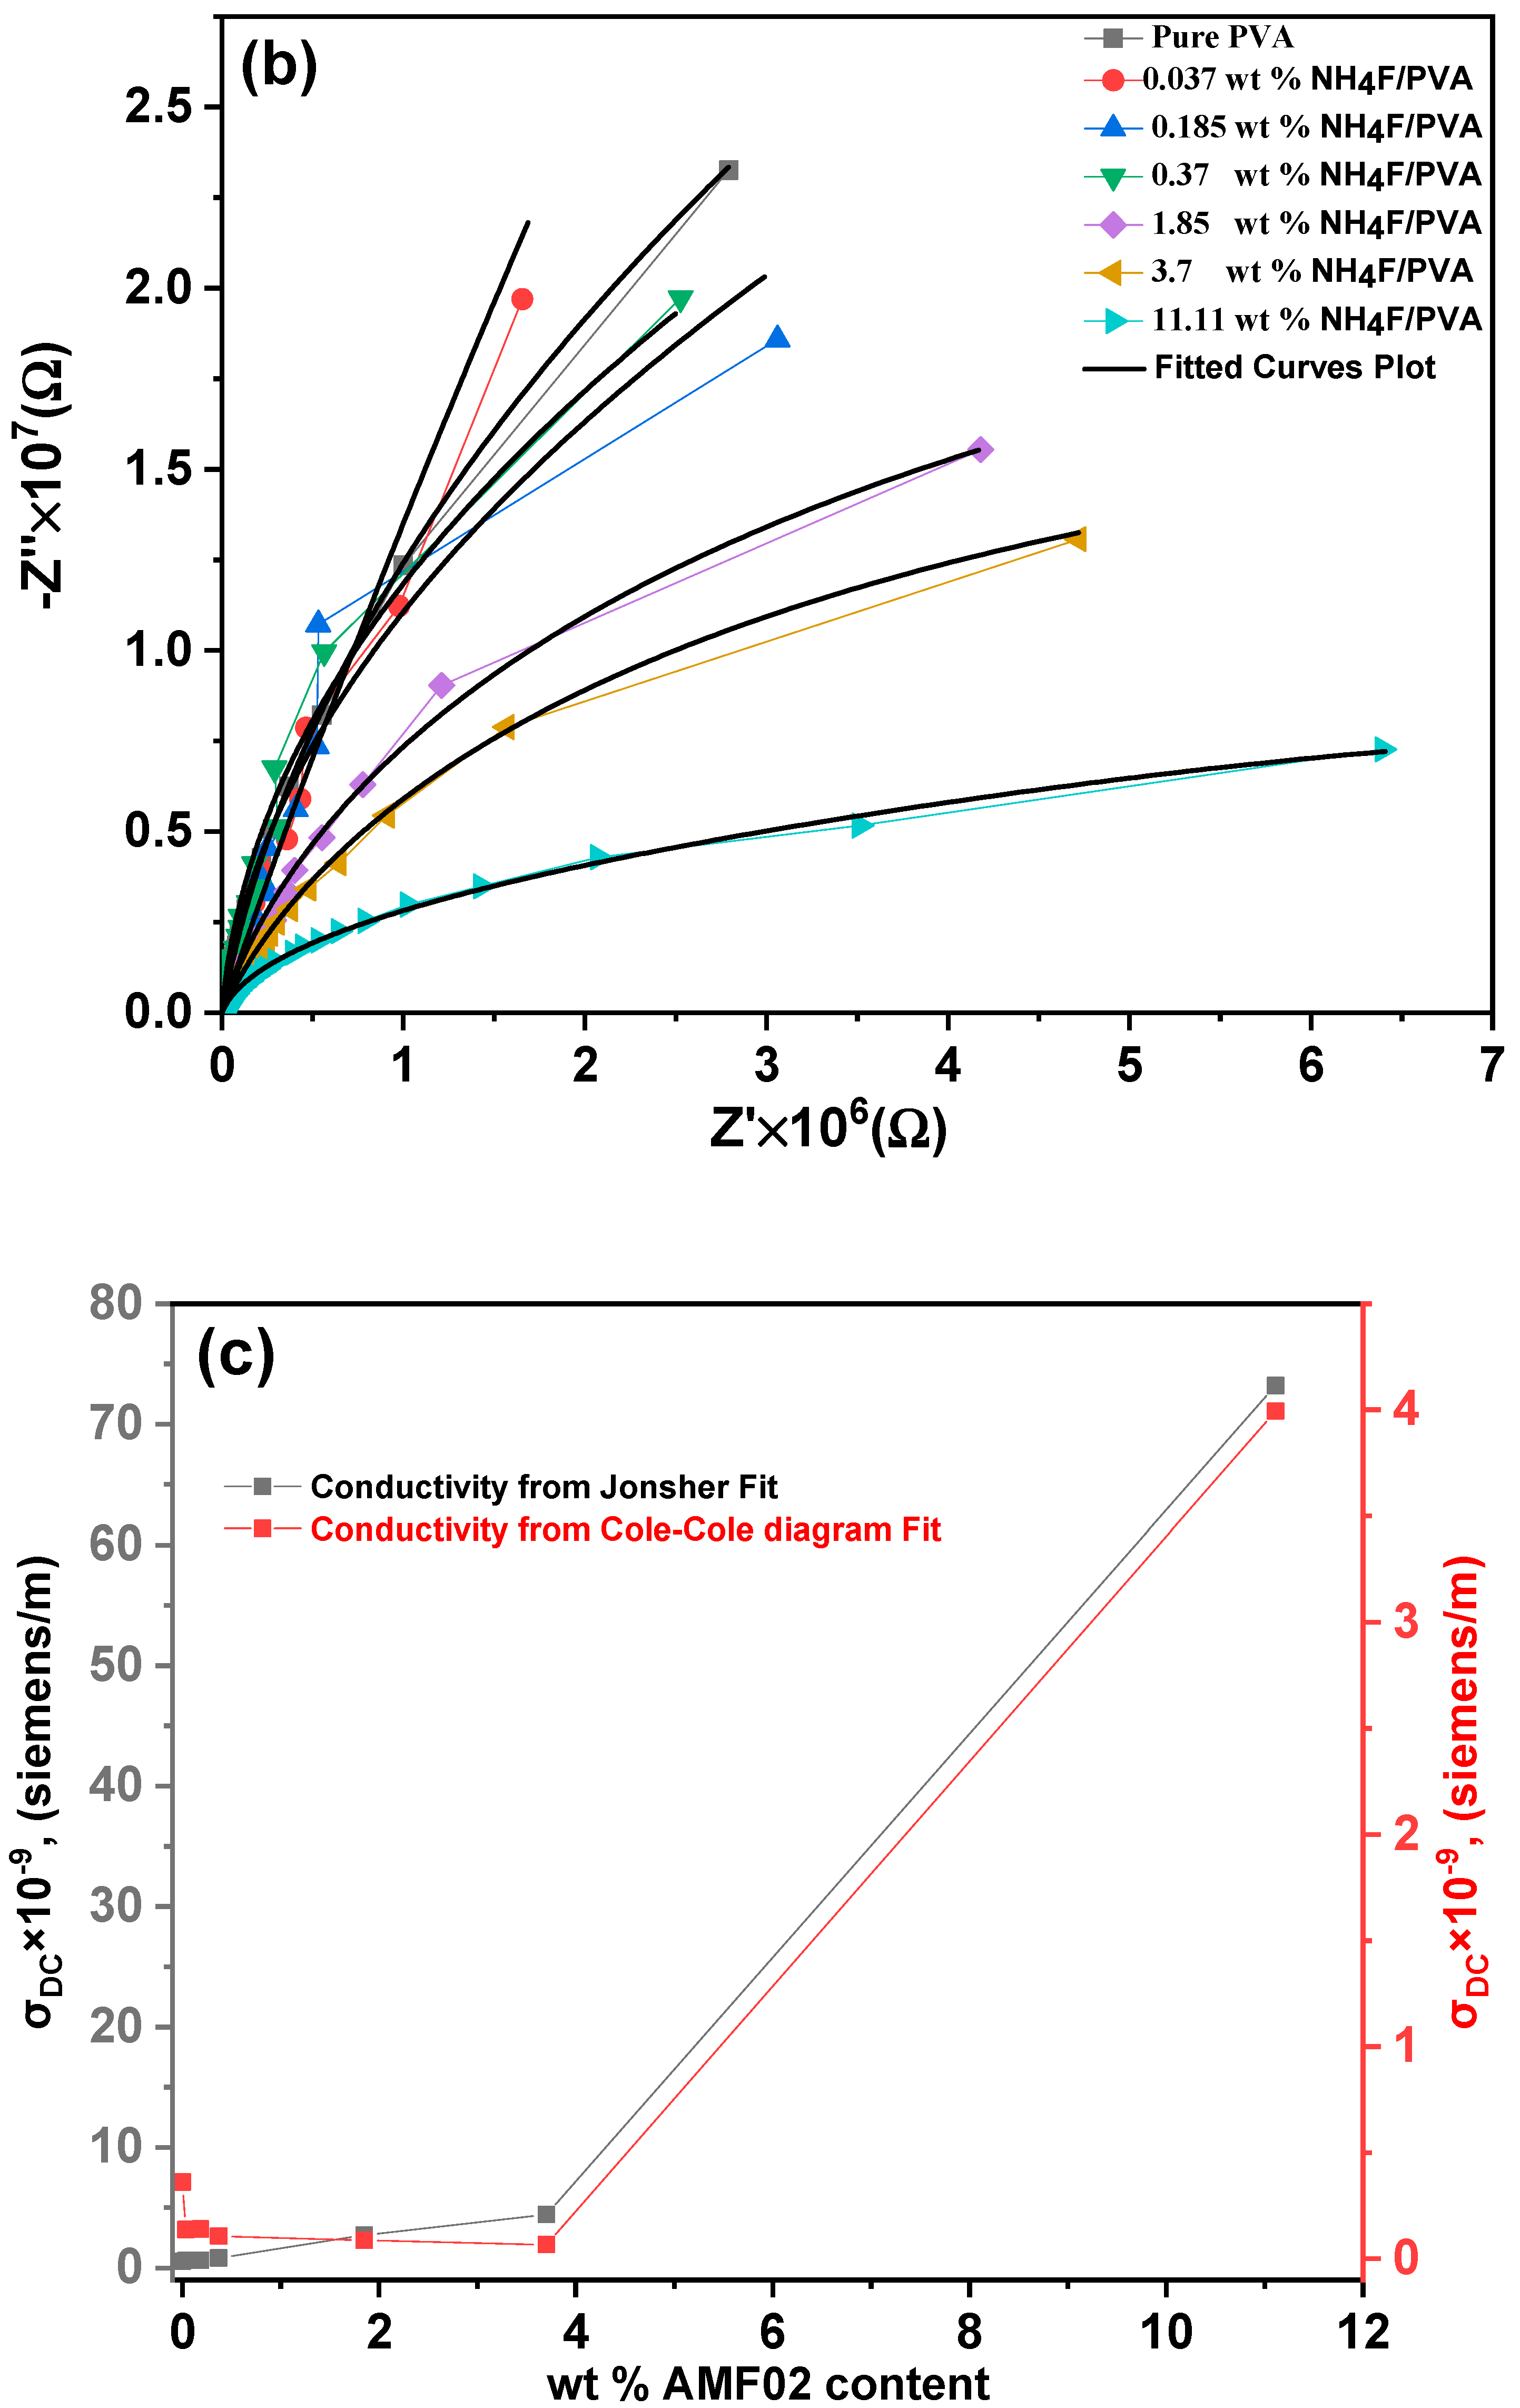
3.5.4. Frequency Dependence of Impedance Measurements

Impedance spectroscopy is a potent technology that involves measurements and analysis based on the dielectric characteristic relaxation angular frequency of the AMF02/PVA novel PCCEFs. To examine the effect of AMF02 concentration on PVA matrix, the real or imaginary elements of this impedance were calculated as follows [65]:
Z = R b 2 Q ω s cos s π 2 + R b 1 + R b Q ω s cos s π 2 2 + R b Q ω α sin s π 2 2
Z = R b 2 Q ω s sin s π 2 1 + R b Q ω s cos s π 2 2 + R b Q ω s sin s π 2 2
where Rb is the bulk resistance, the CPE is the constant phase element indicated by Q, and s is a parameter.
Figure 13a shows the frequency dependance of the AC dielectric impedance plot of real components (the inset of this figure presents the imaginary components of the impedance) for various composite films. The real Z′ and the imaginary Z” parts were fitted based on the Equations (19) and (20). The real AC impedance Z′ part decreases for all samples by increasing the applied frequency. The same trend was observed for the imaginary AC impedance Z″ part [57]. Based on the experimental (real and imaginary) impedance spectrum, the proposed theoretical equations match well with the experimental impedance data. A Cole–Cole diagram (plot between real and imaginary parts of impedance (−Z” vs Z′)), to identify the parallel equivalent electric circuit for different films, is shown in Figure 13b. All obtained fitted parameters are presented in Table 4. To evaluate the DC conductivity from the Cole–Cole diagrams, σDC, related to the Rb parameter, can be deduced from the fitting impedance data according to Equation (21) [66,67].
σ D C = 1 R b t A
where t is the thickness of the investigated film and A is its surface area.
Figure 13c reveals a comparative behavior of DC conductivity calculated by using two models. The DC conductivity was calculated and added to Table 4. The DC conductivity obtained using Joncher’s fit shows the same pattern as that found using calculations from Cole–Cole diagrams of the impedance spectra.

4. Conclusions

The key casting method created PVA-based CEFs with different AMF02 wt% ratios. The crystalline size and the produced strain shrinks and grows as the AMF02 salt filler and Gaussian fitting increase, respectively. The optical characteristics of AMF02-doped PVA new PCCEFs were evaluated in the spectrum range 190 to 2500 nm. With the addition of AMF02 salt fillers, the transmittance spectra are reduced due to the absorption coefficient’s influence, and because of the increased number and amorphous presence of moving carriers in the composite electrolyte films, the standards of the direct and indirect optical band gaps reduced with swelling AMF02 fillers. The drop in Eg parameters is caused by the generation of the energy planes of the highest occupied (HOMOs) molecular orbitals and lowest unoccupied (LUMOs) molecular orbitals, increasing the bandgap transition’s density localized states. The rise in Urbach energy shows that the amorphous phase has improved and that AMF02 salt doping has resulted in stable circumstances. For each CUT-OFF model, the designed refractive index enlarged linearly with increasing AMF02 salt content, designating a good scattering of AMF02 salt in the PVA polymer matrix. This increase in the refractive index will expand the use of these materials as anti-reflective varnishes. At room temperature, the AMF02 salt concentration and the frequency dependency of the dielectric properties were investigated. A low-dielectric permittivity composite electrolyte layer for microelectronic applications is in great demand in the high-frequency zone. The AC conductivity exposed a Jonscher power relation dependence on the frequency of the applied field. The highest σDC of 73.205 × 10⁻⁹ (siemens/m) was achieved for the CEF incorporating 11.11 wt% of AMF02 compared to the pure PVA one.

Author Contributions

Conceptualization, S.H.Z. and W.J.; methodology, A.B. and T.H.A.; software, F.A.H. and M.S.A.-A.; validation, I.S.Y.; formal analysis, H.Y.Z. and M.A.I.; investigation, M.S.A.-w. and H.Y.Z.; resources, S.H.Z. and W.J.; data curation, S.H.Z. and M.S.A.-w.; writing—original draft preparation, A.B. and T.H.A.; writing—review and editing, S.H.Z., M.S.A.-w. and I.S.Y.; visualization, M.A.I.; supervision, I.S.Y.; project administration, S.H.Z.; funding acquisition, S.H.Z. All authors have read and agreed to the published version of the manuscript.

Funding

The authors would like to acknowledge the Ministry of Education, Kingdom of Saudi Arabia, for funding this study (PCSED-020-18) through the Promising Centre for Sensors and Electronic Devices (PCSED) at Najran University, Kingdom of Saudi Arabia. The authors thank the Deanship of Scientific Research at King Khalid University, for financing this research under the research groups program, grant number R.G.P.2/233/43. The Research Center for Advanced Materials Science (RCAMS)” at King Khalid University, Saudi Arabia, for funding this work under the grant number RCAMS/KKU/017-22. Additionally, the authors would like to thank the Deanship of Graduate Studies and Research, Ajman University, Ajman, UAE, for the financial assistance through grant number (Project ID, DGSR Ref. Number: 2022-IRG-HBS-1).

Institutional Review Board Statement

Not applicable.

Informed Consent Statement

Not applicable.

Data Availability Statement

Data are contained within the article.

Conflicts of Interest

The authors declare no conflict of interest.

References

  1. Wang, A.; Tu, Y.; Wang, S.; Zhang, H.; Yu, F.; Chen, Y.; Li, D. A PEGylated Chitosan as Gel Polymer Electrolyte for Lithium Ion Batteries. Polymers 2022, 14, 4552. [Google Scholar] [CrossRef]
  2. Thanganathan, U.; Nogami, M. Investigations on effects of the incorporation of various ionic liquids on PVA based hybrid membranes for proton exchange membrane fuel cells. Int. J. Hydrogen Energy 2015, 40, 1935–1944. [Google Scholar] [CrossRef]
  3. Uma, T.; Yin, F. High proton conductivity of poly (methyl methacrylate)-based hybrid membrane for PEMFCs. Chem. Phys. Lett. 2011, 512, 104–107. [Google Scholar] [CrossRef]
  4. Flora, X.H.; Ulaganathan, M.; Rajendran, S. Role of Different Plasticizers in Li-Ion Conducting Poly(Acrylonitrile)-Poly(Methyl Methacrylate) Hybrid Polymer Electrolyte. Int. J. Polym. Mater. Polym. Biomater. 2013, 62, 737–742. [Google Scholar] [CrossRef]
  5. Radha, K.P.; Selvasekarapandian, S.; Karthikeyan, S.; Hema, M.; Sanjeeviraja, C. Synthesis and impedance analysis of proton-conducting polymer electrolyte PVA:NH4F. Ionics 2013, 19, 1437–1447. [Google Scholar] [CrossRef]
  6. Kawai, R.; Yada, S.; Yoshimura, T. Characterization and Solution Properties of Quaternary-Ammonium-Salt-Type Amphiphilic Gemini Ionic Liquids. ACS Omega 2019, 4, 14242–14250. [Google Scholar] [CrossRef]
  7. Sekhon, S.; Kumar, M.; Yamada, K.; Okuda, T. On the ionic diffusive motion in some fluoride doped polymer electrolytes. Chem. Phys. Lett. 2003, 379, 466–470. [Google Scholar] [CrossRef]
  8. Nik Aziz, N.A.; Idris, N.K.; Isa, M.I.N. PC polymer electrolytes of methylcellulose doped ammonium fluoride: Conductivity and ionic transport studies. Int. J. Phys. Sci. 2010, 5, 748. [Google Scholar]
  9. Mohammed, M.I.; Bouzidi, A.; Zahran, H.Y.; Jalalah, M.; Harraz, F.A.; Yahia, I.S. Ammonium iodide salt-doped polyvinyl alcohol polymeric electrolyte for UV-shielding filters: Synthesis, optical and dielectric characteristics. J. Mater. Sci. Mater. Electron. 2021, 32, 4416–4436. [Google Scholar] [CrossRef]
  10. Hema, M.; Selvasekarapandian, S.; Arunkumar, D.; Sakunthala, A.; Nithya, H. FTIR, XRD and ac impedance spectroscopic study on PVA based polymer electrolyte doped with NH4X (X = Cl, Br, I). J. Non-Cryst. Solids 2009, 355, 84–90. [Google Scholar] [CrossRef]
  11. Huang, J.; Zhu, J.; Yang, G.; Zhu, Y.; Xu, X.; Pan, G. Lifetime-tunable green room temperature phosphorescence of carbon dots by the multi-step modification. Opt. Express 2021, 29, 41014–41022. [Google Scholar] [CrossRef]
  12. Jiang, L.; Ding, H.; Xu, M.; Hu, X.; Li, S.; Zhang, M.; Zhang, Q.; Wang, Q.; Lu, S.; Tian, Y.; et al. UV–Vis–NIR Full-Range Responsive Carbon Dots with Large Multiphoton Absorption Cross Sections and Deep-Red Fluorescence at Nucleoli and In Vivo. Small 2020, 16, 2000680. [Google Scholar] [CrossRef]
  13. Saeed, M.A.M.; Abdullah, O.G. Effect of High Ammonium Salt Concentration and Temperature on the Structure, Morphology, and Ionic Conductivity of Proton-Conductor Solid Polymer Electrolytes Based PVA. Membranes 2020, 10, 262. [Google Scholar] [CrossRef]
  14. Yahia, I.S.; Mohammed, M.; Nawar, A.M. Multifunction applications of TiO2/poly(vinyl alcohol) nanocomposites for laser attenuation applications. Phys. B Condens. Matter 2019, 556, 48–60. [Google Scholar] [CrossRef]
  15. Ali, H.E.; Abdel-Aziz, M.; Nawar, A.M.; Algarni, H.; Zahran, H.; Yahia, I.; Khairy, Y. Structural, electrical, and nonlinear optical performance of PVAL embedded with Li+ -ions for multifunctional devices. Polym. Adv. Technol. 2020, 32, 1011–1025. [Google Scholar] [CrossRef]
  16. Bhajantri, R.; Ravindrachary, V.; Harisha, A.; Crasta, V.; Nayak, S.P.; Poojary, B. Microstructural studies on BaCl2 doped poly(vinyl alcohol). Polymer 2006, 47, 3591–3598. [Google Scholar] [CrossRef]
  17. Abdelaziz, M.; Abdelrazek, E. Effect of dopant mixture on structural, optical and electron spin resonance properties of polyvinyl alcohol. Phys. B Condens. Matter 2007, 390, 1–9. [Google Scholar] [CrossRef]
  18. Kumar, N.B.R.; Crasta, V.; Bhajantri, R.F.; Praveen, B.M. Microstructural and Mechanical Studies of PVA Doped with ZnO and WO3 Composites Films. J. Polym. 2014, 2014, 846140. [Google Scholar] [CrossRef] [Green Version]
  19. Li, K.; Lu, X.; Zhang, Y.; Liu, K.; Huang, Y.; Liu, H. Bi3TaO7/Ti3C2 heterojunctions for enhanced photocatalytic removal of water-borne contaminants. Environ. Res. 2020, 185, 109409. [Google Scholar] [CrossRef]
  20. Madhuri, S.N.; Hemalatha, K.S.; Rukmani, K. Preparation and investigation of suitability of gadolinium oxide nanoparticle doped polyvinyl alcohol films for optoelectronic applications. J. Mater. Sci. Mater. Electron. 2019, 30, 9051–9063. [Google Scholar] [CrossRef]
  21. Cho, S.-D.; Lee, J.-Y.; Paik, K.-W. Effects of particle size on dielectric constant and leakage current of epoxy/barium titanate (BaTiO3) composite films for embedded capacitors. In Advances in Electronic Materials and Packaging 2001 (Cat. No.01EX506); IEEE: Piscataway, NJ, USA, 2001; pp. 63–68. [Google Scholar] [CrossRef]
  22. Aziz, S.B.; Ahmed, H.M.; Hussein, A.M.; Fathulla, A.B.; Wsw, R.M.; Hussein, R.T. Tuning the absorption of ultraviolet spectra and optical parameters of aluminum doped PVA based solid polymer composites. J. Mater. Sci. Mater. Electron. 2015, 26, 8022–8028. [Google Scholar] [CrossRef]
  23. Al-Osaimi, J.; Al-Hosiny, N.; Abdallah, S.; Badawi, A. Characterization of optical, thermal and electrical properties of SWCNTs/PMMA nanocomposite films. Iran. Polym. J. 2014, 23, 437–443. [Google Scholar] [CrossRef]
  24. Bhowmick, M.; Xiz, H.; Ullrich, B. Optical Bandgap Definition via a Modified Form of Urbach’s Rule. Materials 2021, 14, 1639. [Google Scholar] [CrossRef]
  25. Abdullah, O.G.; Saber, D.R.; Taha, S.A. The Optical Characterization Of Polyvinyl Alcohol: Cobalt Nitrate Solid Polymer Electrolyte Films. Adv. Mater. Lett. 2015, 6, 153–157. [Google Scholar] [CrossRef]
  26. Norouzi, M.A.; Montazer, M.; Harifi, T.; Karimi, P. Flower buds like PVA/ZnO composite nanofibers assembly: Antibacterial, in vivo wound healing, cytotoxicity and histological studies. Polym. Test. 2021, 93, 106914. [Google Scholar] [CrossRef]
  27. Aziz, S.B.; Abdullah, O.G.; Rasheed, M.A. A novel polymer composite with a small optical band gap: New approaches for photonics and optoelectronics. J. Appl. Polym. Sci. 2017, 134, 44847. [Google Scholar] [CrossRef]
  28. Coskun, D.; Gunduz, B.; Coskun, M.F. Synthesis, characterization and significant optoelectronic parameters of 1-(7-methoxy-1-benzofuran-2-yl) substituted chalcone derivatives. J. Mol. Struct. 2018, 1178, 261–267. [Google Scholar] [CrossRef]
  29. Soliman, T.S.; Hessien, M.M.; Elkalashy, S.I. Structural, Thermal, and Optical Properties of Polyvinyl Alcohol Films Doped with La2ZnOx Nanoparticles. J Non Cryst Solids 2022, 580, 121405. [Google Scholar] [CrossRef]
  30. Ahmed, A.A.A.; Al-Hussam, A.M.; Abdulwahab, A.M.; Ahmed, A.N.A.A. The impact of sodium chloride as dopant on optical and electrical properties of polyvinyl alcohol. AIMS Mater. Sci. 2018, 5, 533–542. [Google Scholar] [CrossRef]
  31. Abdullah, O.G.; Aziz, S.B.; Rasheed, M.A. Structural and optical characterization of PVA:KMnO4 based solid polymer electrolyte. Results Phys. 2016, 6, 1103–1108. [Google Scholar] [CrossRef] [Green Version]
  32. Muhammad, F.F.; Aziz, S.; Hussein, S.A. Effect of the dopant salt on the optical parameters of PVA:NaNO3 solid polymer electrolyte. J. Mater. Sci. Mater. Electron. 2015, 26, 521–529. [Google Scholar] [CrossRef]
  33. Nemade, K.R.; Waghuley, S.A. Synthesis of MgO nanoparticles by solvent mixed spray pyrolysis technique for optical in-vestigation. Int. J. Met. 2014, 2014, 389416. [Google Scholar]
  34. Moss, T.S. Relations between the Refractive Index and Energy Gap of Semiconductors. Phys. Status Solidi (B) 1985, 131, 415–427. [Google Scholar] [CrossRef]
  35. Ali, F.M. Synthesis and Characterization of a Novel Erbium Doped Poly(vinyl alcohol) Films for Multifunctional Optical Materials. J. Inorg. Organomet. Polym. Mater. 2020, 30, 2418–2429. [Google Scholar] [CrossRef]
  36. Reddy, R.R.; Anjaneyulu, S. Analysis of the Moss and Ravindra relations. Phys. Status Solidi (B) 1992, 174, K91–K93. [Google Scholar] [CrossRef]
  37. Abdel-Baset, T.; Elzayat, M.; Mahrous, S. Characterization and Optical and Dielectric Properties of Polyvinyl Chloride/Silica Nanocomposites Films. Int. J. Polym. Sci. 2016, 2016, 1707018. [Google Scholar] [CrossRef] [Green Version]
  38. Anani, M.; Mathieu, C.; Lebid, S.; Amar, Y.; Chama, Z.; Abid, H. Model for calculating the refractive index of a III–V semiconductor. Comput. Mater. Sci. 2007, 41, 570–575. [Google Scholar] [CrossRef]
  39. Kumar, V.; Singh, J.K. Model for calculating the refractive index of different materials. J. Pure Appl. Phys. 2010, 48, 571–574. Available online: http://nopr.niscair.res.in/handle/123456789/9962 (accessed on 2 February 2023).
  40. Hervé, P.; Vandamme, L. General relation between refractive index and energy gap in semiconductors. Infrared Phys. Technol. 1994, 35, 609–615. [Google Scholar] [CrossRef]
  41. Li, Y.; Xia, Y.; Liu, K.; Ye, K.; Wang, Q.; Zhang, S.; Huang, Y.; Liu, H. Constructing Fe-MOF-Derived Z-Scheme Photocatalysts with Enhanced Charge Transport: Nanointerface and Carbon Sheath Synergistic Effect. ACS Appl. Mater. Interfaces 2020, 12, 25494–25502. [Google Scholar] [CrossRef]
  42. Cabuk, M.; Gündüz, B. Controlling the optical properties of polyaniline doped by boric acid particles by changing their doping agent and initiator concentration. Appl. Surf. Sci. 2017, 424, 345–351. [Google Scholar] [CrossRef]
  43. Abdel-Aziz, M.M.; Algarni, H.; Alshehri, A.M.; Yahia, I.S.; Ali, H.E. Study the impact of terbium additions in the microstructure, optical and electrical properties of polyvinyl alcohol. Mater. Res. Express 2019, 6, 125321. [Google Scholar] [CrossRef]
  44. Ali, H.E.; Khairy, Y. Facile synthesis, structure, AFM, thermal, and optical analysis of BiI3/PVAL nanocomposite films for laser CUT-OFF optical devices. Vacuum 2020, 180, 109640. [Google Scholar] [CrossRef]
  45. Bouzidi, A.; Jilani, W.; Yahia, I.S.; Zahran, H.Y.; Assiri, M.A. Optical Analysis and UV-Blocking Filter of Cadmium Iodide-Doped Polyvinyl Alcohol Polymeric Composite Films: Synthesis and Dielectric Properties. J. Inorg. Organomet. Polym. Mater. 2020, 30, 3940–3952. [Google Scholar] [CrossRef]
  46. Singh, P.K.; Nagarale, R.; Pandey, S.P.; Rhee, H.W.; Bhattacharya, B. Present status of solid state photoelectrochemical solar cells and dye sensitized solar cells using PEO-based polymer electrolytes. Adv. Nat. Sci. Nanosci. Nanotechnol. 2011, 2, 023002. [Google Scholar] [CrossRef]
  47. Muthupandeeswari, A.; Kalyani, P.; Vickraman, P. Evaluation of vital features of PVA–CaCO3 nanocomposite films for biodegradable packaging applications. Polym. Bull. 2022, 79, 65–85. [Google Scholar] [CrossRef]
  48. Kao, K.C. Dielectric Phenomena in Solids; Elsevier Academic Press: San Diego, CA, USA, 2004. [Google Scholar] [CrossRef]
  49. Aziz, S.B.; Abdullah, R.M. Crystalline and amorphous phase identification from the tanδ relaxation peaks and impedance plots in polymer blend electrolytes based on [CS:AgNt]x:PEO(x-1) (10 ≤ x ≤ 50). Electrochim. Acta 2018, 285, 30–46. [Google Scholar] [CrossRef]
  50. Aziz, S.B. The Study of Dielectric Properties and Conductivity Relaxation of Ion Conducting Chitosan:NaTf Based Solid Electrolyte. Int. J. Electrochem. Sci. 2018, 13, 10274–10288. [Google Scholar] [CrossRef]
  51. Ramya, C.; Selvasekarapandian, S.; Hirankumar, G.; Savitha, T.; Angelo, P. Investigation on dielectric relaxations of PVP–NH4SCN polymer electrolyte. J. Non-Cryst. Solids 2008, 354, 1494–1502. [Google Scholar] [CrossRef]
  52. Eldeeb, T.M.; El Nemr, A.; Khedr, M.H.; El-Dek, S.; Imam, N.G. Novel three-dimensional chitosan-carbon nanotube–PVA nanocomposite hydrogel for removal of Cr6+ from wastewater. Desalination Water Treat. 2020, 184, 163–177. [Google Scholar] [CrossRef]
  53. Aziz, S.B. Modifying Poly(Vinyl Alcohol) (PVA) from Insulator to Small-Bandgap Polymer: A Novel Approach for Organic Solar Cells and Optoelectronic Devices. J. Electron. Mater. 2016, 45, 736–745. [Google Scholar] [CrossRef]
  54. Aziz, S.B. Role of Dielectric Constant on Ion Transport: Reformulated Arrhenius Equation. Adv. Mater. Sci. Eng. 2016, 2016, 2527013. [Google Scholar] [CrossRef] [Green Version]
  55. Mallakpour, S.; Khadem, E. Facile and cost-effective preparation of PVA/modified calcium carbonate nanocompo-sites via ultrasonic irradiation: Application in adsorption of heavy metal and oxygen permeation property. Ultrason. Sonochem. 2017, 39, 430–438. [Google Scholar] [CrossRef]
  56. Aziz, S.B.; Abdullah, R.M.; Rasheed, M.A.; Ahmed, H.M. Role of Ion Dissociation on DC Conductivity and Silver Nanoparticle Formation in PVA:AgNt Based Polymer Electrolytes: Deep Insights to Ion Transport Mechanism. Polymers 2017, 9, 338. [Google Scholar] [CrossRef] [Green Version]
  57. Bouzidi, A.; Jilani, W.; Guermazi, H.; Yahia, I.S.; Zahran, H.Y.; Sakr, G.B. The effect of zinc iodide on the physicochemical properties of highly flexible transparent poly (vinyl alcohol) based polymeric composite films: Opto-electrical performance. J. Mater. Sci. Mater. Electron. 2019, 30, 11799–11806. [Google Scholar] [CrossRef]
  58. Jilani, W.; Bouzidi, A.; Yahia, I.S.; Guermazi, H.; Zahran, H.Y.; Saker, G. Effect of organic dyes on structural properties, linear optics and impedance spectroscopy of methyl orange (C.I. acid orange 52) doped polyvinyl alcohol composite thin films. J. Mater. Sci. Mater. Electron. 2018, 29, 16446–16453. [Google Scholar] [CrossRef]
  59. El-Sayed, H.E.A.; Ali, H.A.M.; Salem, G.F.; Mahmoud, M.A. Characteristics of Dielectric Behavior and AC Electrical Con-ductivity of Bulk Antimony Sulfide (Sb2S3). Arab J. Nucl. Sci. Appl. 2020, 53, 93–101. [Google Scholar]
  60. Aziz, S.B.; Abidin, Z.H.Z. Electrical Conduction Mechanism in Solid Polymer Electrolytes: New Concepts to Arrhenius Equation. J. Soft Matter 2013, 2013, 323868. [Google Scholar] [CrossRef] [Green Version]
  61. Ahmed, H.T.; Abdullah, O.G. Structural and ionic conductivity characterization of PEO:MC-NH4I proton-conducting polymer blend electrolytes based films. Results Phys. 2020, 16, 102861. [Google Scholar] [CrossRef]
  62. Manjunath, A.; Deepa, T.; Supreetha, N.K.; Irfan, M. Studies on AC Electrical Conductivity and Dielectric Properties of PVA/NH4NO3 Solid Polymer Electrolyte Films. Adv. Mater. Phys. Chem. 2015, 5, 295–301. [Google Scholar] [CrossRef] [Green Version]
  63. Marf, A.S.; Abdullah, R.M.; Aziz, S.B. Structural, Morphological, Electrical and Electrochemical Properties of PVA: CS-Based Proton-Conducting Polymer Blend Electrolytes. Membranes 2020, 10, 71. [Google Scholar] [CrossRef]
  64. Irfan, M.; Manjunath, A.; Mahesh, S.S. Studies on structural characterization and electrical properties of NaF doped PVA-PVP blend electrolyte films. AIP Conf. Proc. 2020, 2244, 100009. [Google Scholar] [CrossRef]
  65. Bouzidi, A.; Jilani, W. Study the effect of sodium molybdate dihydrate powders on the structural, optical, and impedance parameters of NA-MOAT-04-C.2HYD/PolVA polymeric composite electrolyte films. Mater. Sci. Eng. B 2022, 280, 115693. [Google Scholar] [CrossRef]
  66. Asandulesa, M.; Chibac-Scutaru, A.L.; Culica, M.E.; Melinte, V.; Coseri, S. Cellulose-based films with enhanced load of nitrogen containing heterocycles: The impact on the surface morphology and proton conductivity. Appl. Surf. Sci. 2023, 607, 155077. [Google Scholar] [CrossRef]
  67. Asandulesa, M.; Kostromin, S.; Tameev, A.; Aleksandrov, A.; Bronnikov, S. Molecular Dynamics and Conductivity of a PTB7:PC71BM Photovoltaic Polymer Blend: A Dielectric Spectroscopy Study. ACS Appl. Polym. Mater. 2021, 3, 4869–4878. [Google Scholar] [CrossRef]
Figure 1. X-ray diffraction (XRD) shapes for pure polyvinyl alcohol (PVA) and different wt% of AMF02 salt-filled PVA novel proton-conducting composite electrolyte films (PCCEFs).
Crystals 13 00376 g001
Figure 2. (ag) Gauss fit diagrams for the mean peak of AMF02/PVA novel PCCEFs.
Crystals 13 00376 g002aCrystals 13 00376 g002bCrystals 13 00376 g002cCrystals 13 00376 g002d
Figure 3. Transmittance plots (a) for different AMF02/PVA novel PCCEFs, and (b) for 11.11wt% of AMF02 salt content.
Crystals 13 00376 g003
Figure 4. Absorption spectra of pure PVA and AMF02/PVA novel PCCEFs.
Crystals 13 00376 g004
Figure 5. (a) The absorption coefficient variations vs. photon energy (), and (b) the Urbach energy plot (lnα vs. incident photon energy ()) for AMF02/PVA novel PCCEFs.
Crystals 13 00376 g005
Figure 6. (a) The (αhυ)1/2, and (b) the (αhυ)2 variations vs. photon energy () for AMF02/PVA novel PCCEFs.
Crystals 13 00376 g006
Figure 7. Optical extinction coefficient spectra for pure PVA and AMF02/PVA novel PCCEFs.
Crystals 13 00376 g007
Figure 8. The calculated refractive index (n) values using a different model for both (a) indirect and (b) direct bandgap for pure PVA and AMF02/PVA novel PCCEFs.
Crystals 13 00376 g008
Figure 9. Optical power limiting by using two laser sources (He-Ne 632.8 nm laser and solid-state laser green diode 532 nm laser beam) for various samples.
Crystals 13 00376 g009
Figure 10. (a) Real, (b) dielectric permittivity of PVA vs. wt% of AMF02 at fixed frequencies, (c) loss tangent (tan δ ), and (d) imaginary parts of dielectric permittivity against frequency for all novel PCCEFs.
Crystals 13 00376 g010aCrystals 13 00376 g010bCrystals 13 00376 g010c
Figure 11. (a) Real and (b) imaginary parts of electrical modules against frequency for all novel PCCEFs.
Crystals 13 00376 g011
Figure 12. AC conductivity vs. frequency for different novel PCCEFs and the variation of Jonscher parameters with the wt. % AMF02 salt fillers.
Crystals 13 00376 g012
Figure 13. (a) AC real and imaginary part of dielectric impedance; (b) Cole–Cole diagrams; and (c) DC conductivity vs. wt% AMF02 fillers.
Crystals 13 00376 g013aCrystals 13 00376 g013b
Table 1. The band tails Urbach’s energy, the indirect and direct bandgap for pure PVA film, and its AMF02 salt-doped PVA novel PCCEFs.
SamplesEu, (eV)Eg (eV)
Indirect
Eg (eV)
Direct
References
Pure PVA0.2945.085.25Present work
0.037 wt% AMF020.3684.955.33
0.185 wt% AMF020.8004.595.33
0.37 wt% AMF020.3394.815.21
1.85 wt% AMF020.5244.575.18
3.7 wt% AMF020.9714.165.63
11.11 wt% AMF022.5082.864.58
NH4I/PVA
(Pure-3.7 wt%)
0.812 − 0.3695.268 − 4.7975.89 −5.202[9]
LiNO3-doped PVA
(Pure-4 wt%)
0.596 −0.4185.014 −4.6145.576 −5.386[15]
Table 2. The refractive index parameters obtained from the Moss, Ravindra, Hervé and Vandamme, Reddy, Anani, and Kumar–Singh relations, and the average refractive index value for the investigated PCCEFs with various AMF02 adding salts. For indirect band transition.
SamplesRefractive index (n)
MossRavindraHervé and VandammeReddyAnaniKumar and SinghAverage
(A)
Pure PVA2.0792.1471.8891.9662.3841.9932.076
0.037 wt%AMF022.0932.1611.9111.9922.412.01052.096
0.185 wt%AMF022.1322.2021.9742.06792.4822.0602.153
0.37 wt%AMF022.1082.1761.9342.0212.4382.0292.118
1.85 wt%AMF022.1352.2041.9772.0722.4862.0632.156
3.7 wt%AMF022.1862.2572.0582.1662.5682.1262.227
11.11 wt%AMF022.4002.4782.3912.5402.8282.3992.506
(B)
Pure PVA2.0622.1291.8631.9332.351.9722.051
0.037 wt%AMF022.0542.1211.8511.9182.3341.9632.040
0.185 wt%AMF022.0542.1211.8511.9182.3341.9632.040
0.37 wt%AMF022.06642.1331.8691.9412.3581.9772.057
1.85 wt%AMF022.0692.1361.8741.9472.3641.9812.062
3.7 wt%AMF022.02672.0921.8071.8632.2741.9281.998
11.11 wt%AMF022.1342.2031.9752.0702.4842.0612.154
Table 3. Jonscher power law fitting parameters for pure PVA film and its AMF02 salt-doped PVA novel PCCEFs.
SamplesσDC × 10−9, (siemens/m)Frequency Exponent, (s)
Pure PVA0.545 ± 0.110.61 ± 0.02
0.037 wt% AMF020.620 ± 0.160.58 ± 0.03
0.185 wt% AMF020.639 ± 0.30.54 ± 0.05
0.37 wt% AMF020.813 ± 0.210.52 ± 0.04
1.85 wt% AMF022.727 ± 0.160.47 ± 0.03
3.7 wt% AMF024.451 ± 0.170.53 ± 0.04
11.11 wt% AMF0273.205 ± 0.101.19 ± 0.06
Table 4. Dielectric fitting various novel PCCEFs.
SamplesRb (Ω)Q (F)sσDC × 10−9, (siemens/m)
Pure PVA1.13 × 10107.5 × 10−110.9760.361
0.037 wt% AMF022.97 × 10102.74 × 10−110.9850.173
0.185 wt% AMF022.91 × 10106.4 × 10−110.9870.141
0.37 wt% AMF023.82 × 10105.8 × 10−110.9920.106
1.85 wt% AMF024.69 × 10104.98 × 10−110.9770.087
3.7 wt% AMF026.1 × 10104.17 × 10−110.9730.068
11.11 wt% AMF021.02 × 1091.76 × 10−100.9363.994
Disclaimer/Publisher’s Note: The statements, opinions and data contained in all publications are solely those of the individual author(s) and contributor(s) and not of MDPI and/or the editor(s). MDPI and/or the editor(s) disclaim responsibility for any injury to people or property resulting from any ideas, methods, instructions or products referred to in the content.

