Abstract
Keyholes are very important to the Plasma-MIG hybrid welding process, weld formation, and quality. With the purpose of studying the effect of the main welding parameters (plasma current, MIG current, magnetic field intensity, and welding velocity) on keyhole depth and the interaction among parameter factors, the experiment was designed by the response surface method. In addition, the prediction model with keyhole depth as the response value was obtained. The model shows the important degree of influence of each factor on keyhole depth. It shows that there is an obvious interaction between plasma current and MIG current, while there is no obvious correlation between other parameters. The temperature field of the Plasma-MIG welding process under certain parameters was obtained by using Fluent software for numerical simulation, and the evolution behavior of the keyhole was analyzed. Based on the simulation results, the metal flow mode and the movement mechanism of the keyhole are described.
1. Introduction
Plasma-MIG welding has the advantages of both PAW (Plasma Arc Welding) and MIG (Metal-Inert Gas Welding), with high welding efficiency and speed and low heat input in the welding process, so it has a wide application prospect. It is very important to study the keyhole behavior in the Plasma-MIG welding process for improving the welding quality, exploring the welding mechanism, and expanding its application range.
In the welding process of arc welding, there are strong arc light and high temperature plasma interference, and the state of keyhole changes rapidly, which cannot be directly observed. Therefore, it is often necessary to use certain modern scientific and technological means to observe the keyhole. The observation and analysis methods of keyhole behavior can be divided into direct observation, indirect observation, and numerical simulation.
Zhang et al. [1] measured the relative radiation distribution in the welding area, obtained images of keyholes and molten pools using pulse trigger imaging technology, and established a relationship model between surface characteristics and penetration depth. Li et al. [2] and Liu et al. [3] took pictures of the side and back end of the weld with two CCD cameras, integrated the images of the molten pool and keyhole into one picture in a coordinate system, and effectively observed the inlet morphology of the molten pool and keyhole. Fabbro et al. [4] adopted a coaxial visual sensing system to reflect specific light from the molten pool to the horizontal direction and capture images with a camera, thus ensuring that the angle of view of the images captured by the camera is directly above the field of vision. Zhang et al. [5,6] established a plasma arc welding keyhole state monitoring and control system. By collecting and processing the plasma voltage signal, the quantitative relationship between current, voltage, and width of weld back is obtained.
Design of experiment (DOE) is an important statistical method to study the change of response value under the influence of multiple factors, which has been widely used in welding test research [7,8,9,10]. Response surface method is an optimization method of comprehensive experimental design. Compared with conventional single factor tests, it has the advantages of lower test times, higher accuracy of regression equations, and better prediction performance, and the optimum process parameters can be obtained more efficiently [11,12,13,14]. At present, there is no literature to study the influence of welding parameters on keyhole depth in the Plasma-MIG welding process with this method.
Because the change rate of the molten pool and keyhole is extremely fast in the process of Plasma-MIG welding, it is hard to directly measure the temperature and flow inside the molten pool. Therefore, numerical simulation is often used to study the dynamic evolution process of the keyhole and molten pool [15,16,17]. Currently, the existing numerical simulation mainly focuses on temperature field and molten pool fluid behavior [18,19,20,21].
Hertel et al. [22] described the Plasma-MIG welding process through the numerical model of arc and droplet and the model of the Plasma-MIG welding pool. Zhang et al. [23] used Fluent software to simulate the fluid behavior of the molten pool in the hybrid welding process of plasma-cable seven-wire (replacing the welding wire of Plasma-MIG hybrid welding with cable seven-wire hybrid welding).
Gao et al. [24] used the adaptive mixed heat source model to simulate the evolution process of keyholes, and used the volume of fluid (VOF) method to track the changes of the polyphase interface. Wu et al. [25] took the coupling behavior of the molten pool and keyhole as the research object, established the combinational heat source model of the double ellipsoid and the conical body heat source, and revealed the law of fluid flow in the molten pool with the keyhole. Wu et al. [26] established a new fully coupled plasma keyhole welding pool model, used the predefined keyhole method to study the energy propagation during welding, and obtained reasonable numerical results.
This paper mainly focuses on the keyhole to carry out the following work:
The influence of multiple factors on keyhole depth in welding process: First, the response surface test was designed and the prediction model was established. Then the influence of main parameters on the weld keyhole depth and the interactions between different factors were determined.
Numerical simulation analysis of fluid behavior inside keyholes: Fluent software was used to conduct numerical simulation of the Plasma-MIG hybrid welding process. Then the evolution process of the keyhole and the flow behavior of molten metal were obtained, and the movement mechanism of the keyhole in the welding process was expounded upon.
2. Materials and Methods
2.1. Welding Test System
Figure 1 is a welding system overall distribution physical diagram. The system is mainly composed of the following parts: 1—Plasma-MIG hybrid welding gun; 2—MIG power supply; 3—PAW power supply; 4—welding process control system; 5—walking mechanism; 6—welding robot. The strength of the transverse magnetic field applied to the welding area is changed by adjusting the current flowing through the magnetic coil and the opposite magnetic pole. The Plasma-MIG hybrid welding torch is independently designed by the laboratory. Hybrid torches integrate plasma torches and MIG torches.
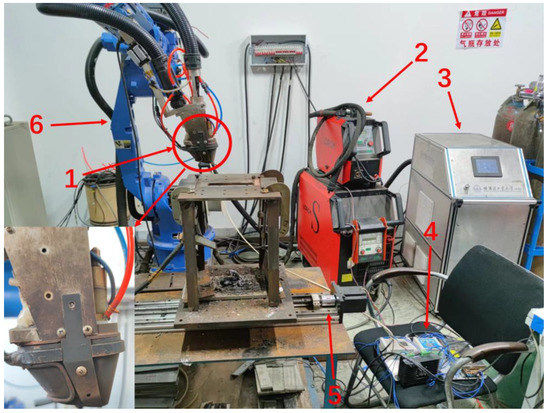
Figure 1.
Welding system overall distribution physical diagram: 1—Plasma-MIG hybrid torch; 2—MIG power supply; 3—PAW power supply; 4—welding process control system; 5—walking mechanism; 6—welding robot.
After the welding begins, the plasma small arc starts to arc first, then the large arc starts to arc, then the MIG wire feeds, the arc starts, and then the weldment moves forward with the walking mechanism.
Figure 2 is the schematic diagram of Plasma-MIG hybrid welding. In the welding process, the hybrid welding gun is welded from left to right (actually, the welding gun does not move, while the workpiece moves from right to left, it is an equivalent substitution here), the plasma arc is in the front, the MIG arc is in the back, and the two arcs are coupled [27].
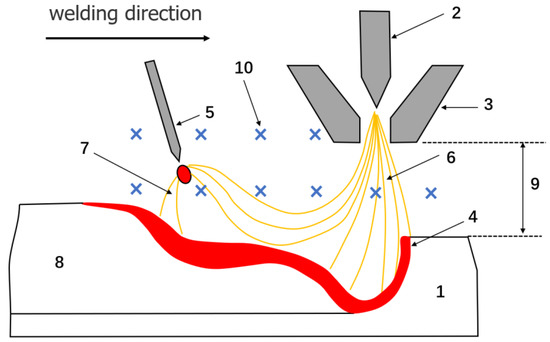
Figure 2.
Plasma-MIG hybrid welding schematic diagram: 1—base metal, 2—tungsten electrode, 3—plasma nozzle, 4—molten metal, 5—welding wire, 6—plasma arc, 7—MIG arc, 8—weld, 9—the welding height (distance of plasma nozzle from workpiece), 10—magnetic field.
2.2. Test Material
The plate used in the experiment is 304 stainless steel (06Cr19Ni10), and Table 1 is a table of its components. The specific size information of the specially made inclined plate is shown in Figure 3. Before welding, the steel plate is polished by an angle grinder to remove the oxide film. ER304 with a diameter of 1.2 mm is used as welding wire, and Table 2 is a table of its components.

Table 1.
304 Stainless steel chemical composition table (mass fraction, %).
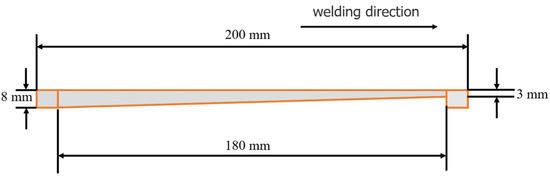
Figure 3.
Welding test inclined plate size diagram.
Table 2.
ER304 welding wire chemical composition table (mass fraction, %).
2.3. Test Design and Inclined Plate Welding Test
The test plate is designed as an inclined plate, and the size of the inclined plate is shown in Figure 3. After the test, it is found that within the test parameters, the 8 mm steel plate will not be penetrated. During the welding process, when the penetration feature begins to appear on the back of the steel plate, the thickness where the penetration feature is located can be considered as the depth of the keyhole under this parameter.
The four main factors selected are plasma current (IP), MIG current (IM), magnetic flux density (B), and welding speed (v), and then the response surface method is used to carry out central composite design. A four-factor and five-level test is designed, as shown in Table 3.
Table 3.
Test factors and level comparison table (Alpha = 2).
In Table 3, taking a plasma current of 200 A, a MIG current of 300 A, a magnetic field intensity of 3.3 mT and a welding speed of 7.5 mm/s as the central parameters, the five levels shown in Table 3 are obtained. As for the magnetic flux density, the maximum value of the magnetic field that can be applied by the self-developed equipment is taken as the maximum level, and the minimum level is taken when no magnetic field is added.
Input the above factors and levels into the Design Experiment 12 software, and the total number of experimental designs can be obtained from Formula (1).
where n is the number of factors in the experimental design; N is the total number of trials designed.
In this experiment, there were 4 variables, and the central point experiment number nc was set as 6. Therefore, the experimental group was 30 groups. After welding, the thickness of the initial collapse under the molten pool was measured (because the inclined plate was used in this test, so the thickness of the inclined plate at the time of penetration could be approximately taken as the depth of the keyhole) as the response value of the response surface method.
Table 4 shows the design and test results of CCD (center combination design). Through multiple regression fitting, the Formula (2) that can predict the depth of keyhole can be obtained:
Table 4.
CCD design and test results.
3. Keyhole Depth Research Based on Response Surface Method
3.1. Prediction Model Reliability Analysis
The regression equation and experimental results were analyzed by variance through software, and Table 5 shows the results.
Table 5.
Variance analysis table.
As can be seen from Table 5, F-value is 3.19, p-value = 0.0165 < 0.05. It shows that the model is significant and the fitting of experimental results is accurate. The lack of fit’s p-value = 0.28 > 0.05 indicates that the missing item is not significant and the equation is well fitted. The significant influencing factors of the keyhole depth prediction model were (p-value < 0.05) C, D, AB, and D2; the remaining factors are not significant.
As shown in Figure 4a, the horizontal line in the middle is the residual zero line, and the distribution of the model’s prediction points on either side of it is random. As shown in Figure 4b, the horizontal line in the middle is the residual zero line, and the distribution of experimental points on either side of it is random, and there are no data points beyond the upper and lower red lines, so the residual error of the whole model is small. As shown in Figure 4c, the diagonal line is the fitting line, and data points obtained from the experiment are distributed in a relatively close distance on both sides of the fitting line.
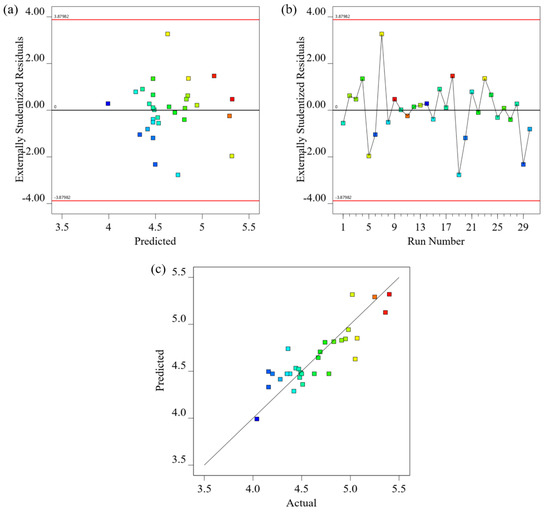
Figure 4.
Model prediction analysis diagram. (a) Residuals and prediction diagrams; (b) graph of residual and number of experiments; (c) relationship between predicted and actual values.
The prediction model of keyhole depth obtained by multiple regression fitting has a good agreement with the experimental data, and the accuracy of the model meets the expected requirements.
3.2. Analysis of Influence of Welding Factors on Keyhole Depth
3.2.1. Effect of Single Factor on Keyhole Depth
Through the analysis of the Design Expert software, the interactive influence was temporarily ignored and the effect degree of each single factor on the keyhole depth in the welding process was obtained, as shown in Figure 5.
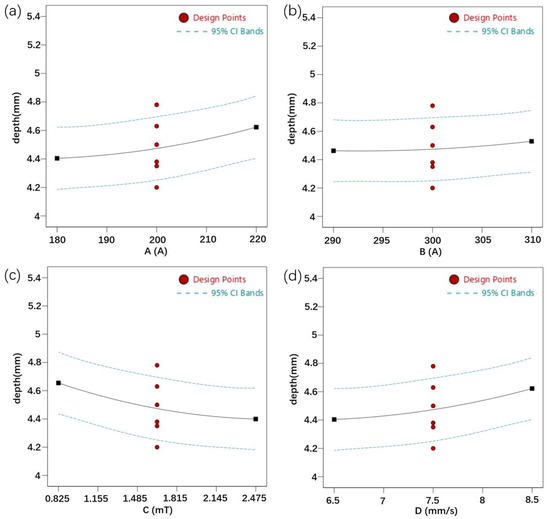
Figure 5.
Influence of single factor on keyhole depth: (a) plasma current; (b) MIG current; (c) magnetic flux density; (d) welding speed.
In Figure 5a–d, the horizontal coordinates are the four single factors, and the vertical coordinate is the keyhole depth. The solid black lines in the figure represent the relationship between keyhole depth and each single factor. By comparing the slopes of the four figures, the order of the effect degree of each single factor on the keyhole depth can be obtained, and the promotion or inhibition effect of the factor on the keyhole depth can be obtained according to the rise or fall of the curve. The units of measurement of the above four factors are quite different. If the conventional slope calculation method is used to study it, then the small value variable such as magnetic field intensity has the greatest influence on the keyhole depth, which does not meet the expected requirements. Therefore, the unit length of each factor is regarded as unit 1, and, on this basis, the influence of the above factors on the keyhole depth is analyzed.
When the interaction is not considered, the welding speed has the greatest influence on the keyhole depth, and the MIG current has the least effect. The smaller the magnetic field intensity is or the slower the welding speed is, the deeper the keyhole is; the larger the plasma current or MIG current is, the deeper the keyhole is. In addition, combined with the p value in Table 5, the importance of welding parameters on the welding process is ranked as follows: welding speed > magnetic field intensity > plasma current > MIG current, in which welding speed and magnetic field intensity have a significant impact on keyhole depth.
3.2.2. The Influence of Multiple Factors Interaction on Keyhole Depth
The magnetic-controlled Plasma-MIG welding process is a complex process of multi-factor and multi-energy fields interacting with each other, so it is necessary to explore the influence of interaction between different factors on keyhole depth in the welding process. There are four variables in this experiment, so there can be six combinations between the pairs. The interaction among various factors was explored by Design Expert software. The four variables are A (plasma current), B (MIG current), C (magnetic flux density), and D (welding speed). The four variables are combined in pairs as the x-axis and y-axis, and the keyhole depth is used as the z-axis to obtain the response surface and contour map of the keyhole depth. Figure 6 and Figure 7 are the interaction response surfaces and contour maps of different factors.
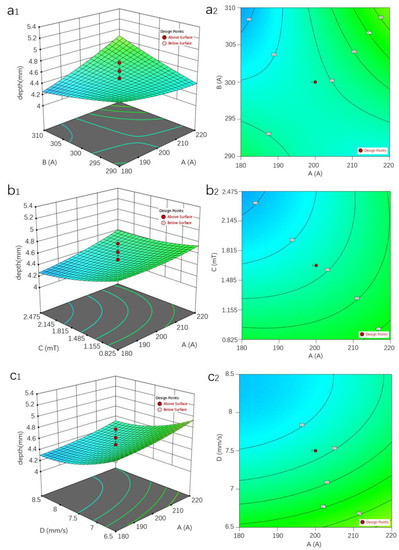
Figure 6.
Interactive response surface and contour map of different factors: (a1,a2) are the interactive response surfaces and contour maps of A: plasma current and B: MIG current, respectively; (b1,b2) are the interactive response surfaces and contour maps of factors A: plasma current and C: magnetic field intensity, respectively; (c1,c2) are the interactive response surfaces and contour maps of factors A: plasma current and D: welding velocity, respectively.
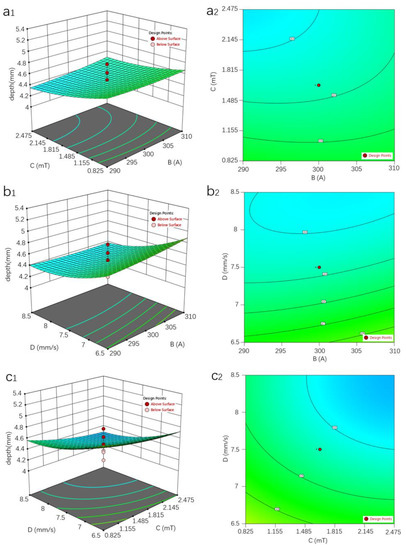
Figure 7.
Interactive response surface and contour map of different factors: (a1,a2) are the interactive response surfaces and contour maps of B: MIG current and C: magnetic flux density, respectively; (b1,b2) are the interactive response surfaces and contour maps of factors B: MIG current and D: welding speed, respectively; (c1,c2) are the interactive response surfaces and contour maps of factors C: magnetic flux density and D: welding speed, respectively.
From Figure 6(a1,a2), it can be concluded that when the plasma current changes from 180 to 220 A, the MIG current changes from 290 A to 310 A, the magnetic flux density is 1.65 mT, and the welding speed is 7.5 mm/s, the keyhole depth varied from 4.20 to 4.90 mm. The peak value of keyhole depth occurs when both current values are at their maximum. This is consistent with the influence of single factor on keyhole depth. In general, keyhole depth increases as plasma current or MIG current increases.
Meanwhile, it is obvious from the contour diagram that the effect of the MIG current on the keyhole depth is less than that of the plasma current. The reason for this is that the plasma arc is perpendicular to the welding workpiece in the front, forming the keyhole, while in the hybrid torch, the MIG welding torch presents a certain angle to the plasma torch, so the formed MIG arc presents a certain angle to the workpiece, mainly realizing the function of metal filling in the welding process.
In addition, by comparing the plasma current increase from 180 A to 220 A when the MIG current is 295 A, 300 A and 305 A, it can be found that as the MIG current increases, the range of variation in keyhole depth increases. There is a significant interaction between the two factors.
From Figure 6(b1,b2), it can be concluded that when the plasma current varies from 180 to 220 A, the magnetic flux density varies from 0.825 to 2.475 mT, the MIG current is 300 A, and the welding speed is 7.5 mm/s, the keyhole depth varied from 4.25 to 4.75 mm. The peak value of keyhole depth occurs when the plasma current reaches the maximum value and the magnetic field intensity reaches the minimum value in the selected range. Similarly, this is consistent with the effect of single factor on the keyhole depth. In the selected range of parameters, the decrease in magnetic field intensity or the increase in plasma current is conducive to the increase in keyhole depth. This is because the polarity of the plasma welding gun and the MIG welding gun are opposite in the welding process. Under the action of transverse magnetic fields, the plasma arc and the MIG arc are coupled. In addition, the plasma arc deflects under the action of a strong magnetic field and cannot be absolutely perpendicular to the base metal, which affects the straightness of plasma arc. Because the plasma arc presents a certain angle with the workpiece, the keyhole formation ability is weakened, so the penetration depth decreases.
The contour line presents a relatively uniform water pattern, and the diagonal line is roughly regarded as the axis of symmetry. In other words, the decrease in keyhole depth caused by the increase of 0.33 mT magnetic field intensity requires an increase of about 10 A in the plasma current to offset. However, there is no obvious mutual influence between the two factors.
From Figure 6(c1,c2), it can be concluded that when the plasma current varies from 180 to 220 A, the welding speed varies from 6.5 to 8.5 mm/s, the MIG current is 300 A, and the magnetic flux density is 1.65 mT, the keyhole depth varied from 4.30 to 4.95 mm. The peak value of keyhole depth occurs at the plasma current maximum value and the welding speed minimum value within the selected range. In other words, within the selected parameters, the decrease in welding speed or the increase in plasma current is conducive to the increase in keyhole depth, because both changes are conducive to the increase in welding heat input. According to the contour diagram, the influence of welding velocity (0.5 mm/s) on keyhole depth is much greater than that of plasma current (10 A). There was no obvious interaction between factor A and factor D.
It can be concluded from Figure 7(a1,a2) that when the MIG current varies from 290 to 310 A, the magnetic field intensity varies from 0.825 to 2.475 mT, the plasma current is 200 A, and the welding speed is 7.5 mm/s, the variation range of keyhole depth is 4.35~4.7 mm. Compared with the above combinations, the variation range of keyhole depth of this combination is the smallest.
The peak value of keyhole depth occurs at the maximum value of the MIG current and the minimum value of the magnetic field intensity in the selected range. In the selected parameter range, the decrease in magnetic field intensity or the increase in MIG current is conducive to the increase in keyhole depth. The contours are sparse and the variation of keyhole depth caused by magnetic field intensity is much greater than that caused by the MIG current. There is no obvious interaction between the two factors.
According to Figure 7(b1,b2), when the MIG current varies from 290 to 310 A, the welding velocity varies from 6.5 to 8.5 mm/s, the plasma current is 200 A, and the magnetic field intensity is 1.65 mT, the keyhole depth varies from 4.35 to 4.90 mm. The peak value of keyhole depth occurs at the maximum value of the MIG current and the minimum value of the welding speed within the selected parameters; that is, the reduction of welding speed or the increase in MIG current is conducive to the increase in keyhole depth. Similar to the plasma current, the increase in the MIG current is also conducive to the increase in the heat input in the welding process.
As shown in the contour diagram in Figure 7(b2), when the welding speed is constant, the change in the MIG current has little influence on the keyhole depth; otherwise, when the MIG current is constant, the change in the welding speed can bring significant influence on the keyhole depth. By observing the response surface and contour map, there is no obvious mutual influence between factor B and factor D.
It can be concluded from Figure 7(c1,c2) that when the magnetic field intensity varies from 0.825 to 2.475 mT, the welding speed varies from 6.5 to 8.5 mm/s, the plasma current is 200 A, and the MIG current is 300 A, the depth of keyhole varies from 4.30 mm to 4.80 mm. The peak of keyhole depth occurs when the magnetic flux density and welding speed are both at the minimum in the selected range. By observing the contour diagram in Figure 7(c2), it can be found that the welding speed has a greater effect on the keyhole depth. According to the response surface and contour map, there is no obvious mutual influence between factor C and factor D.
To sum up, among the four factors in the test design, factor A: plasma current and factor B: MIG have an obvious mutual influence; that is, within the same plasma current variation range, the increase in MIG current will increase the variation range of the keyhole depth. There was no significant interaction between the other factors.
4. Numerical Simulation of Keyhole Behavior in Plasma-MIG Welding
4.1. Establishment of Analytical Model
4.1.1. Basic Assumption
- (1)
- The molten metal generated in the welding process cannot be compressed and is idealized as a laminar Newtonian body and the plasma arc as Newtonian fluid;
- (2)
- The metal melts under the heating of the arc, and the volume change of the solid phase transformation is negligible, and no metal is lost due to evaporation;
- (3)
- The welding process follows the three conservation laws, that is, the law of conservation of mass, energy, and momentum;
- (4)
- In the molten pool, only liquid surface tension, arc pressure, gravity, electromagnetic force, and buoyancy are considered.
4.1.2. Governing Equation
The governing equations of Plasma-MIG hybrid welding process are mainly the three basic conservation laws.
- (1)
- Mass conservation equationwhere ρ is metal density (kg/m3); Sm is mass added by the sparse phase to the continuous phase (kg).
- (2)
- Energy conservation equationwhere ρ is metal density (kg/m3); λ is thermal conductivity; S is the energy equation source term; cp is the specific heat capacity (J/kg·°C).
- (3)
- Momentum conservation equationwhere ρ is the metal density (kg/m³); v0 is the welding speed (mm/s); u, v, and w are components of welding velocity; μ is the coefficient of metal viscosity; p is the pressure in the fluid.
4.1.3. Heat Source Model
The conical heat source model represents the heat input of plasma arc, and the double ellipsoidal heat source model and the droplet heat source model represent the heat input of the MIG arc.
- (1)
- Conical heat source model
It is used to study the heat input of plasma arc, and its descriptive equation is shown in Formulas (6) to (9) [28,29].
where re is the upper surface radius of the conical heat source (m); ri is the radius of lower surface of conical heat source (m); Q is the plasma arc effective heat input. is the ratio coefficient of peak heat flow on the upper and lower surfaces of the heat source.
- (2)
- Double ellipsoidal heat source model [30]
It has two different 1/4 ellipsoids, and its descriptive equation is shown in Equations (10) to (12) [29].
where is the distribution coefficient of the part before heat flow; is the distribution coefficient after heat flow; T is the time used in the welding process; U is the arc voltage; I is the welding current; is the welding speed; is the thermal efficiency of the arc.
During the welding process, the direction of the plasma arc represented by the conical heat source model is perpendicular to the workpiece and vertically down; the angle between the MIG arc and the plasma arc is 20°. The MIG power supply is a pulse power supply with a pulse frequency of 300 Hz, and the welding height (distance of plasma nozzle from workpiece) is 5 mm.
- (3)
- Droplet heat source model
In the process of welding, the molten drops of MIG fall into the molten pool, which will transfer its own heat to the molten pool and also exert force on it. The droplets are set to transition from the upper surface of the air layer to the molten pool at a certain speed, as the welding current increases, the initial droplet transition speed becomes faster. When the melt drops fall, the main consideration is gravity.
4.1.4. Model Building and Meshing
As shown in Figure 8, a model with a size of 40 × 8 × 11 mm is established, in which the length and width of the base material in the welding direction are 40 mm and 8 mm, and the thickness of the base material is 6 mm. The green grid part in Figure 8 is the model of 304 stainless steel base material. According to the actual welding height, an air layer with a thickness of 5 mm is established above the metal layer. The ICEM software was used to divide the mesh, and the mesh size was set to 0.4 mm. The top layer of the air layer (the blue side in the figure) is set as the velocity inlet, the pressure outlet is set around the air layer, and all the surfaces of the base metal are wall surfaces.
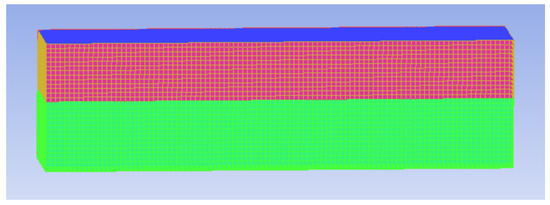
Figure 8.
Model meshing.
4.1.5. Initial Conditions and Boundary Conditions
- (1)
- Initial conditions
When t is equal to 0,
where is the ambient temperature.
- (2)
- Energy boundary conditions
upper surface:
other surface:
where is the heat transferred by the MIG arc; is the heat transferred by the plasma arc; is the comprehensive heat dissipation coefficient of convection and radiation; is the latent heat of evaporation; is the evaporation rate.
- (3)
- Momentum boundary conditions
4.2. Material Thermal and Physical Parameters and Welding Parameters
Table 6 shows the thermophysical parameters of the test plate and the welding wire.
Table 6.
Thermophysical parameters of 304 stainless steel materials [29].
The specific heat capacity , thermal conductivity , and viscosity μ of the material are temperature-related functions, and their thermal physical parameters are shown in Formulas (17) to (19) [25].
The main welding parameters are set as follows: the plasma current value is 200 A, the MIG current value is 300 A, the welding speed is 7.5 mm/s, the plasma gas flow rate is 3 L/min, the protection gas flow rate is 20 L/min, the welding height is 5 mm, and the pulse frequency of the pulse MIG is 300 Hz. Plasma gas and protection gas are pure argon.
4.3. Keyhole Evolution and Molten Pool Flow Behavior
As shown in Figure 9 and Figure 10, a series of representative moments were selected to derive the cross-section diagram of the temperature field and the three-dimensional fluid flow diagram of the molten pool. Then the evolution process of the keyhole inside the molten pool and the flow behavior of the molten pool were observed. The directions of arrows and lines in the figure represent the direction of the instantaneous motion vector of the fluid. The maximum temperature in the figure is set to 1720 K according to the melting point of 304 stainless steel, so the red area in the figure is the molten metal part.
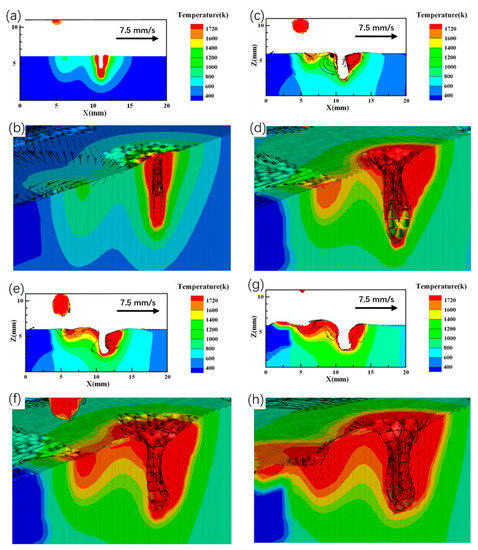
Figure 9.
Temperature field distribution of the weld section and three-dimensional fluid flow diagram of the molten pool at different time: (a,c,e,g) are the temperature field of the weld section at 100 steps, 1000 steps, 1500 steps, and 2000 steps, respectively; (b,d,f,h) are the three-dimensional fluid flow diagrams of the molten pool at 100 steps, 1000 steps, 1500 steps, and 2000 steps, respectively.
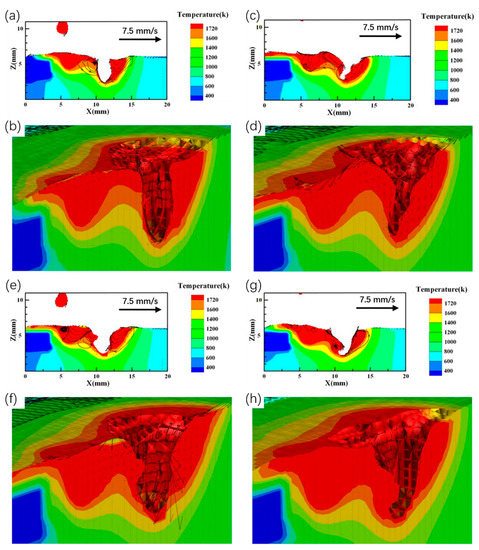
Figure 10.
Temperature field distribution of the weld section and three-dimensional fluid flow diagram of the molten pool at different times: (a,c,e,g) are the temperature field of the weld section at 2700 steps, 3400 steps, 4000 steps, and 4880 steps, respectively; (b,d,f,h) are the three-dimensional fluid flow diagrams of the molten pool at 2700 steps, 3400 steps, 4000 steps, and 4880 steps, respectively.
As shown in Figure 9a, b, at the beginning of welding, the plasma arc starts first and stays at the origin. The plasma arc with high airflow velocity heats the metal directly below the arc, so that the metal quickly heats up to above the melting temperature and forms a molten pool. At this time, the plasma with high momentum squeezes the molten metal downward and sideways, resulting in a depression on the surface of the molten pool. The plasma arc continues to heat the metal below, and the depression deepens to form the vertical keyhole in the initial state. Then the MIG arc starts, and the temperature field of the molten pool below the plasma arc presents an “inverted triangle” shape. Because the MIG arc and plasma arc form an angle of 20°, the temperature field below the MIG arc is in the shape of a “hook”. The “hook shape” region and the “inverted triangle” region join in the middle of the two arcs, forming the temperature field in the initial state. The maximum surface temperature of the welded parts under the MIG arc is about 1300 K, and melting has not occurred. According to Figure 9b, the molten pool directly below the plasma arc produces downward instantaneous vector motion under the direct action of arc force. The molten metal on the surrounding sidewall is affected by the high velocity plasma flow back from the bottom of the keyhole along the side, resulting in an instantaneous vector motion upwards.
At the moment shown in Figure 9c,d, the MIG arc and the plasma arc begin to move forward synchronously, and the heating action of plasma arc melts the metals below the arc. As shown in Figure 9c, at this time, the liquid metal on the upper surface of the molten pool in front of the keyhole and the front wall of the keyhole flows down under the action of plasma flow. The molten metal at the bottom flows back upward along the back wall of the keyhole under the momentum transferred by the molten metal at the top. In addition, the molten metal shows a rotation trend. There is still no metal melting under the MIG arc.
At the moment shown in Figure 9e,f, the front-end molten pool still circulates counterclockwise and flows backward under the action of high-speed plasma airflow, resulting in obvious surface collapse, which can also be seen from the vector motion direction in Figure 9f. Obvious accumulation of molten pool metal occurs in the middle part of two arcs, that is, the height of molten metal in the middle of two arcs is obviously higher than other parts, which is called the molten pool crest. This phenomenon is more obvious in Figure 9f. At this time, the molten pool crest is generated under the action of arc force and surface tension, etc. Since MIG arc has not produced droplet transition, the peak height is relatively low at this time. The droplet has formed under the MIG arc, and the first droplet is about to transition.
At the moment shown in Figure 9g,h, the transition of the first droplet is completed. Under the action of droplet impact force and arc pressure, the upper surface of the molten pool below the MIG arc appears to be an obvious depressed deformation, and the molten metal in the sunken part is displaced. The molten metal in the rear wall of plasma keyhole climbs upward, so the molten pool crest is more obvious under the action of the two arc forces and the droplet impact force. At this time, the metal in the front wall of the keyhole continues to flow downward. After reaching the bottom of the molten pool, the metal flows upward through a thin layer of molten metal channel on the back wall of the keyhole, and the keyhole moves forward as a whole. At this point, the MIG pool and the plasma pool are connected.
At the moment shown in Figure 10a,b, the molten pool under the MIG arc is mainly affected by arc force, gravity, and surface tension. The wave crest of the molten pool is directly below the MIG arc, and the transition of the second molten drop is about to take place. Observe the flow direction of the liquid in the crest region in Figure 10b. The liquid at the back of the crest region flows backward, and the liquid at the front of the crest moves forward, indicating that the crest region has moved close to the last end of the molten pool at this time. In the following moments, the region below the MIG arc tends to sag downward, and the crest region will move towards the front end of the molten pool again. The liquid of the keyhole formed by the plasma arc still moves downward along the front wall of the keyhole wall and then moves upward through the bottom of the keyhole wall.
At the moment shown in Figure 10c,d, due to the completion of the second droplet transition of MIG and the trend of the original molten pool crest moving to the front end of the molten pool shown in the previous time, the molten pool crest area is once again close to the plasma arc. The direction of liquid flow in the crest area becomes complicated, and the molten metal at the bottom of the keyhole continues to climb under the action of plasma flow. However, at this time, the fusion degree of the MIG molten pool and the plasma molten pool is deepened, and the bottom of the molten pool is no longer sufficient to support the molten metal in the middle part of the two arcs. The liquid metal in the molten pool flows down along the inclined plane of the unmelted base metal, but the metal on the outer surface of the molten pool still flows up, forming the molten pool shape of the middle part of the arc, as shown in Figure 10c,d. Combined with Figure 9c–h, and Figure 10a,b, it is shown that the crest area in the middle of the molten pool has been oscillating back and forth between the two arcs. The molten metal under the plasma arc flows sideways and backward under the action of arc force, plasma flow force, and gravity to supplement the “hole” of the keyhole.
In the moment shown in Figure 10e,f, the keyhole morphology has basically stabilized, showing a slightly curved shape to the side and back, which is a parabolic shape. At this time, there is still a crest region in the middle of the two arcs, and the direction of molten metal in this region flows from the crest to the front and back. The molten metal on the front wall of the keyhole mainly moves upward with the plasma flow back flow in the keyhole, while the molten metal in the front molten pool moves downward, and the molten metal in the upper part of the molten pool at the back end of the keyhole flows downward under the action of gravity and arc force. Under the diversion of the keyhole wall, the plasma flow moving along the front wall of the keyhole will have an impact on the bottom of the rear end of the keyhole wall after reaching the bottom, making the molten metal layer at the bottom of the back end of the keyhole very thin. Meanwhile, this part of high-speed flowing gas also plays a supporting role on the common molten pool at the back end of the keyhole, and drives the metal at the bottom of the keyhole to move upward and backward.
At the moment shown in Figure 10g,h, the two molten pools are completely fused into one molten pool, and the section of the front wall of the keyhole is still parabolic. However, due to the increase in molten metal in the common molten pool, the molten pool on the back wall of the keyhole moves down and the molten metal transition area at the bottom of the back wall of the keyhole becomes thicker when the air flow support force changes a little. The molten metal at the bottom of the keyhole can more quickly enter the common molten pool portion at the back end of the keyhole.
5. Conclusions
In this paper, the influence of multi-factor interaction on keyhole depth, the evolution behavior inside keyhole, and the flow behavior of molten pool are studied. The main results are as follows.
- (1)
- Taking plasma current, MIG current, magnetic field intensity and welding current as input values and keyhole depth as a response value, a prediction model is established. After variance analysis and model reliability analysis, the prediction of this model meets the expected effect. The results show that the influences of the above four factors on keyhole depth are as follows: welding speed > magnetic field intensity > plasma current > MIG current, and the welding speed and magnetic field intensity have significant effects on keyhole depth. Only plasma current and MIG current have significant interaction with each other. No significant interaction was found between the other groups.
- (2)
- The numerical analysis model is established, and the simulation results show that the internal characteristic morphology of the keyhole is like a parabola in the stable welding state. After a certain time of welding, the boundary between the plasma internal weld pool and the MIG internal weld pool disappears, forming a common weld pool. After the MIG arc starts and the droplet transition is completed, there will be an obvious molten pool crest region and depression region between the two arcs. The crest region will oscillate under the action of arc force and plasma flow force. The flow mode and movement mechanism of metal in keyhole are described. New molten metal is produced under the plasma arc. The molten metal in the front end of the keyhole passes through the bottom of the keyhole to the rear end of the keyhole. This will move the keyhole forward.
Author Contributions
Conceptualization, X.M. and B.W.; methodology, X.M.; software, J.G.; validation, Z.H. and H.Z.; formal analysis, H.Z.; investigation, Z.H.; resources, W.C.; data curation, F.G.; writing—original draft preparation, X.M.; writing—review and editing, H.Z.; visualization, F.G.; supervision, H.Z. All authors have read and agreed to the published version of the manuscript.
Funding
This work was sponsored by the National Natural Science Foundation of China (No. U22B20127), the National Natural Science Foundation of China (No.52175305), Jining City Global List of Major Projects (No. 2022JBZP004) and New and Old Kinetic Energy in Shandong Province in 2021.
Data Availability Statement
Not applicable.
Conflicts of Interest
The authors declare no conflict of interest.
References
- Zhang, B.; Shi, Y.; Cui, Y.; Wang, Z.; Hong, X. Prediction of Keyhole TIG Weld Penetration Based on High-Dynamic Range Imaging. J. Manuf. Process. 2021, 63, 179–190. [Google Scholar] [CrossRef]
- Li, Y.; Tian, S.; Wu, C.S.; Tanaka, M. Experimental Sensing of Molten Flow Velocity, Weld Pool and Keyhole Geometries in Ultrasonic-Assisted Plasma Arc Welding. J. Manuf. Process. 2021, 64, 1412–1419. [Google Scholar] [CrossRef]
- Liu, X.F.; Jia, C.B.; Wu, C.S.; Zhang, G.K.; Gao, J.Q. Measurement of the Keyhole Entrance and Topside Weld Pool Geometries in Keyhole Plasma Arc Welding with Dual CCD Cameras. J. Mater. Process. Technol. 2017, 248, 39–48. [Google Scholar] [CrossRef]
- Fabbro, R.; Slimani, S.; Coste, F.; Briand, F. Study of Keyhole Behaviour for Full Penetration Nd-Yag CW Laser Welding. J. Phys. D Appl. Phys. 2005, 38, 1881–1887. [Google Scholar] [CrossRef]
- Jia, C.B.; Wu, C.S.; Zhang, Y.M. Sensing Controlled Pulse Key-Holing Condition in Plasma Arc Welding. Trans. Nonferrous Met. Soc. China English Ed. 2009, 19, 341–346. [Google Scholar] [CrossRef]
- Zhang, Y.M.; Zhang, S.B.; Liu, Y.C. A Plasma Cloud Charge Sensor for Pulse Keyhole Process Control. Meas. Sci. Technol. 2001, 12, 1365–1370. [Google Scholar] [CrossRef]
- Bakkiyaraj, M.; Palanisamy, P.; Balasubramanian, V. Evaluating the Tensile Strength of Friction Welded (AA6061 & AA7075-T6) Dissimilar Joints by Using Response Surface Methodology. Mater. Res. Express 2019, 6, 086527. [Google Scholar] [CrossRef]
- Subramanian, R.; Natarajan, B.; Kaliyaperumal, B.; Chinnasamy, R. Effect of MIG Welding Process Parameters on Microstructure and Tensile Behavior of Hastelloy C276 Using Response Surface Methodology. Mater. Res. Express 2019, 6, 066540. [Google Scholar] [CrossRef]
- Shahi, A.S.; Pandey, S. Modelling of the Effects of Welding Conditions on Dilution of Stainless Steel Claddings Produced by Gas Metal Arc Welding Procedures. J. Mater. Process. Technol. 2008, 196, 339–344. [Google Scholar] [CrossRef]
- Jahanzaib, M.; Hussain, S.; Wasim, A.; Aziz, H.; Mirza, A.; Ullah, S. Modeling of Weld Bead Geometry on HSLA Steel Using Response Surface Methodology. Int. J. Adv. Manuf. Technol. 2017, 89, 2087–2098. [Google Scholar] [CrossRef]
- Song, C.; Dong, S.; He, P.; Yan, S.; Zhao, X. Correlation of Process Parameters and Porosity in Laser Welding of 7A52 Aluminum Alloy Using Response Surface Methodology. Procedia Manuf. 2019, 37, 294–298. [Google Scholar] [CrossRef]
- Rosli, N.A.; Alkahari, M.R.; Ramli, F.R.; Fadzli bin Abdollah, M.; Kudus, S.I.A.; Herawan, S.G. Parametric Optimisation of Micro Plasma Welding for Wire Arc Additive Manufacturing by Response Surface Methodology. Manuf. Technol. 2022, 22, 59–70. [Google Scholar] [CrossRef]
- Apelgren, P.; Amoroso, M.; Säljö, K.; Montelius, M.; Lindahl, A.; Stridh Orrhult, L.; Gatenholm, P.; Kölby, L.; Arulkumar, S.; Parthiban, S.; et al. Ac Ce Pte d M Us Pt. Mater. Today Proc. 2019, 27. 0-31. [Google Scholar]
- Kumar, V.; Mandal, A.; Das, A.K.; Kumar, S. Parametric Study and Characterization of Wire Arc Additive Manufactured Steel Structures. Int. J. Adv. Manuf. Technol. 2021, 115, 1723–1733. [Google Scholar] [CrossRef]
- Li, T.Q.; Wu, C.S. Numerical Simulation of Plasma Arc Welding with Keyhole-Dependent Heat Source and Arc Pressure Distribution. Int. J. Adv. Manuf. Technol. 2015, 78, 593–602. [Google Scholar] [CrossRef]
- Jian, X.; Wu, C.S.; Zhang, G.; Chen, J. A Unified 3D Model for an Interaction Mechanism of the Plasma Arc, Weld Pool and Keyhole in Plasma Arc Welding. J. Phys. D Appl. Phys. 2015, 48, 465504. [Google Scholar] [CrossRef]
- Qiao, J.; Wu, C.; Li, Y. Numerical Analysis of Keyhole and Weld Pool Behaviors in Ultrasonic-Assisted Plasma Arc Welding Process. Materials 2021, 14, 703. [Google Scholar] [CrossRef] [PubMed]
- Kuang, J.H.; Hung, T.P.; Chen, C.K. A Keyhole Volumetric Model for Weld Pool Analysis in Nd:YAG Pulsed Laser Welding. Opt. Laser Technol. 2012, 44, 1521–1528. [Google Scholar] [CrossRef]
- Wu, C.S.; Huo, Y.S. Numerical Analysis of Keyhole Geometry and Temperature Profiles in Plasma Arc Welding. J. Manuf. Process. 2013, 15, 593–599. [Google Scholar] [CrossRef]
- Jian, X.; Wu, C.S. Numerical Analysis of the Coupled Arc-Weld Pool-Keyhole Behaviors in Stationary Plasma Arc Welding. Int. J. Heat Mass Transf. 2015, 84, 839–847. [Google Scholar] [CrossRef]
- Li, T.Q.; Chen, L.; Zhang, Y.; Yang, X.M.; Lei, Y.C. Metal Flow of Weld Pool and Keyhole Evolution in Gas Focusing Plasma Arc Welding. Int. J. Heat Mass Transf. 2020, 150, 119296. [Google Scholar] [CrossRef]
- Hertel, M.; Füssel, U.; Schnick, M. Numerical Simulation of the Plasma-MIG Process-Interactions of the Arcs, Droplet Detachment and Weld Pool Formation. Weld. World 2014, 58, 85–92. [Google Scholar] [CrossRef]
- Zhang, C.; Hu, Q.; Pu, J.; Wu, H. Study on the Molten Pool Fluid Behavior of PAW-Cable-Type Seven-Wire GMAW Hybrid Welding. Crystals 2022, 12, 306. [Google Scholar] [CrossRef]
- Gao, Z.; Jiang, P.; Mi, G.; Cao, L.; Liu, W. Investigation on the Weld Bead Profile Transformation with the Keyhole and Molten Pool Dynamic Behavior Simulation in High Power Laser Welding. Int. J. Heat Mass Transf. 2018, 116, 1304–1313. [Google Scholar] [CrossRef]
- Wu, C.S.; Zhang, T.; Feng, Y.H. Numerical Analysis of the Heat and Fluid Flow in a Weld Pool with a Dynamic Keyhole. Int. J. Heat Fluid Flow 2013, 40, 186–197. [Google Scholar] [CrossRef]
- Wu, D.; Tashiro, S.; Hua, X.; Tanaka, M. Analysis of the Energy Propagation in the Keyhole Plasma Arc Welding Using a Novel Fully Coupled Plasma Arc-Keyhole-Weld Pool Model. Int. J. Heat Mass Transf. 2019, 141, 604–614. [Google Scholar] [CrossRef]
- Miao, X.; Zhang, H.; Ge, F.; He, Z.; Gao, J.; Su, Z. Research on Arc Morphology and Keyhole Behavior of Molten Pool in Magnetically Controlled Plasma-GMAW Welding. Int. J. Metals. 2023, 13, 148. [Google Scholar] [CrossRef]
- Xu, G.X.; Wu, C.S.; Qin, G.L.; Wang, X.Y.; Lin, S.Y. Adaptive Volumetric Heat Source Models for Laser Beam and Laser + Pulsed GMAW Hybrid Welding Processes. Int. J. Adv. Manuf. Technol. 2011, 57, 245–255. [Google Scholar] [CrossRef]
- Miao, J.Y. Study on Weldpool Fluid Behavior of Plasma arc Welding + Cable-Wire Pulsed GMAW Hybrid Welding. Master’s Thesis, Jiangsu University of Science and Technology, Zhenjiang, China, 2012. (In Chinese). [Google Scholar]
- Goldak, J.; Chakravarti, A.; Bibby, M. A New Finite Element Model for Welding Heat Sources. Metall. Trans. B 1984, 15, 299–305. [Google Scholar] [CrossRef]


Disclaimer/Publisher’s Note: The statements, opinions and data contained in all publications are solely those of the individual author(s) and contributor(s) and not of MDPI and/or the editor(s). MDPI and/or the editor(s) disclaim responsibility for any injury to people or property resulting from any ideas, methods, instructions or products referred to in the content. |
© 2023 by the authors. Licensee MDPI, Basel, Switzerland. This article is an open access article distributed under the terms and conditions of the Creative Commons Attribution (CC BY) license (https://creativecommons.org/licenses/by/4.0/).