Abstract
In this work, an AA5183 alloy plate was successfully deposited by low-power cold metal transfer technology. The forming defects, microstructural characteristics, and mechanical properties were investigated. The results show that the number of defects increases gradually along the building direction of the deposited plate. X-ray diffraction, scanning electron microscopy, energy dispersive spectroscopy, electron probe microanalysis, electron backscatter diffraction, and transmission electron microscopy were employed to study the distribution of alloying elements, deposited microstructural characteristics, and the crystal structure of intermetallic compounds in the Al alloy plate. The tensile samples perpendicular to the building direction presented greater tensile strength and superior plasticity compared to those parallel to the deposition direction. The average UTS was 327 ± 0.65 MPa and the average EL was 30.6 ± 2.0%. The UTS of conventionally forged 5083-H32 (Al-Mg4.5) alloy is 324 MPa; the UTS of extruded 5083-H116 (Al-Mg4.5) alloy is 305 MPa. Further, the strength of our prepared plate reaches the value needed for industrial applications of the 5083 Al alloy. The differences in the strength and plasticity of the samples assessed under multiple sampling methods were analyzed based on a synergistic strength–ductility mechanism.
1. Introduction
Additive manufacturing is a more efficient and cheaper forming technique than traditional processing methods [1,2,3]. It provides a new direction of development for modern manufacturing because of its innovative nature. Based on the energy source, metal additive manufacturing techniques can be divided into laser additive manufacturing, electron beam additive manufacturing, and wire arc additive manufacturing (WAAM) [4,5,6].
WAAM can be used to produce metallic components in a layer-by-layer fashion. Because of their high heat input and rapid forming speed, electric arcs are used as a heat source to fabricate highly complex, low-cost components [7,8,9,10]. However, poor forming accuracy and deformation caused by the large heat input deteriorate the mechanical properties, limit the industrial applications of WAAM [11,12,13,14].
Cold metal transfer (CMT) welding technology has excellent welding performance and properties, such as remarkably low input heat energy and a highly stable arc. In recent years, many studies have explored the characteristics of WAAM, such as the formability, precision, microstructure, and mechanical properties of manufactured alloy parts. Wu et al. [15] fabricated an Al-Cu alloy by laser-tungsten-inert-gas (TIG) hybrid WAAM. They found that the microstructure at the interlayer of the sample was a coarse columnar dendritic structure. Gu et al. [16] studied the microstructural characteristics of the Al–Cu6.3–Mg1.3 alloy additively manufactured by double welding. They claimed that a nanoscale metastable S’ phase was present that accounted for the high alloy strength. Wang et al. [17] investigated the relationship between the deposition height, microstructures, and mechanical properties (microhardness and tensile strength): the microhardness and tensile strength of the near-substrate region were superior to those of the layer bands and top region. Wu et al. [18] studied the economic feasibility and process adaptability of WAAM. In general, Al alloy parts formed by WAAM are prone to defects, such as the presence of coarse columnar grains, pores, and cracks, which have a significant impact on the mechanical properties of deposited specimens [19,20].
There are some differences between CMT technology and ordinary Melt Inert-Gas Welding and Metal Active-Gas Welding (MIG/MAG); these include the digital coordination of the wire feeding movement and the droplet transition process, a low heat input, and a splash-free transition that are characteristics of CMT. Therefore, CMT technology is an advanced gas-shielded welding technique with the key benefit of splash-free transition [21,22].
Al–Mg alloys have been used extensively in the fabrication of seawater facilities (such as ship hulls), armor plating, rail cars, and storage tanks because of their characteristic high specific strength, good corrosion resistance, and weldability. The mechanical properties of the Al–Mg alloys can be improved by the addition of elements such as Mn and Cr [23,24,25].
In this work, an AA5183 alloy plate was deposited from bottom to top by the CMT technique. The forming defects, element distribution, and microstructure characteristics of the prepared sheet were studied. The effects of element distribution and microstructure at different positions on the tensile properties of the deposited aluminum alloy sheet were analyzed. The porosity and pore distribution were analyzed, and the fracture surface was analyzed. Furthermore, the internal strengthening mechanism of as-deposited sheets with high tensile strength and high elongation (EL) at break was studied. The distribution of equiaxed grains, columnar grains, and fine grains with the increase of the deposition layer and the grain strengthening mechanism were studied. The distribution and strengthening mechanisms of Al3Mg2 fine grains at the secondary phase Al6(Mn, Fe) interface were studied. This work is beneficial to the study of CMT deposition of high strength and high elongation Al-Mg-Mn alloy plate, the study of Al-Mg-Mn deposition plate grain distribution, element distribution, the second phase particles and the secondary phase, and Al-based interface microcrystalline distribution.
2. Experimental Procedures
2.1. Investigated Material
In this work, 1.2 mm diameter AA5183 alloy welding wire, manufactured by Yunnan Aluminum Co., Ltd. (Yunnan, Kumming, China), according to the commercial AA5183 standard, was used. A support plate composed of the 5083 Al alloy with a 15 mm thickness, 315 mm length, and 60 mm width was used. The chemical composition of the fabricated plate was determined by inductively coupled plasma-atomic emission spectroscopy (ICP-AES) and is listed in Table 1.

Table 1.
Chemical composition of AA5183 welding wire (wt%).
2.2. Layer Deposition
The schematics of the process are shown in Figure 1. Fuse additive deposition tests were performed using a TransPlus Synergic 5000 Cold Metal Transfer Welding machine (Fronius Intelligent Equipment Co., Ltd. Wells, Austria) and a six-axis robot and robot control cabinet (YASKAWA Electric Corporation; Kitakyushu, Fukuoka, Japan). Samples with dimensions of 250 mm × 3 mm × 110 mm were built by CMT.
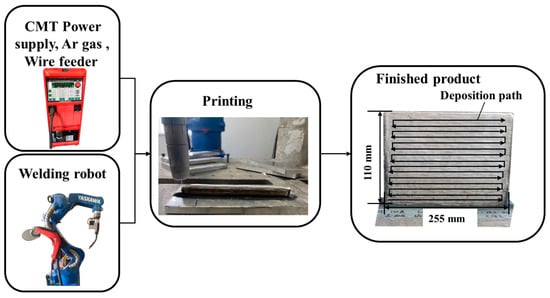
Figure 1.
Schematics of experimental equipment and process.
The necessary deposition parameters were determined by controlling the welding current of the welding machine. Exploratory experiments were performed to determine the optimum process parameters for WAAM based on the formation of Al alloys. The detailed deposition parameters are presented in Table 2 and include a 3.5 m/min feeding rate, a 110 cm/min scanning speed, 99.99% argon shielding gas at a flow rate of 20 L/min, and a 15 s interval between layers. The deposition temperature is controlled at 120 °C during the deposition process. After deposition, samples were cut from the upper, middle, and lower regions of the deposited plate by using a wire cutter. The samples were then subjected to grinding and polishing and then etched with a 0.5% HF solution for 15 s to reveal the microstructure.
Table 2.
CMT welding process parameters.
2.3. Microscopic Observation
The microstructure was observed by optical microscopy (OM; Eclipse MA200, Nikon, Tokyo, Japan) and field emission scanning electron microscopy (FESEM; Nova Nano SEM450, FEI, Hillsborough, OG, USA) with an energy-dispersive spectroscopy (EDS) detector. The fracture surfaces after tensile testing and the surface morphologies of the three samples were observed using scanning electron microscopy (SEM; VEGA-3SBH, Tescan, Brno, Czech Republic). The phase constituents of the samples were identified by X-ray diffraction (XRD; D8 Advance, Bruker AXS, Billerica, MA, USA) using Cu radiation. The grain size, grain boundaries, and texture orientation were investigated using electron backscatter diffraction (EBSD; Nordly Nano; Oxford Instruments; Oxford Abingdon, UK) on a MIRA3 SEM (TESCAN). A transmission electron microscope (TEM; Tecnai G2 TF30, FEI) was used to observe and identify the phases in the samples.
2.4. Mechanical Performance Tests
The schematics of the sampling process and the tensile test sample are shown in Figure 2. Room-temperature testing was carried out using an AG-X plus 100 KN (Shimadzu; Tokyo, Japan) at a cross-head displacement rate of 1 mm/min, according to the GB/T-228.1-2010 standard.
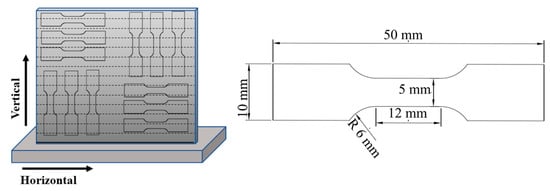
Figure 2.
Schematics of the sampling process and tensile test specimen.
3. Results
3.1. Microscopic Inspection
Figure 3 shows the microstructure of the longitudinal section of the deposited 5183 Al alloy plate. A layered structure can be clearly seen in Figure 3. Figure 3a,b display a series of pores and some secondary phases in the upper region. As shown in Figure 3c,d, the number of pores and the size of the secondary phases are significantly lower in the middle region. Few pores are present in the bottom part of the deposited Al alloy plate, and secondary phases appear granular in this region (Figure 3e,f). In addition, the α-Al matrix shows strong dendritic structures across the section of the deposited Al plate (Figure 3e).
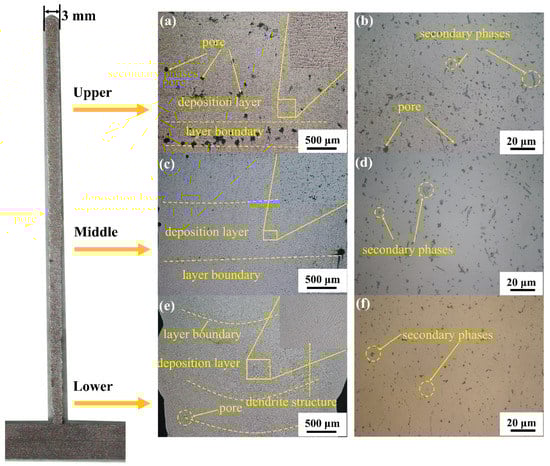
Figure 3.
Optical microscope images of a longitudinal section of deposited 5083 alloy plate; (a,b) upper section Optical microscope images; (c,d) middle section Optical microscope images; (e,f) middle section Optical microscope images.
Figure 4a shows the mean area (MA), mean perimeter (MP), mean length (ML), and mean width (MW) of pores and porosity of deposited samples in different regions. The porosity ρ was calculated as follows:
where Ap denotes the cross-sectional pore area and Aw is the total cross-sectional area. The MA of pores in the upper part of the sample is highest, reaching 1005.5 ± 17.2 μm2. The MA of pores in the middle region is 599.8 ± 20.1 μm2, while that in the lower region is the lowest: 25.7 ± 1.5 μm2. The pore MP values in these three different areas also follow a similar trend: 104.8 ± 12.4, 72.4 ± 15.6, and 16.3 ± 5.8 μm for the upper, middle, and lower areas, respectively.
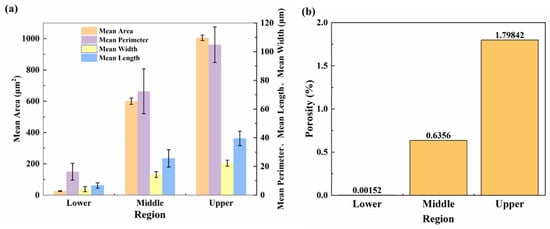
Figure 4.
Statistics pertaining to defect characteristics in different regions of the deposited plate: (a) mean area (MA), mean perimeter (MP), mean length (ML), and mean width (MW) of pores; (b) porosity.
Figure 3 and Figure 4b show that the macroscopic defects and pore size of the deposited plate increase gradually along the building direction. The porosity of the bottom layer is the lowest at only 0.0015%, compared with 0.6356% and 1.7984% in the middle and upper regions, respectively. Under standard atmospheric pressure, the porosity of as-cast AA5183 alloy is about 1.5% [26], and the pore distribution is uniform. Compared with AA5183 alloy components manufactured by the CMT process, the as-cast porosity is higher.
3.2. Microstructure of Deposited 5183 Al Alloy Plate
Figure 5 shows the XRD patterns of the as-deposited 5183 alloy plate in the direction parallel to the building direction. According to the patterns, the identified phases are mainly α-Al. Details of diffraction spectra corresponding to 64.5° ≤ 2 ≤ 65.5° confirm the presence of the Al3Mg2 phase in these as-deposited samples. Moreover, due to the solid solution of some Mg elements in the Al matrix, the lattice constant of Al increases, and the diffraction peaks shift to the left.
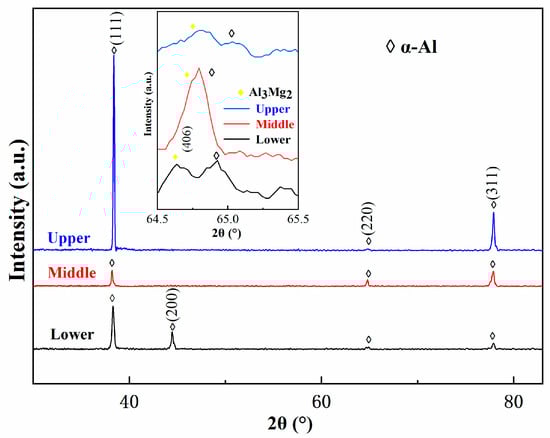
Figure 5.
XRD spectra of different regions of deposited 5183 alloy plate.
Figure 6 shows the elemental distribution profile obtained using EPMA. Figure 6a–c indicate that Mg and Mn elements are uniformly distributed in the Al matrix in the upper region. From the top to the bottom region, the distribution of Mg is clear in the form of dendritic structures. Further, as shown in Figure 6d–i, the Al and Mn elements remain evenly distributed.
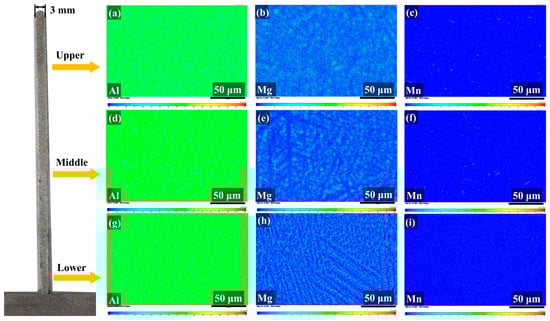
Figure 6.
Electronic probe microanalysis (EPMA) elemental distribution map. Elemental distribution map of the upper region: (a) Al, (b) Mg, and (c) Mn. Elemental distribution map of the middle region: (d) Al, (e) Mg, and (f) Mn. Elemental distribution map of the lower region: (g) Al, (h) Mg, and (i) Mn.
Figure 7 shows the SEM images and EDS results from different regions of the deposited 5183 alloy plate. As shown in Figure 7a–c, the pores of the upper region appear to be irregular and large, and those in the middle and lower regions appear to be micropores. The secondary phases in the deposited plate are mainly composed of Al, Mg, Mn, and Fe elements. In addition, the Mg content in the Al matrix decreases gradually from top to bottom.
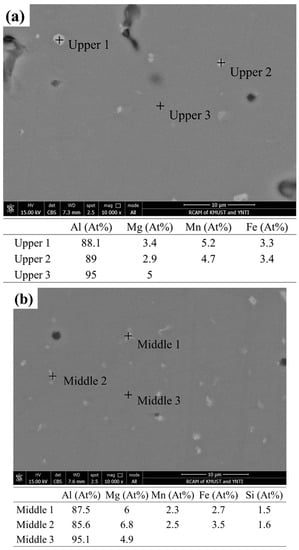
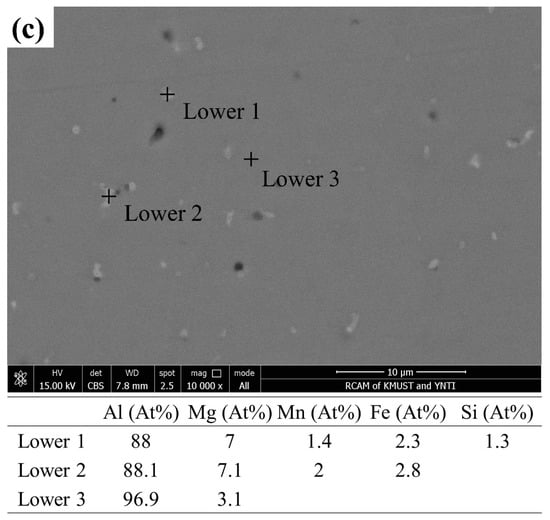
Figure 7.
SEM of the deposited 5183-Al plate: BSE in the (a) upper, (b) middle, and (c) lower regions. Chemical compositions (at %) of the corresponding second phases and the Al matrix.
Figure 8 shows the EBSD grain orientation maps of different regions of the deposited plate and the corresponding pole and inverse pole diagrams. As shown in the orientation imaging maps (Figure 8a,c,e), the morphologies of the grains from the different deposited regions are different.
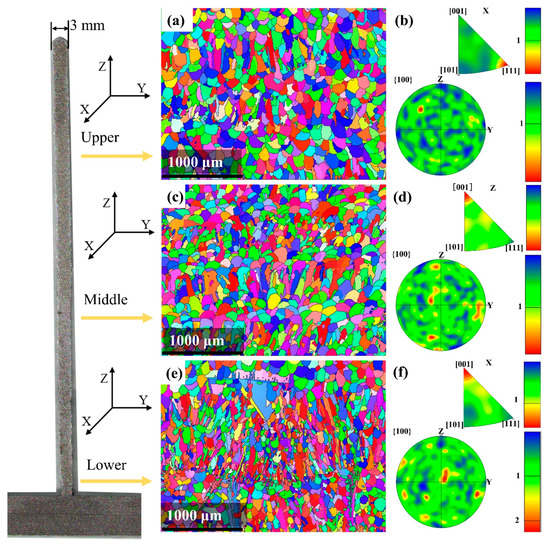
Figure 8.
EBSD orientation maps and pole figures corresponding to different regions: upper, middle, and lower regions. Orientation maps with reconstructed grain boundaries in the (a) upper, (c) middle, and (e) lower regions. Inverse pole figures (IPF) and (100) pole figures of the (b) upper, (d) middle, and (f) lower regions.
The deposited grains in the bottom region are of a typical long and narrow shape because the rate of upward growth was much higher than that in the horizontal direction. In addition, the energy distribution or temperature gradient close to the base layer is not uniform, which can cause local remelting and lead to different grain morphologies.
As the height of the deposited layer increases, the grain diameter increases. As shown by the grain morphology in the middle region, horizontal growth increases. In the upper region, the temperature gradient consistency is strong, and the grains show the equiaxed crystal state.
Figure 9a shows the recrystallization distribution map. Recrystallization accounts for 90.7% of the total area, whereas sub-structured and deformed areas account for 8.4% and 0.9%, respectively (Figure 9b). The blue recrystallized area mostly contained equiaxed grains, with the sub-structured and deformed grains distributed mainly among the deposited layers. Further, Figure 9c shows that the grain diameter is 1–200 μm, the average grain diameter is 84.7 ± 0.5 μm, and 91.6% of the grains have a diameter of ≤150 μm. In addition, 28% of the total mass is comprised of grains with a diameter less than 50 μm, whereas 50–100 μm grain size and 100–150 μm grain size account for 34.7% and 30% of the total mass.
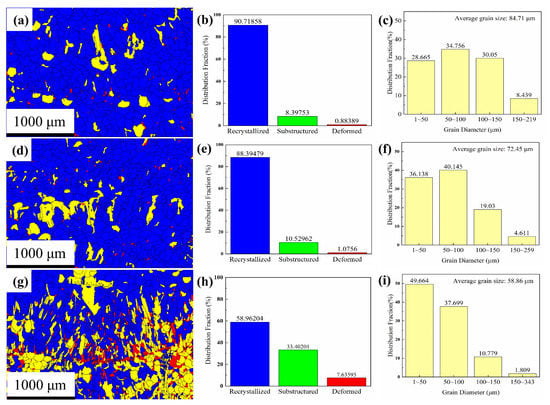
Figure 9.
Distribution fraction of recrystallized grains: (a,d,g) recrystallization distribution maps of upper, middle, and lower regions; (b,e,h) recrystallization distribution maps of upper, middle, and lower regions; and (c,f,i) grain diameter distribution of upper, middle, and lower regions.
The recrystallization distribution map of the middle region (Figure 9d,e) shows that the recrystallized area contains mainly equiaxed grains, which are distributed in the deposited layer and account for 88.4% of the total number of grains. The sub-structures are mostly columnar grains, which are distributed among the deposited layers and account for 10.5% of the total. The deformed grains are distributed mainly among the deposited layer boundaries and account for 1.1%. The grain diameter of the middle region (Figure 9f) ranges from 1 to 260 μm, with an average grain size of 72.4 ± 0.4 μm. Among them, 95% of the grains have a diameter of ≤150 μm, and 76% of the grains have a diameter of <100 μm.
In the recrystallization distribution map of the lower region (Figure 9g,h), the recrystallized grains are mainly equiaxed crystals and account for 59% of the total. The substructure grains are distributed mainly in the deposited layer and account for 33.4% of the total. The red, distorted grains are finer, accounting for 7.6% of the total, and are distributed among the deposited layer boundaries. The grain diameter range of the lower region (Figure 9i) is 1–343 μm; the diameter of 98.2% of the grains is less than 150 μm, and the average grain diameter is 58.8 ± 0.5 μm. Further, the diameter of 87.4% of the grains is less than 100 μm, and 49.7% of the grains are less than 50 μm in diameter.
In general, the grain texture characteristics of the deposited Al plate from the upper to the lower region strengthened, the number of equiaxed grains decreased, the number of columnar grains increased, and the columnar grains showed intense textural characteristics. From the upper part to the lower part of the deposited plate, the proportion of recrystallized grains decreased and the proportions of sub-structured and deformed grains increased.
Figure 10 presents bright-field TEM images and SAED patterns of the secondary phases in the upper (Figure 10a–c) and lower (Figure 10d–f) regions. Based on the EDS (Figure 7) and TEM (Figure 10) analysis results, the composition of the particle phases is found to be mainly Al6Mn with an orthogonal structure, which corresponds to the Cmcm space group. The Fe and Si atoms in the tetragonal and pentagonal morphologies of Al6(Mn, Fe) or Al6(Mn, Fe, Si) replace some of the Mn atoms and form a precipitated phase while maintaining the same lattice structure as that of Al6Mn. The interplanar spacing of the indexed planes is determined from the images in Figure 10c,f and listed in Table 3.
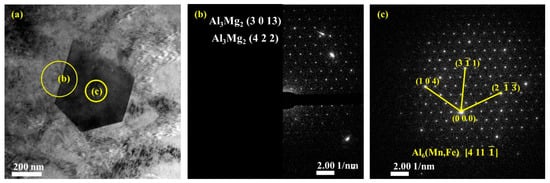
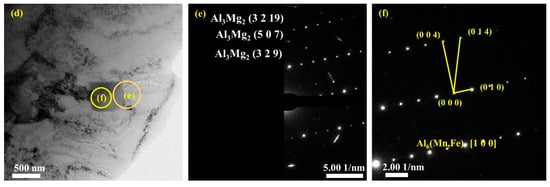
Figure 10.
TEM bright-field images and selected area electron diffraction (SAED) patterns of the second phases: (a–c) bright-field images and corresponding SAED patterns of secondary phases and interface of secondary phases boundary in upper region; (d–f) in lower region.
Table 3.
Lattice constant data of the precipitated secondary phases.
In the different regions of the deposited plate, the small amount of precipitated Al3Mg2 phase in the Al matrix was also examined. The corresponding lattice planes of these nanoscale polycrystalline precipitates are as shown in Figure 10b,e.
3.3. Mechanical Properties of Deposited 5183 Al Alloy Plate
The tensile strength and elongation (EL) of the samples shown in Figure 2 are illustrated in Figure 11, and the mechanical properties are listed in Table 4. The average elastic modulus (E) of the as-deposited AA5183 alloy plate sample is 42.4 ± 8.9 GPa, the average yield strength (YS) is 138.9 ± 9.7 MPa, the average ultimate tensile strength (UTS) is 318.3 ± 8.1 MPa, and the average EL is 26.6 ± 5.2%. Significant differences are observed in the tensile properties, especially in the E and EL, of the samples taken from different locations. This finding indicates that the deposited Al–Mg–Mn was heterogeneous.
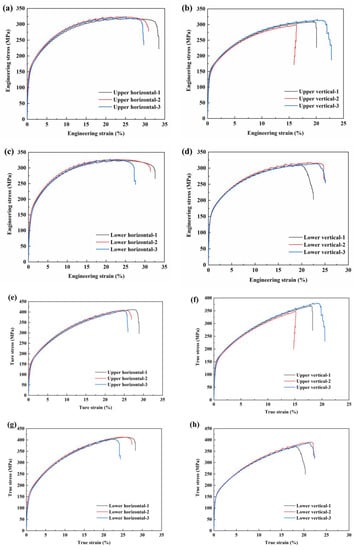
Figure 11.
Tensile properties of the as-deposited Al–Mg–Mn plate and fracture position of the tensile test specimen: stress–strain curve of the upper region: (a) horizontal specimen and (b) vertical specimen; stress–strain curve of the lower region: (c) horizontal specimen and (d) vertical specimen. The real tensile curve of the upper region is: (e) horizontal specimen and (f) vertical specimen; the stress–strain curve of the lower region is: (g) horizontal specimen and (h) vertical specimen.
Table 4.
Elastic modulus (E), yield strength (YS), ultimate tensile strength (UTS), True Ultimate Stress (TUS), and elongation (EL) at different positions.
The average E and YS in the vertical direction are 31.1% and 6.2% higher, respectively, than those in the horizontal direction. In contrast, the average UTS and EL in the horizontal direction are 4.2% and 40.1% higher, respectively, than those in the vertical direction. The average E and EL of the lower region are 18.6% and 7.6% higher, respectively, than those of the upper region, and the difference between their average YS and average UTS was less than 0.5%.
A cross-sectional SEM image of the selected area in Figure 12 shows shallow and uniform equiaxial dimples typical of ductile fracture. Smooth dimples without exposed columnar dendrites are evidence of micropore nucleation, growth, and polymerization on the fracture surface. In Figure 12a, the tearing edge is inclined, indicating a tearing dimple. The diameter and depth of the dimple depend on the size and number of the second-phase particles, their ability to undergo plastic deformation, the strain-hardening index of the matrix material, and the magnitude and state of the applied stress. Figure 12b,d shows the distribution of the secondary phase and pores in the dimples. Figure 12f,h shows finger-like protrusions (a typical pore) and indicates that the existence of pores makes fracture easier. Figure 12 demonstrate a typical plastic fracture, and the fractured surface shows fracture dimples and pores.
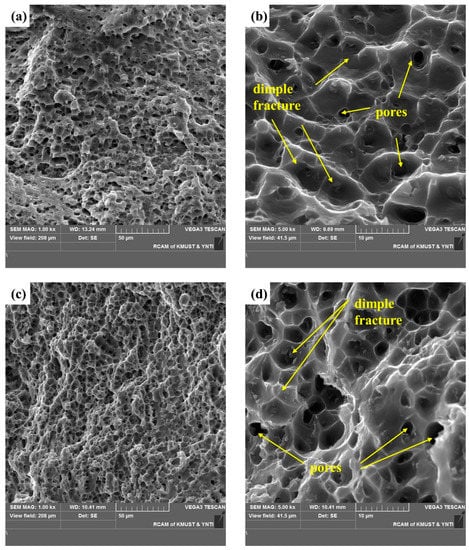
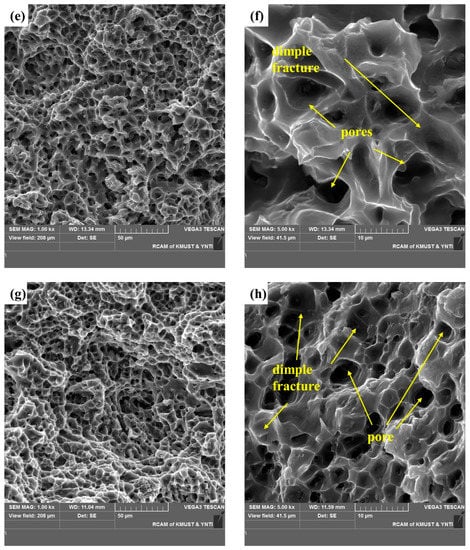
Figure 12.
SEM images of the fracture surface of a tensile test specimen: SEM images of the fracture surface in horizontal direction: (a,b) the upper region, and (c,d) lower region. SEM images of the fracture surface in the vertical direction: (e,f) the upper region and (g,h) the lower region.
These results suggest that shear fracture was dominant, and the fracture characteristics differed with the position in the specimens. Moreover, the continuous secondary phases and pores acted as crack initiation sites. The geometric discontinuity of the pores connected the cracks that initiated in the secondary phases and may have accelerated subsequent crack propagation [25,27].
Figure 11 and Figure 12 show the stress–strain diagram and fracture surface morphology of typical tensile test samples. The porosity of the vertical sample is higher than that of the horizontal sample.The average UTS in the horizontal direction is 324.8 ± 3.5 MPa, and the average EL is 31.1 ± 1.8%. The average UTS in the vertical direction is 311.8 ± 5.9 MPa, and the average EL is 22.2 ± 3.5%. The results show that the pore volume fraction between the deposited layers is high and that the pores easily cause stress concentration and fracture. As per the tensile test results, the average UTS and EL of the vertical samples are lower than those of the horizontal samples because of the higher porosity between the deposited layers in the vertical samples; further, the fracture plane of the vertical sample is located between the deposited layers.
4. Discussion
4.1. Characteristics of Defects and Microstructures
4.1.1. Analysis of Pore Formation
Figure 3 and Figure 4 show the defect distribution and porosity of the three different regions of the deposited plate. The porous nature is the main defect of aluminum deposition parts. The main reason for pore formation is believed to be the presence of hydrogen. Hydrogen can come from many sources. The main source of hydrogen is surface contamination of the parent and deposited metals in the form of hydroxides, hydrocarbons, or oxides with adsorbed water. Further, another source of hydrogen may be impurities, moisture, or air in the gas shield in the inhaling arc atmosphere. Even 2 ppm of hydrogen in molten metals or 250 ppm in gas shields is sufficient to create pores in the aluminum-deposited layer [28].
In the CMT process, a higher deposition rate resulted in a smaller molten pool area, lower liquid metal fluidity in the molten pool, and a lower possibility of hydrogen gas escape from the molten pool, which led to the formation of pores. During solidification, the higher the deposition layer, the slower the temperature loss, and the longer the molten pool maintenance, which makes hydrogen float more easily, causes small pores to move upwards and gather into larger pores [25].
Figure 4 and Figure 12 show that the porosity of the three different areas was less than 2%, which is acceptable for Al alloy plates. Pores with sizes <5 μm are eliminated during the deformation process. Moreover, pore sizes less than 5 μm in the deposited alloy can lead to better plasticity [29]. The results of this study also indicate that the elongation of the deposited plate decreases when the pore size increases above 5 μm.
In the present study, the pore size of the lower region was smaller than that of the upper region. Therefore, along the axis parallel to the building direction, the lower region presents better plasticity than the upper region. In addition, the interface between micropores and the secondary phase may provide a possible source for fracture initiation, resulting in the deterioration of the mechanical properties [30]. The existence of cluster pores reduces the effective cross-sectional area of AM Al alloy to resist load, which leads to high stress concentration at cluster pores, accelerates crack fracture, and reduces plasticity. According to in situ fracture analysis, for aluminum alloys, the growth of pores mainly leads to ductile fracture rather than particle fracture. The larger pores elongate along the tensile direction, causing crack diffusion and eventually surface fracture [31]. The use of a higher current and a slower deposition rate makes the molten pool exist longer, which is conducive to the escape of hydrogen. In addition, pulse modulation deposition can also effectively prevent pore formation [32].
In the design of structural applications, the understanding of the elastic properties of materials is crucial. Therefore, the relationship between porosity and elastic properties in materials is a long-term concern of researchers. The increase of porosity leads to the decrease of elastic modulus. In order to fully understand the relationship between elastic modulus and porosity in the material, the following elastic modulus expression is used [33]:
is the elastic modulus of the porous material, is the elastic modulus of the solid, is the porosity, and is the maximum porosity of the system.
In Figure 13a, as the porosity decreases, the elastic modulus also gradually decreases, but when the porosity gradually increases, the elastic modulus increases. It shows that the correlation between porosity and E is low. In Figure 13b, with the increase in porosity, TUS decreases and YS increases. It shows that with the increase of porosity, elastic modulus decreases. The AA5183 alloy sheet prepared by CMT has low porosity and is not a porous material. The relationship between porosity and elastic modulus cannot explain the change in elastic modulus. However, the average E in the lower region is 18.6% higher than that in the upper region, which indicates that the porosity will affect the elastic modulus of the tensile pattern.
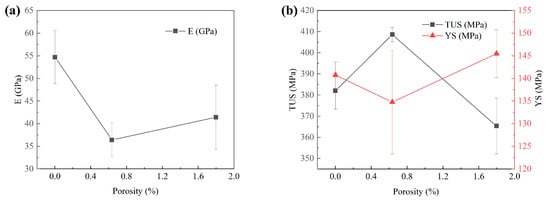
Figure 13.
(a) The relationship between porosity and elastic modulus. (b) The relationship between the True Ultimate Stress and Yield Stress with the change of porosity.
4.1.2. Analysis of Alloy Element Distributions
The rapid cooling rate in laser power bed fusion (LPBF) manufacturing inhibits Mg diffusion, leading to elemental Mg enrichment at grain boundaries [34]. Moreover, when elemental Mg is supersaturated in the Al matrix, excess Mg atoms diffuse along the grain boundaries [35]. In the present study, Mg-rich dendritic structures were observed in the middle and lower regions, as shown in Figure 3 and Figure 6. The Mg in the upper region has a higher solubility in the Al matrix due to a rapid cooling rate. However, Mg precipitated to different extents in the form of the Al3Mg2 phase (Figure 10) along the grain boundary in the middle and lower regions under the influence of thermal cycling due to the CMT power source. In the CMT process, solute redistribution during solidification is the cause of the microsegregation of elements. WAAM is a process with a fast cooling rate and a fast solidification rate. During solidification, Mg tends to segregate to the interdendritic region and grain boundary [19].
Along with the high intensity of the X-ray diffraction peak of the (1 1 1) crystal plane of α-Al in Figure 5, these results indicate a strong macroscopic orientation of the (1 1 1) crystal plane of α-Al in the upper region. The deviation of the (1 1 1) crystal plane at the three regions in Figure 5 was attributed to the elemental Mg in the upper region being dissolved in the Al matrix.
Mn, on the other hand, is only partially dissolved in the Al matrix and the rest exists in the form of Al6(Mn, Fe) intergranular precipitates. The existence of Mn increases the strengthening volume of the Al6(Mn, Fe) intermetallic compound and further improves the strength of the Al-Mg alloy. The uniform distribution of Mg can improve the mechanical properties and corrosion resistance of the AA5183 alloy. The enrichment and segregation of Mg elements will lead to the precipitation of Al3Mg2 phase along the grain boundary, forming a corrosion channel, and reducing the corrosion performance [36].
4.1.3. Analysis of Grain Characteristics
Figure 8 shows the EBSD grain orientation and grain boundary maps. Heterostructures with an alternating distribution of columnar crystals and equiaxed crystals can be observed. In general, the transition from columnar to equiaxed crystals can be achieved by adjusting the heat gradient, thus controlling the grain growth rate and the cooling rate. A typical columnar dendritic structure is parallel to the building direction along the pronounced thermal gradient of the melt pool and distributed in the direction of the vertical section of the deposited plate. Meanwhile, the layer between the columnar dendrite structures was dominated by equiaxed grains in the molten pool center.
Similar to the case under casting conditions, the bottom layer exhibits strong columnar crystal features and smaller equiaxed grains because the region close to the Al alloy substrate experiences a greater extent of heat exchange. In contrast, due to a lower temperature gradient, the grains of the upper layer grow in each direction simultaneously to form large equiaxed grains [37,38].
4.2. Mechanisms Responsible for Enhanced Strength
4.2.1. Solid Solution Strengthening
The solution strengthening effect of the Al alloy is mainly due to Mg atoms that cause lattice distortion, thereby increasing the alloy’s yield strength. The solid solution strengthening effect of Mg atoms can be calculated as follows [39]:
where CMg is the content of the solid solution Mg (wt%), n = 1.14 and is a constant, and H = 12.1 MPa (Mg wt%)−1. The yield strength increment attributed to solute strengthening is shown in Table 5.
Table 5.
The yield strength increment attributed to solute strengthening.
4.2.2. Grain Boundary Strengthening
In Figure 11a,c, a slight difference in elongation between the upper and lower regions in the horizontal direction is seen, and the elastic modulus of the lower region is higher than that of the upper region. Because the elastic modulus indicates the stiffness of the material, it represents the resistance of the metal to elastic deformation. The larger the value of the elastic modulus, the lower the elastic deformation will be under the same stress. The elastic modulus of polycrystalline metal is the statistical average of the elastic modulus of each grain, showing pseudo-isotropy.
As the rate of cooling in the CMT process has a significant influence on the grain size, as shown in Figure 9, large equiaxed grains appear in the upper region, while the average grain size is small in the lower part. According to the Hall–Petch formula, the reduction in the grain size will lead to an increase in the yield strength, and the extent of such strengthening can be estimated as follows [40]:
where σ0 is the natural resistance of the Al lattice to dislocation motion (for Al, this is 20 MPa), d is the average particle size, KHall-Petch = 140, and is the material constant (Pa/μm1/2). The change σGB in yield strength due to grain refinement is presented in Table 6.
Table 6.
The yield strength increment attributed to fine-grain strengthening.
4.2.3. Secondary Phase Strengthening
In Figure 7 and Figure 10, secondary phases with different microstructures are found to be distributed in the matrix. The secondary phases in the upper region are larger than those in the lower region. In addition, along the deposition direction, the size of the secondary phase increases and the distribution gets lower (see Table 7); because the fine, dispersed secondary phase Al6(Mn, Fe) precipitates at the grain boundary, this hard secondary phase presents a strong obstacle to dislocation motion, so the migration of the grain boundaries is difficult. The precipitation of these micro- and nanoscale secondary phases leads to strength improvement by the Orowan strengthening mechanism [41,42].
Table 7.
The yield strength increment attributed to Orowan strengthening.
The effect of precipitation strengthening on the yield strength of composites can be expressed as follows [41,42]:
where M is the Taylor factor (3.06 for Al with a random texture), G (25.4 GPa) is the shear modulus of Al, b (0.286 nm) is the Burgers vector, ν (0.345) is the Poisson’s ratio of Al, and r is the average particle radius. Assuming a spherical morphology, L is the interparticle spacing, which is given by:
where f is the volume fraction of particles.
5. Conclusions
A 5183 Al alloy plate was successfully fabricated by CMT-based WAAM. The pore size and porosity, microstructural characteristics, and mechanical properties were studied. The conclusions are summarized as follows:
- Pore size and porosity are linearly distributed parallel to the deposited layer and exist between deposited layers. From the lower part to the upper part of the deposited Al alloy plate, the porosity gradually increases. Due to the different porosity and pore size at different locations, the elongation in the vertical direction is affected, and the elongation of the upper region is lower than that of the lower region. The elongation in the horizontal direction is higher than that in the vertical direction;
- The mechanical properties of the samples oriented in two different directions in four regions were investigated. Due to the high porosity between the deposited layers in the vertical samples, the fracture surface of the vertical samples is located between the deposited layers. Perpendicular to the building direction, the vertical samples present excellent strength and ductility. The mean average ultimate tensile strengths of the upper and lower samples were 322 ± 2.4 MPa and 327.7 ± 0.6 MPa, respectively, with 31.5 ± 2.4% and 30.6 ± 2.0% ductility, respectively;
- The upper region of the cross section of the deposited plate is mainly composed of equiaxed grains, and the middle and lower regions are mainly composed of periodically arranged equiaxed grains and columnar grains. Further, the grain size gradually increases along the building direction;
- The crystal structure of the particles of the second phase Al6(Mn, Fe) was characterized. The size of the secondary phase crystals gradually increases, and the distribution coefficient gradually decreases along the deposition direction. Al3Mg2 fine grains exist between the Al6(Mn, Fe) secondary phase particles and the Al matrix;
- There are three main strengthening mechanisms affecting the strength of a deposited plate. Through calculation and analysis, the contributions of solution strengthening, grain boundary strengthening, and secondary phase strengthening are found to be 67.1 MPa, 38.2 MPa, and 125.1 MPa, respectively.
Author Contributions
Conceptualization, L.L. and X.J.; methodology, L.L. and X.J.; validation, B.X., Y.J. and B.Y.; formal analysis, X.J.; investigation, X.J.; resources, L.L.; data curation, X.J.; writing—original draft preparation, L.L. and X.J.; writing—review and editing, L.L., X.J. and M.D.H.; visualization, X.J.; supervision, L.L., Q.S., Z.L., Z.Y., B.X., Y.J. and B.Y.; project administration, L.L.; funding acquisition, Z.L., Z.Y., B.X., Y.J. and B.Y. All authors have read and agreed to the published version of the manuscript.
Funding
This research was funded by the Applied Basic Research Project of Yunnan Province, grant number (202101AT070123), the Yunnan Provincial Science and Technology Project, grant number (202104AR040008), the Science and Technology Innovation Base Construction Project Fund, grant number (202207AB110003), the Key Research and Development Project of Yunnan Province and the International Science and Technology Cooperation Project, grant number (202103AF140004), and the Science and Technology Major Project of Yunnan Province, grant number (202202AG050011).
Data Availability Statement
The data that support the findings of this study are available upon request.
Acknowledgments
This work is supported by the National and Local Joint Engineering Laboratory of Advanced Metal Solidification Forming and Equipment Technology and the Analytic and Testing Research Centre of Yunnan, Kunming University of Science and Technology, Kunming, China.
Conflicts of Interest
The authors declare no conflict of interest.
References
- Ngo, T.D.; Kashani, A.; Imbalzano, G.; Nguyen, K.T.Q.; Hui, D. Additive manufacturing (3D printing): A review of materials, methods, applications and challenges. Compos. Part B Eng. 2018, 143, 172–196. [Google Scholar] [CrossRef]
- Attaran, M. The rise of 3-D printing: The advantages of additive manufacturing over traditional manufacturing. Bus. Horiz. 2017, 60, 677–688. [Google Scholar] [CrossRef]
- Durai Murugan, P.; Vijayananth, S.; Natarajan, M.P.; Jayabalakrishnan, D.; Arul, K.; Jayaseelan, V.; Elanchezhian, J. A current state of metal additive manufacturing methods: A review. Mater. Today Proc. 2022, 59, 1277–1283. [Google Scholar] [CrossRef]
- Gong, G.; Ye, J.; Chi, Y.; Zhao, Z.; Wang, Z.; Xia, G.; Du, X.; Tian, H.; Yu, H.; Chen, C. Research status of laser additive manufacturing for metal: A review. J. Mater. Res. Technol. 2021, 15, 855–884. [Google Scholar] [CrossRef]
- Kalashnikov, K.N.; Chumaevskii, A.V.; Kalashnikova, T.A.; Kolubaev, E.A. A substrate material and thickness influence on the 3D-printing of Ti–6Al–4V components via wire-feed electron beam additive manufacturing. J. Mater. Res. Technol. 2022, 16, 840–852. [Google Scholar] [CrossRef]
- Huan, P.-C.; Wang, X.-N.; Zhang, Q.-Y.; Di, H.-S.; Chen, X.-M.; Chen, Y.; Wei, X. Study on droplet transition behavior, bead geometric characteristics and formability of wire + arc additively manufactured Inconel 718 alloy by using CMT MIX+ Synchropulse process. J. Mater. Res. Technol. 2022, 17, 1831–1841. [Google Scholar] [CrossRef]
- Kawalkar, R.; Kumar Dubey, H.; Lokhande, S.P. Wire arc additive manufacturing: A brief review on advancements in addressing industrial challenges incurred with processing metallic alloys. Mater. Today Proc. 2022, 50, 1971–1978. [Google Scholar] [CrossRef]
- Chaturvedi, M.; Scutelnicu, E.; Rusu, C.C.; Mistodie, L.R.; Mihailescu, D.; Subbiah, A.V. Wire Arc Additive Manufacturing: Review on Recent Findings and Challenges in Industrial Applications and Materials Characterization. Metals 2021, 11, 939. [Google Scholar] [CrossRef]
- Rodrigues, T.A.; Duarte, V.R.; Miranda, R.M.; Santos, T.G.; Oliveira, J.P. Ultracold-Wire and arc additive manufacturing (UC-WAAM). J. Mater. Process. Technol. 2021, 296, 117196. [Google Scholar] [CrossRef]
- Ke, W.C.; Oliveira, J.P.; Cong, B.Q.; Ao, S.S.; Qi, Z.W.; Peng, B.; Zeng, Z. Multi-layer deposition mechanism in ultra high-frequency pulsed wire arc additive manufacturing (WAAM) of NiTi shape memory alloys. Addit. Manuf. 2022, 50, 102513. [Google Scholar] [CrossRef]
- Ayarkwa, K.F.; Williams, S.W.; Ding, J. Assessing the effect of TIG alternating current time cycle on aluminium wire + arc additive manufacture. Addit. Manuf. 2017, 18, 186–193. [Google Scholar] [CrossRef]
- Su, C.; Chen, X.; Gao, C.; Wang, Y. Effect of heat input on microstructure and mechanical properties of Al-Mg alloys fabricated by WAAM. Appl. Surf. Sci. 2019, 486, 431–440. [Google Scholar] [CrossRef]
- Wang, Y.; Xu, X.; Zhao, Z.; Deng, W.; Han, J.; Bai, L.; Liang, X.; Yao, J. Coordinated monitoring and control method of deposited layer width and reinforcement in WAAM process. J. Manuf. Process. 2021, 71, 306–316. [Google Scholar] [CrossRef]
- Campatelli, G.; Campanella, D.; Barcellona, A.; Fratini, L.; Grossi, N.; Ingarao, G. Microstructural, mechanical and energy demand characterization of alternative WAAM techniques for Al-alloy parts production. CIRP J. Manuf. Sci. Technol. 2020, 31, 492–499. [Google Scholar] [CrossRef]
- Wu, D.; Liu, D.; Niu, F.; Miao, Q.; Zhao, K.; Tang, B.; Bi, G.; Ma, G. Al–Cu alloy fabricated by novel laser-tungsten inert gas hybrid additive manufacturing. Addit. Manuf. 2020, 32, 100954. [Google Scholar] [CrossRef]
- Gu, J.; Zhang, Y.; Xu, Y.; Liu, S.; Bai, J.; Fang, X. In-situ precipitation of metastable phases and microstructure control for additively manufactured Al alloy. Mater. Lett. 2022, 309, 131447. [Google Scholar] [CrossRef]
- Wang, J.F.; Sun, Q.J.; Wang, H.; Liu, J.P.; Feng, J.C. Effect of location on microstructure and mechanical properties of additive layer manufactured Inconel 625 using gas tungsten arc welding. Mater. Sci. Eng. A 2016, 676, 395–405. [Google Scholar] [CrossRef]
- Wu, B.; Pan, Z.; Ding, D.; Cuiuri, D.; Li, H.; Xu, J.; Norrish, J. A review of the wire arc additive manufacturing of metals: Properties, defects and quality improvement. J. Manuf. Process. 2018, 35, 127–139. [Google Scholar] [CrossRef]
- Fang, X.; Zhang, L.; Chen, G.; Dang, X.; Huang, K.; Wang, L.; Lu, B. Correlations between Microstructure Characteristics and Mechanical Properties in 5183 Aluminium Alloy Fabricated by Wire-Arc Additive Manufacturing with Different Arc Modes. Materials 2018, 11, 2075. [Google Scholar] [CrossRef]
- Derekar, K.S.; Addison, A.; Joshi, S.S.; Zhang, X.; Lawrence, J.; Xu, L.; Melton, G.; Griffiths, D. Effect of pulsed metal inert gas (pulsed-MIG) and cold metal transfer (CMT) techniques on hydrogen dissolution in wire arc additive manufacturing (WAAM) of aluminium. Int. J. Adv. Manuf. Technol. 2020, 107, 311–331. [Google Scholar] [CrossRef]
- Posch, G.; Ferdinand, K.; Heinz, H.; Harald, C. Manufacturing of Turbine Blades by Shape Giving Cmt-Welding. In Proceedings of the Metal Additive Manufacturing Conference, Vienna, Austria, 20–21 November 2014. [Google Scholar]
- Gu, J.; Ding, J.; Williams, S.W.; Gu, H.; Ma, P.; Zhai, Y. The effect of inter-layer cold working and post-deposition heat treatment on porosity in additively manufactured aluminum alloys. J. Mater. Process. Technol. 2016, 230, 26–34. [Google Scholar] [CrossRef]
- Liu, L.; Ao, W.; Wen, Z.; Wang, Y.; Long, Y.; Liu, P.; He, G.; Li, L.K.B. Modifying the ignition, combustion and agglomeration characteristics of composite propellants via Al-Mg alloy additives. Combust. Flame 2022, 238, 111926. [Google Scholar] [CrossRef]
- Li, F.; Chen, S.; Shi, J.; Zhao, Y.; Tian, H. Thermoelectric Cooling-Aided Bead Geometry Regulation in Wire and Arc-Based Additive Manufacturing of Thin-Walled Structures. Appl. Sci. 2018, 8, 207. [Google Scholar] [CrossRef]
- Dong, B.; Cai, X.; Lin, S.; Fan, C. Microstructures and mechanical properties of wire arc additive manufactured 5183-Al: Influences of deposition dimensions. CIRP J. Manuf. Sci. Technol. 2021, 35, 744–752. [Google Scholar] [CrossRef]
- Jahangiri, A.; Marashi, S.P.H.; Mohammadaliha, M.; Ashofte, V. The effect of pressure and pouring temperature on the porosity, microstructure, hardness and yield stress of AA2024 aluminum alloy during the squeeze casting process. J. Mater. Process. Technol. 2017, 245, 1–6. [Google Scholar] [CrossRef]
- Guo, Y.; Quan, G.; Celikin, M.; Ren, L.; Zhan, Y.; Fan, L.; Pan, H. Effect of heat treatment on the microstructure and mechanical properties of AZ80M magnesium alloy fabricated by wire arc additive manufacturing. J. Magnes. Alloy. 2022, 10, 1930–1940. [Google Scholar] [CrossRef]
- Mazur, M. Porosity in aluminium welds. Weld. Int. 1992, 6, 929–931. [Google Scholar] [CrossRef]
- Panchenko, O.; Kurushkin, D.; Mushnikov, I.; Khismatullin, A.; Popovich, A. A high-performance WAAM process for Al–Mg–Mn using controlled short-circuiting metal transfer at increased wire feed rate and increased travel speed. Mater. Des. 2020, 195, 109040. [Google Scholar] [CrossRef]
- Gu, J.; Gao, M.; Yang, S.; Bai, J.; Zhai, Y.; Ding, J. Microstructure, defects, and mechanical properties of wire + arc additively manufactured Al Cu4.3-Mg1.5 alloy. Mater. Des. 2020, 186, 108357. [Google Scholar] [CrossRef]
- Gu, J.; Gao, M.; Yang, S.; Bai, J.; Ding, J.; Fang, X. Pore formation and evolution in wire + arc additively manufactured 2319 Al alloy. Addit. Manuf. 2019, 30, 100900. [Google Scholar] [CrossRef]
- Aldalur, E.; Suárez, A.; Veiga, F. Metal transfer modes for Wire Arc Additive Manufacturing Al-Mg alloys: Influence of heat input in microstructure and porosity. J. Mater. Process. Technol. 2021, 297, 117271. [Google Scholar] [CrossRef]
- Ternero, F.; Rosa, L.G.; Urban, P.; Montes, J.M.; Cuevas, F.G. Influence of the Total Porosity on the Properties of Sintered Materials—A Review. Metals 2021, 11, 730. [Google Scholar] [CrossRef]
- He, P.; Webster, R.F.; Yakubov, V.; Kong, H.; Yang, Q.; Huang, S.; Ferry, M.; Kruzic, J.J.; Li, X. Fatigue and dynamic aging behavior of a high strength Al-5024 alloy fabricated by laser powder bed fusion additive manufacturing. Acta Mater. 2021, 220, 117312. [Google Scholar] [CrossRef]
- Koju, R.K.; Mishin, Y. Atomistic study of grain-boundary segregation and grain-boundary diffusion in Al-Mg alloys. Acta Mater. 2020, 201, 596–603. [Google Scholar] [CrossRef]
- Ceschini, L.; Boromei, I.; Morri, A.; Seifeddine, S.; Svensson, I.L. Microstructure, tensile and fatigue properties of the Al–10%Si–2%Cu alloy with different Fe and Mn content cast under controlled conditions. J. Mater. Process. Technol. 2009, 209, 5669–5679. [Google Scholar] [CrossRef]
- Jia, Q.; Zhang, F.; Rometsch, P.; Li, J.; Mata, J.; Weyland, M.; Bourgeois, L.; Sui, M.; Wu, X. Precipitation kinetics, microstructure evolution and mechanical behavior of a developed Al–Mn–Sc alloy fabricated by selective laser melting. Acta Mater. 2020, 193, 239–251. [Google Scholar] [CrossRef]
- Wei, H.L.; Elmer, J.W.; DebRoy, T. Origin of grain orientation during solidification of an aluminum alloy. Acta Mater. 2016, 115, 123–131. [Google Scholar] [CrossRef]
- Liu, D.; Wu, D.; Wang, R.; Shi, J.; Niu, F.; Ma, G. Formation mechanism of Al-Zn-Mg-Cu alloy fabricated by laser-arc hybrid additive manufacturing: Microstructure evaluation and mechanical properties. Addit. Manuf. 2022, 50, 102554. [Google Scholar] [CrossRef]
- Li, G.; Brodu, E.; Soete, J.; Wei, H.; Liu, T.; Yang, T.; Liao, W.; Vanmeensel, K. Exploiting the rapid solidification potential of laser powder bed fusion in high strength and crack-free Al-Cu-Mg-Mn-Zr alloys. Addit. Manuf. 2021, 47, 102210. [Google Scholar] [CrossRef]
- Ma, K.; Wen, H.; Hu, T.; Topping, T.D.; Isheim, D.; Seidman, D.N.; Lavernia, E.J.; Schoenung, J.M. Mechanical behavior and strengthening mechanisms in ultrafine grain precipitation-strengthened aluminum alloy. Acta Mater. 2014, 62, 141–155. [Google Scholar] [CrossRef]
- Zhou, L.; Hyer, H.; Park, S.; Pan, H.; Bai, Y.; Rice, K.P.; Sohn, Y. Microstructure and mechanical properties of Zr-modified aluminum alloy 5083 manufactured by laser powder bed fusion. Addit. Manuf. 2019, 28, 485–496. [Google Scholar] [CrossRef]


Disclaimer/Publisher’s Note: The statements, opinions and data contained in all publications are solely those of the individual author(s) and contributor(s) and not of MDPI and/or the editor(s). MDPI and/or the editor(s) disclaim responsibility for any injury to people or property resulting from any ideas, methods, instructions or products referred to in the content. |
© 2023 by the authors. Licensee MDPI, Basel, Switzerland. This article is an open access article distributed under the terms and conditions of the Creative Commons Attribution (CC BY) license (https://creativecommons.org/licenses/by/4.0/).