Abstract
The two elements, yttrium and holmium, form a geochemical twin pair as their cations possess equivalent ratios of charge to radius. However, despite their equal electrostatics, a subtle difference in their fluoride or chloride affinity is known within solutions. In this work, we investigated whether this affinity gap is also present within the solid phase and how it depends on the surface configuration. We modeled adsorptions onto β-YF3 (waimirite) and isostructural β-HoF3 by periodic density functional theory. To draw conclusions on the affinity toward fluoride and chloride vs. water, adsorbates of HF, HCl, or H2O onto any of the four highly abundant surfaces of (010), (100), (011), and (101) were studied. Among others, the conformational landscape was explored by 200 ps of ab initio molecular dynamics. For stoichiometric surfaces of both MF3, we indeed found stronger adsorptions for HF than HCl. All H2O showed slightly stronger adsorption energies for HoF3, while for HF and HCl, the metal preferences varied by the surface. While (100) showed the strongest preference for HoF3, (101) preferred YF3 by the same magnitude.
1. Introduction
In nature, the elements yttrium and holmium are trivalent cations of practically identical sizes (107.5 pm for Y(III) vs. 107.2 pm for Ho(III) measured at nine-fold coordination, e.g., as present in waimirite) [1,2]. As most geochemical transport processes are driven by the ratio of charge to radius, both high-field strength elements (HFSE) behave alike and are, therefore, referred to as geochemical twin pairs [3]. However, despite the equal electrostatic behavior, subtle differences between both twin elements have been found in solutions within their affinities toward fluoride or chloride [4,5,6]. It is believed that these small differences are the key forces for the significant decrease in Ho and increase in Y concentrations found in fluoride-rich ores originating from hydrothermal veins [3,4,5,7,8,9,10]. Within these hydrothermal zones, a continuous interplay of dissolving vs. precipitation from the aqueous phase occurs. Modeling this complex system involving a great number of elements in an unknown number of chemical species is a too demanding task to be tackled in its entiretydemanding task that needs to be tackled by quantum chemical methods. However, to begin this long journey of understanding these processes in a step-wise manner, we start with the interfaces of the simple, binary fluorides with the most simple, charge-neutral species of fluoride and chloride, HF and HCl, and contrast them with H2O. Even this simplistic model contains open-ended questions that need to be answered before moving on to more realistic ones. First, due to the absence of such surface studies, it is unknown how the choice of the surface plane affects the halide affinity, or whether the effect is the same for both twin elements. Second, even the pristine surfaces offer plenty of adsorption structural isomers and conformations leading to a potential energy hypersurface with numerous local minima. We, therefore, scanned these by two methods—ab initio molecular dynamics (AIMD) simulations and a systematic generation of initial molecular arrangements. Moreover, the obtained adsorption energies of well-defined MF3·Ads structures pose an excellent theoretical foundation for future spectroscopic measurements of any waimirite-structured rare earth element (REE) trifluoride. To the best of our knowledge, not a single computational study of molecular interactions to a yttrium trihalide surface exists for any rare earth element trihalide or waimirite structure type surface.
2. Methodology
2.1. Crystal Structure and Surfaces
The mineral waimirite-Y is constituted of orthorhombic β-YF3, the low-temperature phase of all middle and late lanthanide trifluorides of SmF3–LuF3 [2,11,12]. Its Pnma symmetric unit cell contains four formula units forming distorted tricapped trigonal anti-prisms of nine fluorides around each metal center. Analyzing the stability of the bare surfaces for the prototype structure YF3 and its geochemical twin compound HoF3 at quantum chemical conditions, in a previous study we found that 75% (YF3) or 86% (HoF3) of the total crystal surface was made from the four low Miller index surfaces of (010), (100), (011), and (101) [13]. For the former three, a stoichiometric, non-polar termination was favored, while (101) preferred a substoichiometric composition, in which each surface unit cell was missing one fluorine atom. For the larger supercells used within the isolated setup shown in Figure 1, this resulted in a nominal surface net charge of . However, as the applied periodic boundary conditions prohibited a charged surface, each fluorine vacancy instead produced a nominal M(II) center. The most stable and abundant surface of (010) forms a very flat surface of an eight-fold coordinated M(III). The second most abundant surfaces are (011) for YF3 and (100) for HoF3 containing M(III) in a six-fold coordination. However, these six-fold polyhedrons possess different shapes and leave M(III) less covered in the case of (100). Both MF3 agree again on (101) as the third most abundant surface, whose six-fold coordinated M(II) are the most accessible ones within the study.
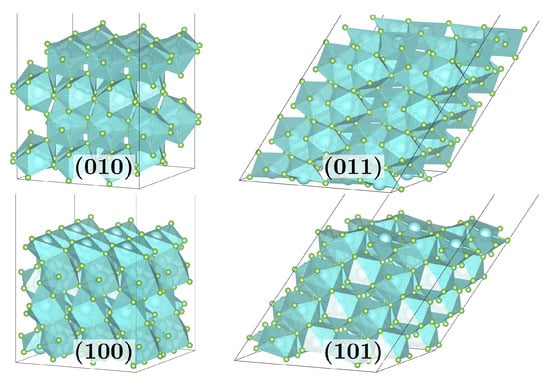
Figure 1.
Bare surface supercells as used for the isolated adsorption setup for (010) and (100) of () MF3-layers, as well as (011) and (101) of () MF3-layers for M = Y, Ho.
The bare surfaces are modeled by sufficiently large supercells to avoid artificial adsorbate–adsorbate interactions (see Figure 1). Molecular adsorbates (Ads) of HF, HCl, and H2O were adsorbed onto these to study the adsorption energy and structure.
2.2. Scan of Conformational Adsorption Space
The vast conformational spaces of possible adsorbate structural isomers and conformations of MF3·(Ads) were scanned by AIMD and a systematic input generation script. In both, full coverage of the surfaces was probed to directly capture the conformations of multiple adsorbates. Because the atomic structures of YF3 and HoF3 surfaces are practically equivalent, we chose to scan the conformational spaces of possible adsorptions using YF3·(Ads) only. We further limited the conformational space scan to the three major contributing surfaces, as the (100) surface possesses only a minor abundance in YF3. Onto these surface slabs, a single layer of four HF or H2O molecules was added. Relaxed slab supercells of the converged thickness of () YF3-layers for (011) and (101) (see Figure 2a) or () YF3-layers for (010) were used (see Figure 2b) [13]. For the 1:1 mixed monolayer setup of four HF or HCl with four H2O molecules onto (010), the surface unit cell was doubled using supercells of () YF3-layers (see Figure 2c).
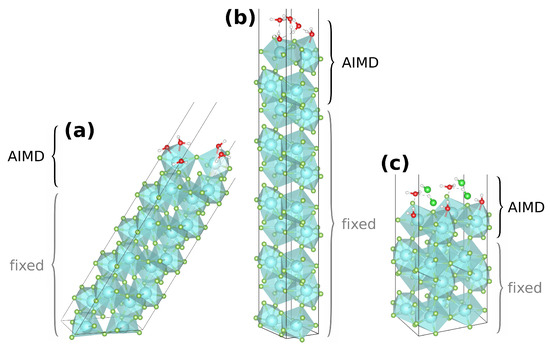
Figure 2.
Generic AIMD start structures of the pure monolayer setups of (011)·(H2O) (a) and (010)·H2O (b), as well as of the mixed monolayer setup of (010)·HCl:H2O (c); the region of atoms not fixed (top four YF3 and adsorbates) is labeled AIMD.
Initial temperature tests of up to 873 K onto (010)·(HF) revealed that at higher temperatures some molecules diffuse into the vacuum because their kinetic energies outweigh the rather weak adsorption. Therefore, the AIMD runs were performed at rather cold temperatures of 50–300 K with the majority of simulation time obtained at 200 K (see Table S3). Summing over all respective trajectories, about 60 ps AIMD simulation time was created for the pure monolayer onto each surface of (010), (011), and (101). About 30 ps was produced for the mixed monolayer onto (010). Within the AIMD simulations, adsorption events were judged by distance to the surface atoms (≤260 pm) and visualization. Long-living (≥2 ps) coordination events for each surface and adsorbate were selected as starting conformations for further studies. Moreover, the coordination of short lifetimes (≥350 fs) was also considered if showing structural features not already within the scope.
In a second approach, input structures for atomic structure relaxation were script-generated, varying the adsorbate position perpendicular and in-plane to the surface, as well as rotating the adsorbate. Monolayer structures of YF3·4HF, YF3·4H2O and YF3·2HF·2H2O were created for the surfaces of (010), (011), and (101), all as supercells in analogy to Figure 2a,b. For each combination of monolayer and surface 36 start structures were generated From the relaxed 324 structures, the most stable ones were selected for further studies. From both approaches sampling the full monolayer, single adsorbate conformations were extracted and transferred to the isolated adsorption setup of () MF3-layers for (010) and (100) or () MF3-layers for (011) and (101) (see Figure 1). All (100)·Ads initial structures originated from transferring adsorbate conformations from the other three surfaces. Each selected YF3·HF adsorption also posed a starting structure for the respective YF3·HCl one. The same applied to the YF3 analogous HoF3, for which the adsorbate coordinates were transferred from the respective YF3·(Ads) structures. Overall, an isolated adsorption structural scope of 61 YF3 and 59 HoF3 structures were considered. Several of these relaxed into chemically equivalent structures or nearly equivalent conformers of the same structural isomer. Thus, our results are based on a total scope of 44 single adsorbate structural isomers for each MF3. The respective scopes for each surface and adsorbate are listed in Table S4 and all structural isomers are depicted in Figures S2–S13.
2.3. Computational Details
The same computational setup of Perdew–Burke–Ernzerhof (PBE) functional [14] at a kinetic cutoff of 773 eV was used within the Vienna Ab Initio Simulation Package (VASP) [15,16,17,18] as applied to the surface energies evaluated in [13]. The hard projector augmented wave potentials of H, O, and Cl were applied with valence electron numbers of 6 and 7 for the latter two. The effect of hard vs. normal potential files was tested (see SI Section 1.1 [19,20]). All calculations were performed at the -point. The surface supercells were built with the python packages pymatgen [21,22] and ASE [23]. A minimum of a 25 Å vacuum was applied to all isolated molecules and perpendicular to the surface plane in all supercells to avoid artificial interaction.
For the first conformational scan approach by AIMD, the NVT ensemble with the Verlet algorithm and the Nosé–Hoover thermostat with a coupling parameter of 1 were applied at a 1 fs time step [24,25,26]. See Table S3 for an overview of the runtimes at temperatures of 50–300 K. To keep the computational time of the AIMD feasible, the monolayer AIMD (setup a and b) were conducted at low precision, applying the RMM-DIIS [27,28] algorithm with preconditioned residuum-minimization (VeryFast) as well as a default self-consistent field (SCF) convergence criteria. The mixed monolayer AIMD (setup c) was conducted with the default (Kosugi) blocked-Davidson algorithm at normal precision with SCF criteria of 10 eV.
For the second conformational scan approach of script-generated input structures, the atomic relaxation was conducted via a conjugate gradient algorithm at normal precision with the default convergence criteria.
For the isolated adsorption setup used for the analysis, converged surface supercell sizes were found at () MF3-layers for (010) and (100) or () MF3-layers for (101) and (011) (see Figure S1 and Tables S1 and S2). The top two MF3-layers of each surface (48 atoms for (010) and (100) or 64 atoms for (101) and (011)), as well as the adsorbates were relaxed in atomic coordinates with allowed spin polarization, Gaussian smearing with a width of 0.2 eV, Grimme’s dispersion correction with Becke–Johnson damping (D3(BJ)) [29,30], and accurate precision. SCF criteria of 10 eV were applied for geometry optimizations and 10 eV for final energies. For difficult SCF cases, symmetry was turned off (ISYM = −1), and/or an additional DFT support grid (.ADDGRID.), and/or a reduced minimal mixing parameter of Kerker’s initial approximation [31] (AMIN) of <0.01 was used. If geometric convergence was neither achieved by the conjugated gradient nor by the RMM-DIIS algorithm [27], the ionic step width (POTIM) was reduced from its default of 0.5 to 0.1 Å. All atomic structure visualizations were conducted in VESTA [32]. Trajectories were visualized in VMD [33].
3. Results
All given results were obtained using the isolated adsorption setup shown in Figure 1. We differentiate two kinds of adsorption energies referred to as bonding energies () according to Reaction (1) and interaction energy () according to Reaction (2). The former is calculated with respect to the relaxed (superscript 0) reactants. Consequently, is obtained from the total energy of the relaxed adsorption structure minus the total energy of the relaxed, bare surface supercell and the relaxed isolated adsorbate in vacuum.
is obtained analogously from non-relaxed reactants, which already possess the same atomic structure as inside the relaxed adsorption product.
Thus, the difference in both adsorption energies is the atomic structure relaxation of the separated reactants from the relaxed structure of the adsorption product. It is, therefore, labeled as preparation energy ()
By the atomic structure relaxation of the adsorbed product, spontaneous dissociations of some adsorbate molecules were observed. These can be classified into two categories. For one, there are the H-bond induced dissociations onto stoichiometric surfaces of several strong HCl adsorptions, whose final hydrogen-to-surface fluorine (H−Fsurf) distance is considerably shorter than the H−Cl one (see Figure S17). In one case, this was followed by a subsequent movement of the Cl atom across the surface leading to a final H−Cl distance of 7 Å (see Figure S6e). However, in all of these H-bond-induced dissociations, the MF3·Ads stay diamagnetic and no change in the surface metal (M) or partial charges occur.
On the other hand, several adsorptions of HF or HCl onto the electron-rich, substoichiometric (101) surface spontaneously dissociate in a hydride-forming mechanism leading to separately adsorbed halide and hydride (q(H) e) anions. By formal oxidation state, two electrons are transferred from the surface to the adsorbate, agreeing with a total change in Bader charges of about 1.4 e. A clear difference is also shown by the spin arrangement. The collinear magnetic moment of 8 is found for bare (101) produced by the ferromagnetic arrangement of the eight formal M(II) centers (four each on the top/bottom surfaces), each with an unpaired electron. While this magnetic moment is retained for all non-dissociated (101)·Ads, it reduces to 6 within the hydride-forming ones. Within the final structures, these two anions remain either coordinated to the same M ((101)·HF/Cl, see Figure S19a), coordinated to two neighboring M, ((101)·HF, see Figure S19b), or with one other M in-between ((101)·HF/Cl, see Figure S19c). Due to the charge repulsion, the stability and, thus, the absolute adsorption energy increase by the distance of halide to hydride (see Table 1). (101)·HF was not found to be stable for the respective HCl adsorption. Starting from that structure, the chloride moved across the surface, converging into (101)·HCl. On the used supercell, this is the maximum distance that the two anions can adopt while being coordinated to the six-fold coordinated M(II) centers. Compared to all other MF3·Ads, their adsorption energies are much larger and their properties are very different. We, therefore, analyzed them as a separate class of adsorption.

Table 1.
Comparison of the different hydride-forming adsorptions by coordination number (CN) and the maximum change in partial charge for one M () of the coordination sites(s) vs. the bare (101) charges of –1.8 e for six-fold coordinated and –2.4 e for seven-fold coordinated M, together with the halide to hydride distances () in pm and adsorption energies in kJ·mol.
The values of Table 1 are plotted separately in Figure 3 to the respective strongest adsorptions of the other MF3·Ads giving an impression on how large is affected by the interplay of the adsorbate type and surface cut, while the metal type only has a minor impact.
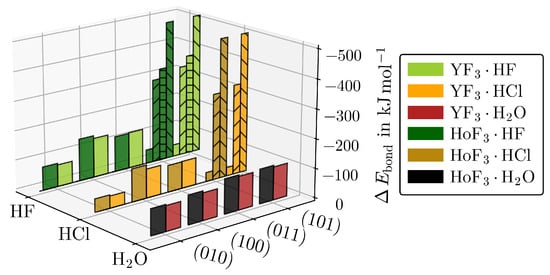
Figure 3.
for the respective strongest adsorptions of YF3·Ads and HoF3·Ads for each () and adsorbate. The hydride-forming adsorptions of (101)·HF/Cl (upward stripes), (101)·HF (horizontal stripes), or (101)·HF/Cl (downward stripes) are given separately.
The most striking variation in adsorption energies is found along ()·HF and ()·HCl. The differences between the respective strongest adsorptions onto the same MF3 () according to Equation (4) are depicted in Figure 4.
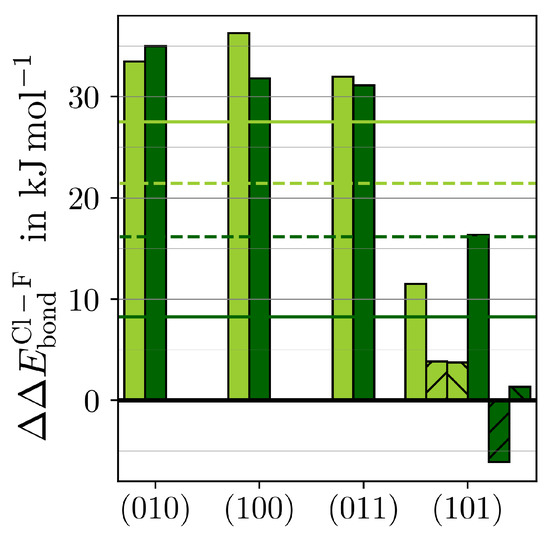
Figure 4.
The difference in between MF3·HCl and MF3·HF () (see Equation (4)) for M = Y (light green) and M = Ho (dark green) is given for the respective strongest adsorption of each () (bars) and as the average overall () with (solid lines) or without the hydride-forming adsorptions (dashed lines) of (101)·HF/Cl (upward stripes) or (101)·HF/Cl (downward stripes).
Both MF3 bind HF significantly stronger than HCl. The preference for HF over HCl is similar in the three stoichiometric surfaces. Within the F-substoichiometric surface of (101), the preference is considerably smaller. The averages of over all surfaces are 8–28 kJ·mol stronger for HF, suggesting that the F−Msurf bond is slightly stronger than the respective chloride one. Consequently, the surface mobility of chloride should be slightly higher. This, together with chloride’s more diffuse electron density resulting in higher spacious demands considering the repulsion with the hydride, indicates why the (101)·HCl was not found to be stable.
The for each non-hydride-forming adsorption is related to in Figure 5. Naturally, the difference of is very low for the weakly adsorbed structures. However, it remains very low for any MF3·H2O, while it becomes significant for strong HF adsorptions onto (100) or (011) and even larger than the final itself for the respective HCl adsorptions. The latter is caused by the strong H−Cl bond elongation introduced above as H-bond dissociated structures.
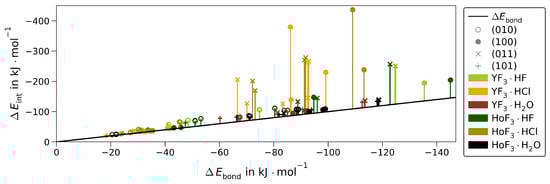
Figure 5.
Interaction energy () vs. bonding energy () for all non-hydride-forming MF3·Ads for each surface (marker) of YF3 (light green/orange/red) or HoF3 (dark green/brown/black) without the 7 Å-wide dissociated (100)·HCl. The difference (, see Equation (3)) is emphasized by bars.
In the next step, the effect of the metal type on is considered (see Figures S14–S16). While most HoF3·H2O adsorb slightly stronger than the respective YF3·H2O already prior to relaxation, the preference for HoF3 very mildly increases further upon relaxation by up to 4 kJ·mol. Moreover, all non-hydride-forming MF3·HF prefer HoF3 over YF3 before relaxation by up to 10 kJ·mol. However, for most of these, hardly affects this preference, with the exception of (011)·HF, for which shifts twice that initial preference for HoF3 to a final preference for YF3HoF3 twice to the YF3 preference. Finally, the non-hydride-forming MF3·HCl show the strongest preference for HoF3 of up to 50 or 57 kJ·mol with or without the relaxation of the reactants. However, the effect of decreases or increases the preference depending on the adsorption isomer.
In the following, the quantities determining are further analyzed. The dependency on the atomic structure parameters of the H-bond angle and distance toward F, as well as the direct coordination of O/F/Cl toward Y/Ho are visualized in Figure 6. See Table S5 for a comparison of non-/weighted averages over each or all surfaces, as well as Figure S18 for a version of Figure 6, including the hydride-forming adsorptions.
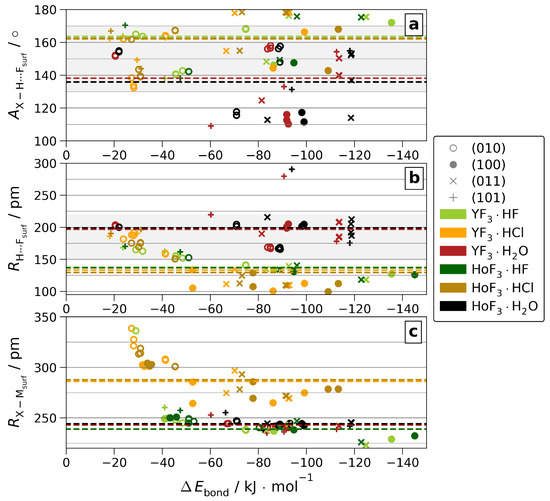
Figure 6.
H-bond angles ( (a)) and distances ( (b)) or direct surface coordination distances of X = O/F/Cl ( (c)) vs. for all non-hydride-forming adsorptions. The respective -weighted means over all surfaces are given as dashed lines. The area of H-bonds classified as moderate [34] is shaded.
As by the lanthanide contraction, the ionic radii of Y(III) and Ho(III) differ by as little as 0.3 pm [1]; any difference in coordination originates from a different bonding situation. However, we found that the difference in the (see Figure S24) is too weak to affect the intra-adsorbate bond lengths, as these stay insensitive to the metal center. By closer contact to the surface, the H-bond angles and distances, as well as the direct coordination distances of O/F/Cl to M show notable differences between YF3·Ads and HoF3·Ads when analyzing each surface separately. On the other hand, the signs of these differences vary by surface. As a result, averaging over all surfaces, the metal-type correlated differences do not persist. Considering all surfaces, only those between the adsorbates survive. These emphasize the considerable distinction between weak H2O H-bonds vs. strong HF and HCl ones. Moreover, they reveal the high similarity between the latter two, which is also present in the direct coordination when accounting for the gap in ionic radii [1].
Linked to the ionic radii and electronegativities, differences between the adsorbates appear within the partial Bader charges. Due to the high electronegativity of F and, thus, little variance of its strongly negative partial charge, which is already very low ( e) for molecular HF, the adsorption onto MF3 shows no further reduction (see Figure 7 and Figure S20).
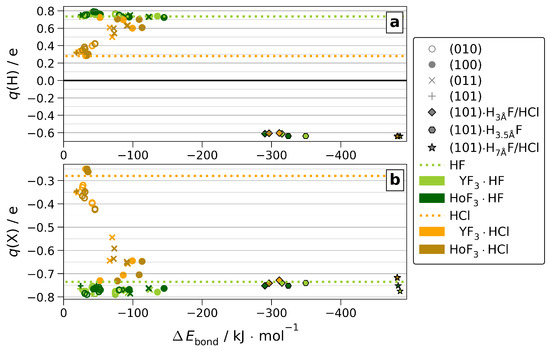
Figure 7.
Partial Bader charges (q(H) (a) and q(Cl)/q(F) (b)) of molecular HF or HCl (dotted lines) or adsorbed onto MF3 (markers).
However, for HCl adsorption, the partial charges change significantly compared to molecular HCl due to the low ionic character of the H−Cl bond (see Figure S21). This allows the bonding character of MF3·HCl to be surface-dependent. For adsorptions towardthat are up to six-fold coordinated M as present in (100) and (011), the partial charges suggest a strong ionic character comparable to MF3·HF. This is linked to the formation of the H-bond dissociated Cl⋯H−Fsurf introduced above, for which we find no significant differences between both MF3 (see Figure S17). Finally, the partial charges of H2O are only marginally affected by the adsorption (see Figures S22 and S23). Onto all stoichiometric surfaces, the positive charge of H slightly increases by 0.1 e, regardless of CN. Adsorbed at the substoichiometric, electron-rich (101), the positive charge of H is reduced slightly by up to e. However, in contrast to HF and HCl, no dissociation is observed.
Despite the high similarity between the two MF3 for the properties discussed above, subtle differences appear within the adsorption energies. The differences between both MF3 for all adsorptions are weighed with the respective surface abundance ratios (%, Equation (5)) of the ideal crystals taken from [13] and compared in Figure 8.
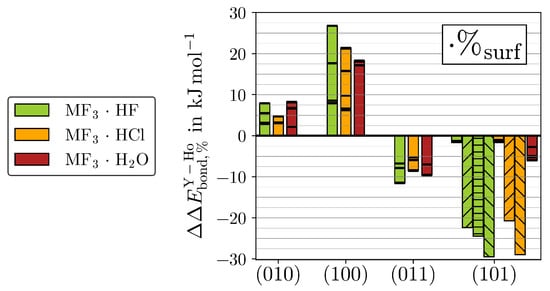
Figure 8.
The %-weighted differences in between YF3 and HoF3 () (see Equation (5)) is given for all adsorptions (black lines). The bar plots highlight the respective strongest adsorptions. The hydride-forming adsorptions of (101)·HF/Cl (upward stripes), (101)·HF (horizontal stripes), or (101)·HF/Cl (downward stripes) are given separately.
Note that HoF3 possesses higher % than YF3 for the surfaces of (010) and (100) but lower ones for (011) and (101). See Figure S24 for the corresponding non-weighted differences () together with the respective %.
Even though the non-weighted H2O adsorptions bind slightly stronger to HoF3 than YF3 regardless of the surface cut, the different % of the two MF3 impose a surface dependency for . In contrast, the binding preference for HoF3 or YF3 shown by HF or HCl varies inherently between the different surfaces. At the eight-fold coordinated M of (010), HF and HCl, both slightly prefer HoF3. While the of HF is about the same as H2O, it is lowest for HCl. By the better accessible M of (100), the %-weighted preferences for HoF3 grow considerably, yielding the strongest for (100)·HF within all ()·Ads. In contrast, all at (011) prefer YF3 due to the flipped order in surface abundances. Although (011) also contains six-fold coordinated M, these are less accessible (see Figure 1). In agreement with the metal accessibility, the magnitude of is only marginally larger than in (010). Finally, for the hydride-forming adsorptions of (101), the higher % of YF3 amplifies the inherent preference for the lighter twin element. We believe that this difference primarily originates from the ionization potentials (IP) of M(II), which are measured to be 20.5 eV for Y(II) and 22.8 eV for Ho(II) in the gas phase [35,36]. It may be assumed that the qualitative relation of considerably easier Y(II) than Ho(II) oxidation remains the same for six-fold coordinated metal centers. It should be noted that Ho(II) is measured to have a 4f configuration [36], which is not possible with the applied 4f-in-core potential developed for the stable oxidation state of Ho(III). Therefore, no quantitative relation of IP to may be drawn.
Comparing our quantum chemical results with experiments and theoretical studies in solutions at elevated temperatures, we find an agreement of the preference for fluoride over chloride found for Y(III) in aqueous solutions by AIMD simulations [6]. This suggests that the preference is present in different phases of Y(III). A solubility study in aqueous HF compared the fluoride affinity of Y(III) vs. Ho(III) [4]. At high HF concentrations, they found a higher fluoride affinity by Y(III). In another study applying AIMD and in situ X-ray experiments onto aqueous NaCl solutions, the chloride affinity of Y(III) was also found to be higher compared to Ho(III) [5]. Within our study, however, the marginal difference in fluoride or chloride affinity shown between the two metals is much lower than between the surfaces. This demonstrates that, compared to the free ions in solution, the difference in binding affinity at the surface is very sensitive to the surface geometry and termination, even when the respective ions are as similar as Y(III) vs. Ho(III). Apparently, the change in the local environment between the surfaces affects the two twin elements differently and, thus, shifts the small gap in halide affinities between the two. Comparable experimental and computational studies of Y(III) and Ho(III) affinities in solutions containing both HF and HCl could give more insight into these subtle differences and would be the next step to elucidate the composition in fluoride-rich ores originating from hydrothermal veins.
4. Conclusions
The adsorptions of HF, HCl, and H2O onto the four most abundant surfaces of YF3 and HoF3 were studied by applying periodic density functional theory. Comparing the two halides, we found that both MF3 bind HF notably stronger than HCl for all three stoichiometric surfaces. We found that the adsorption energy of H2O is insensitive to the surface cut. Due to this surface insensitivity, the slight preference for HoF3 over YF3 remains constant. On the contrary, the adsorption energies of HF and HCl are sensitive to the surface. For the latter, this also shows within the partial charges. For the rather bulk-like surface of (010) with low metal accessibility, the preference for HoF3 is comparable to that shown by H2O. The adsorptions of HF and HCl onto stoichiometric surfaces with more accessible M are considerably stronger, showing the strongest H-bonds and, thus, the largest structural changes upon adsorption. These also show varying metal affinities. HF and HCl both show the strongest preference for HoF3 over YF3 within (100), a surface that is also much more abundant in the heavier twin trifluoride. On the other hand, (011) prefers YF3. Finally, the largest preference for YF3 is found for the hydride-forming adsorptions onto the F-substoichiometric (101).
Supplementary Materials
The following supporting information can be downloaded at https://www.mdpi.com/article/10.3390/cryst13040555/s1, Table S1: Scope of supercell size convergence onto the (010) YF3 surface with a single adsorbate. Each column gives the supercell thickness in unit cell copies (UC) and YF3-layers perpendicular to the surface. The supercells of 1 UC thickness are done for a single adsorbate of HF or H2O. Figure S1: Supercell size convergence of for the (010) YF3 surface with a single adsorbate of HF (top left) or H2O (top right). The x-axis gives the thickness perpendicular to the surface (p) in YF3-layers. The difference to the biggest supercell () is plotted for YF3·HF (bottom). The green dotted lines and shaded areas visualize and kJ·mol, respectively. Table S2: Converged supercell sizes of all surface cuts with their corresponding surface area (), the total number of formula units () and atoms within the supercell (). Table S3: Overview of AIMD simulation at different temperatures for pure monolayers of YF3·(Ads) and 1:1 mixed monolayers of YF3·(Ads(Ads with summed-up simulation times over all respective runs. Table S4: Structural scope of MF3·(Ads) giving the total number of different final conformers with the total number of all respective starting structures in parenthesis. Figure S2: Relaxed adsorption structures of (010)·1HF in order of increasing viewing onto the surface unit cell (black frame) made from () bulk unit cells. Two YF3 structures were conducted for structural isomer c and five for structural isomer e. Three HoF3 structures were conducted for structural isomer c and two for structural isomer e. Figure S3: Relaxed adsorption structures of (010)·1HCl in order of increasing viewing onto the surface unit cell (black frame) made from () bulk unit cells. Three structures were conducted for structural isomer b and two for structural isomer c. Figure S4: Relaxed adsorption structures of (010)·1H2O in order of increasing viewing onto the surface unit cell (black frame) made from () bulk unit cells. Three structures were conducted for structural isomers b and c. Figure S5: Relaxed adsorption structures of (100)·1HF in order of increasing viewing onto the surface unit cell (black frame) made from () bulk unit cells. Figure S6: Relaxed adsorption structures of (100)·1HCl in order of increasing viewing onto the surface unit cell (black frame) made from () bulk unit cells. Figure S7: Relaxed adsorption structures of (100)·1H2O in order of increasing viewing onto the surface unit cell (black frame) made from () bulk unit cells. Two YF3 structures were conducted for structural isomer a. Figure S8: Relaxed adsorption structures of (011)·1HF in order of increasing viewing onto the surface unit cell (black frame) made from () bulk unit cells. Two structures were conducted for structural isomer c. Figure S9: Relaxed adsorption structures of (011)·1HCl in order of increasing viewing onto the surface unit cell (black frame) made from () bulk unit cells. Two structures were conducted for structural isomer c. Figure S10: Relaxed adsorption structures of (011)·1H2O in order of increasing viewing onto the surface unit cell (black frame) made from () bulk unit cells. Two structures were conducted for structural isomer b. Figure S11: Relaxed adsorption structures of (101)·1HF in order of increasing viewing onto the surface unit cell (black frame) made from () bulk unit cells. The hydride-forming configurations c, d, and e are called MF3·H3ÅF, MF3·H3.5ÅF and MF3·H7ÅF within the main paper according to the H−F distance. Figure S12: Relaxed adsorption structures of (101)·1HCl in order of increasing viewing onto the surface unit cell (black frame) made from () bulk unit cells. The hydride-forming configurations c and d are called MF3·H3ÅCl and MF3·H7ÅCl within the main paper according to the H−Cl distance. For configuration d, two structures were conducted for HoF3·H7ÅCl. Figure S13: Relaxed adsorption structures of (101)·1H2O in order of increasing viewing onto the surface unit cell (black frame) made from () bulk unit cells. Figure S14: Difference in the adsorption energies of YF3·HF and HoF3·HF with () or without () relaxed reactants. An area of kJ·mol is shaded. Figure S15: Difference in the adsorption energies of YF3·HCl and HoF3·HCl with () or without () relaxed reactants. An area of kJ·mol is shaded. Figure S16: Difference in the adsorption energies of YF3·H2O and HoF3·H2O with () or without () relaxed reactants. An area of kJ·mol is shaded. Table S5: Calculated means of intra-adsorbate bond length (), H-bond angles () and distances (), direct O/F/Cl to metal coordination () without weight () or weighted by as given in Equation 1 () for all non-hydride-forming single adsorptions and without the 7 Ådissociated (100)·HCl structural isomer e; the over all () are plotted in Figure 6 within the main paper. Figure S17: vs. for HoF3·Ads (a) and YF3·Ads (b) for all non-hydride-forming adsorptions but the 7 Åwide H-bond dissociated (100)·HCl. pm is highlight for (solid line) and (dotted line). Figure S18: Coordination distances toward the surface by the adsorbate for H (, a) and X = O/F/Cl (, b) vs. for all single adsorptions. Figure S19: Changes in partial Bader charges (≥0.05 e) of M upon adsorbate dissociation for (101)·HF/Cl (a), (101)·HF (b) and (101)·HF/Cl (c) for YF3·HF (1a–1c), HoF3·HF (2a–2c), YF3·HCl (3a–3c) and HoF3·HCl (4a–4c). Figure S20: Change of partial Bader charges of HF adsorbed onto YF3 or HoF3 ((H) a with zoom b and (F) c) vs. molecular HF. Figure S21: Change of partial Bader charges of HCl adsorbed onto YF3 or HoF3 ((H) a and (Cl) b) vs. molecular HCl. Figure S22: Partial Bader charges of molecular H2O (dotted line) and adsorbed onto YF3 or HoF3 (q(H) a and q(O) b). Figure S23: Change of partial Bader charges of H2O adsorbed onto YF3 or HoF3 ((H) a and (O) b) vs. molecular H2O. Figure S24: The difference in between YF3 and HoF3 () (see Equation (2)) is given for all single adsorptions (black lines). The bar plots highlight the respective strongest adsorbed structures. The hydride-forming adsorptions of (101)·HF/Cl (upward stripes), (101)·HF (horizontal stripes) or (101)·HF/Cl (downward stripes) are given separately. The surface abundance ratios (%) for the ideal crystals are taken from [13].
Author Contributions
Conceptualization, J.A. and B.P.; formal analysis, H.W. and J.A.; funding acquisition, B.P.; investigation, H.W. and J.A.; resources, B.P.; supervision, B.P.; validation, J.A.; visualization, J.A.; writing—original draft, J.A.; writing—review and editing, J.A. and B.P. All authors have read and agreed to the published version of the manuscript.
Funding
The project was funded by the Freie Universität Berlin and the Deutsche Forschungsgemeinschaft (DFG, German Research Foundation)—Project-ID 387284271—CRC 1349—fluorine-specific interactions.
Institutional Review Board Statement
Not applicable.
Informed Consent Statement
Not applicable.
Data Availability Statement
See supplementary materials. All relaxed surface structures are available within the NOMAD repository (ID: xoipefEvRGOWfNVSx_R1MA). Further data can be requested from the authors.
Acknowledgments
The publication of this article was funded by Freie Universität Berlin. The authors thank the North-German Supercomputing Alliance (Norddeutscher Verbund zur Förderung des Hoch-und Höchstleistungsrechnens HLRN) and the Zentraleinrichtung für Datenverarbeitung (ZEDAT) at the Freie Universität Berlin for the computational resources, as well as the Freie Universität Berlin and the German Science Foundation (DFG) for funding within the CRC 1349—Fluorine-Specific Interactions.
Conflicts of Interest
The authors declare no conflict of interest.
References
- Shannon, R.D. Revised effective ionic radii and systematic studies of interatomic distances in halides and chalcogenides. Acta Cryst. A 1976, 32, 751–767. [Google Scholar] [CrossRef]
- Atencio, D.; Bastos Neto, A.C.; Pereira, V.P.; Ferron, J.T.M.M.; Hoshino, M.; Moriyama, T.; Watanabe, Y.; Miyawaki, R.; Coutinho, J.M.V.; Andrade, M.B.; et al. Waimirite-(Y), orthorhombic YF3, a new mineral from the Pitinga mine, Presidente Figueiredo, Amazonas, Brazil and from Jabal Tawlah, Saudi Arabia: Description and crystal structure. Mineral. Mag. 2015, 79, 767–780. [Google Scholar] [CrossRef]
- Bau, M. Controls on the fractionation of isovalent trace elements in magmatic and aqueous systems: Evidence from Y/Ho, Zr/Hf, and lanthanide tetrad effect. Contrib. Mineral. Petrol. 1996, 123, 323–333. [Google Scholar] [CrossRef]
- Loges, A.; Migdisov, A.A.; Wagner, T.; Williams-Jones, A.E.; Markl, G. An experimental study of the aqueous solubility and speciation of Y(III) fluoride at temperatures up to 250 °C. Geochim. Cosmochim. Acta 2013, 123, 403–415. [Google Scholar] [CrossRef]
- Guan, Q.; Mei, Y.; Etschmann, B.; Testemale, D.; Louvel, M.; Brugger, J. Yttrium complexation and hydration in chloride-rich hydrothermal fluids: A combined ab initio molecular dynamics and in situ X-ray absorption spectroscopy study. Geochim. Cosmochim. Acta 2020, 281, 168–189. [Google Scholar] [CrossRef]
- Stefanski, J.; Jahn, S. Yttrium speciation in subduction-zone fluids from ab initio molecular dynamics simulations. Solid Earth 2020, 11, 767–789. [Google Scholar] [CrossRef]
- Bau, M.; Dulski, P. Comparative study of yttrium and rare-earth element behaviours in fluorine-rich hydrothermal fluids. Contrib. Mineral. Petrol. 1995, 119, 213–223. [Google Scholar] [CrossRef]
- Schönenberger, J.; Köhler, J.; Markl, G. REE systematics of fluorides, calcite and siderite in peralkaline plutonic rocks from the Gardar Province, South Greenland. Chem. Geol. 2008, 247, 16–35. [Google Scholar] [CrossRef]
- Loges, A.; (Freie Universität Berlin, Berlin, Germany). Private Communication, 2020.
- Zhang, W.; Yan, T. A molecular dynamics investigation of La3+ and Lu3+-ligand speciation in aqueous solution. J. Mol. Liq. 2022, 347, 118367. [Google Scholar] [CrossRef]
- Zalkin, A.; Templeton, D.H. The Crystal Structures of YF3 and Related Compounds. J. Am. Chem. Soc. 1953, 75, 2453–2458. [Google Scholar] [CrossRef]
- Spedding, F.H.; Henderson, D.C. High-temperature heat contents and related thermodynamic functions of seven trifluorides of the rare earths: Y, La, Pr, Nd, Gd, Ho, and Lu. J. Chem. Phys. 1971, 54, 2476–2483. [Google Scholar] [CrossRef]
- Anders, J.; Limberg, N.; Paulus, B. First Principle Surface Analysis of YF3 and Isostructural HoF3. Materials 2022, 15, 6048. [Google Scholar] [CrossRef] [PubMed]
- Perdew, J.P.; Burke, K.; Ernzerhof, M. Generalized Gradient Approximation Made Simple. Phys. Rev. Lett. 1996, 77, 3865–3868. [Google Scholar] [CrossRef] [PubMed]
- Kresse, G.; Hafner, J. Ab initio molecular dynamics for liquid metals. Phys. Rev. B 1993, 47, 558–561. [Google Scholar] [CrossRef]
- Kresse, G.; Furthmüller, J. Efficiency of ab-initio total energy calculations for metals and semiconductors using a plane-wave basis set. Comput. Mat. Sci. 1996, 6, 15–50. [Google Scholar] [CrossRef]
- Kresse, G.; Furthmüller, J. Efficient iterative schemes for ab initio total-energy calculations using a plane-wave basis set. Phys. Rev. B 1996, 54, 11169–11186. [Google Scholar] [CrossRef] [PubMed]
- Kresse, G.; Hafner, J. Norm-conserving and ultrasoft pseudopotentials for first-row and transition elements. J. Phys. Condens. Matter. 1994, 6, 8245–8257. [Google Scholar] [CrossRef]
- NIST Computational Chemistry Comparison and Benchmark Database, NIST Standard Reference Database Number 101. 2022. Available online: http://cccbdb.nist.gov/ (accessed on 5 December 2022).
- NIST Diatomic Spectral Database, NIST Standard Reference Database 114. Available online: https://www.nist.gov/pml/diatomic-spectral-database (accessed on 5 December 2022).
- Sun, W.; Ceder, G. Efficient creation and convergence of surface slabs. Surf. Sci. 2013, 617, 53–59. [Google Scholar] [CrossRef]
- Tran, R.; Xu, Z.; Radhakrishnan, B.; Winston, D.; Sun, W.; Persson, K.A.; Ong, S.P. Surface energies of elemental crystals. Sci. Data 2016, 3, 160080. [Google Scholar] [CrossRef]
- Larsen, A.H.; Mortensen, J.J.; Blomqvist, J.; Castelli, I.E.; Christensen, R.; Dułak, M.; Friis, J.; Groves, M.N.; Hammer, B.; Hargus, C.; et al. The atomic simulation environment—a Python library for working with atoms. J. Phys. Condens. Matter. 2017, 29, 273002. [Google Scholar] [CrossRef]
- Nosé, S. A unified formulation of the constant temperature molecular dynamics methods. J. Chem. Phys. 1984, 81, 511–519. [Google Scholar] [CrossRef]
- Hoover, W.G. Canonical dynamics: Equilibrium phase-space distributions. Phys. Rev. A 1985, 31, 1695–1697. [Google Scholar] [CrossRef] [PubMed]
- Nosé, S. Constant Temperature Molecular Dynamics Methods. Prog. Theor. Phys. Suppl. 1991, 103, 1–46. [Google Scholar] [CrossRef]
- Pulay, P. Convergence acceleration of iterative sequences. the case of scf iteration. Chem. Phys. Lett. 1980, 73, 393–398. [Google Scholar] [CrossRef]
- Wood, D.M.; Zunger, A. A new method for diagonalising large matrices. J. Phys. A Math. Gen. 1985, 18, 1343. [Google Scholar] [CrossRef]
- Grimme, S.; Antony, J.; Ehrlich, S.; Krieg, H. A consistent and accurate ab initio parametrization of density functional dispersion correction (DFT-D) for the 94 elements H-Pu. J. Chem. Phys. 2010, 132, 154104. [Google Scholar] [CrossRef] [PubMed]
- Grimme, S.; Ehrlich, S.; Goerigk, L. Effect of the damping function in dispersion corrected density functional theory. J. Comput. Chem. 2011, 32, 1456–1465. [Google Scholar] [CrossRef]
- Kerker, G.P. Efficient iteration scheme for self-consistent pseudopotential calculations. Phys. Rev. B 1981, 23, 3082–3084. [Google Scholar] [CrossRef]
- Momma, K.; Izumi, F. VESTA 3 for three-dimensional visualization of crystal, volumetric and morphology data. J. Appl. Crystallogr. 2011, 44, 1272–1276. [Google Scholar] [CrossRef]
- Humphrey, W.; Dalke, A.; Schulten, K. VMD: Visual molecular dynamics. J. Mol. Graph. 1996, 14, 33–38. [Google Scholar] [CrossRef]
- Jeffrey, G. An Introduction to Hydrogen Bonding; Oxford University Press: New York, NY, USA; Oxford, UK, 1997. [Google Scholar]
- Epstein, G.L.; Reader, J. Spectrum of doubly ionized yttrium (YIII). J. Opt. Soc. Am. 1975, 65, 310–314. [Google Scholar] [CrossRef]
- Johnson, D.A.; Nelson, P.G. Lanthanide Ionization Energies and the Sub-Shell Break. Part 2. The Third and Fourth Ionization Energies. J. Phys. Chem. Ref. Data 2017, 46, 013109. [Google Scholar] [CrossRef]


Disclaimer/Publisher’s Note: The statements, opinions and data contained in all publications are solely those of the individual author(s) and contributor(s) and not of MDPI and/or the editor(s). MDPI and/or the editor(s) disclaim responsibility for any injury to people or property resulting from any ideas, methods, instructions or products referred to in the content. |
© 2023 by the authors. Licensee MDPI, Basel, Switzerland. This article is an open access article distributed under the terms and conditions of the Creative Commons Attribution (CC BY) license (https://creativecommons.org/licenses/by/4.0/).