Article

Silica–Chitosan Composite Aerogels for Thermal Insulation and Adsorption

1
Yangtze Delta Region Institute (Huzhou), University of Electronic Science and Technology of China, Huzhou 313001, China
2
State State Key Laboratory of Chemistry and Utilization of Carbon Based Energy Resources, College of Chemistry, Xinjiang University, Urumqi 830017, China
3
Institute of General and Inorganic Chemistry, Academy of Sciences of the Republic of Uzbekistan, Tashkent 100047, Uzbekistan
*
Author to whom correspondence should be addressed.
Crystals 2023, 13(5), 755; https://doi.org/10.3390/cryst13050755
Submission received: 13 March 2023 / Revised: 7 April 2023 / Accepted: 27 April 2023 / Published: 2 May 2023

Abstract

:
The dissipation of energy in the form of heat causes a huge energy loss across the globe. Thermal insulation materials which reduce heat loss can alleviate the energy crisis. Among many thermal insulation materials, silica aerogels (SAs) have attracted extensive attention due to their high surface area, low density and low thermal conductivity. However, the applications of SAs are restricted by their mechanical fragility. In this paper, a series of different ratios of silica–chitosan composite aerogels (SCAs) were prepared by mixing sodium silicate aqueous solution and chitosan solution followed by freeze drying. The surface morphology of SAs, CAs and SCAs was studied by scanning electron microscopy (SEM). The specific surface area, pore volume and pore size of the composite aerogels were studied by N2 adsorption–desorption isotherms. The thermal conductivities, chemical structures, thermal stabilities and hydrophobicities of SAs, CAs and SCAs were tested and analyzed. In addition, the adsorption properties of SCAs were measured using different organic solvents. The results reveal that when the proportion of sodium silicate aqueous solution and chitosan solution is 1:1, the obtained SCA−1/1 has the best performance, with a low thermal conductivity of 0.0369 W/m·K, a large specific surface area of 374.7 m2/g, and good thermal stability. In addition, the prepared SCAs also have good hydrophobicity and absorption properties, with adsorption capacities of 6.7–9.4 g/g, which show great application potential in the fields of insulation and adsorption.

1. Introduction

The energy consumption of the construction sector accounts for 35–40% of the world’s total energy consumption [1,2,3]. The low efficiency has led to a series of problems, such as energy crisis and environmental pollution, which seriously threaten the survival and development of human beings. In particular, energy is mostly lost in the form of heat [4,5,6]. It is very important to develop thermal insulation materials with low thermal conductivity and good durability to improve the efficiency of energy use [7]. Because of their unique advantages, silica aerogels (SAs) have become one of the most promising thermal insulation materials in the last century, which is widely used in heat insulation, adsorption and other fields [8,9,10]. However, traditional SAs also show the disadvantages of brittleness and poor mechanical properties [11,12,13,14]. Therefore, improving the mechanical properties of aerogels is the foundation for potential applications. In order to enhance the mechanical properties of aerogels, silica aerogels are usually compounded with fibers, polymers, binders, etc. [15,16,17]. For example, Feng et al. [18] used methyl trimethylsilane (MTMS) and regenerated cellulose fibers to prepare SiO2-cellulose aerogel with a thermal conductivity of 0.04 W/m·K. Jiang et al. [19] used cellulose nanofibers, MTMS and gaseous silica suspension to prepare composite aerogel by the freeze-drying method. The thermal conductivity of composite aerogel is low, at 0.027 W/m·K. However, organosilicon is used for the preparation of the above composite aerogels, which is expensive and noxious. Li et al. [20] prepared aramid fiber-reinforced silica aerogel composites by atmospheric pressure drying, which showed an integrated, crack-free appearance and significant flexibility. The prepared composite aerogel also has a very low thermal conductivity of 0.0227 ± 0.0007 W/m·K. Alves et al. [21] describe for the first time the preparation of silica-based aerogel composites containing recycled rubber tires reinforced with polyvinyl butyral (PVB) by hot pressing. The density of the composite is as low as 474 kg·m−3. Composite materials containing silicone, recycled tire rubber, and PVP have a thermal conductivity as low as 55 W/m·K. Halimaton et al. [22] prepared silicone rubber (RTV-SiR)/silica aerogel composite. Compared to pristine RTV-SiR, composite reinforced with SA particles demonstrates low density, high strength, low thermal conductivity, high surface hydrophobicity and excellent resistance to flame penetration test. Merillas et al. [23] prepared silica aerogel-PU foam composites. The obtained samples showed excellent insulating capacities, reaching values between 14.0 and 12.3 mW/m·K for the surface-modified composites that were dried under supercritical conditions. Merillas et al. [24] prepared silica aerogel composites reinforced with reticulated PU foam by the sol–gel method and under both ambient and supercritical drying pressures. The carbonyl and amine groups of the polyurethane foam could establish a chemical interaction with the silica matrix, promoting an effective interaction, thus improving the mechanical properties of the silica aerogel. Moreover, the composites exhibit excellent insulating capacity, reaching thermal conductivities as low as 14 mW/m·K. Linhares et al. [25] report the effect of different forms of cellulose embedding on the final properties of the compound material. The embedding of cellulose in silica aerogels largely prevents shrinkage during drying and also effectively improves their mechanical properties. However, the embedding of cellulose leads to an increase in the density of the composite, making it difficult to maintain its inherent thermal insulation properties and high specific surface area. It is meaningful to construct silicon-based composite aerogels from cheap and sustainable raw materials.
Chitosan is the second largest natural biomass, which is a recyclable and inexhaustible renewable resource [26,27,28,29]. It has the advantages of biodegradability, compatibility and non-toxicity, and can be widely used in various additives, carriers, absorbing materials, cosmetics and other fields [30,31]. At the same time, it is also a good raw material for the preparation of aerogel. Its internal structural characteristics make chitosan the preferred material to serve as the skeleton of silicon-based composite aerogels [32,33,34].
In this study, we introduced chitosan into SAs obtained from non-organosilicon to prepare composite aerogels. Chitosan was used as the skeleton structure to synthesize the composite aerogel with excellent performance. Silica–chitosan composite aerogels (SCAs) can maintain a complete structure, and there are a large number of nanopores on the surface, which can effectively reduce the heat transfer between gas molecules, thus improving the thermal insulation performance of SCAs. In addition, the morphology, density, specific surface area, pore size, thermal stability, hydrophobicity and adsorption properties of SCAs were characterized.

2. Materials and Methods

2.1. Materials

Chitosan (C6H12O6), ammonium bicarbonate (NH4HCO3), N, N dimethylformamide (DMF), glacial acetic acid (CH3COOH), ammonia (NH3·H2O, 25 wt%) and absolute ethanol (C2H5OH) were purchased from Yongsheng Fine Chemical Co., Ltd., Tianjin, China. Trimethylchlorosilane (C3H9ClSi) and sodium silicate (Na2SiO3·9H2O) were purchased from Aladdin Biochemical Technology Co., Ltd., Shanghai, China. Hydrochloric acid (HCl) was purchased from Dicheng Chemical Co., Ltd., Urumqi, China. None of the chemicals used were further purified.

2.2. Preparation of SAs

Na2SiO3 was used as silicon source to prepare SiO2 solutions with mass concentrations of 4 wt%, 6 wt%, 8 wt%, 10 wt% and 12 wt%, respectively. Cation exchange resin was used to remove Na ions in the solution to obtain H2SiO3 solution. H2SiO3 was mixed with EtOH and DMF in a certain proportion. HCl solution was added to obtain mixture with pH 1–3. After stirring for 8 h, the SiO2 gel was then obtained by dropping NH4·OH solution to its pH of 7. Finally, the gel was frozen at a low temperature and subsequently freeze-dried to obtain SiO2 aerogel. The obtained SiO2 aerogel was labeled SA−X (X represents the mass concentration of SiO2).

2.3. Preparation of CAs

A certain amount of chitosan was dissolved in 0.1M acetic acid solution, and then add a certain amount of DMF to obtain 1 wt%, 2 wt%, 3 wt% and 4 wt% chitosan solution. After stirring for 10 h, NH4HCO3 was added to make the pH of the solution neutral. CAs were obtained by freeze-drying chitosan solution with different mass concentrations. The obtained aerogel was marked as CA−X (X represents the mass concentration of chitosan).

2.4. Preparation of SCAs

Chitosan was weighed and dissolved in 0.1M acetic acid solution, and a certain amount of DMF was added to obtain 1 wt% chitosan solution. A certain amount of sodium silicate was dissolved in water and mixed with EtOH and DMF in a certain ratio to obtain 6 wt% silica sol. CS solution and silica sol were mixed according to a certain proportion, and then a certain amount of ammonium bicarbonate was added to the mixture to make the solution pH neutral. The mixture was stirred continuously for 8 h to allow the solution to react fully. The resulting complexes were freeze-dried to obtain silica–chitosan composite aerogels (SCAs, Figure 1a). The samples were labeled as SCA−1/4, SCA−1/2, SCA−1/1, SCA−2/1 and SCA−4/1 (A/B represents the ratio of the two composites).

2.5. Characterization

The morphology of the samples was analyzed by field emission electron microscopy at 5 kV accelerating voltage. The density of the sample is measured by the specific gravity method. A 10 mL gravimetric flask is filled with water. After removing the air bubbles, it is weighted and recorded as m1 (g). The mass of the sample is weighed and recorded as m2 (g). The sample is placed in a water-filled specific gravity bottle and weighed as m3 (g) after the water spills out. The density of the material is then calculated. A 100 mg sample was degassed at 200 °C for 10 h under N2. The N2 adsorption–desorption isothermal curve of the sample was obtained at 70 K. The specific surface area of the sample was calculated by Brunauer–Emmet–Teller (BET) method, and the pore size distribution of the sample was obtained by Barrett–Joyner–Halenda (BJH) method. The thermal conductivity of the prepared samples was measured using a TPS2500 Hot Disk thermal conductivity instrument purchased from Hot Disk Corporation, Uppsala, Sweden. The sample was placed on a stable heat source, and using an infrared thermograph, the temperature values of the sample surface were measured at different times. A thermogravimetric differential thermal analyzer was used to analyze the composition of the samples. A small amount of samples were placed in a small crucible and heated under inert atmosphere with a ventilation rate of 10 mL/min and a heating rate of 10 °C/min. During this process, the mass loss of the sample is recorded, and thus the sample composition is analyzed. The surface functional groups of the materials were analyzed by Fourier transforms infrared spectroscopy (FT-IR). A small amount of samples were taken and pressed in a tablet press to make translucent thin sections. The sample thin sections were tested on DSA100 contact Angle tester at room temperature, and the water droplets on the surface of the sample thin sections were photographed at different times. The organic solvent was stained using Oil Red O reagent, and the stained solvent was dripped in water. The aerogel was then placed in water for an adsorption test.

3. Results

3.1. Morphology Analysis of SCAs

Taking Na2SiO3 as the silicon source, we first used 732 cation exchange resins to carry out ion exchange on the prepared Na2SiO3 solution to remove Na+. Then, SAs were prepared by the sol–gel and freeze-drying methods. Figure S1 is a presentation of the XRD analysis carried out to characterize the phase structure of aerogel. It shows that the diffraction peaks of the prepared SAs and SCAs match the standard card of SiO2. In addition, the intensity of the diffraction peak of SCAs is significantly higher than that of SAs, indicating the increased crystallinity of the composite aerogel.
From the photograph (Figure 1b) of the SA, it can be clearly seen that due to the weak force between Si−O−Si bonds in the prepared pure silica aerogel, the material is prone to structural collapse and breakage under the action of external forces, which makes it impossible to maintain a complete structure. Different mass concentrations of CAs were prepared by freeze drying. As shown in Figure 1c, CA has a complete block structure. The preparation process of SCAs is shown in Figure 1a. When the silica sol is mixed with the chitosan solution, hydrogen bonds are formed from the silica hydroxyl groups produced by partial hydrolysis and amino groups of chitosan, resulting in SCAs with a network structure. The photographic diagram (Figure 1d) of the SCAs also shows that the SCAs have a complete structure, smooth surface and certain flexibility. It successfully overcomes the problem that SAs are easy to break and collapse. The SEM images (Figure 1e and Figure S1a–e) of SAs with different mass concentrations of SiO2 clearly show that the morphology of the synthesized SAs is generally similar. The structure of SAs is formed by the interconnection of free SiO2 particles, and the content of SiO2 in the solution has a definite influence on the morphology of SAs. When the SiO2 content is low, the small amount of SiO2 particles cannot support the pore structure of SAs. When the mass concentration of silica increases, the large number of SiO2 particles acts as a support and forms abundant and homogeneous pores on the surface of the SA. The formation of a large number of nanopores inhibits the heat conduction and convection of gases in the porous skeleton, preventing the rapid transfer of heat and thus enabling SAs to exhibit good thermal insulation properties. However, when the SiO2 content continues to increase, excessive SiO2 particles will accumulate again, resulting in agglomeration on the surface of the material. Figure S3 shows SEM images of the prepared (CA) at different mass concentrations, from which it can be clearly observed that the prepared CA consists of a stack of lamellar structures. The morphology of the prepared CA−1 sample can be observed in Figure S2a as a stacked flake structure. The SEM magnification shows that the stacked flakes have a small thickness, forming an overall shape with some flake interlayers. As can be seen in Figure S3b–d, the morphology of the CA did not change significantly with increasing mass concentration of chitosan and still consisted of stacked flakes. The SEM images of the SCAs (Figure S4a–e) demonstrate that the SCAs are filamentary, which acts as a good link to the overall composite, making them a good monolithic block. As can be seen in Figure S4a, when the SiO2 content is low, the material mainly resembles a three-dimensional mesh structure, where the CA acts as a skeletal support. The presence of a large number of pores on the surface of the material can be observed, giving the SCAs a richer structure. Figure S4b–e indicates that the morphology of the SCAs changes with the Si content increasing, and a large number of nanoparticles are attached to the CA skeleton. In addition, the SEM image at magnification (inset of Figure S4) shows that accumulation and agglomeration of nanoparticles occur on the surface of the material. The number of pores in the material reduces. It can be concluded that the composite ratio of CA to silicon has a significant effect on the overall structure of the SCAs.

3.2. Structural Analysis of SCAs

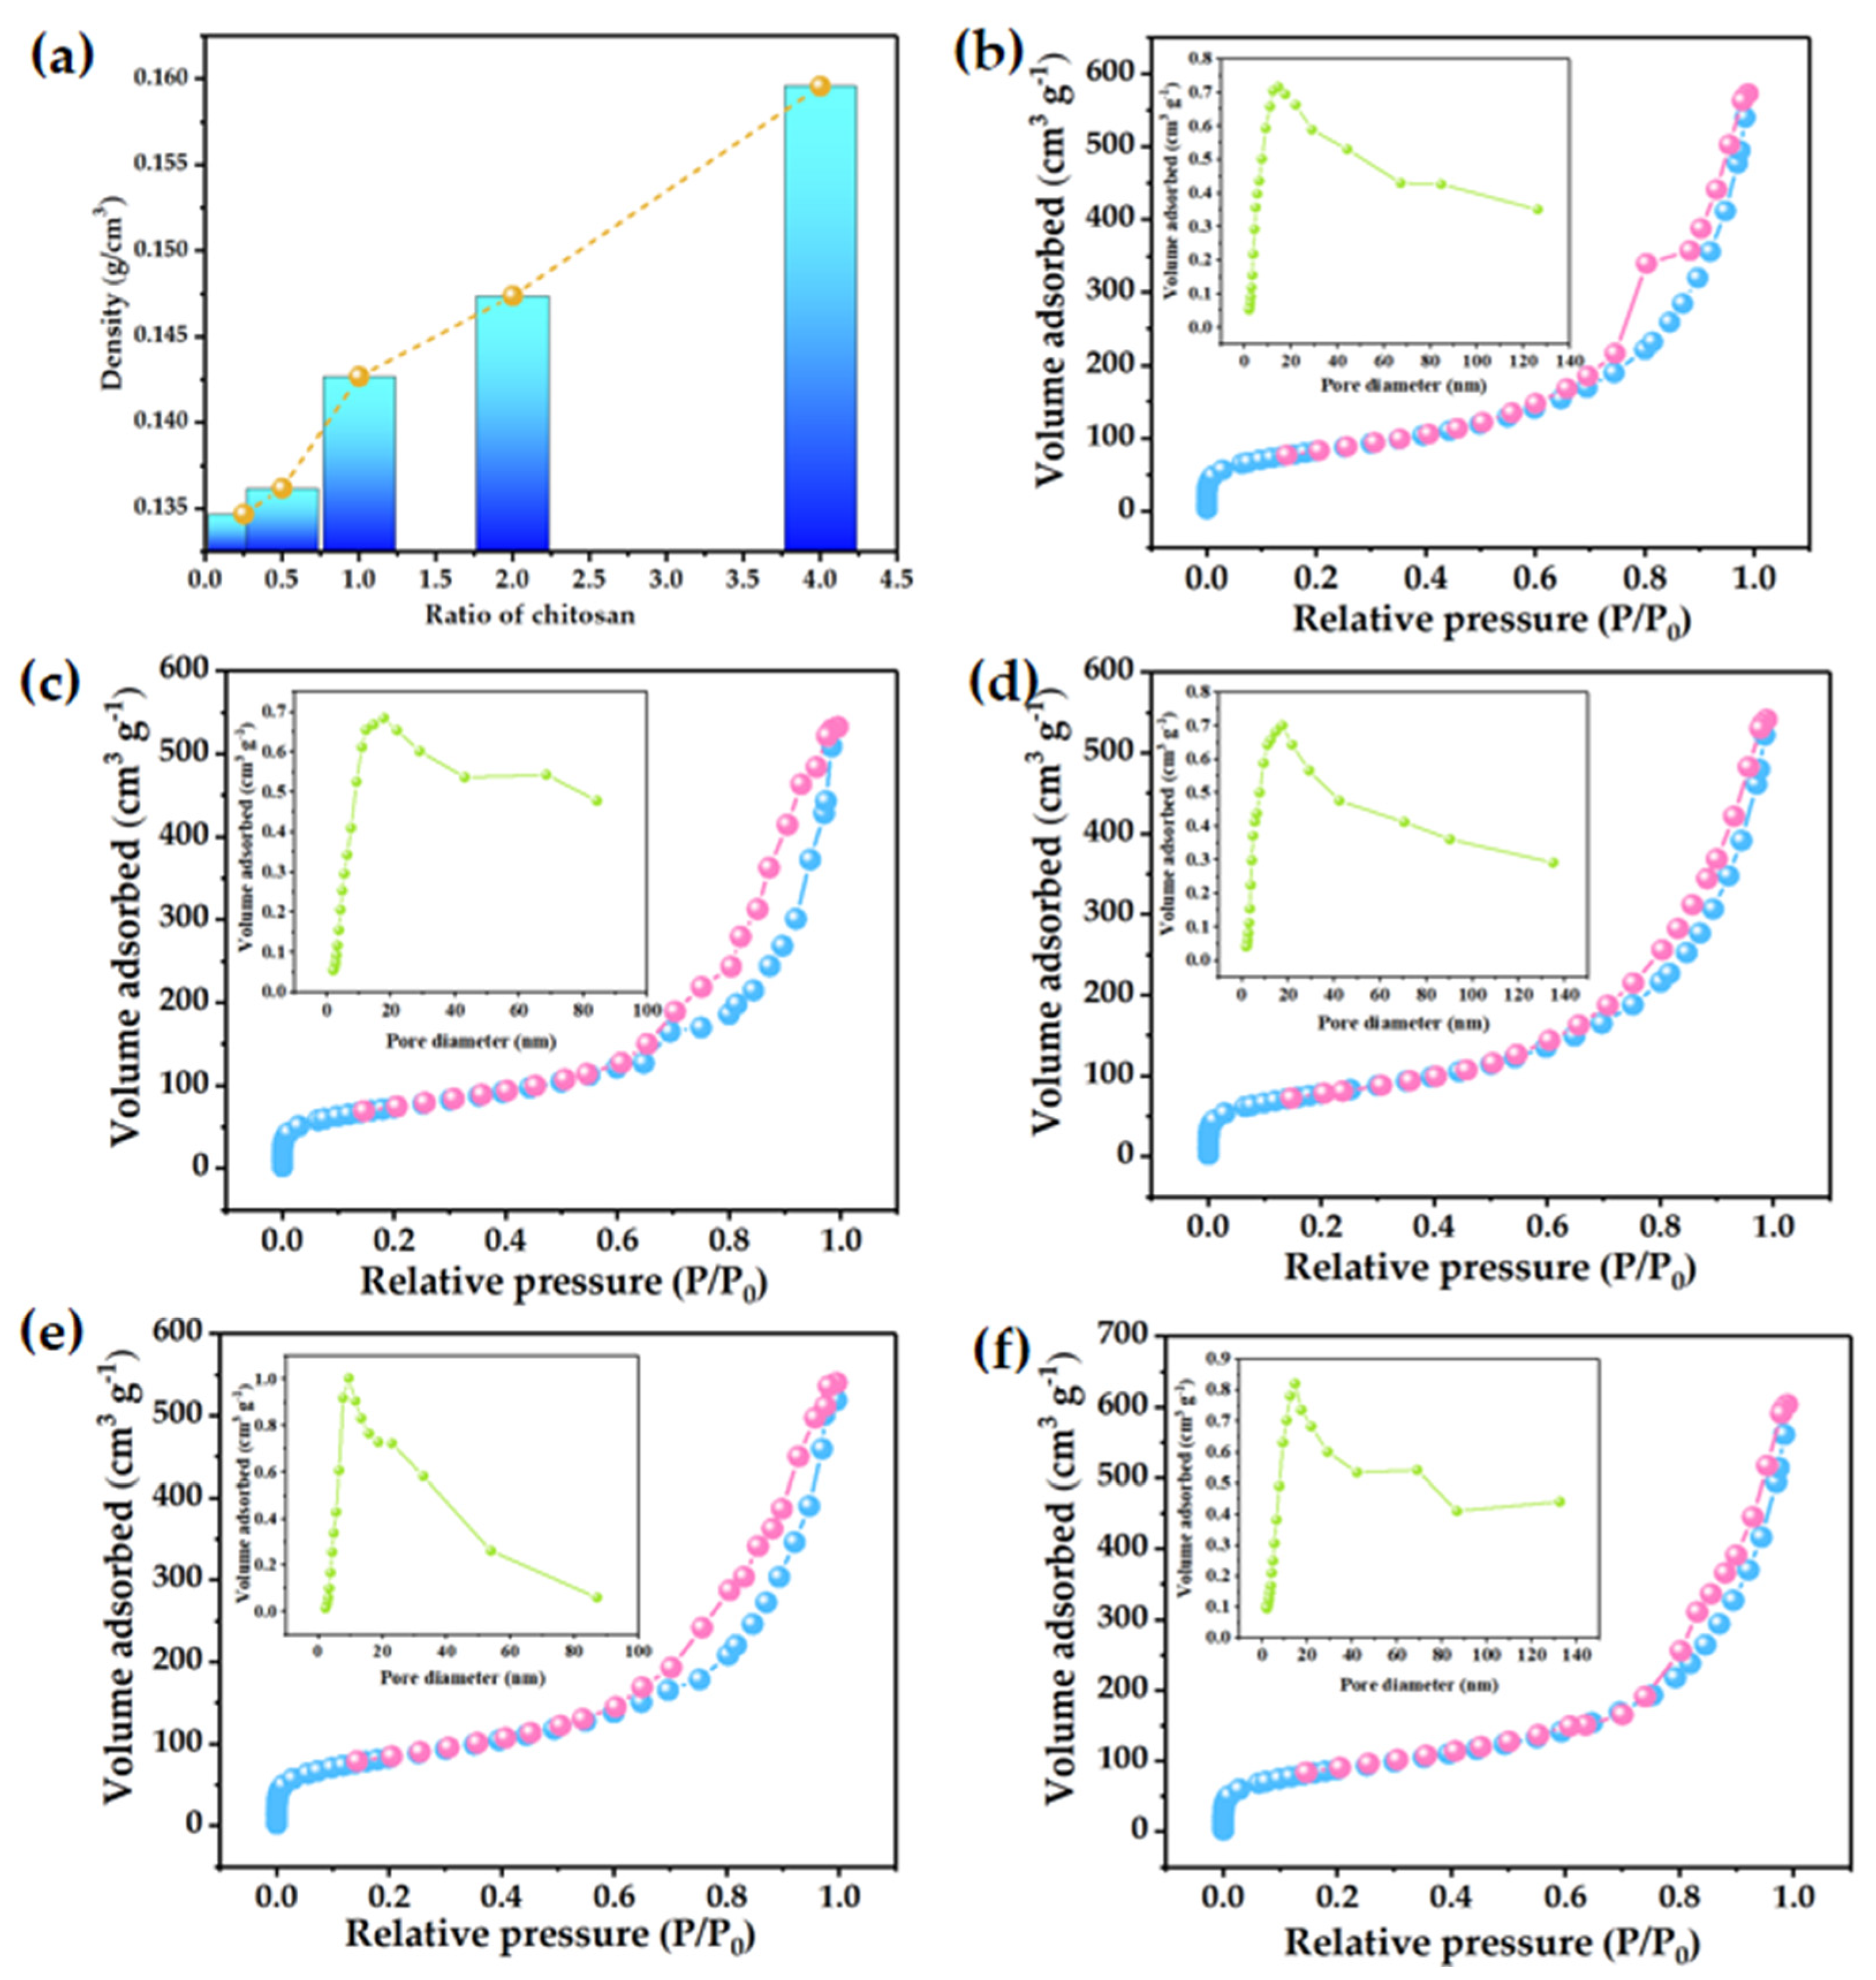
In order to investigate the effect of concentration on density and porosity, SAs and CAs were configured with different mass concentrations, respectively. As can be seen in Figure S5a and Table S1, the density of SAs increases from 0.060 to 0.067 g/cm3 as the mass concentration of SiO2 rises from 4 to 12 wt%. As the mass concentration of SiO2 gradually increases, the internal skeleton of the prepared aerogel gradually becomes denser, resulting in a dense structure and, thus, a growing density of the material [35]. In addition, the porosity of the material was calculated based on the density of the sample. From the SA porosity diagram (Figure S6a and Table S1), it can be seen that the SA porosity decreases with increasing mass concentration of SiO2, which is caused by the continuous filling of the internal pores by SiO2 particles. The densities of CAs prepared at different chitosan mass concentrations are shown in Figure S5b and Table S2. It can be observed that the density of CA ranges from 0.0957 to 0.1012 g/cm3 and shows an increasing trend as the chitosan content rises. When the mass concentration of chitosan grows, the lamellar distribution of chitosan in aerogels becomes more compact. The spacing between the lamellae decreases, and the density grows due to the large accumulation of lamellar structures. Additionally, the porosity diagrams of CAs (Figure S6b and Table S2.) reflect that the porosity of CA varies inversely with density, and the porosity is above 93% in all cases. SCAs were obtained by compounding SiO2 into the CA skeleton, and the density variation is shown in Figure 2a and Table S3. The density of SCAs was found to be in the range of 0.1327−0.1596 g/cm3, and its overall density was greater than that of SAs and CAs. Moreover, the density of SCAs demonstrated a growing trend with increasing chitosan concentration due to the successful attachment of SiO2 to the CA skeleton. The density of the SCAs was calculated according to the mixture rule and compared with the measured value (as shown in Table S4). The pore structure and pore size distribution of SCAs were further studied by N2 adsorption and desorption test. As can be seen in Figure 2b–f, all samples are Type IV isotherms with H4 hysteresis loops. There is a rapid upward trend in the low-pressure region (P/P0 < 0.1), which at this point belongs to the microporous filling area. As the nitrogen gas molecules slowly fill the micropores, the material begins to undergo a monomolecular layer adsorption process, which then slowly shifts to a multimolecular adsorption process. When P/P0 increases to the middle-pressure region (0.8 < P/P0 < 1), there is an obvious hysteresis loop in the nitrogen adsorption and desorption isotherms, which indicates that there is a mesoporous structure in the material. When P/P0 is between 0.8 and 1, it can be concluded from the curve trend that the SCA material contains a macroporous structure. The above results demonstrate that the prepared SCAs have an abundant pore structure, which is further confirmed by the pore size distribution diagrams of the samples (inset of Figure 2b–f). The specific surface area, pore volume and pore size of the prepared samples are shown in Table S5. The specific surface area, pore volume and pore diameter show a trend of increasing and then decreasing, with SCA−1/1 having the largest specific surface area and pore volume of 374.7 m2 g−1 and 0.9 cm3 g−1, respectively. Due to the presence of capillary condensation, the pore volume measured by N2 adsorption and desorption is smaller than the actual value. In order to describe the pore volume more accurately, the pore volume of SCAs are calculated and compared with the measured value. The results are shown in Table S6.

3.3. Analysis of Heat Conduction, Heat Insulation and Thermal Stability of SCAs

In order to understand the thermal insulation properties of the samples produced, their thermal insulation coefficient was tested. Figure S7a and Table S1 show the thermal conductivity of SAs at different mass concentrations, from which it can be observed that the thermal conductivity of SAs is in the range of 0.0398–0.0440 W/m·K. Moreover, the thermal conductivity of SAs showed a trend of decreasing and then increasing with the rise of SiO2 mass concentration. The thermal conductivity of SAs was 0.0404 W/m·K when the mass concentration of SiO2 was 6 wt%, which was much lower than the other samples. This is because SAs cannot maintain a complete structure when the mass concentration of silica is small. Only when SAs maintain an intact structure do a large number of nanoscale pores form on the surface of SAs. The pore size of these holes is smaller than the free range of the air molecules, which prevents the rapid and efficient transfer of heat, resulting in a material with low thermal conductivity. Similarly, when the mass concentration of silica is high, a large number of silica particles will agglomerate on the surface of the SA, reducing the number of pores and thus leading to a weakening in insulation performance. At the same time, CAs have the lowest thermal conductivity (0.0398 W/m·K) when the mass concentration of chitosan is 1 wt% (Figure S7b and Table S2). Furthermore, the thermal conductivity of CAs exhibits an upward trend with growing chitosan concentration. In combination with its morphology, it can be concluded that there is a relationship between the magnitude of the thermal conductivity and the morphology. When the content of CA added is small, the structure consists of a laminar stacking of sheets with certain spacing between the sheets, thus allowing it to act as a barrier to heat transfer. As the CA content increases, leading to agglomeration and layer stacking, it makes the rate and efficiency of heat transfer between solids higher, which is not conducive to heat insulation. To further explore the relationship between morphology and thermal conductivity, composite aerogels were prepared by mixing the CA with the best−performing and silica sol in proportion. It can be seen that the thermal conductivity of SCAs is in the range of 0.0369–0.0391 W/m·K from Figure 3a and Table S3. As the silicon content grows, the thermal conductivity of SCAs demonstrates a tendency to increase and then decrease, with SCA−1/1 having the lowest thermal conductivity of 0.0391 W/m·K. This is because the complex skeleton structure of nanoporous insulation materials increases the heat transfer path when heat is transferred through the solid skeleton. This makes the aerogel nanoporous insulation material produce a larger thermal resistance, resulting in a lower thermal conductivity of the aerogel [36]. The obtained SCAs were compared with other Si-based composite aerogels, as shown in Table S7. The prepared SCAs have a lower thermal conductivity, indicating that their thermal insulation performance is more outstanding. Moreover, the prepared SCAs have the advantages of a wide source of raw materials and a low price.
Thermal insulation tests were carried out on the prepared SCA samples using an infrared imager (as shown in Figure S8), and the results are shown in Figure 3b–e. The aerogel sample was placed on a stable heat source at 50–55 °C, and the upper surface temperature of the sample was measured after 1 min of continuous heating. The infrared photographs unambiguously point that the temperature of the material surface remains at around 14–16 °C. The material was then placed on a heat source at 100 °C. After 1 min of continuous heating, the upper surface of the sample remained at a relatively low temperature of around 20 °C. Furthermore, the temperature rises slowly when heating is continued, which evidences that the SCAs have excellent thermal insulation properties. The upper surface of the material always shows a large temperature difference from the heat source, indicating that the prepared SCAs have good thermal insulation properties. In order to investigate the thermal stability of SCAs, thermogravimetric tests were carried out. The weight loss was tested by heating the SCAs to 800 °C under a N2 atmosphere, and the results are shown in Figure 3f. The SCAs show a mass loss of approximately 1.7% during the heating process between 30 and 140 °C. This phenomenon is probably due to the evaporation of the residual adsorbed water and solvent. When the temperature continues to rise to around 260 °C there is a mass loss of approximately 14%, which was attributed to the condensation reaction of the -OH and silicone hydroxyl groups on the surface of the material that had not been completely replaced to produce water and evaporate. In addition, when the temperature rises to around 550 °C, some mass loss occurs, mainly due to the oxidative decomposition of the −CH3. The SCAs were calcined at 800 °C with only about 20% mass loss, demonstrating the high thermal stability of the SCAs.

3.4. Study on Hydrophilic/Hydrophobic Properties of SCA

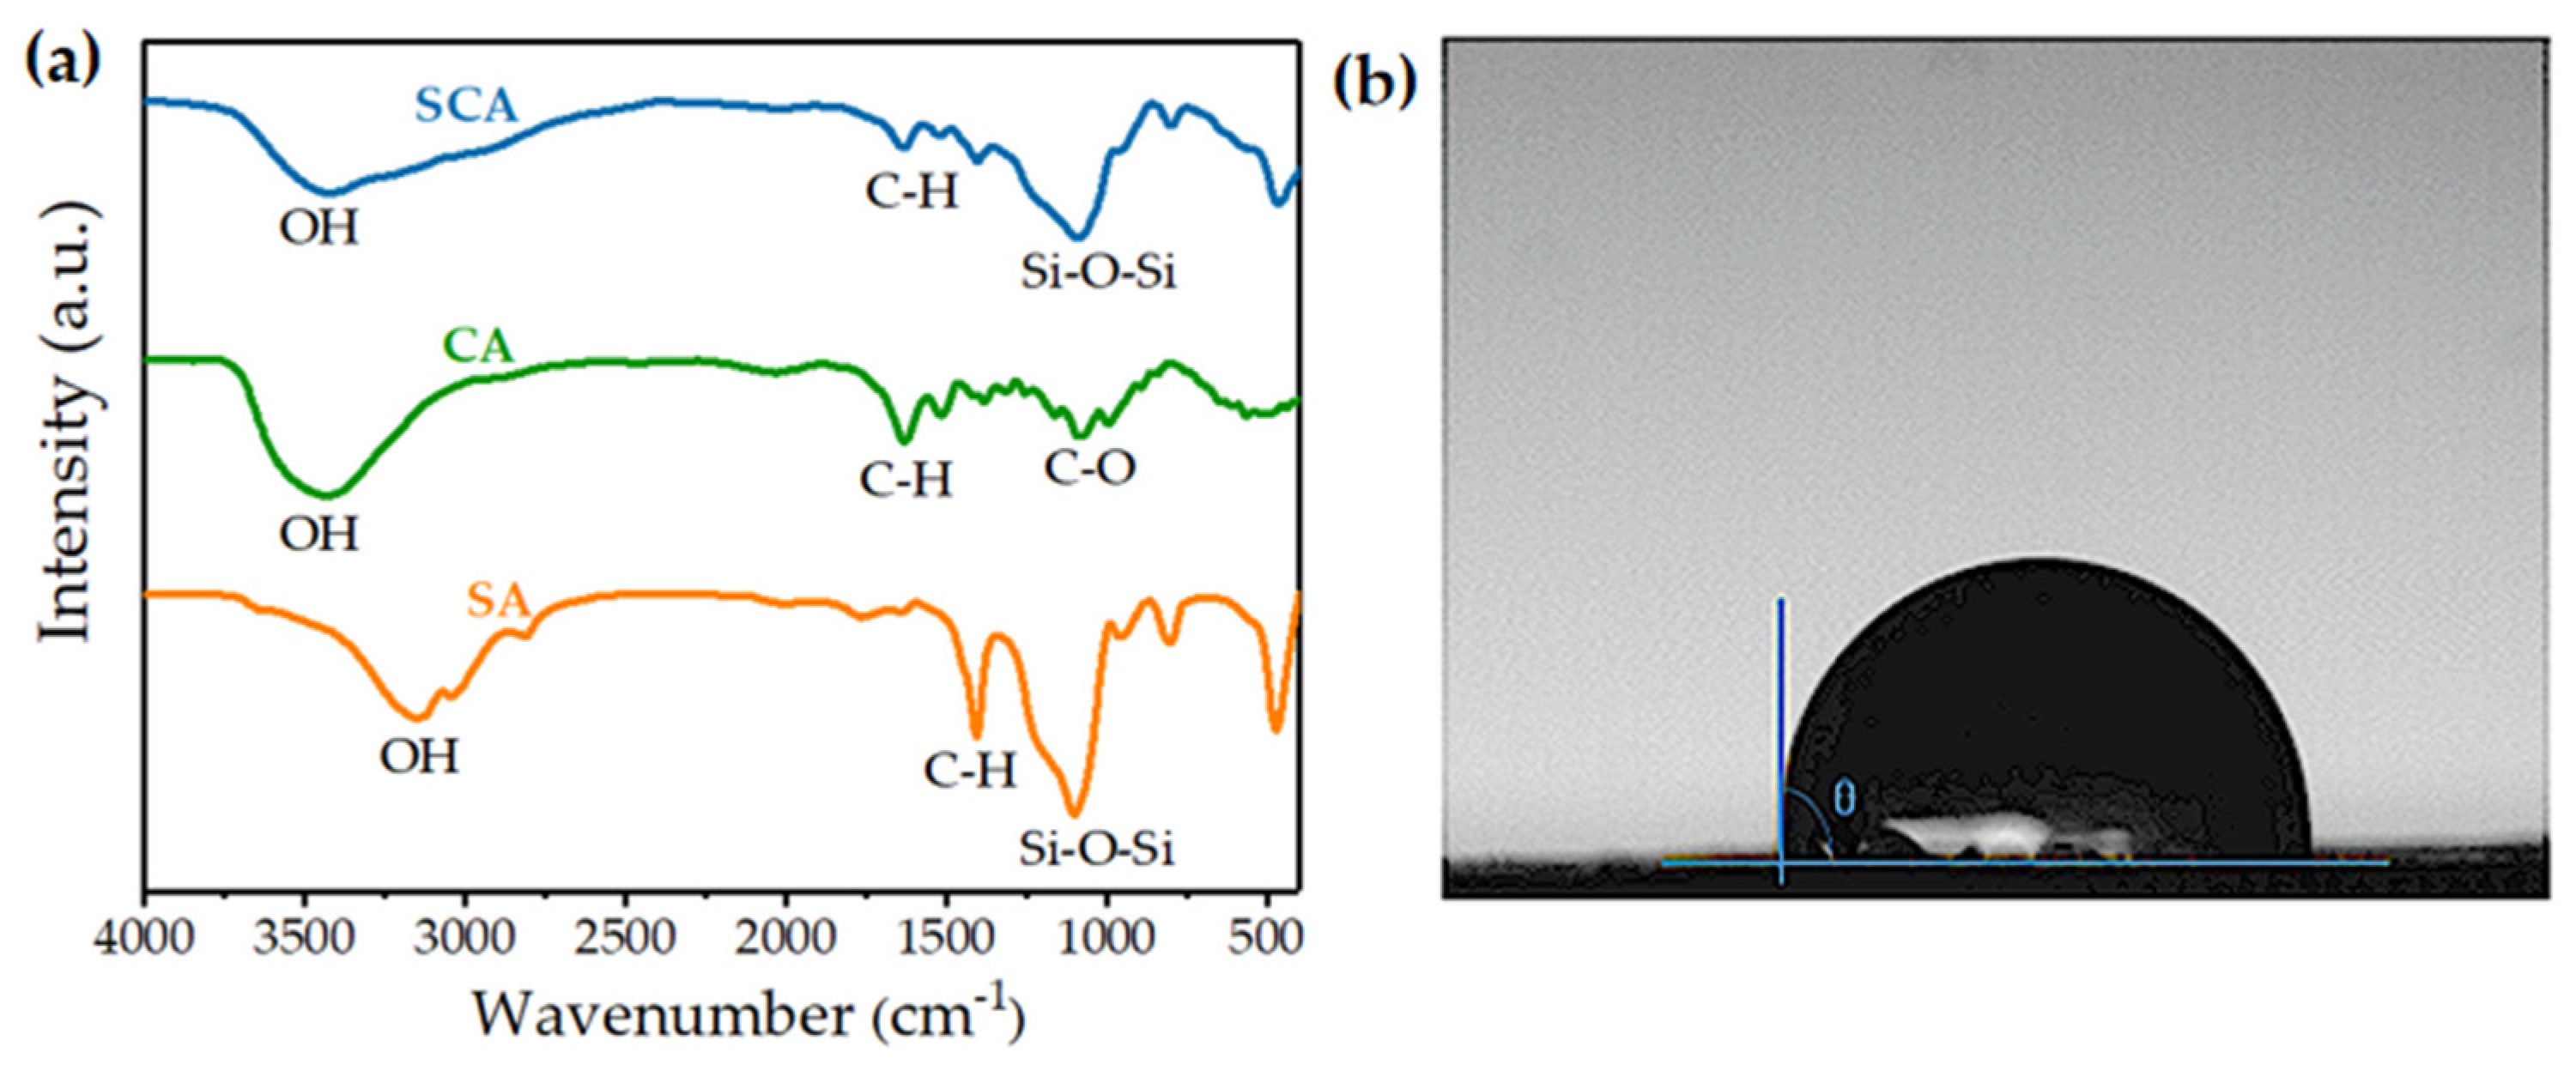
The prepared aerogel samples were tested by Fourier infrared spectroscopy, and the results are shown in Figure 4a. The characteristic peaks of SAs near 1102, 802 and 470 cm−1 are the antisymmetric contraction peak, symmetric contraction vibration absorption peak and bending vibration peak of the Si-O-Si bond, respectively. A series of diffraction peaks in the spectra of CAs near 2460, 2029, 1515, 1085, 560 and 440 cm−1 are caused by stretching vibrations of the C−H bond in −CH3, indicating that the prepared CA carries a large number of hydrophobic groups −CH3 on its surface, forming a hydrophobic CA. The characteristic peaks near 1090 cm−1 and 463 cm−1 can be clearly observed in the SCA spectra, which represent the alternating stretching and bending vibrations of Si−O−Si in the SA backbone, respectively. In addition, the peaks near 2026, 1520 and 798 cm−1 correspond to the stretching vibrations inside and outside the C−H plane in −CH3, which evidence that the prepared SCAs successfully possessed the hydrophobic function of methylation. In order to explore the hydrophobic properties of the material, water contact angle tests were carried out on the prepared SCAs, as shown in Figure 4b. The water droplets stand on the surface of the SCA without penetrating into the material. The water contact angle can reach about 103°, which reflects the good hydrophobic properties of SCAs. This is because the hydrophobic surface is rich in −CH3 functional groups, which prevent the material from contact with aqueous solvents.

3.5. Adsorption Performance of SCA

SCAs exhibit hydrophobic characteristics, spatial structure and a large number of pores. Therefore, the adsorption performance of SCAs was tested. Silicone oil (Figure S9a,b) and n−hexane (Figure S9c,d) was stained using Oil Red O reagent, respectively. When the stained organic solvent was dropped into the aqueous solution, the organic solvent would float above the aqueous solvent as they were not mutually soluble, and the organic solvent was less dense than water. The SCAs are then immersed in an aqueous solution where they float due to the low density, light mass and hydrophobicity. Additionally, it can be clearly observed that the stained organic solvent is gradually completely adsorbed by the aerogel material, which indicates that the prepared SCA has good adsorption properties.
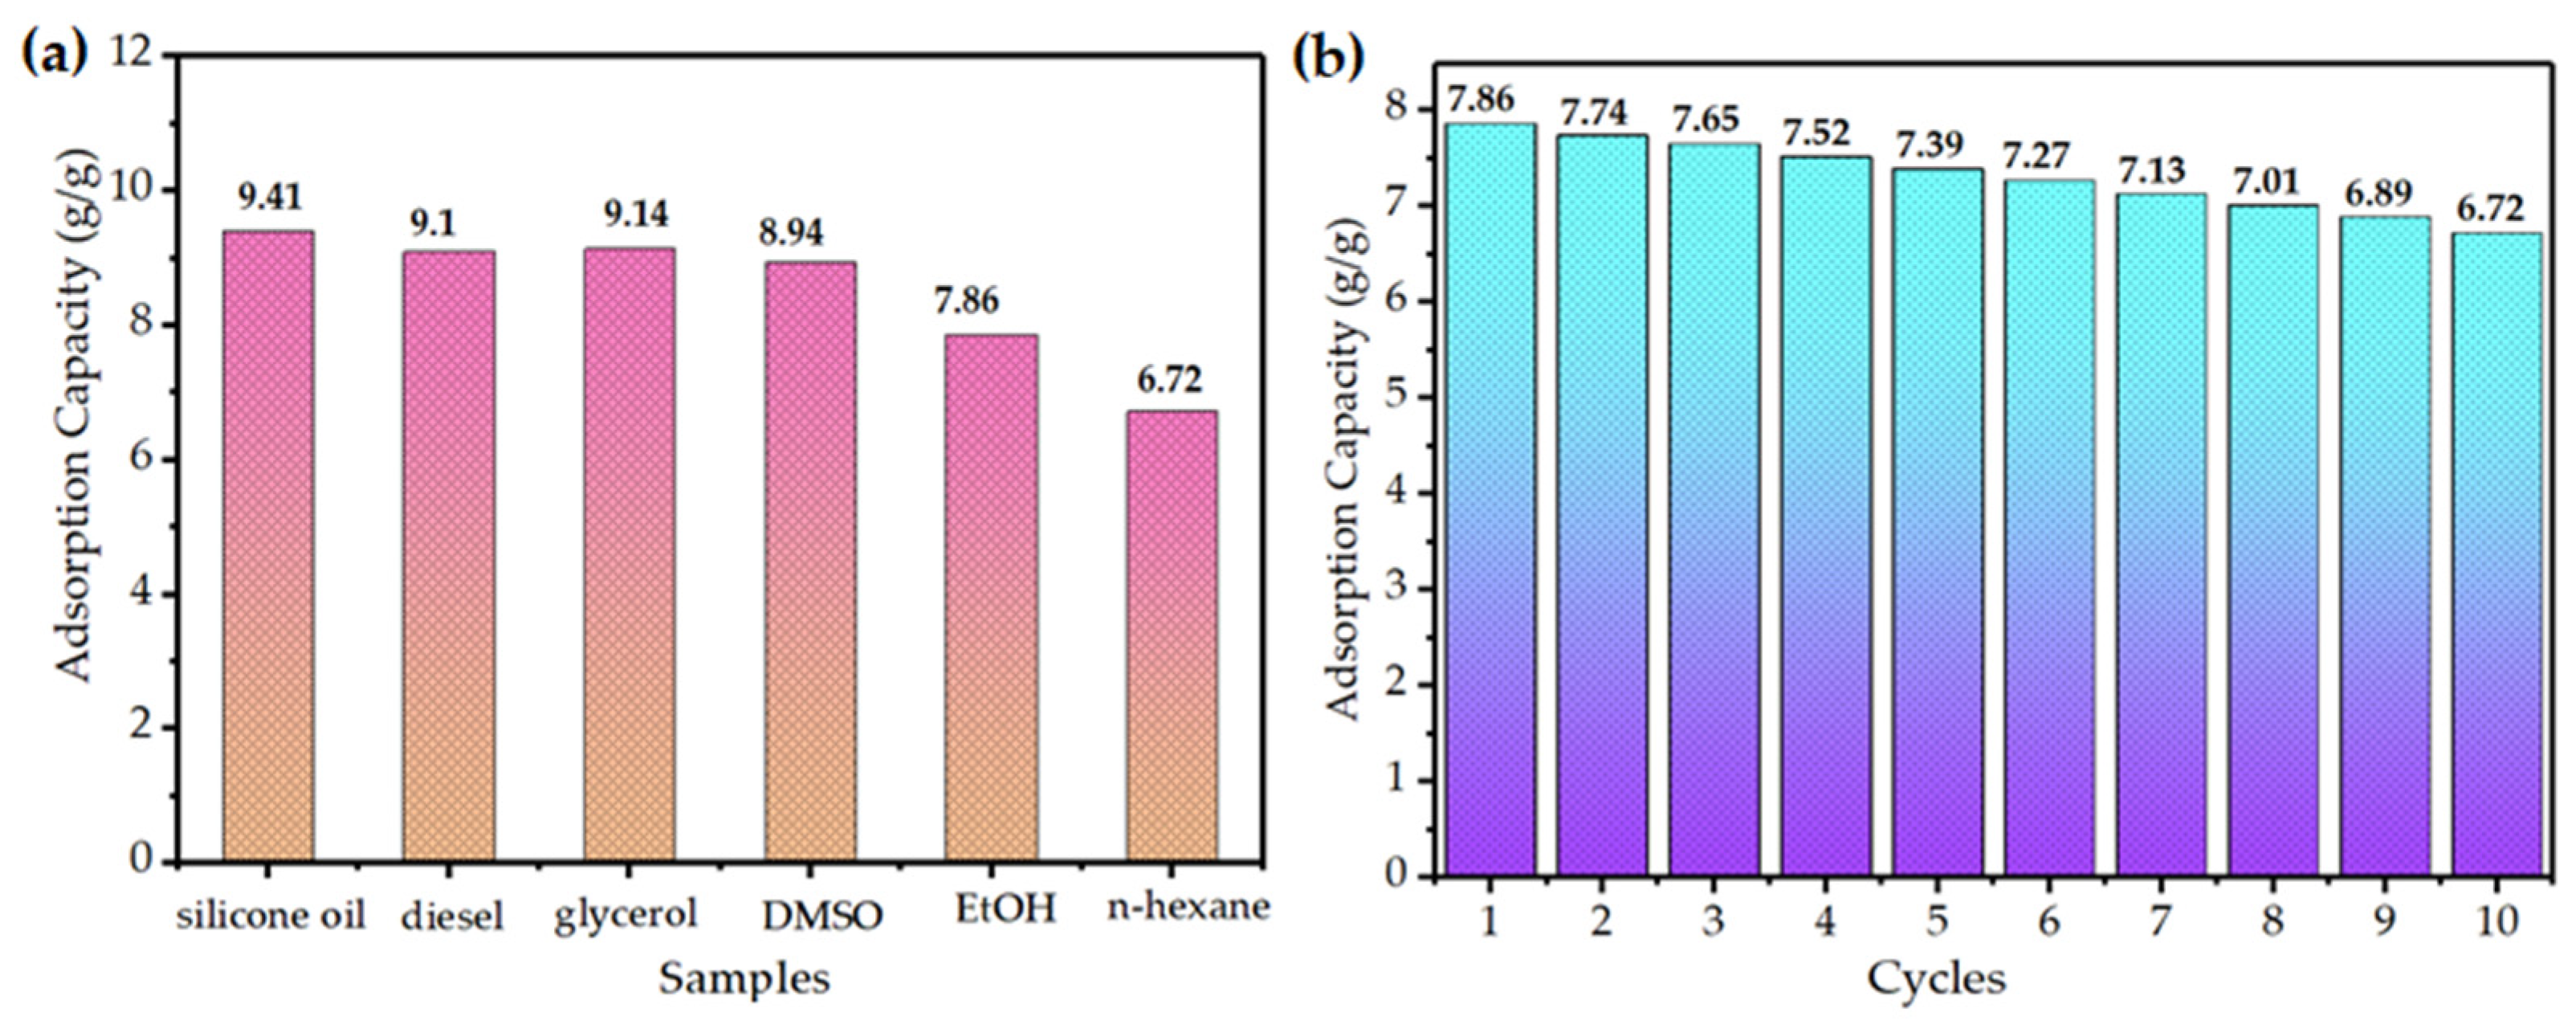
We further investigated the adsorption performance of SCAs on different organic solvents. Considering the viscosity and density of the organic solvents (Table S8), we used silicone oil, diesel oil, hexane, anhydrous ethanol, dimethylsulfoxide and propanetriol for the adsorption tests. It was found that SCAs have a large adsorption capacity for the above solvents and can adsorb organic solvents of 6.7−9.4 g/g (Figure 5a). Moreover, SCAs were tested for cycling efficiency in an anhydrous ethanol solution (Figure 5b). After 10 cycles, it still had a high adsorption efficiency of 6.72 g/g. The SCA adsorption efficiency remained at around 86% compared to the initial adsorption.

4. Conclusions

In this paper, SCAs were prepared successfully via sol–gel and freeze-drying methods. Hydrogen bonds are formed from the silica hydroxyl groups produced by partial hydrolysis and amino groups of chitosan, resulting in SCAs with a network structure. SCAs also overcome the disadvantages of pure SAs, which are prone to fracture and cracking. The thermal conductivity, specific surface area, pore volume and pore diameter of SCAs show a tendency to increase and then decrease with increasing chitosan content. SCAs have the lowest thermal conductivity (0.0369 W/m·K) when the ratio of aqueous sodium silicate and chitosan solution is 1:1. This is due to the presence of a large number of nanopores on the surface of SCA−1/1. The diameter of these nanoscale pores is smaller than the average free range of air molecules. The nanoscale pore size can severely restrict the free movement of molecules, thus giving SCA−1/1 a low thermal conductivity. In addition, SCA−1/1 is not only thermally stable and hydrophobic, but can also adsorb organic solvents such as silicone oil, n-hexane and propanetriol with a capacity of 6.7–9.4 g/g. After 10 cycles in anhydrous ethanol, SCAs still had an adsorption capacity of 6.72 g/g, indicating that SCAs have good adsorption cycling performance. The SCA, as a multifunctional material, is suitable for thermal insulation and adsorption.

Supplementary Materials

The following supporting information can be downloaded at: https://www.mdpi.com/article/10.3390/cryst13050755/s1, Figure S1: XRD patterns of SA and SCA; Figure S2: SEM images of SA with different SiO2 concentration: (a) 4 wt%, (b) 6 wt%, (c) 8 wt%, (d) 10 wt%, (e) 12 wt%; Figure S3: SEM images of CA: (a) CA−1, (b) CA−2, (c) CA−3, (d) CA−4; Figure S4: SEM images of SCA: (a) SCA−1/4, (b) SCA−1/2, (c) SCA−1/1, (d) SCA−2/1, (f) SCA−4/1; Figure S5: Density change of (a) SA, (b) CA; Figure S6: Porosity change of (a) SA, (b) CA; Figure S7: Variation of thermal conductivity: (a) SA, (b) CA; Figure S8: Schematic diagram of the thermal insulation test; Figure S9: Adsorption experiments of SCA materials on different solvents: (a-b) silicone oil, (c-d) hexane. Table S1: Density, thermal conductivity and porosity of SA; Table S2: Density, thermal conductivity and porosity of CA; Table S3: Density and thermal conductivity of SCA; Table S4: Comparison of calculated and measured density values for SCA; Table S5: Specific surface area and pore size distribution of SCA; Table S6: Comparison of calculated and measured values of pore volumes for SCA; Table S7: The comparison of thermal conductivity of SCA and previously reported materials; Table S8: Viscosity and density of different organic solvents; References [37,38,39,40,41] are cited in the supplementary materials.

Author Contributions

Conceptualization, S.L.,Y.L., Y.C. (Yaoyao Chen) and X.M.; Software, S.L.; Formal analysis, X.M. and S.L.; Investigation, Y.C. (Yaoyao Chen), X.H. and V.P.G.; Resources Y.L.; Data curation, X.M.; Supervision Y.L.; Writing—original draft preparation, Y.L., Y.C. (Yali Cao) and X.M.; Funding acquisition, Y.L.; Project administration, X.H. and Y.C. (Yali Cao). All authors have read and agreed to the published version of the manuscript.

Funding

This work was financially supported by the Kay Research and Development Project of Xinjiang Uygur Autonomous Region (No. 2020B02008) and the National Natural Science Foundation of China (No. 52100166).

Data Availability Statement

Data underlying the results presented in this paper are not publicly available at this time but may be obtained from the authors on reasonable request.

Conflicts of Interest

The authors declare no conflict of interest.

References

  1. Baetens, R.; Jelle, B.P.; Gustavsen, A. Aerogel insulation for building applications: A state-of-the-art review. Energy Build. 2011, 43, 761–769. [Google Scholar] [CrossRef]
  2. Yang, J.; Wu, H.; Xu, X.; Huang, G.; Xu, T.; Guo, S.; Liang, Y. Numerical and experimental study on the thermal performance of aerogel insulating panels for building energy efficiency. Renew. Energy 2019, 138, 445–457. [Google Scholar] [CrossRef]
  3. Wang, L.; Feng, J.; Jiang, Y.; Zhang, S.; Li, L.; Feng, J. Facile fabrication of hydrophobic polyvinylpolysilsesquioxane aerogels with improved optical properties. J. Sol-Gel Sci. Technol. 2020, 94, 88–97. [Google Scholar] [CrossRef]
  4. Štandeker, S.; Novak, Z.; Knez, Ž. Adsorption of toxic organic compounds from water with hydrophobic silica aerogels. J. Colloid Interface Sci. 2007, 310, 362–368. [Google Scholar] [CrossRef]
  5. Hayase, G.; Kanamori, K.; Maeno, A.; Kaji, H.; Nakanishi, K. Dynamic spring-back behavior in evaporative drying of polymethylsilsesquioxane monolithic gels for low-density transparent thermal superinsulators. J. Non-Cryst. Solids 2016, 434, 115–119. [Google Scholar] [CrossRef]
  6. Omranpour, H.; Motahari, S. Effects of processing conditions on silica aerogel during aging: Role of solvent, time and temperature. J. Non-Cryst. Solids 2013, 379, 7–11. [Google Scholar] [CrossRef]
  7. Chen, F.; Zhang, Y.; Liu, J.; Wang, X.; Chu, P.K.; Chu, B.; Zhang, N. Fly ash based lightweight wall materials incorporating expanded perlite/SiO2 aerogel composite: Towards low thermal conductivity. Constr. Build. Mater. 2020, 249, 118728. [Google Scholar] [CrossRef]
  8. Seo, J.; Bae, S.J.; Jang, D.I.; Park, S.; Yang, B.; Lee, H.K. Thermal behavior of alkali-activated fly ash/slag with the addition of an aerogel as an aggregate replacement. Cem. Concr. Compos. 2020, 106, 103462. [Google Scholar] [CrossRef]
  9. Long, E.; Zang, Z.; Ma, X. Are the energy conservation rates (RVRs) approximate in different cities for the same building with the same outer-wall thermal insulation measures. Build. Environ. 2005, 40, 537–544. [Google Scholar]
  10. Meng, X.; Yan, B.; Gao, Y.; Wang, J.; Zhang, W.; Long, E. Factors affecting the in situ measurement accuracy of the wall heat transfer coefficient using the heat flow meter method. Energy Build. 2015, 86, 754–765. [Google Scholar] [CrossRef]
  11. Zhao, F.; Zhu, J.; Peng, T.; Liu, H.; Ge, S.; Xie, H.; Xie, L.; Jiang, C. Preparation of functionalized halloysite reinforced polyimide composite aerogels with excellent thermal insu-lation properties. Appl. Clay Sci. 2021, 211, 160200. [Google Scholar] [CrossRef]
  12. Jung, S.B.; Park, S.W.; Yang, J.K.; Park, H.H.; Kim, H. Application of SiO2 aerogel film for interlayer dielectric on GaAs with a barrier of Si3N4. Thin Solid Film. 2004, 447–448, 580–585. [Google Scholar] [CrossRef]
  13. Liu, G.; Guo, Y.; Jian, Z.; Huang, M.; Zhao, T. Experimental Study on the Thermal Conductivity of Improved Graphite Composite Insulation Boards. Crystals 2023, 13, 102. [Google Scholar] [CrossRef]
  14. Joubert, F.; Musa, O.M.; Hodgson, D.R.W.; Cameron, N.R. The preparation of graft copolymers of cellulose and cellulose derivatives using ATRP under homogeneous reaction conditions. Chem. Soc. Rev. 2014, 43, 7217–7235. [Google Scholar] [CrossRef] [PubMed]
  15. Yoda, S.; Takeshita, S.; Ono, T.; Tada, R.; Ota, H. Development of a new silica aerogel-polypropylene foam composite as a highly flexible thermal insulation material. Front. Mater. 2021, 8, 2296–8016. [Google Scholar] [CrossRef]
  16. Kucharek, M.; MacRae, W.; Yang, L. Investigation of the effects of silica aerogel part icles on thermal and mechanical properties of epoxy composites. Compos. Part A 2020, 139, 106108. [Google Scholar] [CrossRef]
  17. Liu, C.; Wu, S.; Yang, Z.; Sun, H.; Zhu, Z.; Liang, W.; Li, A. Mechanically robust and flame-retardant silicon aerogel elastomers for thermal insulation and efficient solar steam generation. ACS Omega 2020, 5, 8638–8646. [Google Scholar] [CrossRef] [PubMed]
  18. Feng, J.; Le, D.; Nguyen, S.T.; Nien, V.T.C.; Jewell, D.; Duong, H.M. Silica cellulose hybrid aerogels for thermal and acoustic insulation applications. Colloids Surf. A 2016, 506, 298–305. [Google Scholar] [CrossRef]
  19. Jiang, S.; Zhang, M.; Li, M.; Liu, L.; Liu, L.F.; Yu, J. Cellulose nanofibril (CNF) based aerogels prepared by a facile process and the investigation of thermal insulation performance. Cellulose 2020, 27, 6217–6233. [Google Scholar] [CrossRef]
  20. Li, Z.; Cheng, X.; He, S.; Shi, X.; Gong, L.; Zhang, H. Aramid fibers reinforced silica aerogel composites with low thermal conductivity and improved mechanical performance. Compos. Part A 2016, 84, 316–325. [Google Scholar] [CrossRef]
  21. Alves, P.; Dias, D.A.; Pontinha, A.D.R. Silica Aerogel-Rubber Composite: A Sustainable Alternative for Buildings’ Thermal Insulation. Molecules 2022, 27, 7127. [Google Scholar] [CrossRef]
  22. Hamdan, H.; Halim, Z.A.A.; Ahmad, N.; Yajid, M.A.M. Thermal insulation performance of silicone rubber/silica aerogel composite. Mater. Chem. Phys. 2022, 276, 125359. [Google Scholar]
  23. Merillas, B.; Lamy-Mendes, A.; Villafañe, F.; Durães, L.; Rodríguez-Pérez, M.Á. Polyurethane foam scaffold for silica aerogels: Effect of cell size on the mechanical properties and thermal insulation. Mater. Today Chem. 2022, 26, 101257. [Google Scholar] [CrossRef]
  24. Merillas, B.; Lamy-Mendes, A.; Villafañe, F.; Durães, L.; Rodríguez-Pérez, M.Á. Silica-Based Aerogel Composites Reinforced with Reticulated Polyurethane Foams: Thermal and Mechanical Properties. Gels 2022, 8, 392. [Google Scholar] [CrossRef]
  25. Linhares, T.; Amorim, M.T.P.; Durães, L. Silica aerogel composites with embedded fibres: A review on their preparation, properties and applications. J. Mater. Chem. 2019, 7, 22768–22802. [Google Scholar] [CrossRef]
  26. Xiao, W.; Wang, P.; Song, X.; Liao, B.; Yan, K.; Zhang, J. Facile fabrication of anisotropic chitosan aerogel with hydrophobicity and thermal superinsulation for advanced thermal management. ACS Sustain. Chem. Eng. 2021, 9, 9348–9357. [Google Scholar] [CrossRef]
  27. Cui, H.; Wu, N.; Ma, X.; Niu, F. Superior intrinsic flame-retardant phosphorylated chitosan aerogel as fully sustainable thermal insulation bio-based material. Polym. Degrad. Stab. 2023, 207, 110213. [Google Scholar] [CrossRef]
  28. Zhang, M.; Jiang, S.; Han, F.; Li, M.; Wang, N.; Liu, L. Anisotropic cellulose nanofiber/chitosan aerogel with thermal management and oil absorption properties. Carbohyd. Polym. 2021, 264, 0144–8617. [Google Scholar] [CrossRef] [PubMed]
  29. Tang, Q.; Qiu, C.; Zhang, Y.; Zhang, X.; Yuan, Z.; Tan, H.; Wang, L.; de Hoop, C.F.; Qi, J.; Huang, X. Effective Adsorption of Diclofenac Sodium from Wastewater by Nanocellulose/Alum/Chitosan/Polyethyleneimine Biohybrid Aerogel Beads Adsorbent. J. Polym. Environ. 2023, 31, 1129–1143. [Google Scholar] [CrossRef]
  30. Zhang, W.; Huang, T.; Ren, Y.; Yang, S.; Zhao, X.; Yuan, M.; Wang, J.; Tu, Q. A multifunctional chitosan composite aerogel for PPCPs adsorption. Carbohydr. Polym. 2022, 298, 120102. [Google Scholar] [CrossRef]
  31. Guo, Q.; Amendola, E.; Lavorgna, M.; Li, Z.; Feng, H.; Wu, Y.; Fei, G.; Wang, Z.; Xia, H. Robust and recyclable graphene/chitosan composite aerogel microspheres for adsorption of oil pollutants from water. Carbohydr. Polym. 2022, 290, 119416. [Google Scholar] [CrossRef] [PubMed]
  32. Jaxel, J.; Markevicius, G.; Rigacci, A.; Budtova, T. Thermal superinsulating silica aerogels reinforced with short man-made cellulose fibers. Compos. Part A 2014, 103, 113–121. [Google Scholar] [CrossRef]
  33. Appostolopoulou-Kalkavoura, V.; Munier, P.; Bergström, L. Thermally insulating nanocellulose-based materials. Adv. Mate. 2021, 33, 20001839. [Google Scholar] [CrossRef] [PubMed]
  34. Zhang, Z.; Wang, X.; Shen, J. Effect of organic-inorganic crosslinking degree on mechanical and thermal properties of aerogel skeleton. Inorg. Mate. 2020, 35, 454–460. [Google Scholar]
  35. Hamann, T.W.; Martinson, A.B.F.; Elam, J.W.; Elam, J.W.; Pellin, M.J.; Hupp, J.T. Atomic layer deposition of TiO2 on aerogel templates: New photoanodes for dye-sensitized solar cells. J. Phys. Chem. 2008, 112, 10303–10307. [Google Scholar] [CrossRef]
  36. Lou, F.; Dong, S.; Zhu, K.; Chen, X.; Ma, Y. Thermal Insulation Performance of Aerogel Nano-Porous Materials: Characterization and Test Methods. Gels 2023, 9, 220. [Google Scholar] [CrossRef]
  37. Liu, Y.; Chen, Z.; Zhang, J.; Ai, S.; Tang, H. Ultralight and thermal insulation carbon foam/SiO2 aerogel composites. J. Porous Mater. 2019, 26, 1305–1312. [Google Scholar] [CrossRef]
  38. Chen, Y.X.; Klima, K.m.; Brouwers, H.j.H.; Yu, Q. Effect of silica aerogel on thermal insulation and acoustic absorption of geopolymer foma composites: The role of aerogel particle size. Composites Part B 2022, 242, 110048. [Google Scholar] [CrossRef]
  39. Yan, K.; Zhang, Z.; Liu, Y.; Li, S.; Chen, D.; Li, Z. Superhydrophobic tough hierarchical porous thermal insulation composites prepared by in situ formation. J. Appl. Polym. Sci. 2022, 139, 52806. [Google Scholar]
  40. Laskowski, J.; Milow, B.; Ratke, L. Aeerogel-aerogel composites for normal temperature range thermal insulation. J. Non-Cryst. Solids. 2016, 441, 42–48. [Google Scholar] [CrossRef]
  41. Wei, G.; Liu, Y.; Zhang, X.; Yu, F.; Du, X. Thermal conductivities study on silica aerogel and its composite insulation materials. Int. J. Heat Mass Transfer. 2011, 54, 2355–2366. [Google Scholar] [CrossRef]
Figure 1. (a) Schematic illustration of preparation of SCAs; micrograph of (b) SA, (c) CA and (d) SCA; and SEM images of (e) SA-6 wt%; (f) CA-1 and (g) SCA-1/1.
Crystals 13 00755 g001
Figure 2. (a) Density change in SCA; (bf) N2 adsorption–desorption curves and pore size distributions of SCA: (b) SCA−1/4; (c) SCA−1/2; (d) SCA−1/1; (e) SCA−2/1; and (f) SCA−4/1.
Crystals 13 00755 g002
Figure 3. (a) Thermal conductivity of SCAs; (b,c) infrared photos of heat insulation at 50 °C; (c,d) infrared photos of heat insulation at 100 °C; and (e,f) differential thermal analysis and thermogravimetric curves of SCAs.
Crystals 13 00755 g003
Figure 4. (a) Infrared spectra of SAs, CAs and SCAs; (b) Water contact angle of SCAs.
Crystals 13 00755 g004
Figure 5. (a) Adsorption of SCA materials in different organic solvents; (b) Recyclability of SCAs in ethanol solvent.
Crystals 13 00755 g005
Disclaimer/Publisher’s Note: The statements, opinions and data contained in all publications are solely those of the individual author(s) and contributor(s) and not of MDPI and/or the editor(s). MDPI and/or the editor(s) disclaim responsibility for any injury to people or property resulting from any ideas, methods, instructions or products referred to in the content.