Article

Mechanochemically Synthesized Solid Solutions La1−xCexFeO3+x/2 for Activation of Peroxydisulfate in Catalytical Reaction for Tetracycline Degradation

1
Department of Inorganic Chemistry, Faculty of Chemistry and Pharmacy, University of Sofia, 1164 Sofia, Bulgaria
2
Institute of Physical Chemistry, Bulgarian Academy of Sciences, 1113 Sofia, Bulgaria
3
Institute of General and Inorganic Chemistry, Acad. G. Bonchev, 1113 Sofia, Bulgaria
*
Author to whom correspondence should be addressed.
Crystals 2023, 13(5), 769; https://doi.org/10.3390/cryst13050769
Submission received: 5 April 2023 / Revised: 28 April 2023 / Accepted: 30 April 2023 / Published: 5 May 2023
(This article belongs to the Special Issue Rare Earths-Doped Materials (Volume II))

Abstract

:
The synthesis of orthoferrites of the type La1−xCexFeO3+x/2, x = 0.00, 0.01, 0.03, 0.05, and 0.07, by applying a simple and effective mechanochemical transformation from the constituent oxides is presented. Physicochemical methods such as powder X-ray diffraction (XRD), transmission electron microscopy (TEM), UV–Vis spectroscopy, and Brunauer–Emmett–Teller (BET) adsorption were applied to gain information about the effect of Ce4+ content on the structural, textural, and optical properties of the samples. The catalytic activity of the samples for water decontamination was determined in a photo-Fenton-like activation of persulfate for removal of tetracycline hydrochloride as model pollutant. The presence of persulfate, PDS, considerably increased the removal efficiency under visible light illumination.

1. Introduction

The well-known and exploited methods for purification of waters, polluted by organic molecules, are based on physical [1], biological [2,3], and chemical [4] processes. Some of the oxidation processes apply oxidants such as peroxymonosulfate (PMS, SO52−) and peroxydisulfate (PDS, S2O82−). They both produce sulfate radicals with high redox potential (2.6–3.1 V), capable of functioning in solutions with a wide range of pH, with long lifetimes in comparison with the hydroxyl radical [5]. In spite of the fact that PMS and PDS are oxidants, their reaction with contaminants is not possible, which is why an activation by a catalyst is needed, such as semiconductor, for example [6]. The metal-based catalysts for activation of PDS, as well as PMS, are considered cost-effective, requiring less energy, and relevant for application in both homogeneous and heterogeneous systems [6]. The activation involves a series of oxidizing processes through breaking the O–O bond [2]. Because PMS/PDS in water environments degrade slowly, they are tested for in situ degradation of contaminants in soil and groundwaters [5].
Some of the metal-based materials investigated for PMS and PDS activation are catalysts, containing iron [6,7,8,9]. Among them is the lanthanum orthoferrite, LaFeO3, belonging to the group of the transition metal oxides with a formula ABO3, where A is a rare-earth ion with 12 as a coordination number and B is a 3d transition metal with coordination number of 6, a p-type semiconductor with electrical and magnetic properties [10]. The LaFeO3 shows visible-light-absorption properties with a value of the band gap depending on the method for synthesis, for example, 1.98 eV by combustion method [10], about 2.0 eV by melt-growing in a floating zone furnace [11], 2.07 eV by sol–gel route under ultrasonic treatment [12], and 2.15–2.30 eV by microwave plasma and calcination [13].
For synthesis of LaFeO3, different methods based on simple and efficient chemical reactions have been tested, such as thermal decomposition of lanthanum ferrioxalate precursor [14], polymerizable complex method [15], and autocombustion synthesis [16,17]; some of them are reviewed in [18]. In addition, it was found that the perovskite structure of LaFeO3 can be modified by different doping ions; by varying both the nature and the content of the doping agent, the properties of the final product can be modified and controlled [19,20]. The doping ions could occupy A or B site of LaFeO3 so the modification of the properties depends on the dopant [21]. In order to synthesize LaFeO3-based perovskite solid solutions, different ions have been tested, such as Gd(III) by solid casting route [22], Cu(II) by sol–gel method [23], Ga(III) and Al(III) by polymerization complex [24,25], and Ca(II) by citrate method [26]. Calcination at 500 °C was included in the procedure of the microemulsion method for La1−xTbxFeO3 preparation [27]. By the combination of hydrothermal and mechanochemical procedures, Ru3+-doped LaFeO3 with the Ru3+ ions substituting Fe3+ ions at the octahedral sites of the perovskite structure was prepared [28]. Modification of LaFeO3 with Ce3+ by solution combustion and coprecipitation method showed that the solution combustion method generated better impact on the physicochemical properties of Ce-doped LaFeO3 nanoparticles than the coprecipitation method [29,30]. Both the combustion and the coprecipitation method need time- and energy-consuming calcination for synthesis of Ce-doped LaFeO3, 500 °C for 5 h and 700 °C for 4 h, respectively [30]. It is important to mention that under the conditions reported in [30], Ce3+ should be oxidized to Ce4+, according to [31]. By calcination at 850 °C, substitution of La3+ by Ce4+ in LaFeO3 was accomplished [32]. According [29,30,32], an improvement of the structural, morphological, magnetic, and catalytic properties of materials based on LaFeO3 could be accomplished by modification with cerium ions.
The mechanochemical ball-milling is a method considered suitable for synthesis of AFeO3 (A = La, Pr, Nd, Sm), tested as catalysts [33]. It is reported as a synthetic method in a wide range of applications, especially taking into account that the method is leading to cleaner, safer, and more efficient chemical conversion [1,33]. Besides the advantages mentioned, the method could reduce the particle size of materials and create more defects and vacancies in the crystal lattice of materials [34]. The latter are considered especially important for photocatalysts because of their capability to limit the electron–hole recombination and react as reaction sites [35]. By decreasing particle size, increasing surface area with active sites, and modifying the morphology, the method could promote the Fe3+/Fe2+ conversion in Fenton- and Fenton-like reactions [36,37]. The mechanochemical ball-milling is considered suitable for synthesis of catalysts for water purification because it could cause surface activation of the materials, leading to increasing the reactive species in water, increasing the active sites, and increasing the pollutant absorption [36].
In the work presented, the influence of Ce4+ on the structure and properties of LaFeO3 was investigated by studying solid solutions La1−xCexFeO3+x/2, which were mechanochemically synthesized by the initial oxides (x = 0.00, 0.01, 0.03, 0.05, and 0.07). Cerium was used as a dopant due to its existence in two stable oxidation states Ce3+/Ce4+ [31], with a possibility to be an advantage for the activity of the solid solutions La1−xCexFeO3+x/2 in a reaction for activation of PDS. In spite of the immense number of iron-based catalysts for activation of PDS, research on Ce–modified LaFeO3 is not found in the literature available. Tetracycline hydrochloride is among the most widely used antibiotics [38]; at the same time, it is one of the common antibiotic pollutants [39], known to cause environmental problems by its biological toxicity, chemical stability, and stimulation of antibiotic resistance genes [40,41]. It was selected as the model pollutant in water solution and its degradation by catalytic reaction is a part of the discussion presented.

2. Materials and Methods

2.1. Materials

The chemicals used were La2O3 (≥99.9%, Sigma-Aldrich Chemie GmbH, Taufkirchen, Germany), CeO2 (≥99.0%, Sigma-Aldrich Chemie GmbH, Taufkirchen, Germany), FeOOH (p.a., Valerus, Bulgaria), Tetracycline hydrochloride (Ficher BioReagents, Waltham, MA, USA), K2S2O8 (ACS reagent, ≥99.0%, Sigma-Aldrich Chemie GmbH, Taufkirchen, Germany), and Na2S2O3 (99%, Sigma-Aldrich, Sigma-Aldrich Chemie GmbH, Taufkirchen, Germany). The scavengers NaN3(≥99.0%, Honeywell, Charlotte, NC, USA), tret-butanol (ACS reagent, ≥99.0%, Sigma-Aldrich Chemie GmbH, Taufkirchen, Germany), ascorbic acid (ACS reagent, ≥99.0%, Sigma-Aldrich Chemie GmbH, Taufkirchen, Germany), and methanol (ACS reagent, ≥99.8%, Riedel-de Haën, Charlotte, NC, USA) were used as well as Na2S2O3(ReagentPlus®, 99.0%, Sigma-Aldrich Chemie GmbH, Taufkirchen, Germany)as a quencher. Concentration of the scavenger solutions was kept constant for every scavenger and it was in great excess to the persulfate, namely, 100 mM.

2.2. Mechanochemical Synthesis of the Samples

The synthesis of LaFeO3 can be represented by the simple equation La2O3 + Fe2O3 → 2LaFeO3. The oxide La2O3 was first calcined at 900 °C for 12 h in order to remove hydroxide and carbonate phases occasionally included in the sample. The Fe2O3 was obtained from dehydrated FeOOH at 200 °C for 6 h. The oxides were mixed and homogenized by hand-grinding followed by addition of 0.03 g stearic acid (1 mass.% of the reaction mixture), playing the role of the surfactant. The mixture was placed in a planetary ball-mill (FRITSCH Pulverisette 7) with zirconia vials (45 mL) and balls (10 mm) for 4 h at 700 rpm at BPR 10:1. The milling protocol was 5 min of milling followed by 10 min of rest rolling orientation changing every rest cycle.
The synthesis of La1−xCexFeO3+x/2 can be represented by the simple equation
(1 − x)La2O3 + Fe2O3 +2xCeO2 → 2 La1−xCexFeO3+x/2.
The calculated amount of CeO2 was added so that La1−xCexFeO3+x/2 could be obtained, where x = 0.00, 0.01, 0.03, 0.05, 0.07. The samples obtained, LaFeO3, La0.99Ce0.01FeO3+x/2, La0.97Ce0.03FeO3+x/2, La0.95Ce0.05FeO3+x/2, and La0.93Ce0.07FeO3+x/2, were characterized and used in catalytic reactions for tetracycline hydrochloride degradation.
A mixture of the initial oxides, La2O3, Fe2O3, and CeO2 (in amount, calculated for La0.93Ce0.07FeO3+x/2), was treated for 2 h by ball-milling using the same milling protocol in order to gain information about the milling time influence on the samples’ formation.

2.3. Methods for Characterization

X-ray diffraction, used to determine the crystal structure of the samples, was performed using a PANalytical Empyrean X-ray diffractometer(Malvern PANalytical Empyrean, Almelo, Netherlands) in the 2θ range of 15–80° by CuKα radiation (λ = 0.15405 nm), with steps of 0.01° and 20 s exposure time at each step. The structural and microstructural (crystallite size and microstrains) information was extracted using the full profile Rietveld method using the FullProf Suite software (v01-2021, Grenoble, France) [42].
UV–Vis absorption spectroscopy was applied using an Evolution 300 UV–Vis spectrometer (Thermo Scientific, Waltham, MA, USA) for measuring the absorption of the samples in the range of 200–900 nm.
Band gap energies were calculated from the UV–Vis absorption spectra in the range 200 to 400 nm. The UV–Vis data were analyzed for the relation between the optical band gap, absorption coefficient, and energy (hν) of the incident photon for near-edge optical absorption in semiconductors. The band gap energy was calculated using the measured curves by fits according to Tauc’s equation, αhν = A(hν − Eg)n/2 [43], where A is a constant independent of hν, Eg is the semiconductor band gap, and n depends on the type of transition. The value used for n was 2, reflecting an indirect transition.
Textural characteristics, such as specific surface area, total pore volume, and pore size distribution, were determined at −196 °C using a TriStar II 3020 apparatus (Micromeritics, Norcross, GA, USA). The Brunauer–Emmett–Teller (BET) method was applied for specific surface area calculations. The pore size distributions were derived from the desorption branch of the isotherms employing the Barrett–Joyner–Halenda (BJH) method. The total pore volume was estimated at a relative pressure of 0.989.

2.4. Tetracycline Hydrochloride (TCH) Degradation

A model solution of TCH with concentration 20 ppm and a volume of 200 mL was used. A double-jacked Pyrex reactor was used, similar to one used by us earlier. After adding 0.1 g catalyst, a 60 min ”dark” period was followed in order to establish the equilibrium of the sorption process. After 68 mg K2S2O8 was added to the solution (concentration of 1 mM to the total volume), it was illuminated by a Schott KL-2500 LED, emitting 5600 K cold light with light intensity of 1100 mL, immersed into the reaction vessel. A sample of 2.5 mL was taken and filtered through a 0.22 µm membrane filter to remove the catalyst, and 150 µL 0.05 M solution of Na2S2O3 was added to quench the reaction. The concentration of TCH was determined by UV/Vis absorption spectroscopy, monitoring the peak at 354 nm. The data obtained were plotted in coordinates (C/C0)/t and −ln(C/C0)/t (where C0 is the concentration after the “dark” period, and C is the concentration after t min irradiation), and apparent rate constants of the degradation process were determined assuming first-order kinetics. The degradation at moment t is determined by the formula degradation, % = (A0 − At)/A0 × 100, where A0 is the initial absorption of the TCH solutions at t = 0 min and At is the absorption at t min.

3. Results

3.1. Characterization of the Samples

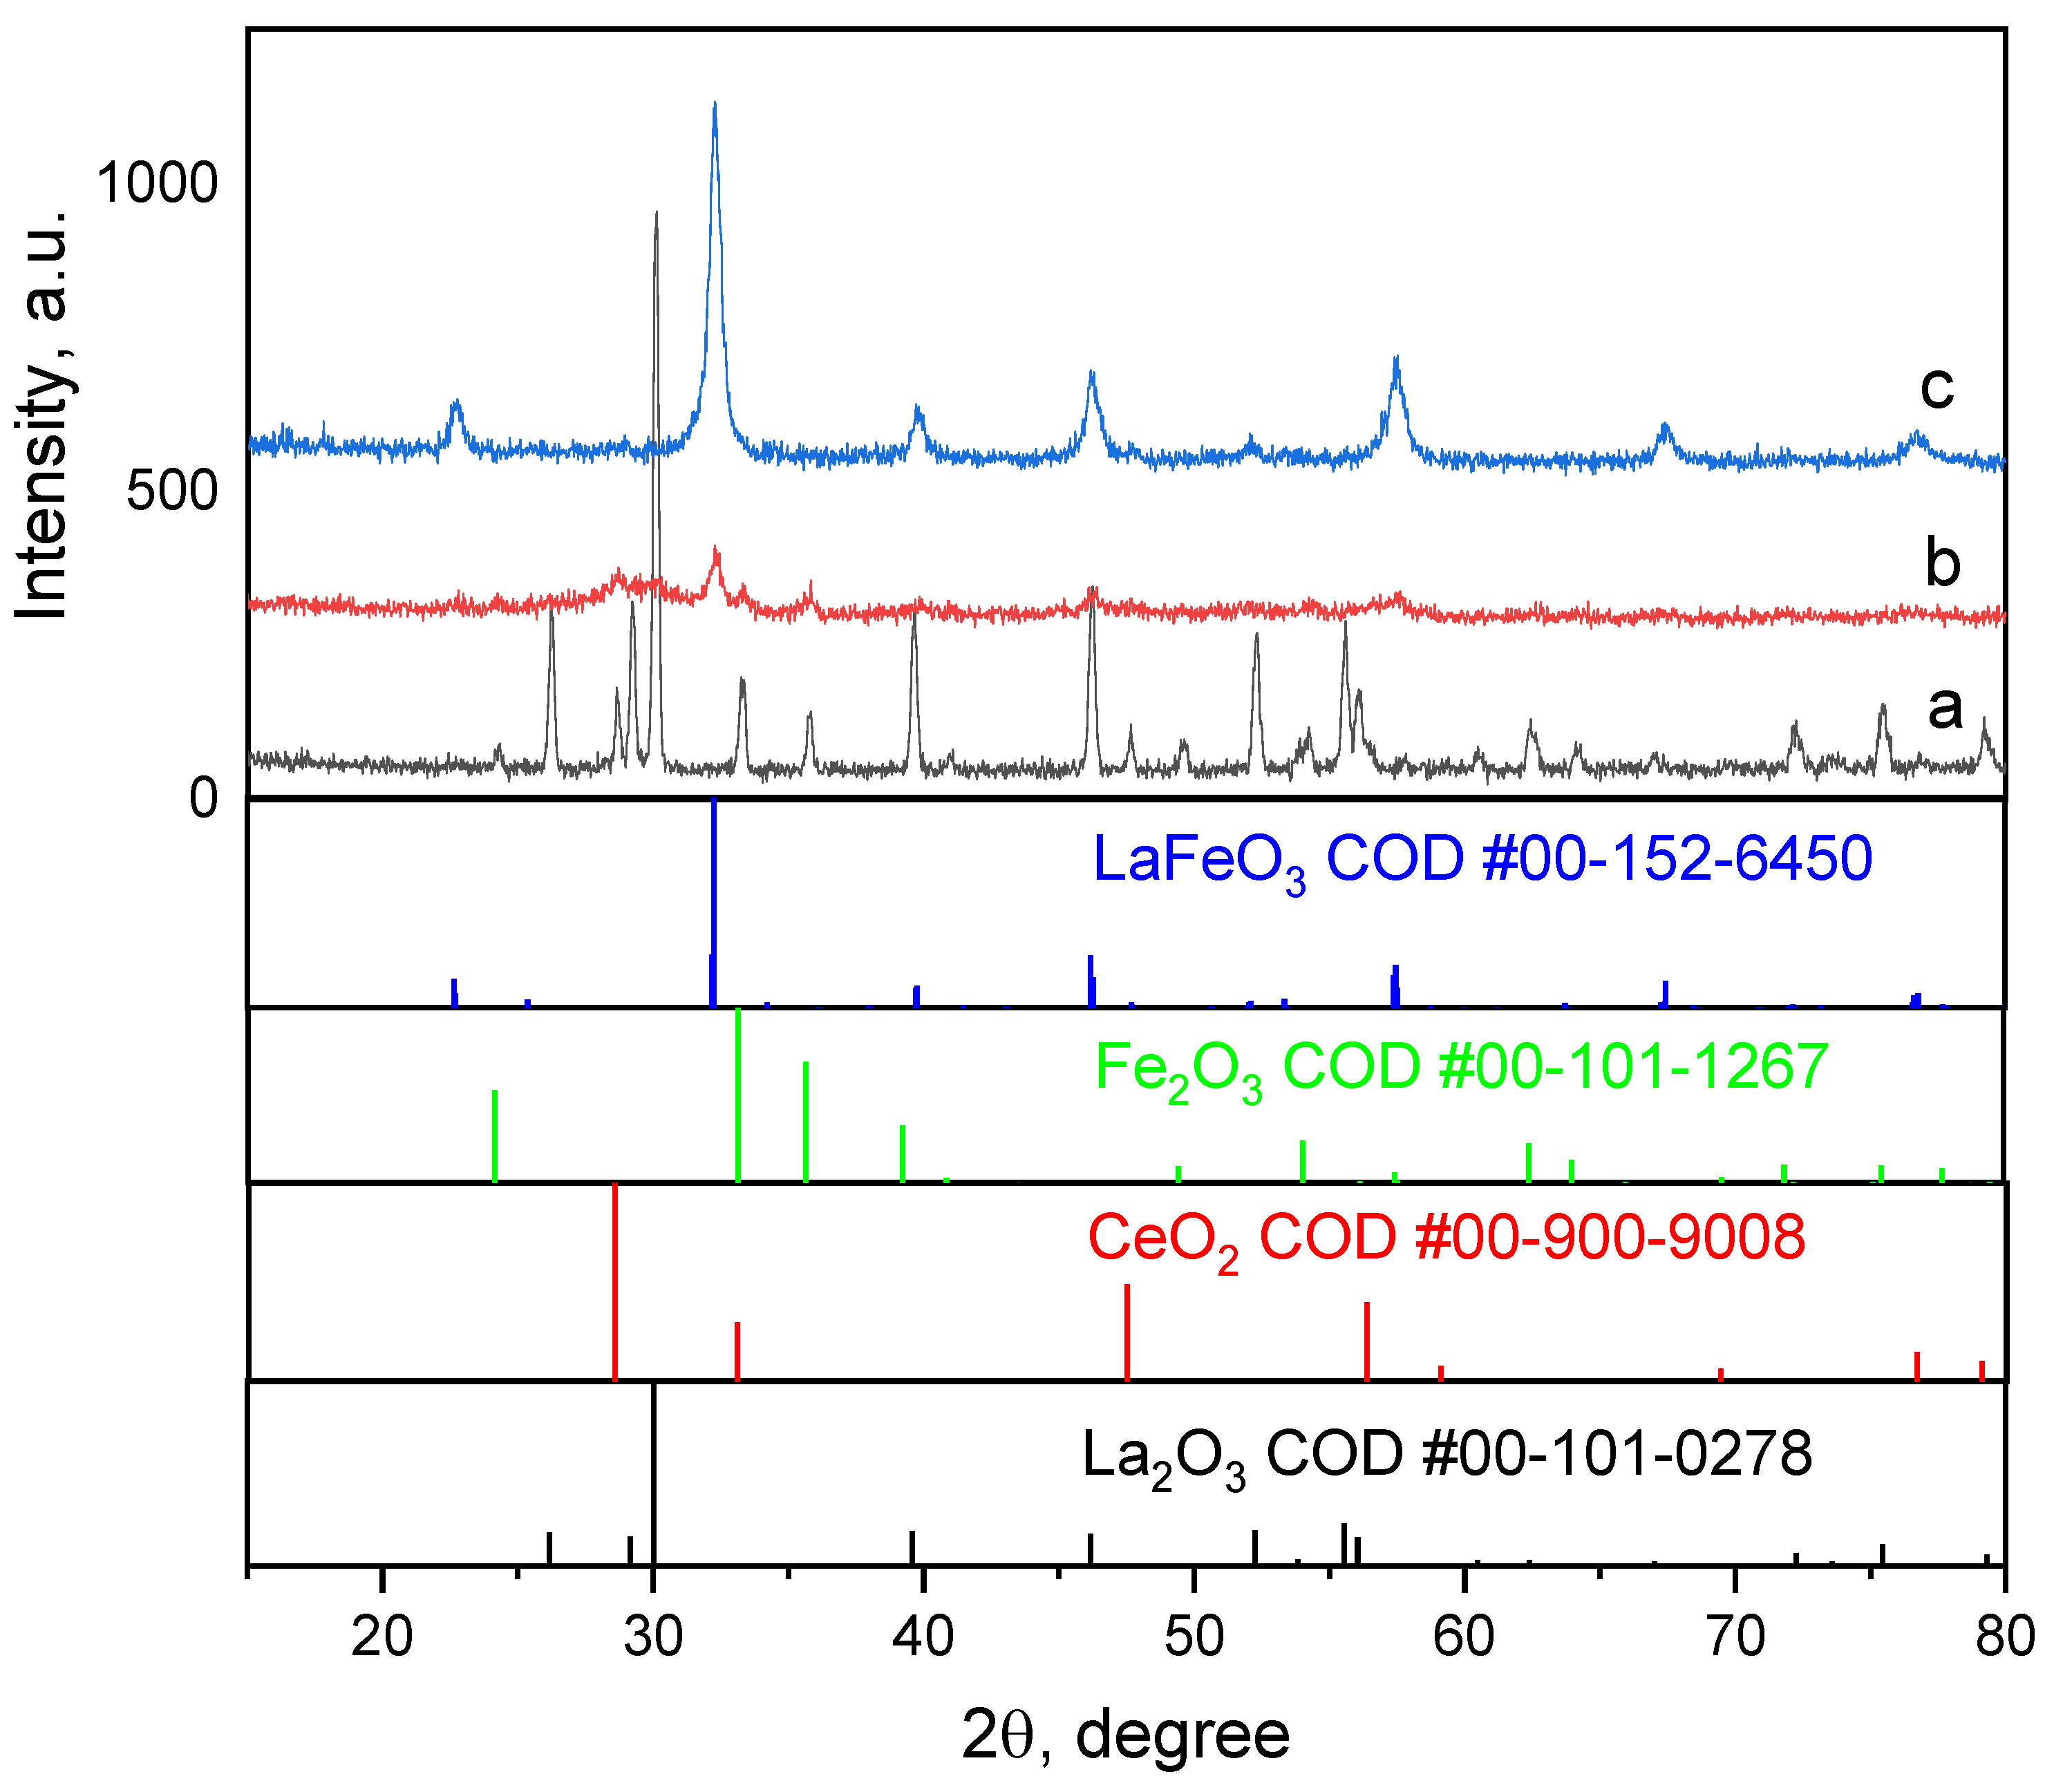
3.1.1. Phase Homogeneity

The XRD patterns of the mixture of the initial La2O3, Fe2O3, and CeO2 (calculated for 7% Ce) before ball-milling, as well as after 2 and 4 h of ball-milling, were recorded (Figure 1). In order to follow the changes, literature data for the XRD of the pure initial oxides as well as for LaFeO3 are included in Figure 1. As can be seen, the two most intense diffraction reflexes for CeO2, namely, (111) and (220), at 28.5° and 47.8° 2θ, respectively, are well visible in the mixture before milling (Figure 1a). After 2 h of high-energy ball-milling, a significant size reduction of the starting oxides occurs, leading to increased peak broadening, but the (111) reflex of CeO2 is still clearly visible (Figure 1b). In addition, the (112) diffraction peak of the orthorhombic LaFeO3 is well expressed in the XRD of the 4 h ball-milling sample, indicating the crystallization of the material (Figure 1c). Based on these XRD data, the reaction mechanism can be briefly commented as involving a significant size reduction (even amorphization) of the starting oxides, followed by crystallization of the targeted material.
All the samples crystallized in the typical for LaFeO3 orthorhombic Pbnm crystal group (ICDD #74–2203), shown by the comparison of the samples’ XRD diffractograms (Figure 2). No additional reflexes were observed of nonreacted oxides, which proves the successful synthesis of the homogeneous solid solutions.
The results of the Rietveld refinement are presented in Figure 3a–f, and summarized in Table 1. As can be seen (Figure 3a–e), the solid solutions show some intensity peaks deviation in Rietveld refinement for the diffraction at 32° 2θ as Ce4+ content increases. The deviation is due to not releasing the oxygen occupancy. Rietveld refinement with an oxygen occupancy freely refined is shown in Figure 3f. The same procedure was applied for the other samples with different Ce4+ content. The values of all samples, although being different, are within the standard deviation. Considering the high background level (due to fluorescence of the Fe under CuKα radiation) and the high degree of microstructural effects (low crystallites size), which can all cause deviation of observed peaks intensity, the values of the oxygen content purely based on the Rietveld refinement of the samples are not reported.
The addition of cerium does not lead to any meaningful changes to the unit cell parameter, which is somehow expected considering the similar ionic radii of La3+ and Ce4+, 1.03 Å and 0.87 Å, for lanthanum and cerium, respectively, with coordination number of 6 [44]. Despite that, the introduction of cerium leads to increased crystallites size, which could be attributed to the stabilization of the orthorhombic phase with the introduction of the smaller Ce4+ ion. The latter leads to a lower value of the theoretical perovskite tolerance factor of 0.85 compared to the 0.87 for the pure CeFeO3 and LaFeO3, respectively. This causes the lower value of the microstrains and dislocation density and therefore lowers the defects concentration, which facilitates the crystal growth (Table 1).

3.1.2. Morphology of the Samples

The TEM images of the plain LaFeO3 (Figure 4a) and of the sample with highest Ce content La0.93Ce0.07FeO3+x/2 (Figure 4b) show samples made up of agglomerates of irregular-shaped crystallites with size between 10 and 20 nm. This is consistent with the XRD analysis. The calculated d-spacing from both SAED and HRTEM shows that the incorporation of Ce does not lead to any changes of the unit cell parameters. The values for d-spacing are integrated in the images in Figure 4a–d.

3.1.3. Textural Characteristics of the Samples

The adsorption/desorption isotherm of the host perovskite matrix of LaFeO3 is of type II according to IUPAC classification with hysteresis loop type H3, showing the prepared material is nonporous or macroporous with nonrigid aggregates of plate-like particles (Figure 5). The introduction of small quantities of Ce4+ to the host changes neither the type of isotherm nor the hysteresis type, and preserves the structure of the materials. However, the increased Ce4+ concentration tends to slightly decrease the specific surface area as well as the total pore volume of the prepared perovskites (Table 2). This result corresponds well with the data obtained from the XRD, which show increased crystallite size of the Ce-modified samples in comparison to the bare LaFeO3. With regard to the SSA, LaFeO3 is known for its low values of the specific surface area of bulk material [18]. The value of 9 m2/g for the mechanochemically synthesized LaFeO3 is similar to the sol–gel method synthesized 9.5 m2/g [12]. In spite of the attempt to increase the SSA by doping LaFeO3 with Ce4+, we did not gain any essential improvement; the values obtained were 7–9 m2/g.
The average pore size for the samples LaFeO3, La0.99Ce0.01FeO3+x/2, La0.97Ce0.03FeO3+x/2, and La0.95Ce0.05FeO3+x/2 has an equal value, while that of La0.93Ce0.07FeO3+x/2 is a bit smaller (Table 2). The maximum in the pore size distribution is at about 30–40 nm (Figure 5b).

3.1.4. UV/Vis Spectroscopy

The absorption spectra of the samples are predominantly in the visible region, absorbing up to about 550 nm which is the green color of the visible light (Figure 6). Based on these UV/Vis spectra, the band gap energy Eg was calculated after Tauc equation [43] for all the samples (Table 3). The values for the band gap energy of the solid solutions La0.99Ce0.01FeO3+x/2, La0.97Ce0.03FeO3+x/2, La0.95Ce0.05FeO3+x/2, and La0.93Ce0.07FeO3+x/2 are in the range 2.36–2.39 eV (corresponding to 524–520 nm), which is a bit higher than the value for the pure LaFeO3, 2.32 eV (corresponding to 533 nm). A similar tendency of the band gap to increase with increasing Ce content is observed for La1−xCexFeO3 obtained by solid-state reaction of the oxides, namely, from 2.22 to 2.41 eV [45].
The values of Eg for the solid solutions change insignificantly with the Ce4+ addition, and the corresponding wavelengths 524–520 nm clearly illustrate that they are exactly in the visible range of the light. They prove that the solid solutions are capable to act as photocatalysts under visible light illumination, similar to the LaFeO3 itself.
The potentials of current band (CB) and valence band (VB), ECB = X − 4.5 − 0.5Eg and EVB = ECB + Eg, are calculated, where Eg is the band gap energy and X is the absolute electronegativity of the material (Table 3). The energy of the free electrons on the hydrogen scale E0 of 4.5 eV is used in the potentials calculations [46]. The results for potentials show positive valence band, which is similar to the literature data [18]. The negative value for the CB for the pure LaFeO3, −0.11 eV, differs from the literature data (positive 0.2 eV [18]), quite likely because of the difference in the synthesis procedure. The values for the solid solutions are close to those of the pure LaFeO3, 2.23–2.24 eV for VB; those for CB are also negative, varying between −0.13 to −0.15 eV. The refractive index (Table 3) is calculated by the modification of the Dimitrov–Sakka equation [47]:
n = 3 E g / 20 ) 2
where n is the refractive index and Eg is the band gap energy calculated after Tauc equation [43]. Considering the refractive index of the samples, the pure LaFeO3 with a higher value is optically denser, possessing lower absorbance.

3.2. Catalytic Decomposition of TCH

The results demonstrate that all the solid solutions of La1−xCexFeO3+x/2 characterized are active as catalysts for TCH decomposition (Figure 7a). They show monotonous increasing of the catalytical activity with increasing Ce4+ content, where the highest value for the rate constant for the most active sample, La0.93Ce0.07FeO3+x/2, is 29.2 × 10⁻³ min−1 (Table 4). Taking into account the band gap energy values, it should be pointed out that they are not varying monotonous with increasing Ce4+ content, but are very similar, and the essential point is that all they correspond to the visible light range (Table 3). The Eg cannot be considered as a decisive reason for the different catalytic activity of the samples. A sol–gel-synthesized LaFeO3 is tested in a similar process, even though the rate constant is not indicated, making the comparison of the catalytical activity not relevant [48].
The degradation of TCH, determined by UV/Vis absorption spectroscopy monitoring of the band at 354 nm, is increasing with the Ce4+ increasing in the range 62 to 73% (Table 4). Evidence for the oxidation of TCH to CO2 and H2O is the total organic carbon (TOC) removal up to 61% (Table 4). By UV–Vis spectroscopy, only the targeted pollutant can be followed, ignoring the intermediate products (in fact they can be even more toxic than the original molecule itself), while by TOC analysis, the complete mineralization can be followed. Although the data obtained by both analyses are close (for the most active sample La0.93Ce0.07FeO3+x/2 of 73/61%, respectively), a difference can be expected since the oxidation kinetics of organic molecules is different [49]. For example, TCH degradation of 93.3% by UV–Vis spectroscopy, but only 58% after TOC analysis, was detected by [49]. According [50], by HPLC, almost a complete removal of TCH in persulfate Fenton-like reaction was observed, whereas by TOC-analysis, only 26.27% of the organic matter mineralization was detected. The generated intermediates (and therefore the degradation pathway) are strongly affected by the reactive oxygen species generated [51], but in almost all cases the first step is removal of the amino, hydroxyl, and methyl groups, followed by rings opening [52,53]. Despite the generation of various organic byproducts, the toxicity analysis performed both by Toxicity Evaluation Software Tool (TEST) [53] and by experiments with different biological species [52] prove that almost all of the intermediates generated by peroxydisulfate Fenton-like processes have higher LD50 and lower mutagenicity than the TCH itself.
The influence both of the light and the catalyst, as well as the potassium peroxydisulfate, was evaluated. It can be seen (Figure 7b) that the oxidizing capability of K2S2O8 is insignificant even in the presence of visible light. It essentially increased in the presence of the catalysts La1−xCexFeO3+x/2. When PDS is assisted both by a catalyst and visible light, it is activated and TCH is successfully degraded (Figure 7b).
Considering a radical-dominated catalytic mechanism, radical quenching experiments were applied to determine the types of active radical species generated during the activation of PDS so as to determine both the mechanism of the reaction and the active oxidizing radicals. The scavengers are supposed to react fast and explicitly with a radical, producing a stable species which does not affect the reaction, and by this, removing the effect of the radical in the degradation [54]. Alcohols, such as methanol and tert-butanol (TBA), are applied as hydroxyl radical scavengers, azide ions N3 as scavengers for singlet oxygen, even it is not a radical [55], and ascorbic acid as scavenger for superoxide anion radical O2•− [56] in photoassisted processes.
The molecules mentioned, known as good scavengers for SO4•− and OH (methanol), OH (tert-butanol), singlet 1O2 (sodium azide), and superoxide anion radical O2•− (ascorbic acid), were tested and the results are presented in Figure 8a. The results show the ascorbic acid had the strongest influence (O2•−), but in spite of that, all the radicals tested can be considered responsible for the activity of the catalysts. Superoxide radical and singlet oxygen may be the controlling reactive oxygen species.

4. Discussion

It can be supposed that the substitution of La3+ by Ce4+ in LaFeO3 is causing deformation of the structure, including deformation of FeO6 polyhedra. The data obtained based on XRD of the samples show bigger crystallites size, and lower degree of microstrain, leading to low concentration of defects and dislocations with Ce4+ content increasing in the solid solutions La1−xCexFeO3+x/2. The concentration of dislocations is connected with the defects available; the defects within the perovskites are oxygen vacancies. Both the oxygen vacancies and their concentrations are ruling the properties of the perovskites [57] and they can be generated by planetary ball-milling [58]. The specific surface area is not even high, but it decreases with the crystallites size increasing when the content of Ce4+ is increasing. At the same time, the data from the catalytic process show increasing of the catalytic activity of the solid solutions La1−xCexFeO3+x/2 with increasing Ce4+ content. According to the literature, both the defects as active centers [59] and the specific surface area [18] can be factors for the catalytic activity increasing, but for our solid solutions, the data from the characterization show that neither the defects as active centers nor the specific surface area could explain the increasing activity with increasing Ce4+ content. We should take into account that the partial replacement of La3+ by Ce4+ needs charge compensation. This could happen by Fe3+ → Fe2+ reduction. The higher concentration of the radicals can be explained by the higher content of Fe2+, i.e., by the reaction Fe3+ → Fe2+, the peroxide radicals are formed. An additional path for increasing of the peroxide radical formation could be the reduction of Ce4+ → Ce3+. This could be a result of a mechanochemical reaction because no heating was applied. According to [58], by planetary ball-milling of CeO2 the concentration of Ce3+ significantly increased in comparison with Ce4+ by the grinding time (up to 720 min; for our samples, 240 min).
Based on the above presented results and considerations, the possible visible-light-assisted PDS activation mechanism is proposed by the following equations.
Catalyst + hν → Catalyst* + h+ + e
≡Fe3+ + e → ≡Fe2+
≡Fe2+ + S2O82− → Fe3+ + SO42− + SO4•−
Fe2+ + O2 → Fe3+ + O2•−
≡Ce4+ + e → ≡Ce3+
≡Ce3+ + S2O82− → Ce4+ + SO42− + SO4•−
Ce3+ + O2 → Ce4+ + O2•−
S2O82− + e → SO4•− + SO42−
S2O82− + H2O → 2SO42− + HO2 + 3H+
S2O82− + HO2 → SO42− + SO4•− + O2•− + H+
SO4•− + H2O/OH → OH + SO42− + H+
O2•− + e + 2H+ → H2O2
O2•− + OH1O2 + OH
2O2•− + 2H+1O2 + H2O2
2O2•− + H2O → 1O2 + H2O2 + 2OH
TCH + h+/O2•−/SO4•−/OH•/1O2 → … → CO2 + H2O
The solid solutions were excited by the visible light to produce electron–hole pairs. The photogenerated electrons, e, were transferred to the conduction band from the valence band, creating positive holes, h+. The photogenerated holes can directly degrade TCH (Figure 8b). The photogenerated electrons can react with O2 to produce O2•−, thereby generating OH and SO4•−. Additionally, the Fe3+ ions, by accepting electrons, make available Fe2+, and the latter activates PDS to produce SO4•− radicals and O2 to produce O2•−. By the Fe3+/Fe2+ cycle, continuous PDS activation takes place. At the same time, the photogenerated electrons could accelerate the Ce4+/Ce3+ redox cycle, leading to SO4•− and O2•−. The singlet oxygen 1O2 production is a result of the peroxide ion reactions. All active species produced in the visible-light-assisted PDS activation play a positive role in the pollutant degradation to CO2 and H2O.

5. Conclusions

Homogeneous solid-state solutions with orthorhombic crystal structure, La1−xCexFeO3+x/2, were synthesized by very simple and effective mechanochemical treatment of the oxides La2O3, Fe2O3, and CeO2, later added as a dopant agent in different ratio La/Ce. The successful application of the mechanochemical ball-milling for La1−xCexFeO3+x/2 synthesis can be considered as one of the good points of the work presented.
The Ce4+ content increasing leads to increase of the crystallite size and decrease of SSA and the total pore volume. In the reaction of decomposition of tetracycline hydrochloride, the solid solutions showed more increasing activity for PDS activation than the pure LaFeO3, in spite of the very similar values of the band gap energy varying between 2.32 and 2.39 eV for all of them in the visible light range. The monotonous increasing of the rate constants with the Ce4+ content increasing illustrated that the catalytic activity is governed by the amount of Ce4+ in the solid solutions. The samples expressed excellent catalytic response with the best result for La0.93Ce0.07FeO3+x/2, showing about 73% degradation of the TCH within 60 min of the reaction time and rate constant of 29.2 × 10⁻³ min−1. By use of molecules–scavengers, the mechanism of the catalytic reaction was detailed. The experiments with the radical scavengers showed that active oxidant species such as O2.−, OH, and h+ were all involved in this catalytic system, although it seems that O2 played the major role in the catalytic degrading of TCH. The effective activation of PDS in a reaction of catalytic antibiotic degradation confirms that the solid solutions of La1−xCexFeO3+x/2 are also worthy of experimentation for decomposition of other organic molecules as water pollutants.

Author Contributions

Conceptualization, M.T.; methodology, M.T.; formal analysis, E.E.; investigation, E.E., M.T., S.P. and I.S.; resources, M.T.; data curation, M.T. and E.E.; writing—original draft preparation, M.T. and M.M.; writing—review and editing, M.T. and M.M.; visualization, M.T. and E.E.; supervision, M.T.; project administration, M.T. All authors have read and agreed to the published version of the manuscript.

Funding

This research was funded by Operational Program “Science and Education for Smart Growth” Project BG05M2OP001-1.002-0019 and BG Fund for Scientific Investigations, Project KP-06-N59/12, 2021.

Institutional Review Board Statement

Not relevant.

Informed Consent Statement

Not applicable.

Data Availability Statement

The data presented in this study are openly available in MDPI.

Acknowledgments

The support from the Operational Program “Science and Education for Smart Growth” by the Project BG05M2OP001-1.002-0019 “Clean technologies for a sustainable environment—waters, wastes, energy for a circular economy” and BG Fund for Scientific Investigations (project no. KP-06-N59/12, 2021) is highly appreciated.

Conflicts of Interest

The authors declare no conflict of interest.

References

  1. Bahuguna, A.; Singh, S.K.; Bahuguna, A.; Sharma, S.; Dadarwal, B.K. Physical method of wastewater treatment—A review. J. Res. Environ. Earth Sci. 2021, 7, 29–36. [Google Scholar]
  2. Hasan, H.A.; Muhammad, M.H.; Ismail, N.I. A review of biological drinking water treatment technologies for contaminants removal from polluted water resources. J. Water Process Eng. 2020, 33, 101035. [Google Scholar] [CrossRef]
  3. Zahmatkesh, S.; Keshteli, M.H.; Bokhari, A.; Sundaramurthy, S.; Panneerselvam, B.; Rezakhani, Y. Wastewater treatment with nanomaterials for the future: A state-of-the-art review. Environ. Res. 2023, 216, 114652. [Google Scholar] [CrossRef] [PubMed]
  4. Ghernaout, D.; Elboughdiri, N. Advanced Oxidation Processes for Wastewater Treatment: Facts and Future Trends. Open Access Libr. J. 2020, 7, e6139. [Google Scholar] [CrossRef]
  5. Xiao, R.; Luo, Z.; Wei, Z.; Luo, S.; Spinney, R.; Yang, W.; Dionysiou, D.D. Activation of peroxymonosulfate/persulfate by nanomaterials for sulfate radical-based advanced oxidation technologies. Curr. Opin. Chem. Eng. 2018, 19, 51–58. [Google Scholar] [CrossRef]
  6. Zheng, X.; Niu, X.; Zhang, D.; Lv, M.; Ye, X.; Ma, J.; Lin, Z.; Fu, M. Metal-based catalysts for persulfate and peroxymonosulfate activation in heterogeneous ways: A review. Chem. Eng. J. 2022, 429, 132323. [Google Scholar] [CrossRef]
  7. Wang, J.; Wang, S. Activation of persulfate (PS) and peroxymonosulfate (PMS) and application for the degradation of emerging contaminants. Chem. Eng. J. 2018, 334, 1502–1517. [Google Scholar] [CrossRef]
  8. Ghanbari, F.; Moradi, M. Application of peroxymonosulfate and its activation methods for degradation of environmental organic pollutants: Review. Chem. Eng. J. 2017, 310, 41–62. [Google Scholar] [CrossRef]
  9. Oh, W.-D.; Lim, T.-T. Design and application of heterogeneous catalysts as peroxydisulfate activator for organics removal: An overview. Chem. Eng. J. 2019, 358, 110–133. [Google Scholar] [CrossRef]
  10. Arman, M.M.; El-Dek, S.I. Role of annealing temperature in tailoring Ce-doped LaFeO3 features. J. Phys. Chem. Solids 2021, 152, 109980. [Google Scholar] [CrossRef]
  11. Arima, T.; Tokura, Y.; Torrance, J.B. Variation of Optical Gaps in Perovskite-Type 3d Transition—Metal Oxides. Phys. Rev. B 1993, 48, 17006. [Google Scholar] [CrossRef] [PubMed]
  12. Tijare, S.N.; Joshi, M.V.; Padole, P.S.; Mangrulkar, P.A.; Rayalu, S.S.; Labhsetwar, N.K. Photocatalytic Hydrogen Generation Through Water Splitting on Nano-Crystalline LaFeO3 Perovskite. Int. J. Hydrogen Energy 2012, 37, 10451. [Google Scholar] [CrossRef]
  13. Wiranwetchayan, O.; Promnopas, S.; Phadungdhitidhada, S.; Phuruangrat, A.; Thongtem, T.; Singjai, P.; Thongtem, S. Characterization of perovskite LaFeO3 synthesized by microwave plasma method for photocatalytic applications. Ceram. Int. 2019, 45, 4802–4809. [Google Scholar] [CrossRef]
  14. Dumitru, R.; Negrea, S.; Ianculescu, A.; Păcurariu, C.; Vasile, B.; Surdu, A.; Manea, F. Lanthanum Ferrite Ceramic Powders: Synthesis, Characterization and Electrochemical Detection Application. Materials 2020, 13, 2061. [Google Scholar] [CrossRef] [PubMed]
  15. Andoulsin, R.; Horchani-Naifer, K.; Férid, M. Preparation of lanthanum ferrite powder at low temperature. Ceramica 2012, 58, 126–130. [Google Scholar] [CrossRef]
  16. Bhargav, K.K.; Ram, S.; Majumder, S.B. Physics of the multi-functionality of lanthanum ferrite ceramics. J. Appl. Phys. 2014, 115, 204109. [Google Scholar] [CrossRef]
  17. Shen, H.; Cheng, G.; Wu, A.; Xu, J.; Zhao, J. Combustion synthesis and characterization of nano-crystalline LaFeO3 powder. Phys. Status Solidi A 2009, 206, 1420–1424. [Google Scholar] [CrossRef]
  18. Humayun, M.; Ullah, H.; Usman, M.; Habibi-Yangjeh, A.; Tahir, A.A.; Wang, C.; Luo, W. Perovskite-type lanthanum ferrite based photocatalysts: Preparation, properties, and applications. J. Energy Chem. 2022, 66, 314–338. [Google Scholar] [CrossRef]
  19. Andoulsin, R.; Naifer, K.H.; Ferid, M. Electrical conductivity of La1−xCaxFeO3−δ solid solutions. Ceram. Int. 2013, 39, 6527–6531. [Google Scholar] [CrossRef]
  20. Rai, A.; Thakur, A.K. Influence of co-substitution driven property tailoring in lanthanum orthoferrites (LaFeO3). Ceram. Int. 2017, 43, 13828–13838. [Google Scholar] [CrossRef]
  21. Wen, Y.; Zhang, C.; He, H.; Yu, Y.; Teraoka, Y. Catalytic oxidation of nitrogen monoxide over La1−xCexCoO3 perovskites. Catal. Today 2007, 126, 400–405. [Google Scholar] [CrossRef]
  22. Saikia, N.; Chakravarty, R.; Bhattacharjee, S.; Hota, R.L.; Parida, R.K.; Parida, B.N. Synthesis and characterization of Gd-doped LaFeO3 for device application. Mater. Sci. Semicond. Process. 2022, 151, 106969. [Google Scholar] [CrossRef]
  23. Prasad, B.V.; Rao, B.V.; Narsaiah, K.; Rao, G.N.; Chen, J.W.; Babu, D.S. Preparation and characterization of perovskite Cu doped LaFeO3 semiconductor ceramics. IOP Conf. Ser. Mater. Sci. Eng. 2015, 73, 012129. [Google Scholar] [CrossRef]
  24. Hunpratub, S.; Karaphun, A.; Phokh, S.; Swatsitang, E. Optical and magnetic properties of La1−xGaxFeO3 nanoparticles synthesized by polymerization complex method. Appl. Surf. Sci. 2016, 380, 52–59. [Google Scholar] [CrossRef]
  25. Janbutrach, Y.; Hunpratub, S.; Swatsitang, E. Ferromagnetism and optical properties of La1 − xAlxFeO3 nanopowders. Nanoscale Res. Let. 2014, 9, 498. [Google Scholar] [CrossRef]
  26. Barbero, P.; Gambo, J.A.; Cadús, L.E. Synthesis and characterisation of La1−xCaxFeO3 perovskite-type oxide catalysts for total oxidation of volatile organic compounds. Appl. Catal. B Environ. 2006, 65, 21. [Google Scholar] [CrossRef]
  27. Bashir, B.; Warsi, M.F.; Khan, M.A.; Akhtar, M.N.; Gilani, Z.A.; Shakir, I.; Wadood, A. Rare earth Tb3+ doped LaFeO3 nanoparticles: New materials for high frequency devices fabrication. Ceram. Int. 2015, 41, 9199–9202. [Google Scholar] [CrossRef]
  28. Al-Mamari, R.T.; Widatallah, H.M.; Elzain, M.E.; Gismelseed, A.M.; Al-Rawas, A.D.; Al-Harthi, S.H.; Souier, T.M.; Al-Abri, M. Structural, Mössbauer, and optical studies of mechano-synthesized Ru3+-doped LaFeO3 nanoparticles. Hyperfine Interact. 2022, 243, 4. [Google Scholar] [CrossRef]
  29. Xiang, X.-P.; Zhao, L.-H.; Teng, B.-T.; Lang, J.-J.; Hu, X.; Li, T.; Fang, Y.-A.; Luo, M.-F.; Lin, J.-J. Catalytic combustion of methane on La1−xCexFeO3 oxides. Appl. Surf. Sci. 2013, 276, 328–332. [Google Scholar] [CrossRef]
  30. Shikha, P.; Kang, T.S.; Randhawa, B.S. Effect of different synthetic routes on the structural, morphological and magnetic properties of Ce doped LaFeO3 nanoparticles. J. Alloys Compd. 2015, 625, 336–345. [Google Scholar] [CrossRef]
  31. Cotton, S. Lanthanide and Actinide Chemistry; John Wiley & Sons Ltd.: West Sussex, UK, 2006; p. 29. [Google Scholar]
  32. Nitadori, T.; Misono, M. Catalytic properties of La1-xAxFeO3 (A = Sr, Ce) and La1-xCexCoO3. J. Catal. 1985, 93, 459–466. [Google Scholar] [CrossRef]
  33. Zhang, Q.; Saito, F. Effect of Fe2O3 crystallite size on its mechanochemical reaction with La2O3 to form LaFeO3. J. Mater. Sci. 2001, 36, 2287–2290. [Google Scholar] [CrossRef]
  34. Miao, J.; Zhang, R.; Zhang, L. Photocatalytic degradations of three dyes with different chemical structures using ball-milled TiO2. Mater. Res. Bull. 2018, 97, 109–114. [Google Scholar] [CrossRef]
  35. Wu, D.; Li, C.; Zhang, D.; Wang, L.; Zhang, X.; Shi, Z.; Lin, Q. Photocatalytic improvement of Y3+ modified TiO2 prepared by a ball milling method and application in shrimp wastewater treatment. RSC Adv. 2019, 9, 14609–14620. [Google Scholar] [CrossRef]
  36. Yin, Z.; Zhang, Q.; Li, S.; Cagnetta, G.; Huang, J.; Deng, S.; Yu, G. Mechanochemical synthesis of catalysts and reagents for water decontamination: Recent advances and perspective. Sci. Total Environ. 2022, 825, 153992. [Google Scholar] [CrossRef] [PubMed]
  37. Thomas, N.; Dionysiou, D.D.; Pillai, S.C. Heterogeneous Fenton catalysts: A review of recent advances. J. Hazard. Mater. 2021, 404, 124082. [Google Scholar] [CrossRef]
  38. Liu, J.; Zhou, B.; Zhang, H.; Ma, J.; Mu, B.; Zhang, W. A novel Biochar modified by Chitosan-Fe/S for tetracycline adsorption and studies on site energy distribution. Bioresour. Technol. 2019, 294, 122152. [Google Scholar] [CrossRef]
  39. Danner, M.-C.; Robertson, A.; Behrends, V.; Reis, J. Antibiotic pollution in surface fresh waters: Occurrence and effects. Sci. Total Environ. 2019, 664, 793–804. [Google Scholar] [CrossRef]
  40. Xiong, H.; Dong, S.; Zhang, J.; Zhou, D.; Rittmann, B.E. Roles of an easily biodegradable co-substrate in enhancing tetracycline treatment in an intimately coupled photocatalytic-biological reactor. Water Res. 2018, 136, 75–83. [Google Scholar] [CrossRef]
  41. Xiong, H.; Zou, D.; Zhou, D.; Dong, S.; Wang, J.; Rittmann, B.E. Enhancing degradation and mineralization of tetracycline using intimately coupled photocatalysis and biodegradation (ICPB). Chem. Eng. J. 2017, 316, 7–14. [Google Scholar] [CrossRef]
  42. Rodriguez-Carvajal, J. Recent developments of the program fullprof. In Newsletter in Commission on Powder Diffraction; IUCr: Chester, UK, 2001; Volume 26, pp. 12–19. [Google Scholar]
  43. Tauc, J.; Grigorovici, R.; Vancu, A. Optical properties and electronic structure of amorphous germanium. Phys. Status Solidi 1966, 15, 627–637. [Google Scholar] [CrossRef]
  44. Shanon, R.D. Revised effective ionic radii and systematic studies of interatomic distances in halides and chalcogenides. Acta Cryst. 1976, A32, 751–767. [Google Scholar] [CrossRef]
  45. Gowri, G.; Saravanan, R.; Sasikumar, S.; Banu, I.B.S. Exchange bias effect, ferroelectric property, primary bonding and charge density analysis of La1-xCexFeO3 multiferroics. Mater. Res. Bull. 2019, 118, 110512. [Google Scholar] [CrossRef]
  46. Beranek, R. (Photo)electrochemical methods for the determination of the band edge positions of TiO2-based nanomaterials. Adv. Phys. Chem. 2011, 2011, 786759. [Google Scholar] [CrossRef]
  47. Dimitrov, V.; Sakka, S. Electronic Oxide Polarizability and Optical Basicity of Simple Oxide. J. Appl. Phys. 1996, 79, 1736–1740. [Google Scholar] [CrossRef]
  48. Feng, Q.; Zhou, J.; Luo, W.; Ding, L.; Cai, W. Photo-Fenton removal of tetracycline hydrochloride using LaFeO3 as a persulfate activator under visible light. Ecotoxicol. Environ. Saf. 2020, 198, 110661. [Google Scholar] [CrossRef] [PubMed]
  49. Zhang, C.; Wang, Z.; Li, F.; Wang, J.; Xu, N.; Jia, Y.; Gao, S.; Tian, T.; Shen, W. Degradation of tetracycline by activated peroxodisulfate using CuFe2O4-loaded biochar. J. Mol. Liq. 2022, 368 Part A, 120622. [Google Scholar] [CrossRef]
  50. Zhong, Q.; Lin, Q.; Huang, R.; Fu, H.; Zhang, X.; Luo, H.; Xiao, R. Oxidative degradation of tetracycline using persulfate activated by N and Cu codoped biochar. Chem. Eng. J. 2020, 380, 122608. [Google Scholar] [CrossRef]
  51. Cheng, G.; Yuan, C.; Ruan, W.; Ma, B.; Zhang, X.; Yuan, X.; Li, Z.; Wang, D.; Teng, F. Visible light enhanced persulfate activation for degradation of tetracycline via boosting adsorption of persulfate by ligand-deficient MIL-101(Fe) icosahedron. Chemosphere 2023, 317, 137857. [Google Scholar] [CrossRef]
  52. Ge, X.; Meng, G.; Liu, B. Efficient degradation of antibiotics by oxygen vacancy-LaFeO3/polystyrene-driven photo-Fenton system: Highlight the impacts of molecular structures. J. Water Process Eng. 2023, 51, 103428. [Google Scholar] [CrossRef]
  53. Gao, J.; Sun, Y.; Xiong, R.; Ma, Y.; Wang, L.; Qiao, S.; Zhang, J.; Ji, W.; Li, Y. Strategy for oxygen vacancy enriched CoMn spinel oxide catalyst activated peroxodisulfate for tetracycline degradation: Process, mechanism, and toxicity analysis. RSC Adv. 2023, 13, 11472–11479. [Google Scholar] [CrossRef]
  54. Schneider, J.T.; Scheres Firak, D.; Ribeiro, R.R.; Peralta-Zamora, P. Use of scavenger agents in heterogeneous photocatalysis: Truths, half-truths, and misinterpretations. Phys. Chem. Chem. Phys. 2020, 22, 15723–15733. [Google Scholar] [CrossRef] [PubMed]
  55. Rodrıguez, E.M.; Marquez, G.; Tena, M.; Alvarez, P.M.; Beltran, F.J. Determination of main species involved in the first steps of TiO2 photocatalytic degradation of organics with the use of scavengers: The case of ofloxacin. Appl. Catal. B Environ. 2015, 178, 44–53. [Google Scholar] [CrossRef]
  56. Nimse, S.B.; Pal, D. Free radicals, natural antioxidants, and their reaction mechanisms. RSC Adv. 2015, 5, 27986–28006. [Google Scholar] [CrossRef]
  57. Wexler, R.B.; Gautam, G.S.; Stechel, E.B.; Carter, E.A. Factors Governing Oxygen Vacancy Formation in Oxide Perovskites. J. Am. Chem. Soc. 2021, 143, 13212–13227. [Google Scholar] [CrossRef] [PubMed]
  58. Kato, T.; Iwamoto, M.; Tokoro, C. Investigation of cerium reduction efficiency by grinding with microwave irradiation in mechanochemical processing. Minerals 2022, 12, 189. [Google Scholar] [CrossRef]
  59. Mutter, D.; Schierholz, R.; Urban, D.F.; Heuer, S.A.; Ohlerth, T.; Kungl, H.; Elsässer, C.; Eichel, R.-A. Defects and Phase Formation in Non-Stoichiometric LaFeO3: A Combined Theoretical and Experimental Study. Chem. Mater. 2021, 33, 9473–9485. [Google Scholar] [CrossRef]
Figure 1. XRD of the mixture of the initial La2O3, Fe2O3, and CeO2 (calculated for 7% Ce) (a) before, (b) after 2 h, and (c) after 4 h of ball-milling. The literature XRD data of the pure oxides and LaFeO3 are added for comparison.
Crystals 13 00769 g001
Figure 2. XRD patterns, from bottom to top: LaFeO3, La0.99Ce0.01FeO3+x/2, La0.97Ce0.03FeO3+x/2, La0.95Ce0.05FeO3+x/2, and La0.93Ce0.07FeO3+x/2.
Crystals 13 00769 g002
Figure 3. Rietveld refinement plots of La1−xCexFeO3+x/2, where (a) x = 0.00, (b) x = 0.01, (c) x = 0.03, (d) x = 0.05; (e) x = 0.07, and (f) x = 0. 07, with freely refined oxygen occupancy. Experimentally observed (dots), Rietveld calculated (continuous line), and difference (continuous bottom line) profiles, obtained after Rietveld analysis of the XRD data. Peak positions are shown at the base line as small markers.
Crystals 13 00769 g003aCrystals 13 00769 g003b
Figure 4. TEM images of (a) LaFeO3 and (b) La0.93Ce0.07FeO3+x/2 and SAED patterns of (c) LaFeO3 and (d) La0.93Ce0.07FeO3+x/2.
Crystals 13 00769 g004
Figure 5. (a) Adsorption–desorption isotherms of LaFeO3+x/2, La0.99Ce0.01FeO3+x/2, La0.97Ce0.03FeO3+x/2, La0.95Ce0.05FeO3+x/2, La0.93Ce0.07FeO3+x/2, and (b) BJH pore diameter distribution, determined from the desorption branch of the isotherm. V—pore volume; D—pore diameter.
Crystals 13 00769 g005
Figure 6. UV/Vis spectra of the samples LaFeO3, La0.99Ce0.01FeO3+x/2, La0.97Ce0.03FeO3+x/2, La0.95Ce0.05FeO3+x/2, and La0.93Ce0.07FeO3+x/2.
Crystals 13 00769 g006
Figure 7. The kinetic curves of the catalytic performance for degradation of TCH (a) by PDS activation for La1−xCexFeO3+x/2, x = 0.00, 0.01, 0.03, 0.05, and 0.07, under visible light illumination (according the legend); (b) by PDS, PDS/Vis, PDS/catalyst, and PDS/catalyst/Vis, where the catalyst is La0.93Ce0.07FeO3+x/2, according the legend.
Crystals 13 00769 g007
Figure 8. (a) Efficiency of the different radical scavengers MeOH, NaN3, ascorbic acid, and tert-BuOH for the degradation of TCH (according the legend). (b) Mechanism of the TCH degradation.
Crystals 13 00769 g008
Table 1. Unit cell parameters, unit cell volume, crystallite size, and microstrains of the samples obtained by the Rietveld refinement, including parameters provided by the Rietveld refinement, the weighted R profile (Rwp), and the goodness of fit (χ2). * GOF = goodness of fit.
SampleUnit Cell Parameters, ÅUnit Cell Volume, Å3Crystallite Size, nmMicrostrains,
×10−3 a.u.
Dislocation Density,
×10−3 nm−2
Rwp, %GOF *
LaFeO3a = 5.552(4)
b = 5.577(4)
c = 7.843(5)
242.9(3)14.4(4)1.14.812.01.14
La0.99Ce0.01FeO3+x/2a = 5.550(4)
b = 5.578(5)
c = 7.843(5)
242.8(3)14.9(3)0.94.512.11.12
La0.97Ce0.03FeO3+x/2a = 5.551(3)
b = 5.578(3)
c = 7.844(4)
242.9(3)15.0(2)0.84.412.31.17
La0.95Ce0.05FeO3+x/2a = 5.550(5)
b = 5.575(7)
c = 7.846(9)
242.8(5)16.8(4)0.83.511.91.16
La0.93Ce0.07FeO3+x/2a = 5.549(5)
b = 5.576(6)
c = 7.848(7)
242.8(4)16.9(5)0.73.512.61.21
Table 2. Textural characteristics of the samples.
SampleSpecific Surface Area SBET, m2/gTotal Pore
Volume Vt, cm3/g
Average Pore
Size Dav, nm
LaFeO390.0419
La0.99Ce0.01FeO3+x/290.0416
La0.97Ce0.03FeO3+x/280.0418
La0.95Ce0.05FeO3+x/280.0419
La0.93Ce0.07FeO3+x/270.0315
Table 3. Energy of the band gap, refractive index, and the potentials of current band (CB) and valence band (VB).
SampleEg, eV/λ, nmRefractive
Index
EVB, eVECB, eV
LaFeO32.32/5332.612.21−0.11
La0.99Ce0.01FeO3+x/22.38/5202.592.24−0.14
La0.97Ce0.03FeO3+x/22.37/5222.592.23−0.14
La0.95Ce0.05FeO3+x/22.39/5182.582.24−0.15
La0.93Ce0.07FeO3+x/22.36/524 2.592.23−0.13
Table 4. Rate constants, degradation of TCH and TOC removal under visible light with PDS activated.
CatalystRate Constant,
×10−3 min−1
R2Degradation, %TOC
Removal, %
LaFeO316.4 ± 0.90.97262.041.2 ± 0.3
La0.99Ce0.01FeO+x/2318.8 ± 0.60.98964.645.1 ± 0.7
La0.97Ce0.03FeO3+x/220.0 ± 1.10.97567.347.0 ± 0.5
La0.95Ce0.05FeO3+x/222.6 ± 1.40.96969.151.2 ± 1.1
La0.93Ce0.07FeO3+x/229.2 ± 2.50.94672.961.0 ± 0.9
Disclaimer/Publisher’s Note: The statements, opinions and data contained in all publications are solely those of the individual author(s) and contributor(s) and not of MDPI and/or the editor(s). MDPI and/or the editor(s) disclaim responsibility for any injury to people or property resulting from any ideas, methods, instructions or products referred to in the content.

