1. Introduction
Growing “large” metallic single crystals was an intense research topic in the first half of the last century [
1,
2]. Understanding micro-structural elementary mechanisms of metal deformation was an important lock for mastering the plastic shaping of metals. This interest in growing “large” single crystals is still nowadays an active field of research on BCC and FCC crystalline structures [
3,
4,
5] with diversification towards less simple crystal structures, such as HCP structures [
6,
7,
8]. Multiphysics properties studies, such as magneto-elasticity [
9] or magneto-plasticity [
10] need the largest crystals (multi-centimeter size). However, crystal growth is a part of the recrystallization research field [
11], and the present work focuses on the elaboration of aluminum large crystals. There are two since long well-known major methods to produce multi-centimeter-size metallic single crystals: one starts from the melt, which is cooled, e.g., Bridgman’s technique [
1], and is the main route to obtaining large 3D crystals. It mostly applies to metals for which no phase transition occurs between the liquid and the room temperature solid states; the second method starts from a solid state and is called the “critical strain-annealing” (CSA) approach [
2]. In contrast to the Bridgman method, it allows to obtaining large single crystals for metals either or not exhibiting a phase transition from the melt to room temperature. The CSA method was successfully used for different metals, such as zirconium [
12], iron [
13,
14,
15,
16,
17], plutonium [
18], and titanium [
19]. As is known, this method consists of starting with a fine-grained polycrystalline metal resulting from severe rolling (or extrusion), which is first annealed for grain-size homogenization. It is then plastically deformed to approximately 1–4% elongation for producing very few nuclei during the recrystallization. Finally, a second annealing step is carried out, during which these nuclei grow more rapidly than the other potential seeds. This generally produces a multi-crystal with a few large grains and sometimes, in the most successful cases, when the closer to the critical strain was the straining step, a single crystal over the whole specimen.
For aluminum, in which case both Bridgman and CSA methods apply,
Table 1 shows a summary of the parameters determined for making “large” single crystals (i.e., sized at least 3 mm) from using the CSA method. Among the reported studies, Yao and Wagoner [
20] succeeded in manufacturing the largest crystals (70 mm) but with a long duration process (7 to 10 days). It is noteworthy that recent attempts to improve this method are based on combinations of heat treatments and plastic straining steps, in basically metallurgical approaches [
8,
21].
The here proposed method is more mechanically based in the sense that it relies on the use of Finite Element simulations and mostly of digital image correlation (DIC) technique for accurate measurements of full-field longitudinal strain at the grain size. This proposed method allows obtaining multi-centimeter-size aluminum crystals in less than 30 h.
The CSA method is briefly recalled in
Section 2. The following procedure for designing the appropriate trapezoidal samples, fixing the minimal values of the temperatures and durations of the heat treatments, and plotting the recrystallization diagram is presented in
Section 3. The obtained numerical and experimental results are reported and discussed in
Section 4.
Section 5 concludes.
2. Parameters of the Critical Strain-Annealing (CSA) Method
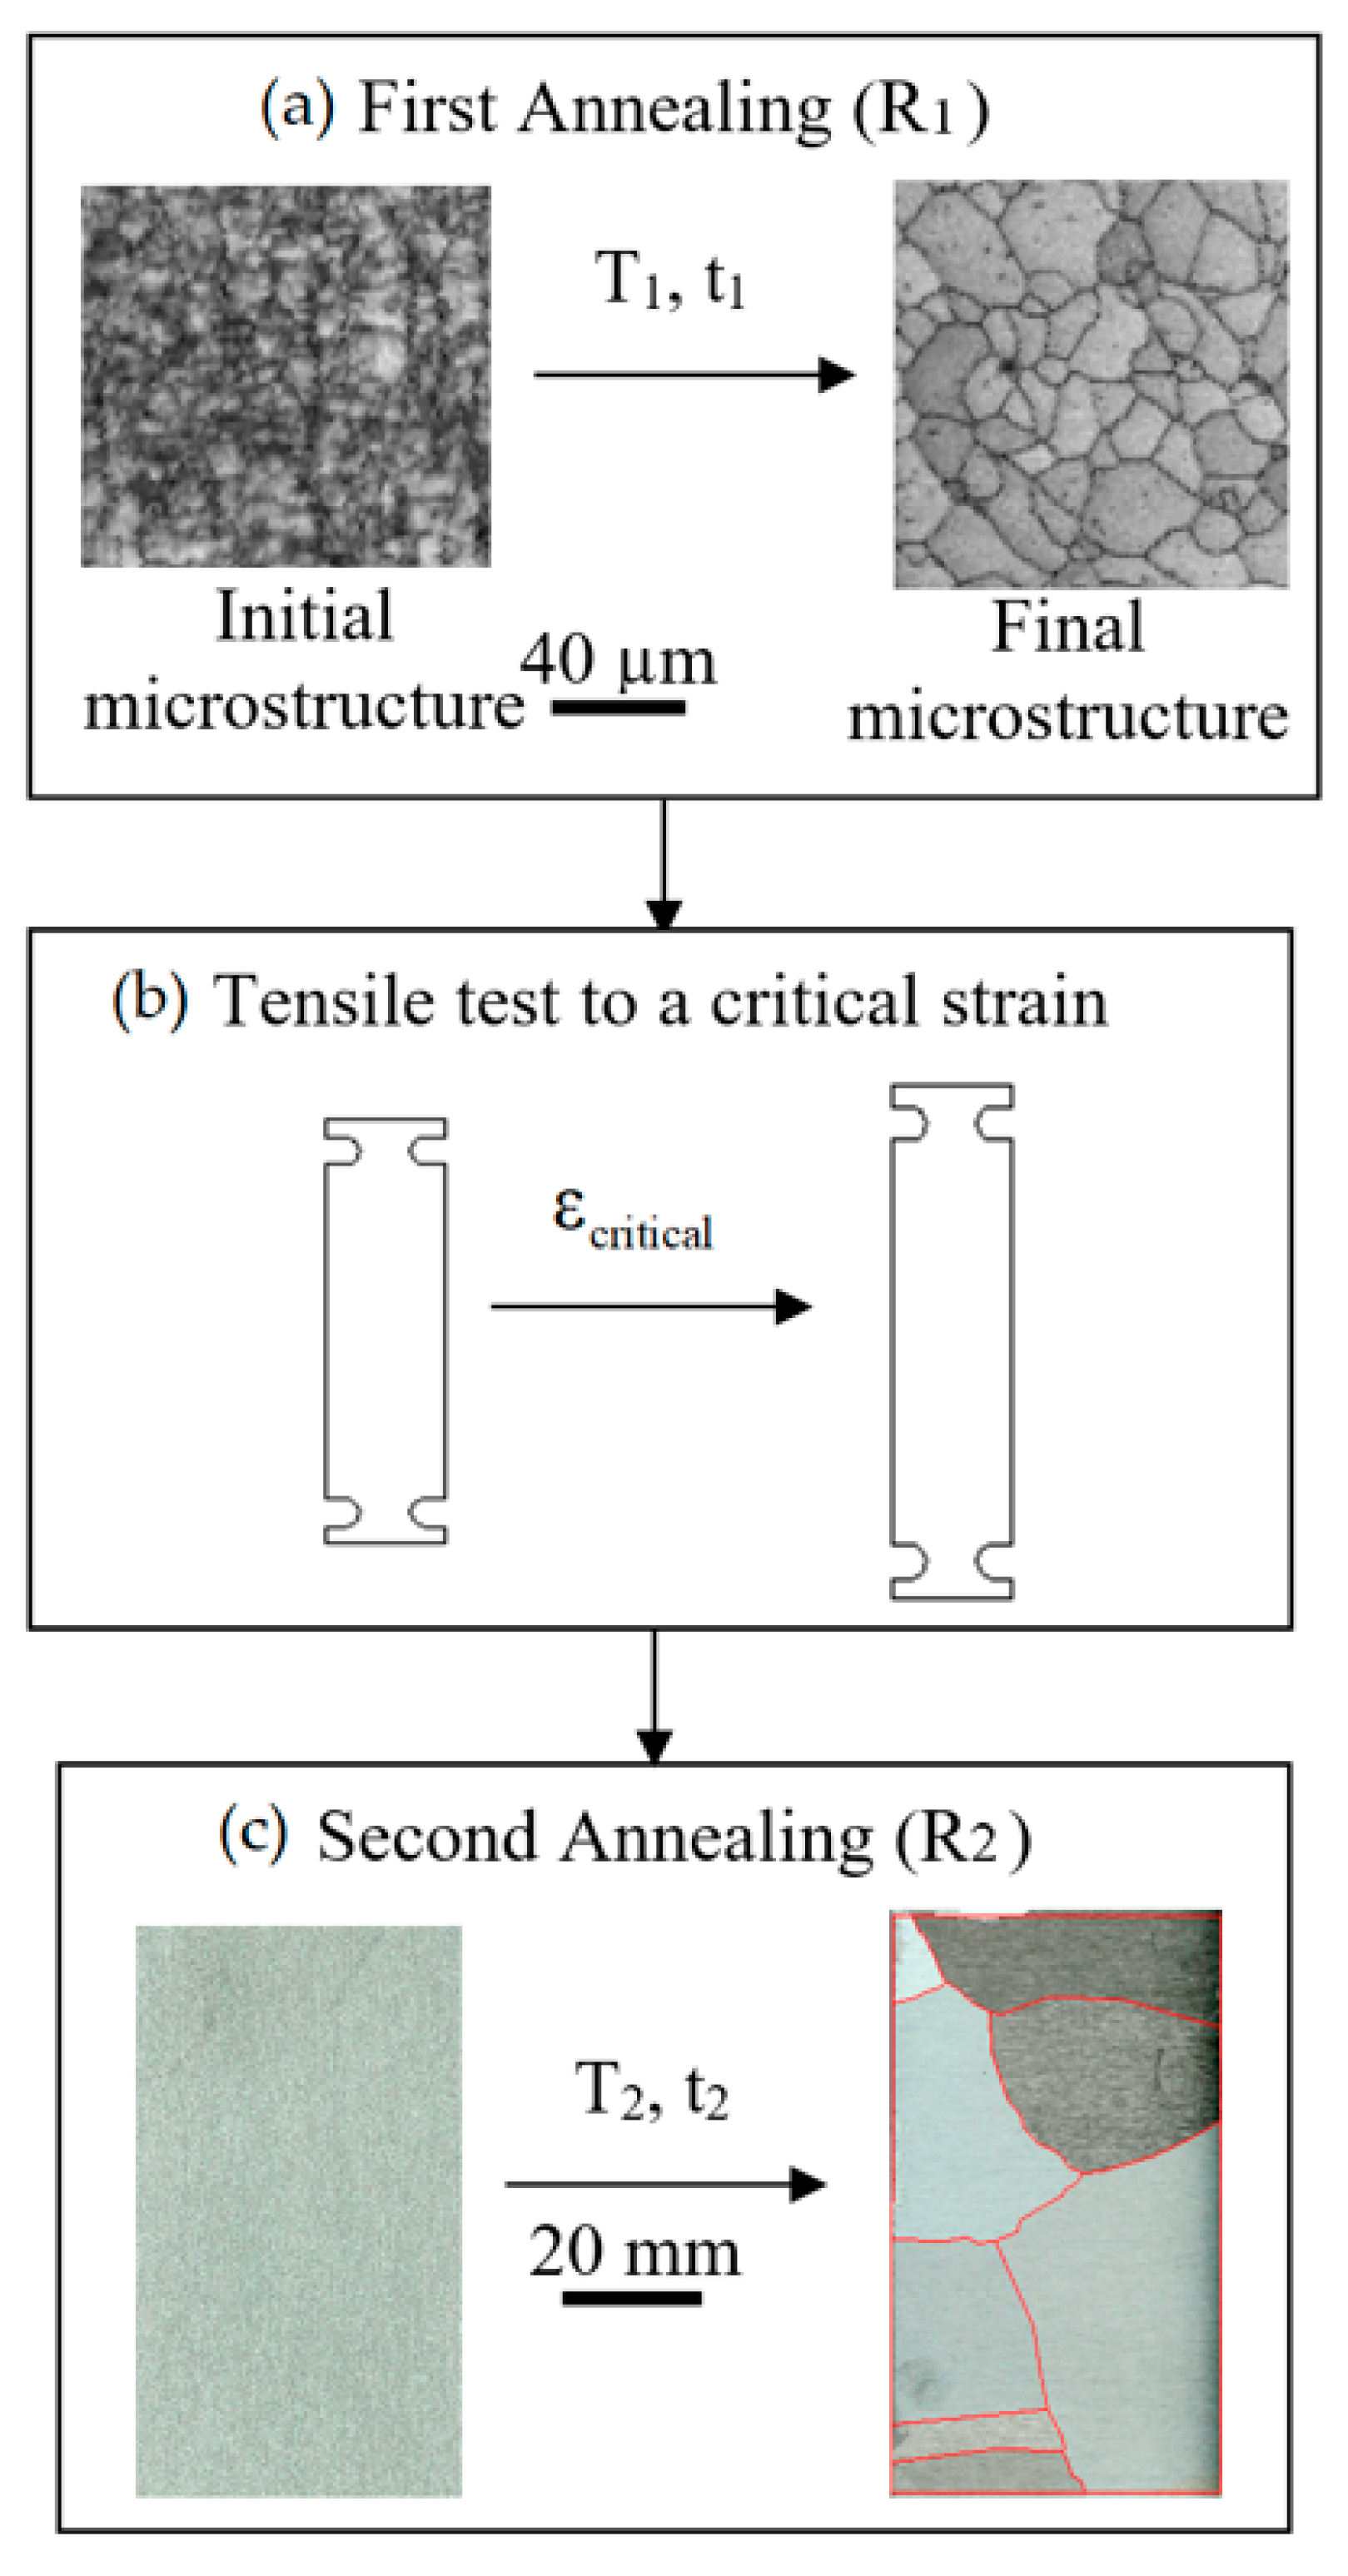
As shown in
Figure 1, the three steps to perform the CSA method are [
2]:
A large plastic straining by cold rolling (or extrusion) followed by a first annealing treatment (R1) called the “homogenization step”. The grain shape equiaxiality and the grain size homogeneity are checked using Electron Backscatter Diffraction (EBSD) image quality (IQ) mapping. This technique is used only at this stage.
A small plastic straining of these homogenized samples for introducing the necessary dislocations density to trigger further crystal growth from a few nuclei (seeds) during a second annealing treatment. The minimal value of strain producing such large crystals is called critical strain, and it strongly depends on the second annealing temperature.
A second annealing treatment (R
2), which makes the few seeds grow abnormally at the expense of the other crystals, so producing a multi-crystal, i.e., a sample containing only large crystals with accessible geometric and crystallographic characteristics. The structure of the centimeter-size grains (
Figure 1c) was revealed using a Flick’s reagent.
Consequently, the grain size at the end of the process depends mainly on five parameters: the temperature T1 and duration t1 of the homogenization annealing (R1), the applied plastic strain ε, and the temperature T2 and duration t2 of the growth annealing (R2). In the present work, the studied material is commercially pure aluminum (A1050—99.5 wt %) received as laminated sheets of 200 mm × 200 mm × 1 mm.
3. Procedure
The objective of this study is to ensure producing very large aluminum crystals with the CSA method from a minimum set of trial tests, by accurately approaching the optimal values of the five key parameters T1, t1, ε, T2, and t2. The following procedure is presented below:
Tensile tests are performed on trapezoidal samples to test a continuous range of critical strains at once with the same sample, so reducing the needed number of tests. On such samples, tensile tests generate a quasi-homogeneous axial strain gradient over a [εmin, εmax] range that can be fixed by choice of the sample trapezoidal dimensions.
Afterward, the minimal values of the two parameters of the annealing (R1) were determined.
Then, several trapezoidal samples were used to plot the recrystallization diagram, which gives the final size of the grains according to the three other parameters.
Finally, this diagram was used to manufacture the largest possible crystals.
3.1. Experimental Set-Up
The experimental set-up used for experiments consists of: (i) a laboratory oven for the annealing treatments (R1) and (R2), (ii) a scanning electron microscope (SEM) with Electron Backscatter Diffraction (EBSD) image quality (IQ) technique for checking the size and the shape equiaxiality of grains after the first annealing, (iii) a Flick’s reagent for revealing the structure of the large grains at the surface of the sample, (iv) a MTS 100 kN uniaxial test load frame for obtaining the hardening law of the A1050 aluminum after the annealing (R1), and for straining the trapezoidal samples, and (v) the software and the vision system used for the DIC.
3.1.1. DIC Set-Up and Software
The DIC technique was used for performing full-field strain measurements. The DIC vision system used in this study is a 4-megapixel Allied Vision Manta camera with an 8-bit grayscale resolution (i.e., 256 gray levels) of the CCD sensor. The camera position was in front of the surface of the sample. Desk lamps and fiber light guides were used for lighting the sample. The used DIC software is Aramis
® [
27]. Error estimation on the strain measurement was obtained by using the protocol consisting in applying to the sample a rigid body motion [
28]. As these strain fields must be equal to zero, the measured strains correspond to the error measurement fields. The mean value was around 0.1% for a grid pitch of 25 pixels.
3.1.2. Sample Preparation for DIC Measurements
The speckle was created at the surface of the sample by (i) applying a thin layer of white paint and (ii) followed by brief black paint jets to obtain a random speckle. Standard paints for metallic surfaces were used. The granulometry of the speckle is operator-dependent and may need many tries to obtain DIC measurements on the whole sample.
3.2. Sizing the Trapezoidal Samples and DIC Accurate Strain Measures
For each set of the annealing parameters (R
1) = (T
1, t
1) and (R
2) = (T
2, t
2), several values of strain ε must be tested to measure the corresponding final grain size. For each chosen parameter set (R
1, R
2), one trapezoidal specimen was deformed within a [ε
min, ε
max] strain range whose interval depends on the applied average strain and the sizes of the specimen bases. The specimens must be long enough to allow the growth of large grains for the different strains occurring along the specimen length. In order to save material and time, different dimensions of the trapezoidal specimens were tested through finite element simulations with Abaqus© software, such as to select an optimal shape. The material behavior data used in Abaqus© is the one given by the hardening curve shown in
Figure 2, which was experimentally obtained using a standard tensile test after the first annealing treatment at a temperature T
1 = 550 °C during t
1 = 2 h. The dimensions of the trapezoidal specimen were chosen from the profiles of axial strain along the specimen symmetry axis, as explained in
Appendix A. Moderate strain gradients were ensured by limiting the Δε = ε
max − ε
min intervals to 10%.
In order to obtain more accurate measurements of the strain along the axis of trapezoidal samples than from marking or etching lines or grids on the sample surface prior to straining [
16], one major originality of this work is the use of a full-field measurement method, namely the digital image correlation (DIC) technique [
29,
30]. The two key advantages of this technique are that: (i) the strain map is measured with an absolute error of less than 0.1%, and (ii) the strain is measured over thousands of points on the sample surface, i.e., the step of the measurement grid (distance between two measurement points) is equal to 1 mm when the size of the zone of interest is 200 mm × 40 mm.
3.3. Choice of the Parameters of the (R1) First Annealing
The homogenization annealing is defined by the two parameters (T1, t1). The first parameter to be determined is the minimum value of temperature T1, below which the coarse crystals do not develop or develop with the persistence of small grains inside them. Five temperatures T1 were tested between 350 °C to 550 °C during 24 h.
Once the temperature T1 was determined, five trapezoidal samples were maintained at this temperature for 30 min, 1 h, 2 h, 3 h, and 24 h, respectively. Then, EBSD (electron backscattering diffraction) analyses allowed the determination of the minimum value of the duration t1 to obtain a homogeneous microstructure with equiaxed micrometric grains.
3.4. Recrystallization Diagram and CSA Critical Strain Annealing
When using the CSA method, the recrystallization diagram is necessary to control the final size of the crystals. This diagram gives the size D = D(ε, T
2) of a recrystallized grain according to the applied strain ε during the tensile test and to the temperature T
2 of the second annealing, which are the two most influencing parameters. It can be plotted for each pure metal or alloy. The three other parameters (T
1, t
1, and t
2) are supposed to have reached their minimal values to generate large grains.
Figure 3 shows the procedure, which consists of using the images of the recrystallized grain structure and the axial strain map, to plot the recrystallization diagram for a given temperature of second annealing. For each new grain whose size is larger than 2 mm, the value of axial strain ε reached at its center (i.e., seed), and the size D of this grain g one point (ε, D), which is plotted on the size vs. strain graph. This graph is called the recrystallization diagram.
The full-field strain measurements are performed at the end of the tensile test using the DIC technique. The strain map is used to measure the strain undergone by the seeds before the beginning of the second annealing. Three second annealing (R2) temperatures were tested: 450 °C, 500 °C, and 550 °C. For each temperature, three trapezoidal specimens were deformed up to three different ranges of axial strain with small overlapping in order to obtain moderate strain gradients. Afterward, the three curves corresponding to the three tested temperatures were fitted to give the mean value of the final size of grains. Starting from these curves, a 3D recrystallization diagram in the (ε, T2, D) space was plotted.
4. Results and Discussion
4.1. Influence of the Homogenization Heat Treatment (R1)
4.1.1. Influence of the Homogenization Temperature T1
In order to study the influence of the temperature of the first annealing, five trapezoidal samples were maintained for 2 h at the temperatures of 356 °C, 398 °C, 440 °C, 495 °C, and 550 °C, respectively, numbered from 1 to 5. Afterward, they were deformed to cover approximately a strain range from 2.3% to 5% in each sample. Finally, the second annealing was carried out at 550 °C for 24 h.
For samples 1 and 2, whose temperatures of first annealing are the lowest, one can observe in
Figure 4 that after the second annealing, high densities of unabsorbed or parasitic crystals remain on a major part of the surfaces. Moreover, it is difficult to distinguish the boundaries of the large crystals. For samples 3 and 4, there are always many small residual crystals in the least deformed zones (large base end side) and a less significant number in the most deformed zones. One can distinguish the structure of large crystals, but their boundaries are not smooth. Sample 5 (550 °C) presents the largest crystals with smoother boundaries, and the density of unabsorbed crystals is the lowest. Consequently, the value of 550 °C for the temperature T
1 of homogenization heat treatment was retained for all following tests.
4.1.2. Influence of the Homogenization Duration t1
Once the temperature T
1 of the first annealing was chosen, the next step was the determination of the minimal t
1 duration of this homogenization heat treatment.
Figure 5a shows the microstructure of the as-received material. The work hardening undergone during cold-rolling seems to be very important. EBSD analyses were performed on five trapezoidal samples, which were maintained at 550 °C during the following durations: 30 min, 1 h, 2 h, 3 h, and 24 h, respectively, numbered from 1 to 5.
Figure 5b shows that from 2 h of homogenization heat treatment, the formation of equiaxed grains was completed. This duration also allows for obtaining large grains after the second annealing. The retained T
1, t
1 parameter pair for the annealing (R
1) is (550 °C, 2 h).
4.2. Influence of the Duration of the Growth Heat Treatment (R2)
The volume of the recrystallized region during the second annealing depends on the duration of this heat treatment. The study of this effect was carried out with a trapezoidal sample that had undergone first annealing at 500 °C for 2 h, then a tensile test generating strains ranging between 1.8% and 3.5%.
Afterward, the second annealing was performed in two stages. First, the sample was maintained at 550 °C for 2 h (
Figure 6a). The most deformed part of the specimen (small base end) completed its recrystallization, and only large grains are visible with a low density of unabsorbed grains. This area covers approximately a quarter of the sample surface. The weaker the deformations are, the more the density of the small unabsorbed grains is high. The area with small unabsorbed grains covers more than half of the sample. During the second stage, this sample was maintained at the same temperature of 550 °C for 18 additional hours. After a new Flick’s reagent etching to reveal the grains, four observations can be made (
Figure 6b): (i) the structure of the large grains observed after the first stage did not evolve; (ii) new grains appeared in the middle half of the sample, and they are larger than those obtained after the first stage; (iii) small grains were absorbed in the large grains; and (iv) but they were not absorbed in the less deformed region (large base end) because the strain values are lower than the critical strain. The retained T
2, t
2 parameter pair for the growth annealing (R
2) is (550 °C, 24 h).
4.3. Recrystallization Diagram—Critical Strain
For a given temperature T
2 of the growth annealing, the two-dimensional (D, ε) recrystallization diagram gives the size D of a new grain as a function of the applied strain ε. This diagram was plotted for three temperatures (450 °C, 500 °C, and 550 °C) and a strain range going from 1.5% to 11.9%. To cover this strain range with enough area for the growth of large grains, three trapezoidal samples were used for each temperature. These samples were deformed up to three overlapping strain ranges (
Figure 7), i.e., [1.5; 3.2], [2.2; 7.1], and [3.7; 11.9] %. In
Figure 7c, the region at the surface of the sample where the strain is less than 2.2% did not contain large grains. This means that the critical strain value for 550 °C is 2.2%.
After the second annealing, the size D of all the new grains larger than 2 mm was plotted versus the measured strain ε at the center of the corresponding grain (cf.
Figure 3). Each set of points obtained for one temperature T
2 of growth annealing was used to fit the corresponding curve (
Figure 8).
These three fitted curves allowed building of a surface which is a 3D recrystallization diagram (
Figure 9). The critical strain is defined as the lowest value of strain for which large grains appear.
The obtained recrystallization diagram shows that the critical strain depends on the growth annealing temperature. The abnormal grain growth is due to a Strain-Induced grain Boundary Migration (SIBM) which is thermally activated. Greater is the annealing temperature, greater is the number of grains whose grow abnormally, and smaller will be the final mean size of the grains. For the tested temperatures 450 °C, 500 °C, and 550 °C, the values of critical strain at which the largest observed grains reach, respectively, 40 mm, 60 mm, and 100 mm from
Figure 8, are, respectively, 3.4%, 3.8%, and 2.2%, approximately. This approximation is due to the difficulty of determining the seed position for large grains. An improvement of this protocol will consist in interrupting the second annealing (e.g., every 10 min) in order to increase the accuracy of the seed position and, consequently, on the value of the pre-strain that occurred before the grain growth.
4.4. Fabrication of a Large-Grain Aluminum Multi-Crystal
The parameters of the fabrication of large-grain (several centimeters) aluminum multi-crystals using the critical strain-annealing method were verified by performing a test on a rectangular specimen 160 mm × 50 mm (quasi-homogeneous strain). After a homogenization annealing (R
1) (550 °C, 2 h), a tensile test was carried out up to a strain of
, prior to a growth annealing (R
2) (550 °C, 24 h).
Figure 10 shows the obtained multi-crystal that exhibits three large grains with labels A, B, and C of 70 mm, 55 mm, and 35 mm in length, respectively. These sizes agree with the recrystallization diagram, which gives a mean value of 50 mm. This result is compared with those shown in
Table 1. The largest aluminum crystals obtained by the CSA method have a size of 70–80 mm [
2,
20], but the duration of their fabrication was between 2 and 10 days.
4.5. Difficulties and Future Improvement of the Method
The presented method has to face two specific difficulties: (i) the very low strength of pure metals requires careful handling all along the various manipulations, especially at high temperatures, and (ii) when the closer to the critical strain is the applied strain, the larger are the grains in the strained sample and the fewer are these grains. Therefore, the trapezoidal and/or standard tensile test samples must be larger than the actual reachable grain size. With enough points, the recrystallization 3D diagram can be fitted with better accuracy of the final grain size as a function of the applied pre-strain and the annealing temperature T2.
5. Conclusions
This paper has presented an improvement of the CSA method, which consists of the use of the digital image correlation (DIC) technique to enhance the accuracy (less than 0.1%) of the measurement of the applied pre-strain. The maps of this strain make possible rapid and accurate plotting of the recrystallization 3D diagram for the A1050 aluminum. The main results of this study are: (i) the repeatability of the experiments given the number of tested samples, (ii) The use of this diagram allowed to obtain larger grains (70 mm × 30 mm) than most studies found in the presented literature, and with (iii) significantly shortened duration of the whole process (less than 30 h) of the fabrication of large grains from cheap aluminum sheets. This new protocol can be used in case of a change in the purity grade of the metal and/or of its chemical composition, making easier the production of metallic crystals with a chosen mean grain size.
Author Contributions
Conceptualization, H.H.; Methodology, H.H.; Validation, H.H.; Investigation, H.H.; Resources, H.H.; Data curation, H.-S.T.; Writing—original draft, H.H. and H.-S.T.; Writing—review & editing, P.F.; Supervision, H.H.; Project administration, H.H. All authors have read and agreed to the published version of the manuscript.
Funding
This research received no external funding.
Data Availability Statement
The data presented in this study are available on request from the corresponding author.
Conflicts of Interest
The authors declare no conflict of interest.
Appendix A. Specimen Shape Optimization from Finite Element Analysis
The simplest specimen shape that generates heterogeneous strain field is an isosceles trapezoid with length L
0, large base B, and small base b. The values of L
0 and B were fixed at 160 mm and 50 mm, respectively, due to the size of aluminum sheets which was 200 mm × 200 mm, and to a minimal value of the aspect ratio L
0/B which is 4 for a tensile test. Thus, the total length of the samples is 200 mm, but the length of the deformed region is 160 mm as 20 mm at each end of the sample are hidden by the grips of the tensile test device. The value of b was selected from three finite element analyses of the tensile test on such a specimen with b equal to 30 mm, 35 mm, and 40 mm. These specimens are numbered from 1 to 3, respectively. Previously, a tensile test of a standard specimen was carried out to obtain the work-hardening curve presented on
Figure 2. This curve was used as the mechanical properties data of the material in the numerical finite element simulations performed with Abaqus© software. The maps of the simulated axial strain ε
yy are represented in
Figure A1, and the profiles of the same strain along the axis of symmetry of the specimen are shown in
Figure A2.
Specimen 1 (160 × 50 × 30 mm) presented a strong localization of the strain, greater than 20%, at the small base end when the rest of the specimen deformed less than 2%. Specimen 2 (160 × 50 × 35 mm) presented a weaker localization, but it covered a too-large [2.3–10.8%] strain range. Specimen 3, whose dimensions are 160 × 50 × 40 mm, made it possible to obtain a moderate [2.7–8.1%] strain range. This last geometry was retained for the study.
Figure A1.
Numerical simulations of tensile tests on commercially pure aluminum: Longitudinal strain fields for the three trapezoidal specimens having the same large base wide of 50 mm, and length of 160 mm, and different small base size: (a) 30 mm, (b) 35 mm, and (c) 40 mm.
Figure A1.
Numerical simulations of tensile tests on commercially pure aluminum: Longitudinal strain fields for the three trapezoidal specimens having the same large base wide of 50 mm, and length of 160 mm, and different small base size: (a) 30 mm, (b) 35 mm, and (c) 40 mm.
Figure A2.
Finite element analyses of tensile tests: profiles of the axial strain along the symmetry axis of the specimen for 160mm length L0, 50 mm wide of large base B, and three different values of the small base wide b (30 mm, 35 mm, and 40 mm).
Figure A2.
Finite element analyses of tensile tests: profiles of the axial strain along the symmetry axis of the specimen for 160mm length L0, 50 mm wide of large base B, and three different values of the small base wide b (30 mm, 35 mm, and 40 mm).
References
- Elam, C.F. Tensile Tests of Large Gold, Silver and Copper Crystals. Proc. R. Soc. Lond. Ser. A Contain. Pap. Math. Phys. Character 1926, 112, 289–296. [Google Scholar]
- Carpenter, H.C.H.; Elam, C.F. The Production of Single Crystals of Aluminium and their Tensile Properties. Proc. R. Soc. Lond. Ser. A Contain. Pap. Math. Phys. Character 1921, 100, 329–353. [Google Scholar]
- Lee, S.B.; Yoon, D.Y.; Henry, M.F. Abnormal grain growth and grain boundary faceting in a model Ni-based superalloy. Acta Mater. 2000, 48, 3071–3080. [Google Scholar] [CrossRef]
- Dennis, J.; Bate, P.S.; Humphreys, F.J. Abnormal grain growth in Al–3.5Cu. Acta Mater. 2009, 57, 4539–4547. [Google Scholar] [CrossRef]
- Jin, S.; Kang, B.; Kong, T.; Hong, S.H.; Shin, H.-J.; Ruoff, R.S. Strain-induced abnormal grain growth of Fe foils. J. Alloys Compd. 2021, 853, 157390. [Google Scholar] [CrossRef]
- Gil, F.J.; Planell, J.A. Behaviour of normal grain growth kinetics in single phase titanium and titanium alloys. Mater. Sci. Eng. A 2000, 283, 17–24. [Google Scholar] [CrossRef]
- Hayama, A.O.F.; Sandim, H.R.Z. Annealing behavior of coarse-grained titanium deformed by cold rolling. Mater. Sci. Eng. A 2006, 418, 182–192. [Google Scholar] [CrossRef]
- Chaubet, D.; Beucia, W.; Franciosi, P.; Bacroix, B. Influence of a pre-deformation on the growth of titanium multicrystals. J. Phys. Conf. Ser. 2019, 1270, 012045. [Google Scholar] [CrossRef]
- Daniel, L.; Rekik, M.; Hubert, O. A multiscale model for magneto-elastic behaviour including hysteresis effects. Arch. Appl. Mech. 2014, 84, 1307–1323. [Google Scholar] [CrossRef] [Green Version]
- Guo, Y.; Lee, Y.J.; Zhang, Y.; Wang, H. Magneto-plasticity in micro-cutting of single-crystal copper. J. Mater. Sci. Technol. 2022, 124, 121–134. [Google Scholar] [CrossRef]
- Rios, P.R.; Siciliano, F., Jr.; Sandim, H.R.Z.; Plaut, R.L.; Padilha, A.F. Nucleation and Growth during Recrystallization. Mater. Res. 2005, 8, 225–238. [Google Scholar] [CrossRef] [Green Version]
- Couterne, J.C.; Cizeron, G. Comportement dilatométrique de monocristaux de zirconium et application a la mesure des coefficients moyens d’expansion thermique suivant les axes principaux. J. Nucl. Mater. 1969, 32, 310–321. [Google Scholar] [CrossRef]
- Edwards, C.A.; Pfeil, L.B. The production of large crystals by annealing strained iron. J. Iron Steel Inst. 1924, 109, 129–147. [Google Scholar]
- Taylor, G.I.; Elam, C.F. The Distortion of Iron Crystals. Proc. R. Soc. Lond. Ser. A Contain. Pap. Math. Phys. Character 1926, 112, 337–361. [Google Scholar]
- Chaudron, G.; Salesse, M. Cold-Working, Recovery, Recrystallization; Presses universitaires de France: Paris, France, 1963. [Google Scholar]
- Bailey, D.J.; Brewer, E.G. Improved strain-anneal crystal growth technique. Metall. Trans. A 1975, 6, 403–408. [Google Scholar] [CrossRef]
- Lubitz, K.; Goltz, G. The Preparation of Large Spherical Iron Single Crystals. Appl. Phys. 1979, 19, 237–239. [Google Scholar] [CrossRef]
- Lashley, J.C.; Stout, M.G.; Pereyra, R.A.; Blau, M.S.; Embury, J.D. The Critical Recrystallization Strain of Plutonium. Scr. Mater. 2001, 44, 2815–2820. [Google Scholar] [CrossRef]
- Churchman, A.T. Preparation of Single Crystals of Titanium and their Mode of Deformation. Nature 1953, 171, 706. [Google Scholar] [CrossRef]
- Yao, Z.; Wagoner, R.H. Active Slip in Aluminum Multi-crystals. Acta Metall. Mater. 1993, 41, 451–468. [Google Scholar] [CrossRef]
- Omori, T.; Kusama, T.; Kawata, S.; Ohnuma, I.; Sutou, Y.; Araki, Y.; Ishida, K.; Kainuma, R. Abnormal Grain Growth Induced by Cyclic Heat Treatment. Science 2013, 341, 1500–1502. [Google Scholar] [CrossRef]
- Dumoulin, S. De l’utilisation d’une loi monocristalline en vue de la caractérisation du comportement plastique du multicristal d’aluminium. Ph.D. Thesis, Université de Savoie, Chambéry, France, 2001. [Google Scholar]
- Saai, A. Modèle Physique de la Plasticité D’Un Cristal Métallique Cfc Sousmis à Des Charges Alternés: Constribution à la Définition D’Une Modélisation Multiéchelles de la Mises en Forme de Métaux. Ph.D. Thesis, Université de Savoie, Chambéry, France, 2007. [Google Scholar]
- Zhao, Z.; Ramesh, M.; Raabe, D.; Cuitino, A.M.; Radovitzky, R. Investigation of Three-Dimensional Aspects of Grain-Scale Plastic Surface Deformation of an Aluminum Oligocrystal. Int. J. Plast. 2008, 24, 2278–2297. [Google Scholar] [CrossRef]
- Wang, X.G.; Witz, J.F.; El Bartali, A.; Dufrénoy, P.; Charkaluk, E. Investigation of grain-scale surface deformation of a pure aluminium polycrystal through kinematic-thermal full-field coupling measurement. In Proceedings of the 13th International Conference on Fracture, Beijing, China, 16–21 June 2013. [Google Scholar]
- Li, L.; Muracciole, J.-M.; Sabatier, L.; Waltz, L.; Wattrisse, B. Analysis of the Thermomechanical Behavior of Coarse-Grained Polycrystalline Aluminium under Tensile Conditions. In Proceedings of the International Conference Photomechanics, Montpellier, France, 27–29 May 2013. [Google Scholar]
- GOM Optical Measuring Techniques. ARAMIS User Manual. Available online: www.gom.com (accessed on 17 May 2023).
- Haddadi, H.; Belhabib, S. Use of rigid-body motion for investigation and estimation of the measurement errors related to digital photograph correlation technique. Opt. Lasers Eng. 2008, 46, 184–196. [Google Scholar] [CrossRef]
- Belhabib, S.; Haddadi, H.; Gaspérini, M.; Vacher, P. Heterogeneous tensile test on elastoplastic metallic sheets: Comparison between FEM simulations and full-field strain measurements. Int. J. Mech. Sci. 2008, 50, 14–21. [Google Scholar] [CrossRef]
- Sutton, M.A.; Wolters, W.J.; Peters, W.H.; Ranson, W.F.; Mcneill, S.R. Determination of displacements using an improved digital correlation method. Image Visi Comput. 1983, 3, 133–139. [Google Scholar] [CrossRef]
Figure 1.
Main steps of critical strain-annealing (CSA) method. (a) First Annealing (R1), initial, and final microstructure images were obtained with Electron Backscatter Diffraction (EBSD) image quality (IQ) mapping, (b) Tensile test to a critical strain, (c) second annealing (R2), the structure of large grains in tensile test sample is imaged with an optical camera.
Figure 2.
True stress versus true plastic strain behavior of commercially pure A1050 aluminum after the first annealing treatment.
Figure 2.
True stress versus true plastic strain behavior of commercially pure A1050 aluminum after the first annealing treatment.
Figure 3.
Principle of plotting a recrystallization diagram. Each coarse grain generates one point on the ε-D graph: (a) measurement of grain’s size D from the shape of grains after Flick’s solution etching, (b) full-field axial strain measurement used for the determination of the reached strain ε in the center of the new grain.
Figure 4.
Effect of the temperature T1 (between 356 °C and 550 °C) of the first annealing on the quality of the multi-crystal samples obtained after a strain range of [2.3%; 5%] and a second annealing at 550 °C during 24 h: density of unabsorbed small crystals and roughness of the grain boundaries decrease with T1.
Figure 5.
Commercially pure aluminum (A1050) microstructures analyzed with EBSD technique: (a) as-received material, (b) after a homogenization thermal treatment at 550 °C during 2 h. Initial and final microstructure images were obtained with Electron Backscatter Diffraction (EBSD) image quality (IQ) mapping.
Figure 6.
Effect of the duration of the second annealing on the recrystallization of the aluminum sample after first annealing of 2 h at 550 °C and a tensile test up to [1.8%; 3.5%] strain range: (a) followed by 2 h of second annealing at 550 °C, (b) same sample with 18 h additional annealing at 550 °C.
Figure 7.
Tensile test of three A1050 aluminum trapezoidal specimens. The structure of final grains and the longitudinal strain maps after an elongation of: (a) 12 mm, (b) 8 mm, and (c) 4 mm, followed by a second annealing at T2 = 550 °C during 24 h.
Figure 7.
Tensile test of three A1050 aluminum trapezoidal specimens. The structure of final grains and the longitudinal strain maps after an elongation of: (a) 12 mm, (b) 8 mm, and (c) 4 mm, followed by a second annealing at T2 = 550 °C during 24 h.
Figure 8.
The 2D recrystallization diagrams of three temperatures: Variation of the final grain size as function of the applied strain (second annealing at 450 °C, 500 °C, and 550 °C for 24 h). The scheme shows the critical strain value and the temperature condition to obtain maximal grain size.
Figure 8.
The 2D recrystallization diagrams of three temperatures: Variation of the final grain size as function of the applied strain (second annealing at 450 °C, 500 °C, and 550 °C for 24 h). The scheme shows the critical strain value and the temperature condition to obtain maximal grain size.
Figure 9.
3D recrystallization diagram of an A1050 commercially pure aluminum (99.5%).
Figure 9.
3D recrystallization diagram of an A1050 commercially pure aluminum (99.5%).
Figure 10.
The structure and sizes of grains from the DIC assisted CSA method applied to A1050 commercially pure aluminum, for the parameter set ((550 °C, 2 h), 3%, (550 °C, 24 h)).
Figure 10.
The structure and sizes of grains from the DIC assisted CSA method applied to A1050 commercially pure aluminum, for the parameter set ((550 °C, 2 h), 3%, (550 °C, 24 h)).
Table 1.
The literature values of the parameters used in the CSA method to grow single crystals from aluminum have different degrees of purity.
Table 1.
The literature values of the parameters used in the CSA method to grow single crystals from aluminum have different degrees of purity.
| Reference | First Annealing
Temperature/Duration | Critical Strain/Purity | Second Annealing Temperature/Duration | Final Grain Size |
|---|
| Carpenter and Elam 1921 [2] | 550 °C/6 h | 2%/99.6% | 600 °C/2–3 days | 80 mm |
| Yao and Wagoner 1993 [20] | No treatment | 2%/99.99% | 600 °C/7–10 days | 70 mm |
| Dumoulin 2001 [22] | 510 °C/30 min | 0.8–1.2%/99.5%,
2–3%/99.99% | 550 °C/60 min | 5–40 mm |
| Saai 2007 [23] | 550 °C/45 min | 1.8–3.2%/99.5% | 600 °C/2 h | 30 mm |
| Zhao et al., 2008 [24] | no treatment | rolled sheet/99.99% | 600 °C/2 days | 10 mm |
| Wang 2013 [25] | 545 °C/60 min | 3.5%/99.99% | 545 °C/60 min | 20 mm |
| Li 2013 [26] | 560 °C/60 min | 1.8%/99.5% | 620 °C/60 min | 20 mm |
| Disclaimer/Publisher’s Note: The statements, opinions and data contained in all publications are solely those of the individual author(s) and contributor(s) and not of MDPI and/or the editor(s). MDPI and/or the editor(s) disclaim responsibility for any injury to people or property resulting from any ideas, methods, instructions or products referred to in the content. |
© 2023 by the authors. Licensee MDPI, Basel, Switzerland. This article is an open access article distributed under the terms and conditions of the Creative Commons Attribution (CC BY) license (https://creativecommons.org/licenses/by/4.0/).


