Abstract
Agate attracts the attention of gem mineralogists because of its variable colors. The color of agate is closely related to its naming and classification, so it is necessary to study the color and mineral origin of agate. In this paper, the mineralogical characteristics and color origin of red, yellow and green Moqi agates from Inner Mongolia were systematically studied by means of Fourier transform infrared spectrometer, Raman spectrometer, X-ray powder diffractometer, electron probe microanalyzer and ultraviolet–visible spectrophotometer. It is found that the color of Moqi agate is related to the minerals and trace elements contained in it, and is associated with the electron transition or charge transfer of Fe ions in the contained minerals. Green agate has the highest Fe content, and its color is caused by celadonite inclusions. The red and yellow color in Moqi agate is mainly caused by hematite and goethite, while red agate contains more Fe than yellow agate. Raman spectroscopy and X-ray diffraction analysis show that the content of moganite in Moqi agate is 0–30%. It is calculated that the crystallinity of Moqi agate is 1.5–3.5. This work provides a theoretical basis for future research on the identification of Moqi agate.
1. Introduction
Agate is mainly composed of silicon dioxide. In petromineralogy, the cryptocrystalline quartz aggregate is called chalcedony. Generally, the so-called agates are mainly banded aggregates of chalcedony, a subspecies of fibrous cryptocrystalline silica [1].
The formation of agate is primarily associated with volcanic magmatism. During the migration of sodium metasilicate and potassium metasilicate ore solutions, hydrous silica colloid undergoes decomposition and precipitation, gradually transforming into agate through subsequent dehydration and carbonization processes [2]. Göetz conducted oxygen isotope research on diverse and representative agate samples from various global origins. The findings indicate that the formation temperature of agate is approximately 150 °C [3]. Furthermore, it is emphasized that the agate material formed within volcanic rocks primarily derives from the composition of the surrounding wall rocks [4,5].
The color of agate is influenced by trace elements and structure. It cannot be assumed that a single factor completely determines the color of a mineral. Zhou specifically analyzed the origin of Nanhong agate’s color [6,7]. Most scholars believe that Nanhong agate is mainly colored by inclusions. In addition, Zhu believes that some trace elements can also affect the color formation of Nanhong agate. For example, a relatively high content of Mn leads to a darker color of agate [8]. The red depth and brightness of agate are positively correlated with the mass fraction of Fe. An increase or decrease in Fe, Mn, Co and V content in agate is related to the change in color [9]. When the mineral changes from granular to columnar to fibrous, the gap between mineral particles becomes smaller and smaller, and the transparency of agate increases accordingly; on the contrary, the transparency decreases. The content of hematite also affects the transparency of agate: the more hematite, the lower transparency of agate [10]. Therefore, it is necessary to study the trace elements and structure of agate. However, there is no report about Moqi agate from Inner Mongolia in China.
Accordingly, X-ray diffractometry (XRD), Raman and UV–visible analyses, and other technologies were employed in this study to investigate the origin, mineralogy and coloration of Moqi agate. The relationship between the crystallinity of Moqi agate and moganite content is described. The results show that the content of moganite in Moqi agate is 0–30%. This research provides a theoretical basis for future research on the identification of Moqi agate.
2. Materials and Methods
2.1. Agate Sample
Through the investigation of agate raw stones collected in Moqi, Inner Mongolia, it was found that the agate raw stones from Moqi, Inner Mongolia, are egg shaped. There is a darker and thicker oxide layer outside. The overall size is small (average size is 3.3 cm × 2.3 cm), and the color is rich. The colors found include yellow, green, gray, red, etc. The color of the center is mainly yellow green, green, pink purple, and the outside of the color ring is mainly purple, red purple and brown red. According to the color, the samples are divided into AG-1~AG-2, AR-1~AR-3 and AY-1~AY-3. The selected sample pictures are shown in Figure 1, and the appearance and morphological characteristics are described in Table S1.
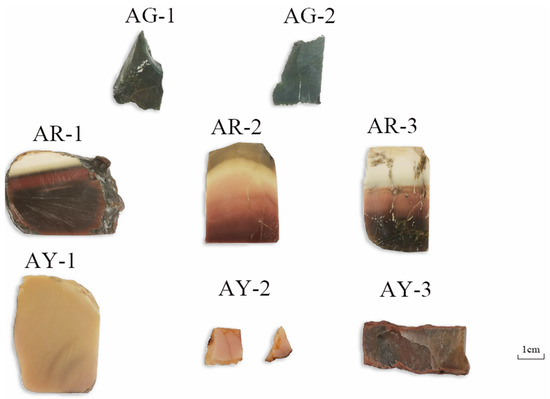
Figure 1.
Appearance of the agate samples.
2.2. Methods
Microscopic observation was completed by using an Olympus microscope (BX 51) in the laboratory at the School of Gemology, China University of Geosciences, Beijing.
The infrared spectra test adopted the Tensor 27 Fourier infrared spectrometer and transmission method. The test conditions were as follows: test voltage, 220 V; resolution, 4 cm−1; scanning range, 2000–400 cm−1; and scanning speed, 10 kHz.
The UV-3600 UV–visible spectrophotometer produced by Shimadzu Factory in Japan was used. The experimental wavelength ranged from 200 to 800 nm and the time constant was 0.1 s.
An HR Evolution Raman microscope produced by Horiba in Japan was used. The test conditions were as follows: excitation light source, 532 nm; grating, 600 (500 nm); test range, 1500–200 cm−1; and integration time, 3 s.
The powder XRD results were obtained by using an X’Pert PRO MRD powder diffractometer. The test conditions were as follows: copper target; Kα radiation source (λ = 0.15, 418 nm); tube voltage, 40 kV; tube current, 100 mA; divergence gap and scattering gap on the goniometer, 1°; scanning speed, 4°/min; and sampling step, 0.02° (2θ) with a 20–90° range.
The scanning electron microscope experiment was carried out in the electron microscope laboratory of Beijing KeHui Testing Technology. The sample surface was plated with platinum during the experiment. The electron microscope used has 0.8 nm resolution and a 0.1–30 kV acceleration voltage; the experimental voltage was 30 kV.
An EPMA-1720 electron probe instrument manufactured by the Shimadzu Manufacturing Plant in Japan was used for the test. The test parameters of the instrument were as follows: excitation current, 10 nA; excitation voltage, 15 kV; excitation time, 10 s; excitation beam spot diameter, 5 μm; and ZAF3 calibration method.
3. Results and Discussion
3.1. Polarization Inspection
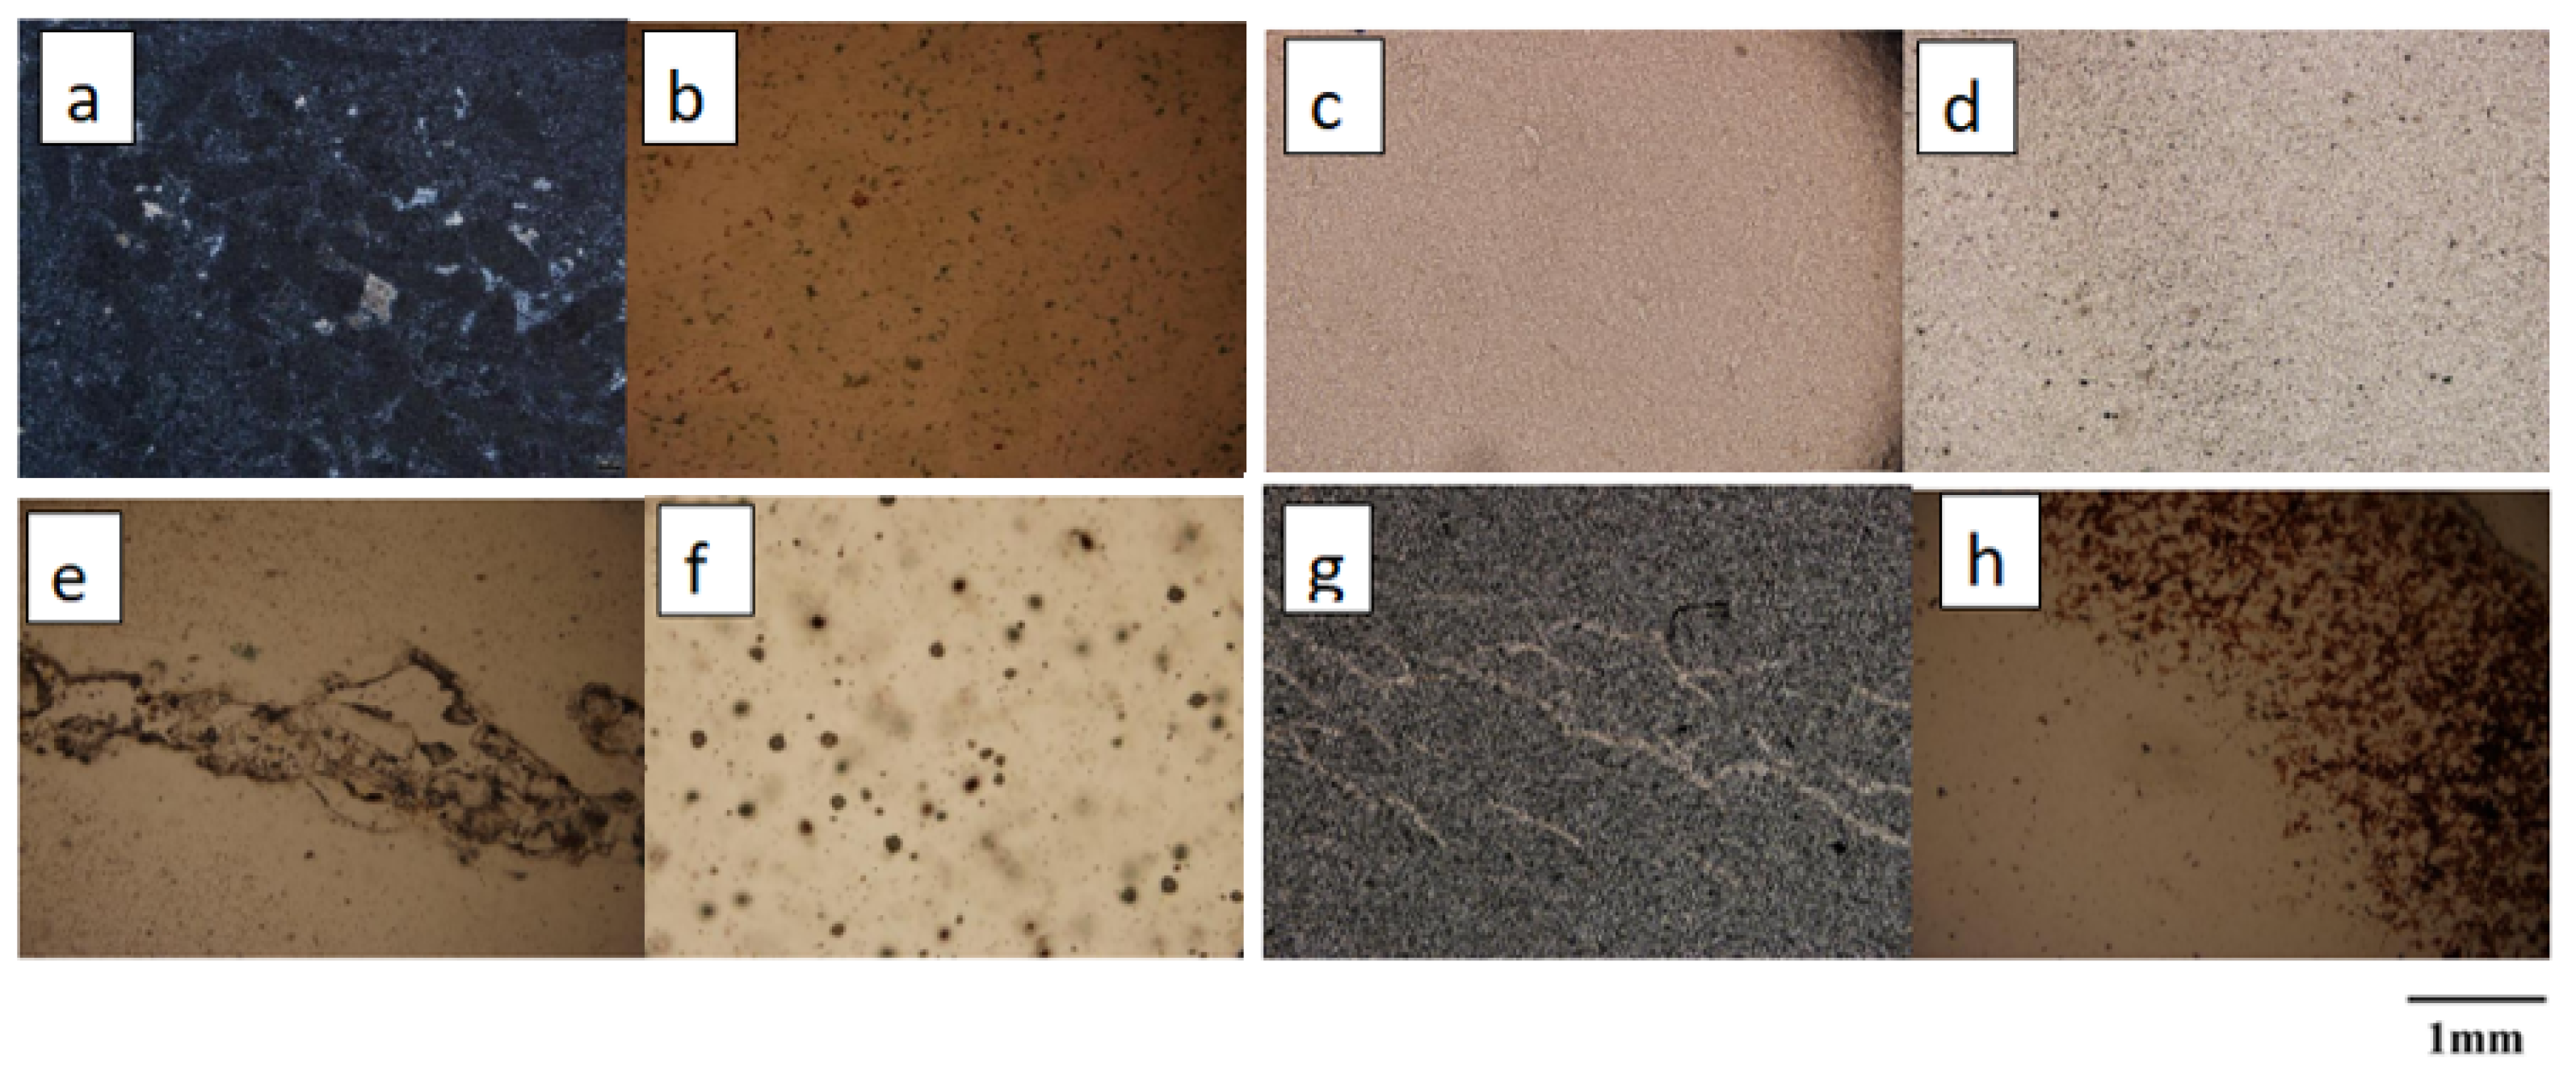
As shown in Figure 2, a total of eight pieces of Moqi agate samples with characteristic morphology were selected, which are designated AG-1, AG-2, AR-1, AR-2, AR-3, AY-1, AY-2 and AY-3. The polarizing microscope used in this experiment was the instrument in the Gemstone Research Laboratory, China University of Geosciences, Beijing. The instrument model is BX-51, and the photographic equipment is OLYMPUS.

Figure 2.
Microscopic characteristics of the agate samples in 15×: (a,b) are dark minerals in AG-1 and AG-2; (c) is a very fine equigranular structure in AR-1; (d) is granular structure in AR-2; (e) is the invasion of AR-3; (f) is the point inclusion in AY-1; (g) is vein-like intrusion in AY-2; (h) is red dip at the edge of AY-3.
The main mineral in all eight samples is quartz. Under polarized light microscopy, samples AG-1 and AG-2 of the green group exhibit a large number of dark inclusions, and it is assumed that the green color of the agate is due to its internal mineral inclusions. The red sample AR-1 has a very fine equigranular structure; AR-2 has a fine equigranular structure and punctate inclusions, so we presume that the color of AR-2 is due to the fine punctate minerals within it; AR-3 is equigranular and the vein intrusions indicate that the quartz was formed in multiple phases. The yellow sample AY-1 exhibits a uniform yellow color with a fine texture. It is unequally granular under polarized light and a concentration of point minerals with color enrichment can be observed. We presume that sample AY-1 is the observed point mineral coloring; sample AY-2 shows internal vein-like intrusions, revealing multiple phases in the formation of the agate sample; sample AY-3 has a fine equigranular structure with a red dip at the edge, and in conjunction with previous studies, we presume that the red mineral is hematite [11].
3.2. Infrared Spectra
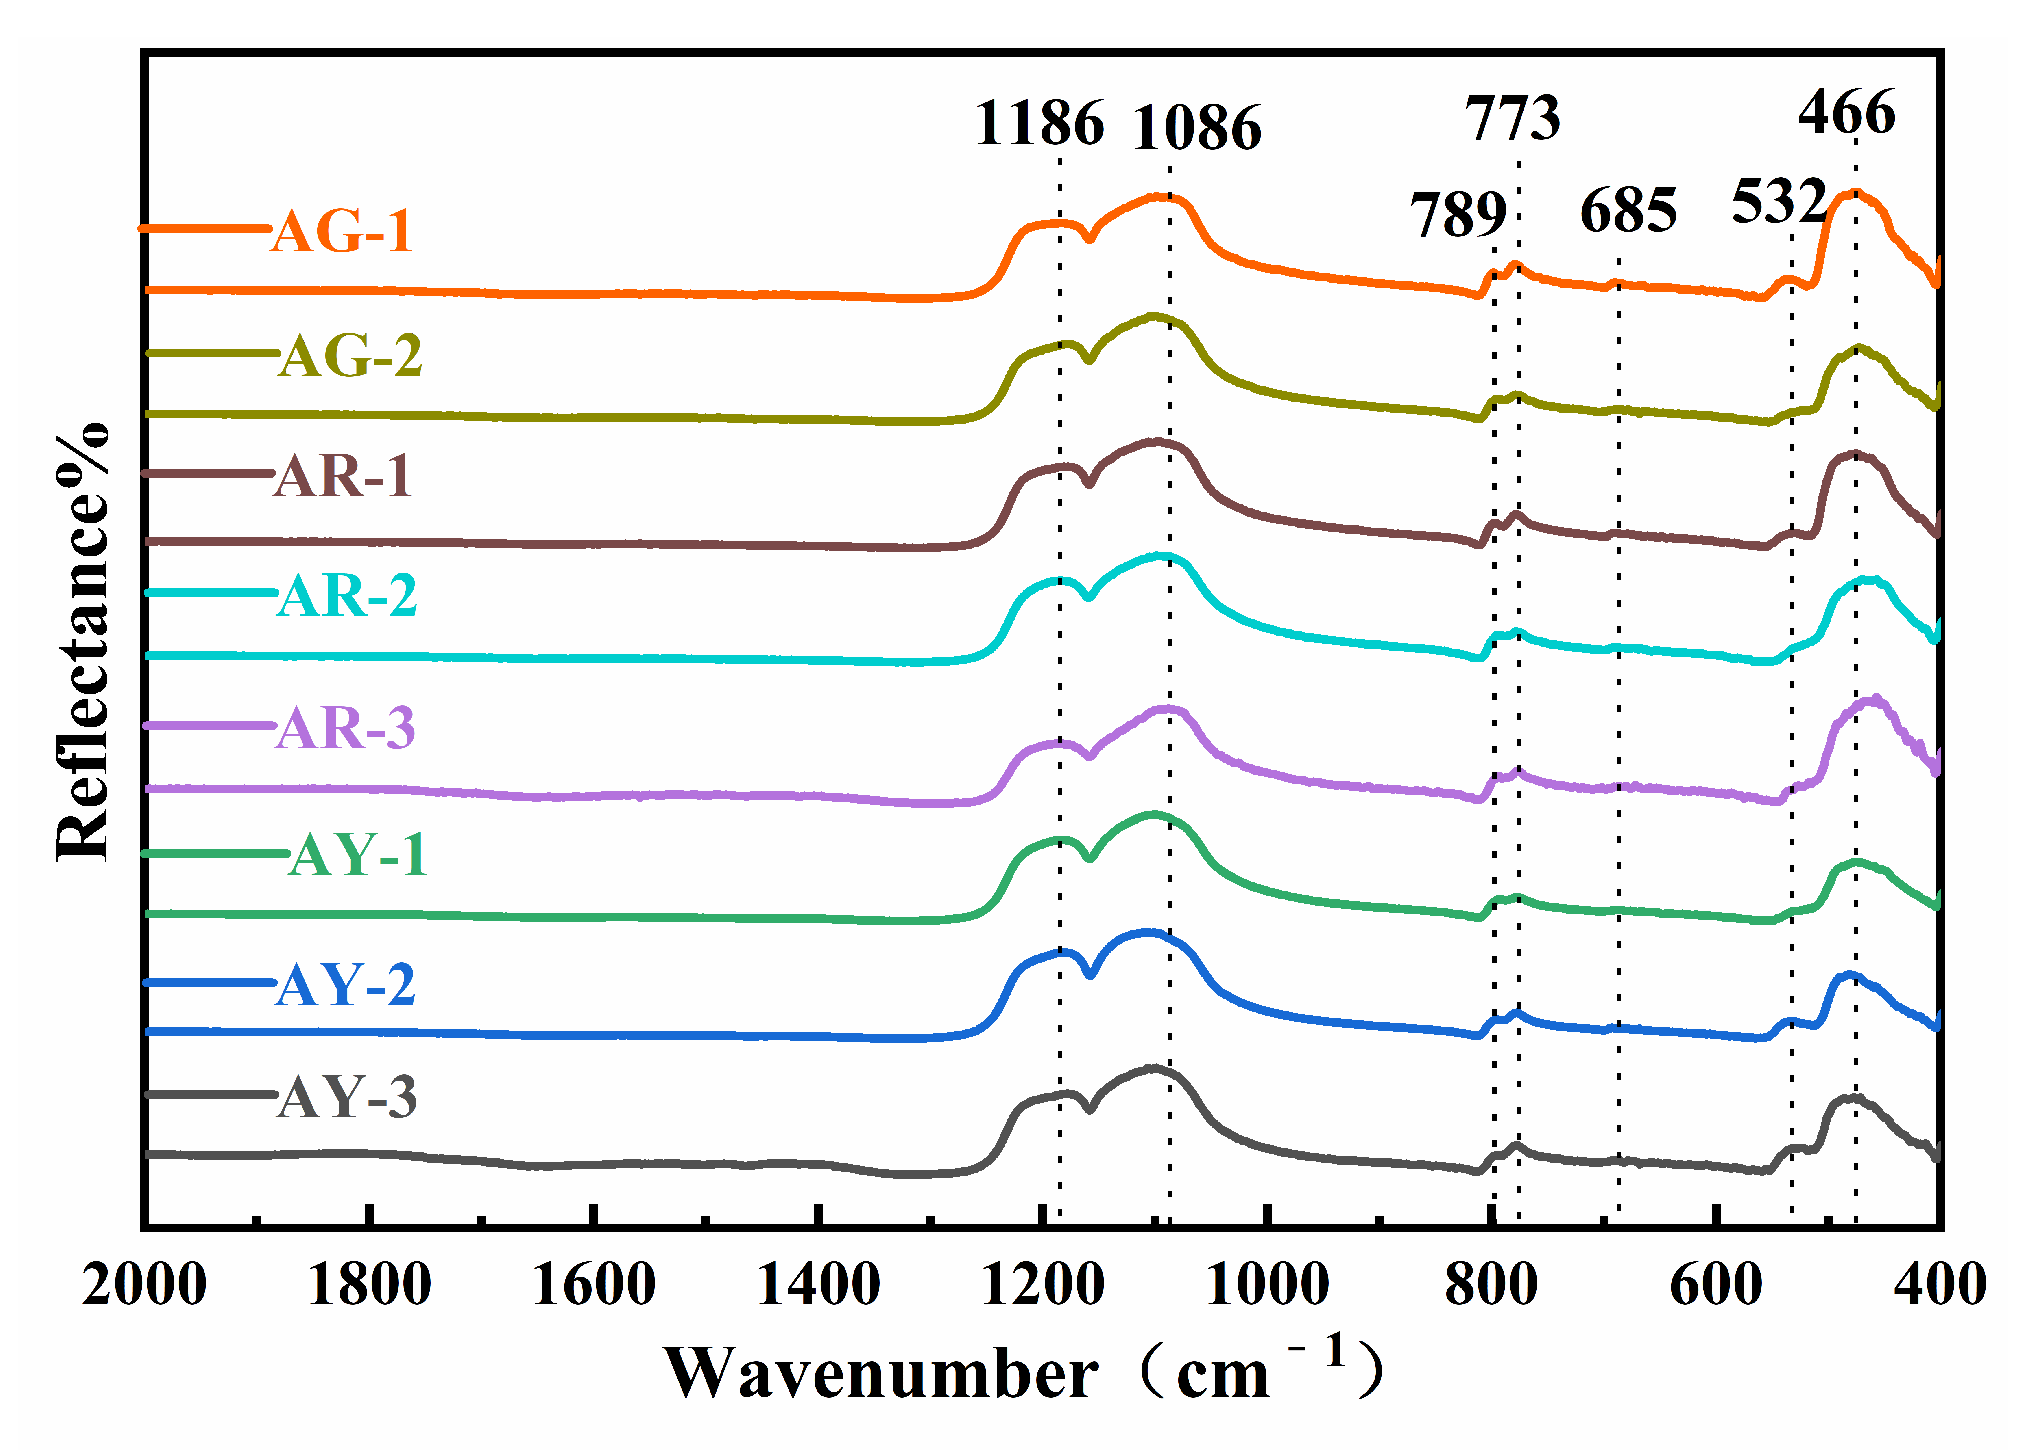
As shown in Figure 3, infrared spectra were obtained by testing the corresponding positions of eight samples with the infrared spectral reflection method.
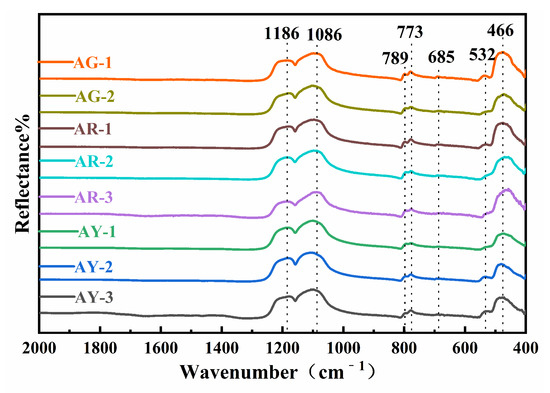
Figure 3.
FTIR spectra of the Moqi agate.
The results showed that the infrared absorption peaks of the eight samples were basically consistent, except for a small displacement at some positions and different absorption intensities. The absorption peaks of the Moqi agate are mainly located near 1186, 1086, 789, 773, 685, 532 and 466 cm−1, corresponding to the peaks for α-quartz [12]. The infrared absorption peaks of quartz mainly include 1170, 1080, 800, 782, 698, 532, 513 and 462 cm−1. The peak matching for all of the samples in the experiment is shown in Table S2. Compared with the infrared absorption spectrum of standard quartz, it can be seen that the position and peak shape are relatively consistent, so it can be seen that the main components of Moqi agate are α-quartz. According to the spectra observation and analysis results, the high-frequency regions in the infrared absorption spectra of Moqi agate are 1186 and 1086 cm−1, which belong to Si-O asymmetric stretching vibration. The obvious but weak absorption peaks at 789, 773 and 685 cm−1 are generally caused by Si-O-Si symmetric stretching vibration. According to the literature, the minerals of the quartz group have a single peak of medium-intensity absorption at 800 cm−1, while quartz rock, chalcedony, opal, etc., have a split peak in all directions near 799 and 777 cm−1, which is caused by the disordered arrangement of quartz grains in the quartz group minerals with different crystallinity [13]. The degree of splitting of the two peaks here is related to the degree of crystallization of quartzite jade. Luo thought that the absorption peaks with different splitting degrees at 801 and 778 cm−1 can be used as an important indicator to judge quartzite and chalcedony (agate) when using the infrared mirror reflection method to distinguish chalcedony and quartzite [14]. If there are obviously split absorption peaks here, it can be judged as quartzite; if there are weak shoulder peaks in these two positions, it can be inferred as chalcedony (agate). According to Figure 3, all samples show significant splitting peaks at 789 and 773 cm−1. The absorption band near 466 cm−1 in the low-frequency region is the second strong absorption band of the absorption spectrum, which belongs to the Si-O bending vibration, and the peak near 532 cm−1 is attributed to the flexural vibration of Si-O-Si [15]. Therefore, the crystallization degree of quartz in Moqi agate is higher than that in other general agate varieties, and combined with its obvious fission absorption peak, we further prove that Moqi agate cannot be called “Moqi agate”. It should be called “Moqi quartzite jade”.
3.3. Raman Spectra
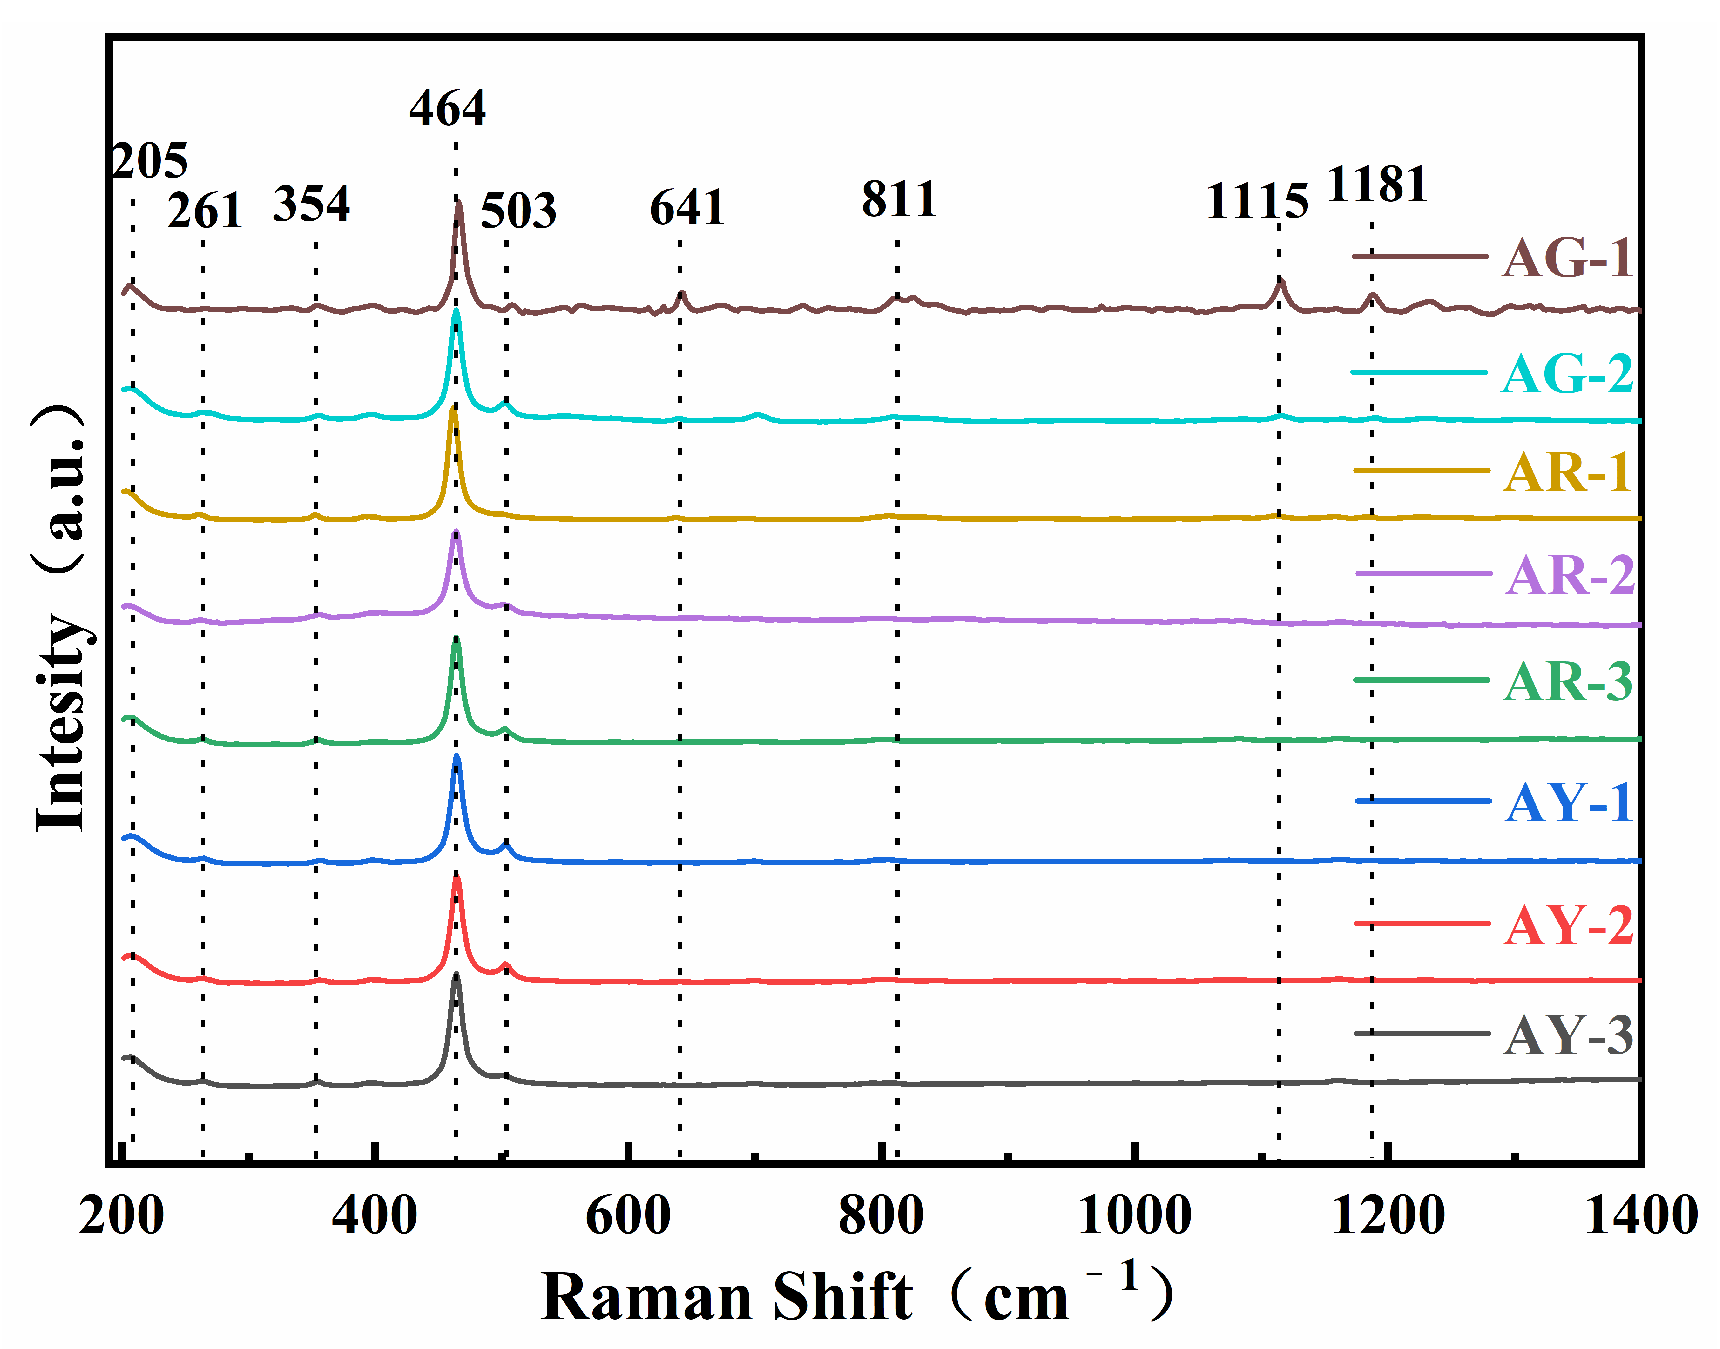
As is shown in Figure 4, the Raman peaks near 205, 261, 354, 464, 503, 641, 792, 1115 and 1181 cm−1 can be observed in Raman spectra of all the Moqi agate samples. The positions of these Raman peaks are generally consistent, with only some positions slightly shifted or the Raman intensity is different. The data show that in the Raman spectra of the crystal, 1000–1200 cm−1 belongs to Si-O asymmetric stretching vibration, corresponding to 1115 and 1181 cm−1 in the spectrogram; 600–800 cm−1 belongs to Si-O-Si symmetric stretching vibration, corresponding to 641 and 792 cm−1 in the spectra; 300–600 cm−1 belongs to Si-O bending expansion vibration, corresponding to 354, 464 and 503 cm−1 in the spectra; 205 and 261 cm−1 in the 100–300 cm−1 region are attributed to rotational or translational vibrations of [SiO4] [16].
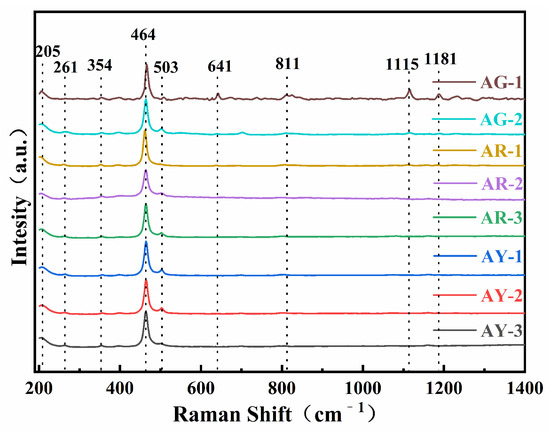
Figure 4.
Raman spectra of the Moqi agate samples. The eight samples were divided into three groups according to color, and the corresponding positions were tested by Raman spectroscopy.
According to the comparison with the RRUFF database, the characteristics of the spectrum peaks at the Moqi agate test points have the highest coincidence with the characteristic peaks of quartz, with the highest Raman intensity at 464 cm−1. This is caused by the typical silicate skeleton, indicating that Moqi agate is mainly composed of quartz [17].
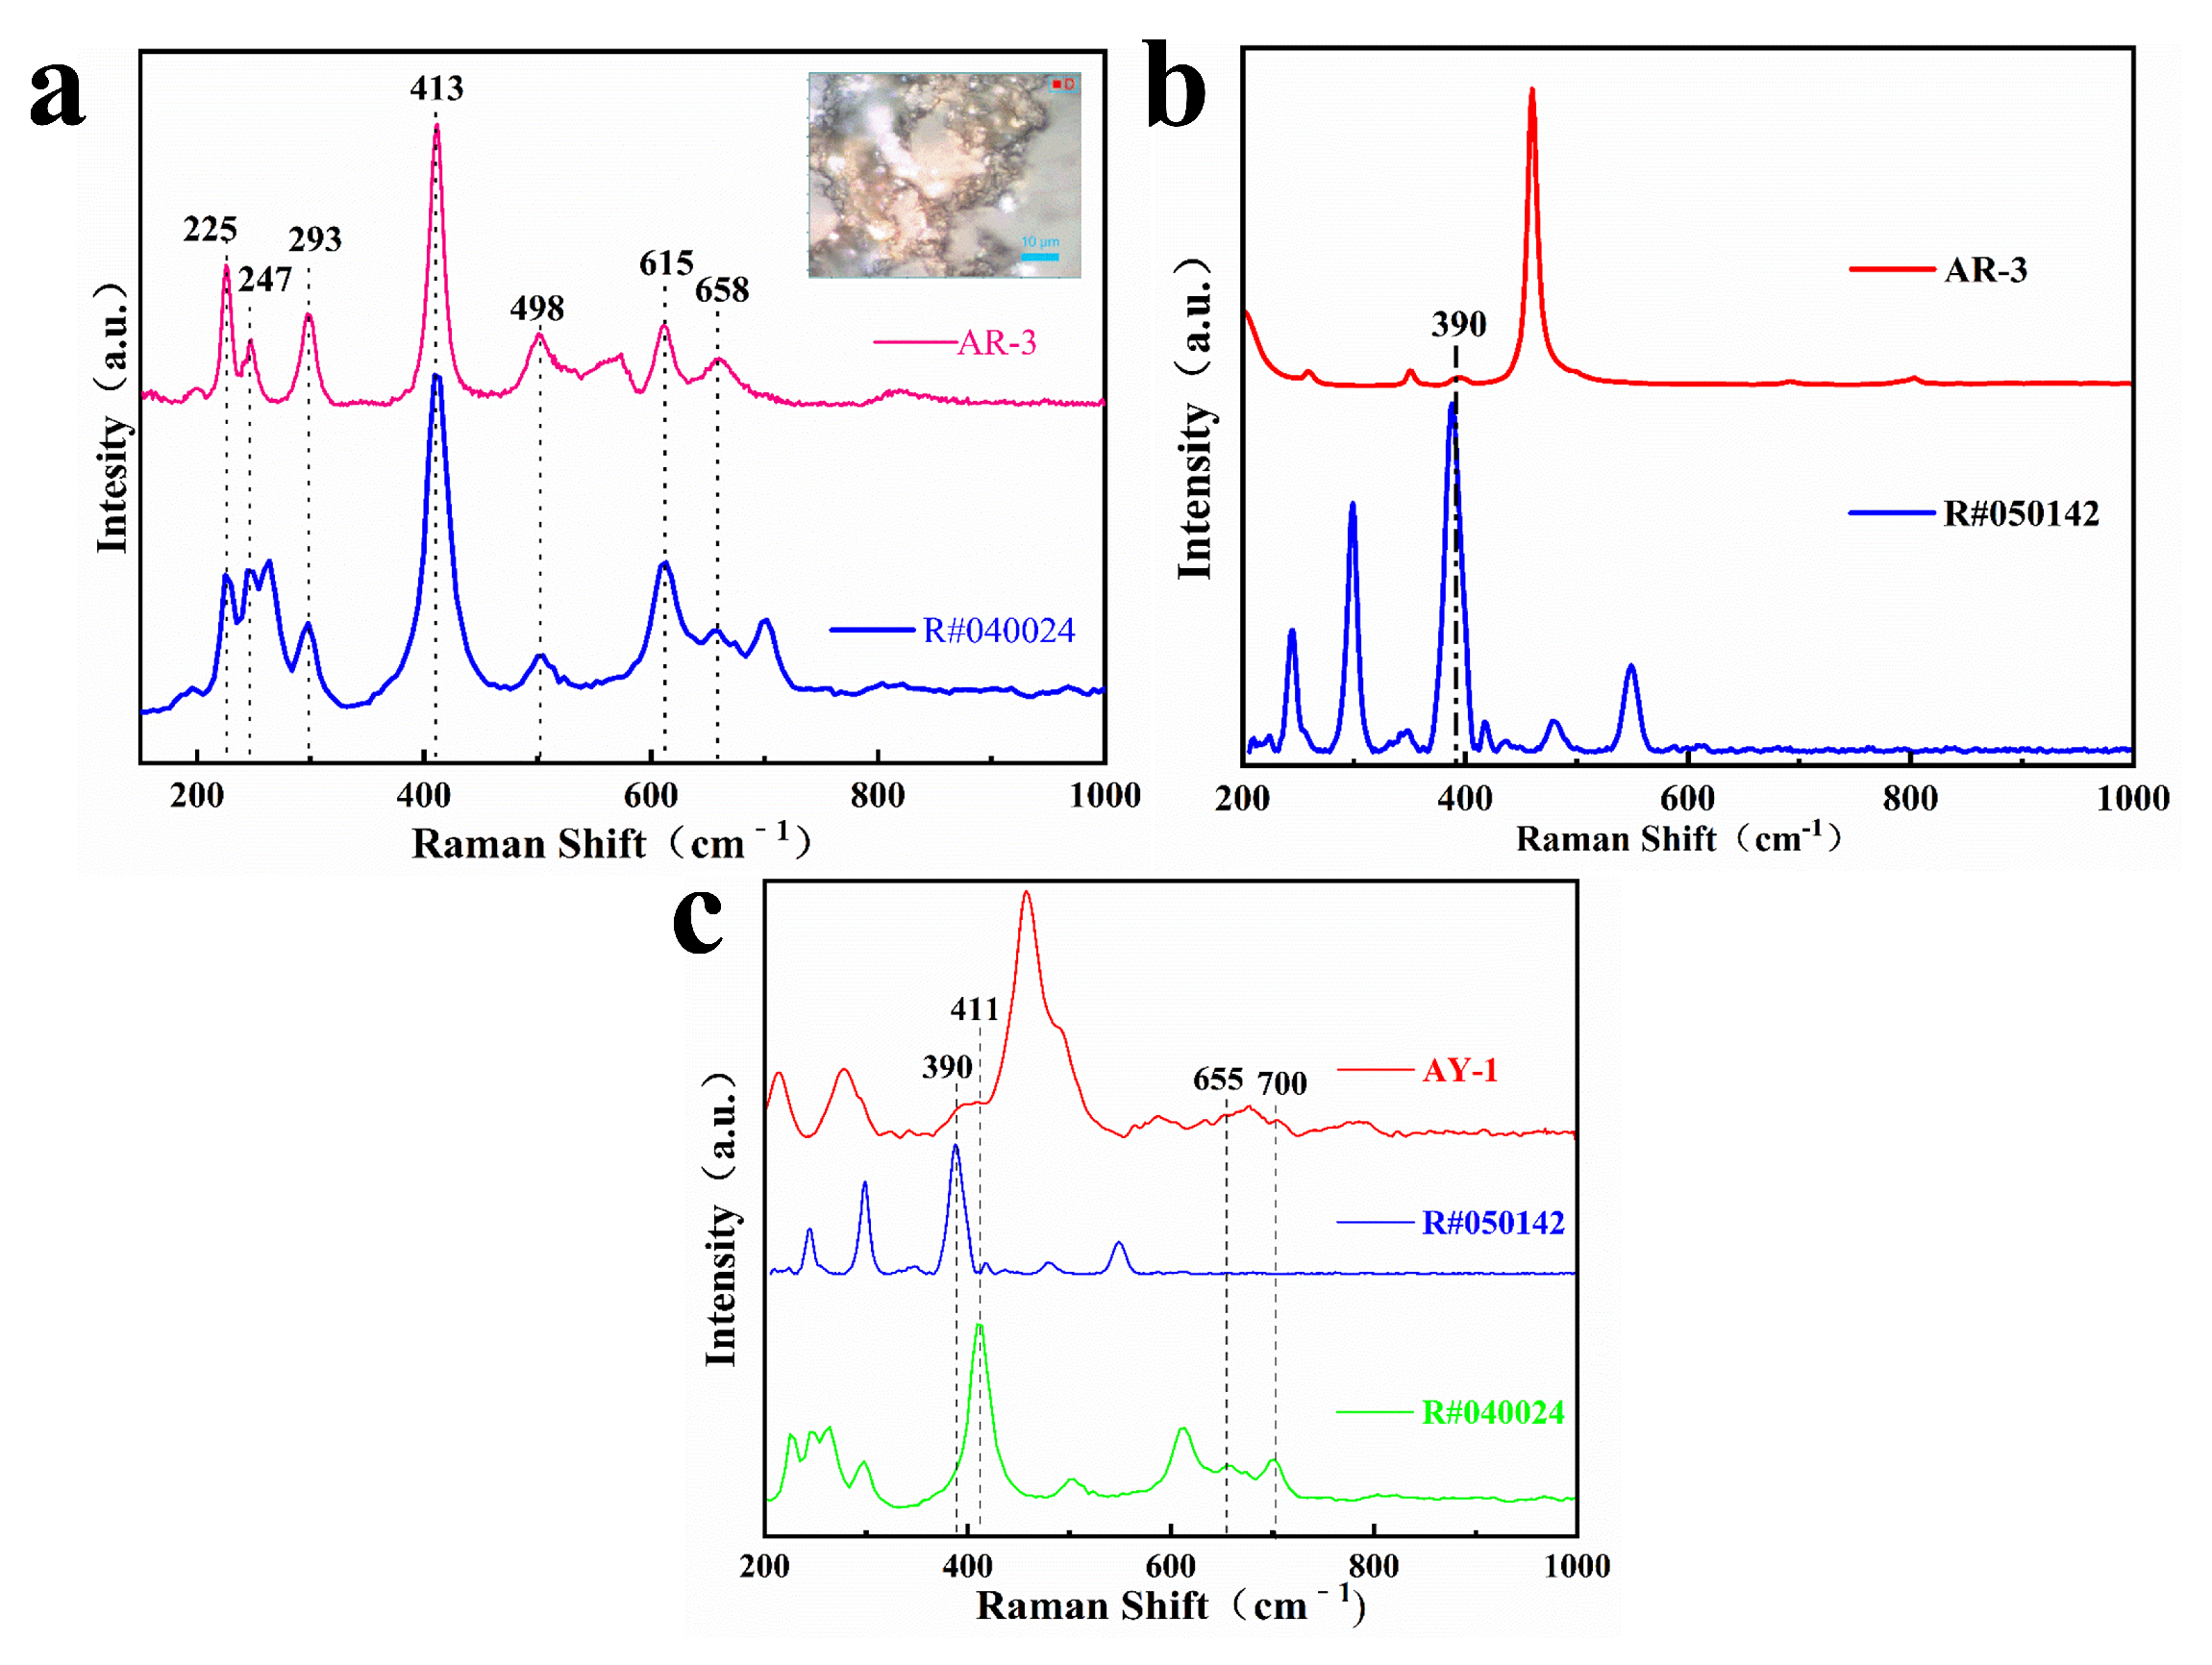
Zhou pointed out that the yellow and red color of quartzite jade is mainly caused by iron minerals between quartzite particles or fiber gaps, which belong to impurity minerals in gemology [18]. Generally, goethite is yellowish brown, but its color can change due to environmental changes. For example, dehydration of goethite can form hematite, which darkens the color [18,19]. We carried out laser Raman spectrometer tests on the AR-3 and AY-1 samples, analyzed goethite and hematite in the RRUFF Raman database, and obtained Raman spectra, as shown in Figure 5. The spectra shown in Figure 5a were obtained at the red enrichment position in sample AR-3, showing the characteristic Raman peaks near 225, 247, 293, 413, 498, 615 and 658 cm−1, which is the closest to the hematite phase. The spectra shown in Figure 5b were obtained by testing another point position in AR-3, which shows the characteristic peak of quartz and the characteristic peak at 390 cm−1 of goethite. The result shown in Figure 5c was obtained by laser Raman spectrometer dot test at the yellow enrichment position in sample AY-1. The characteristic peaks of hematite near 390 cm−1, goethite near 411, 655 and 700 cm−1, and quartz were also found. Therefore, the red and yellow agate samples of Moqi contain hematite and goethite, and the red spot-like mineral inclusions are mainly hematite.
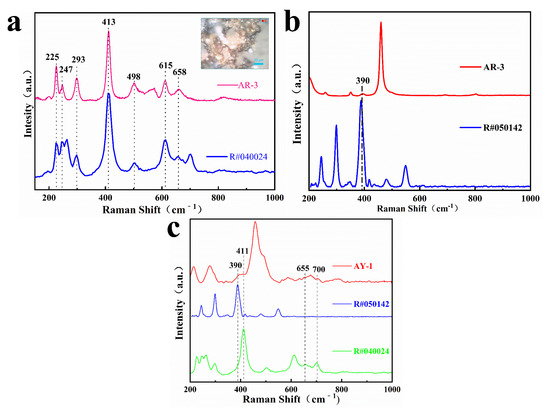
Figure 5.
Raman spectra of red brown part of AR-3 (a,b) and Raman spectra of the yellow part of AY-1 (c).
3.4. Moganite Content of Moqi Agate
With high spectral resolution, a Raman spectrometer can test a small number of samples or a small area, and calibrate the difference in moganite content between different rings of agate. Modern Raman probe technology can detect a volume less than 1 μ. The corresponding mass of the sample is 10–9 mg, which is a very powerful means to determine crystal chemistry and identify phase state in mixed minerals. In addition, when the content of some components in the sample is less than 5%, it is difficult to detect the diffraction peak line by the X-ray diffraction pattern. Agate usually contains moganite. The content of moganite in agates from different regions is often different. Moganite exists in agate in the form of nanocrystals, nanoflakes and separated Brazilian twin crystals, which are within the detection range of Raman spectrometers, but cannot be detected by X-ray diffractometry. Therefore, the content of moganite in Moqi agate was measured by microlaser Raman spectrometer [6].
Quartz is characterized by a peak value of 465 cm−1, while moganite is characterized by a peak value of 502 cm−1. Götze distinguished quartz from moganite by Raman spectroscopy. According to the calculation method I(502)/I(464) [%] = {[y(502) − y0(502)] × w(502)}/{[y(464) − y0(464)] × w(464)} of Götze [3], the content of moganite can be calculated by the intensity of the Raman peak and the peak width at half-height of the Raman peak (w is the peak width at half-height, y is the intensity of the peak and Y0 is the strength of the baseline). Quartz is characterized by a peak value of 465 cm−1, while moganite is 502 cm−1. The higher the content of moganite, the higher its I(502)/I(465). We estimate the content of moganite by calculating the ratio. In this study, the collected samples of variably colored Moqi agate were tested by microscopic Raman spectroscopy one by one. The most representative test results for each sample were selected and the half-height widths at 465 and 502 cm−1 were calculated separately using a Lorentz fit, and the ratio I(502)/I(406) was computed for both [3,20].
According to the formula given above, we estimated the moganite content in different measurement areas of agate samples selected for this study. Some calculation results are shown in Table S3. The results reveal that the variation in moganite content across different sample slices is a common phenomenon. Early studies showed that the content of moganite in samples of different microcrystalline silica types and different localities varies greatly [13,21,22]. Calculating the content of moganite at different positions in the same sample, the overall content of moganite in the agate sample selected was shown to range from a very small amount to 30%, and mainly occurs in fine grain and short fiber structures.
3.5. XRD
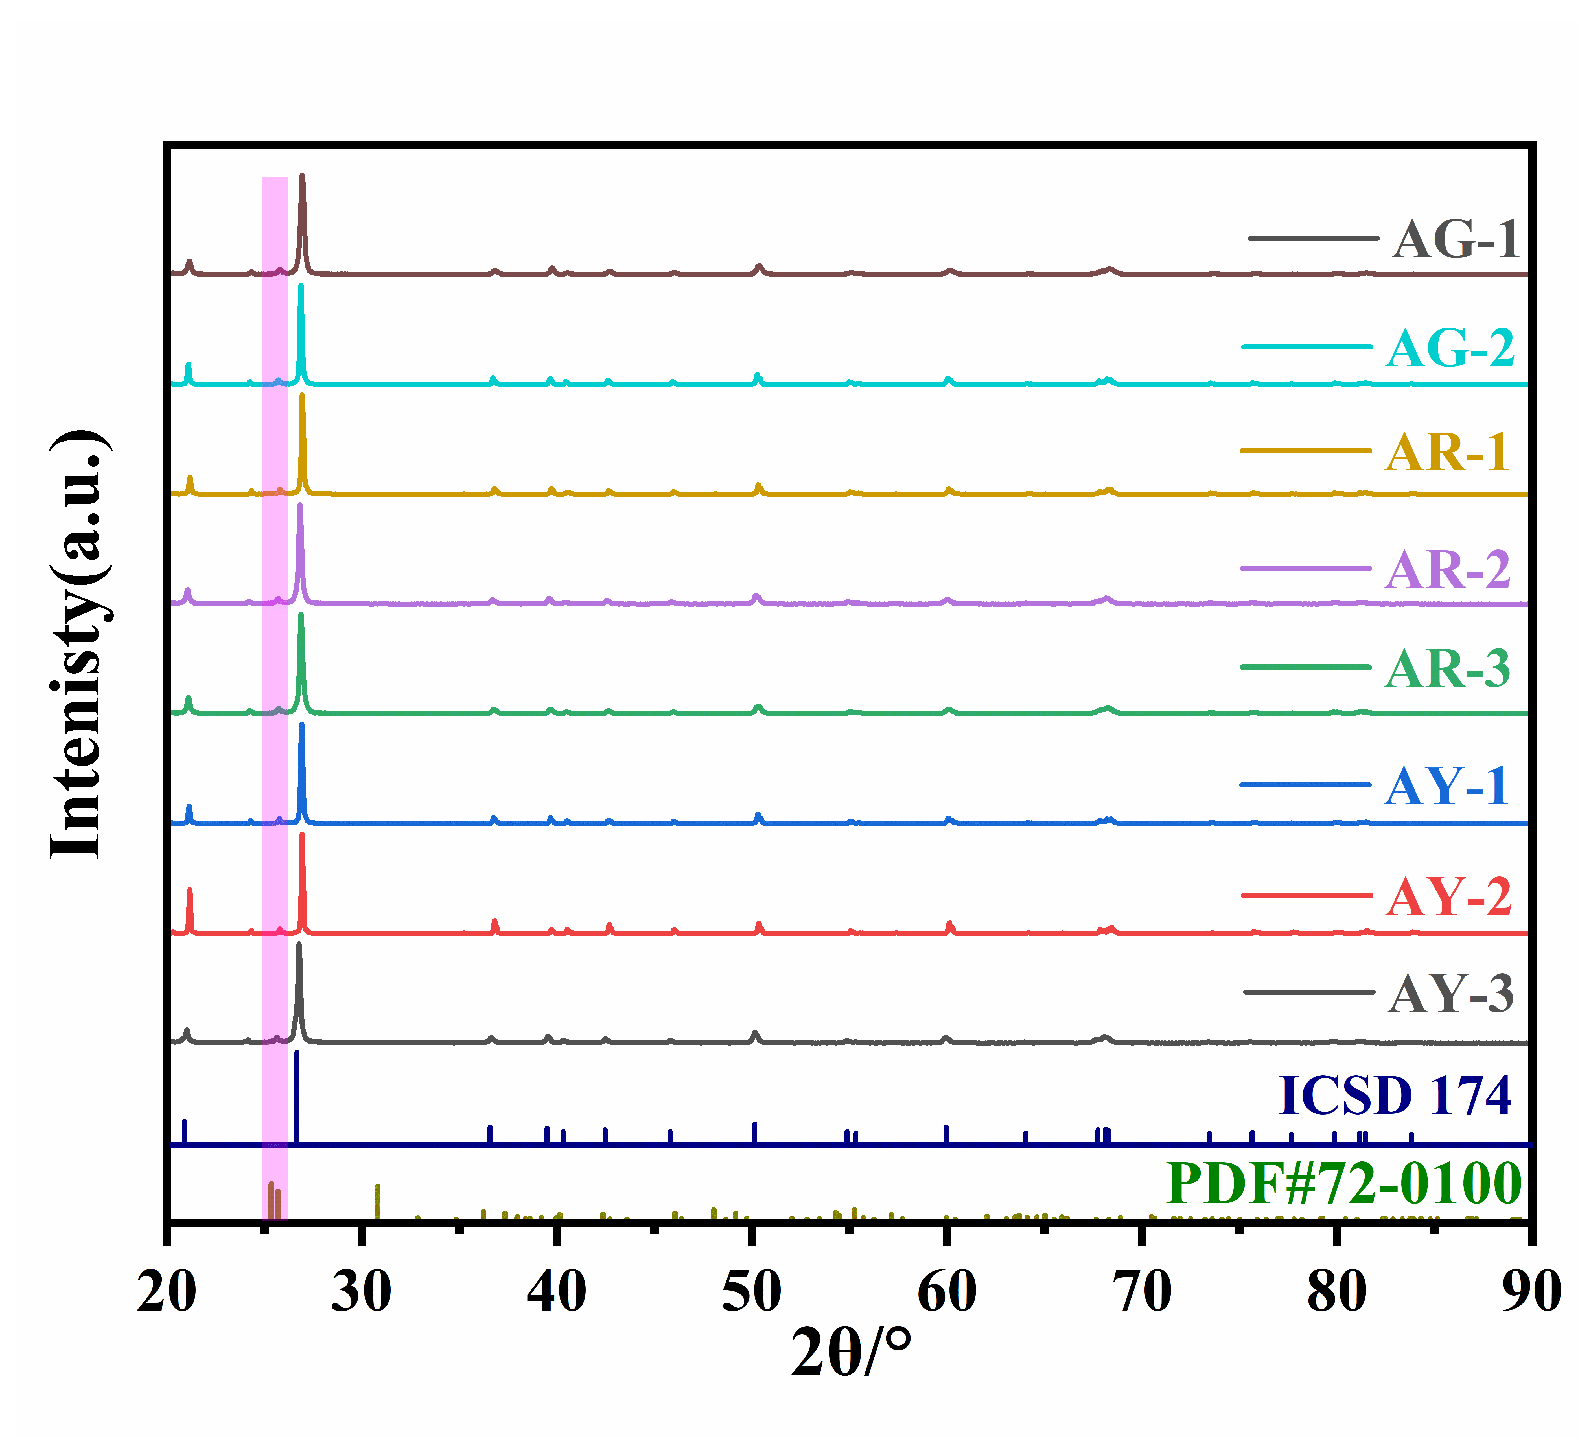
Figure 6 shows the results from the X-ray powder diffraction experiment performed on eight agate samples, which includes the standard card agate (ICSD no.174) as a reference.
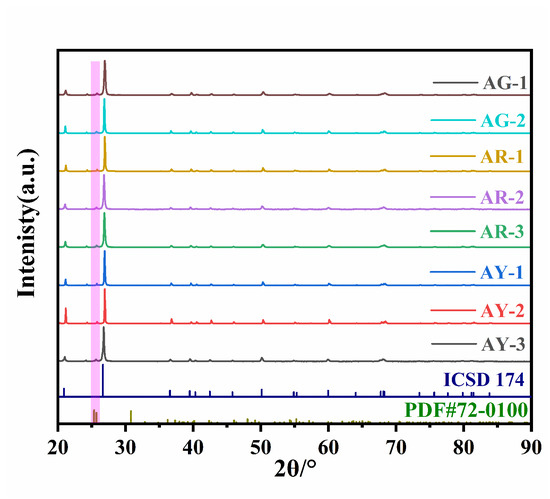
Figure 6.
X-ray diffraction patterns of agate with three colors.
The X-ray powder diffraction experiment results of the red group AR-1~AR-3; yellow group AY-1~AY-3; and green group AG-1 and AG-2 can be seen in Figure 6, and the diffraction peaks for the Moqi agate are AG-1 (3.3425 Å, 4.2530 Å); AG-2 (3.3443 Å, 4.2556 Å); AR-1 (3.3474 Å, 4.2585 Å); AR-2 (3.3426 Å, 4.2556 Å); AR-3 (3.3443 Å, 4.2556 Å); AY-1 (3.3442 Å, 4.2583 Å); AY-2 (3.3410 Å, 4.2530 Å); and AY-3 (3.3417 Å, 4.2530 Å), which are consistent with α-quartz. Therefore, the main minerals of the green, red and yellow parts of the Moqi agate are also α-quartz. The diffraction peaks of all samples are very sharp, which indicates a high crystallinity in Moqi agate. A few spurious peaks appear between 20–25°, which, after comparison, are impurities of brookite phase TiO2 (PDF#72-0100), and supported by the fact that we detected a certain amount of Ti in the samples during the electron probe experiments. According to the above polarized light test and analysis, the red Moqi agate is colored by Fe-bearing minerals. However, the diffraction peaks of Fe-bearing minerals (hematite and goethite) were not presented in the XRD test results. This may be due to the fact that their contents are rare and therefore not reflected in the results. For the yellow sample group, the Raman scattering spectrum peak corresponding to goethite is detected in the Raman spectrum test, but the spectrum peak corresponding to goethite is also not detected in the XRD diffraction experiment described here. It may be that the content of chromogenic minerals in the sample is too small and below the XRD detection range, so no characteristic diffraction peak of goethite is found [2,23].
3.6. Calculation of Crystallinity
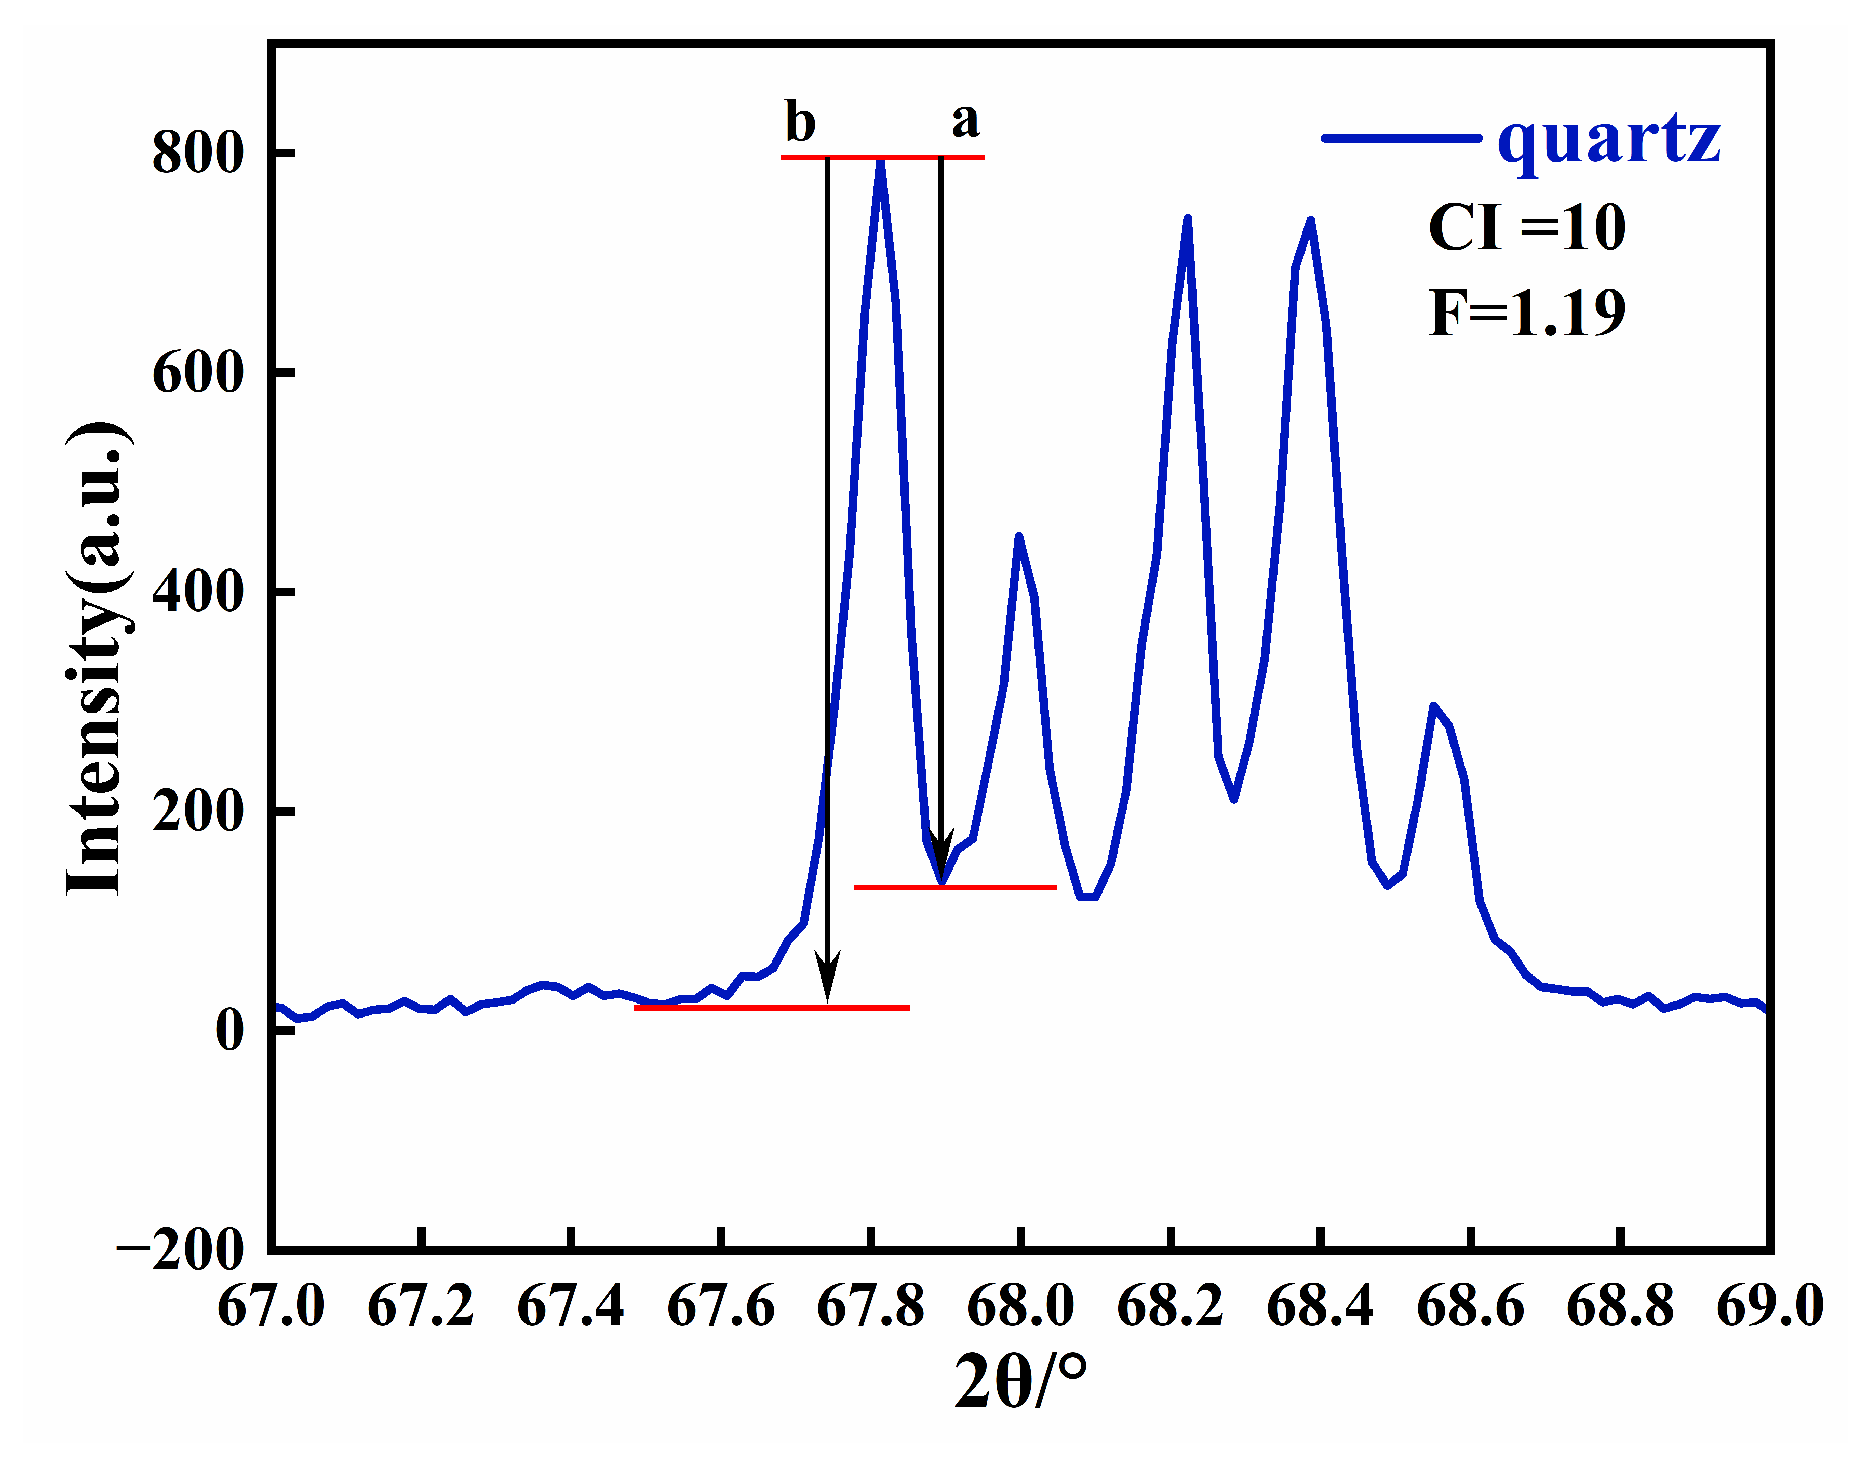
The crystallinity of Moqi agate can be calculated according to the five-finger diffraction peak of 67–69° X-ray diffraction [23]. The five-finger peak of natural white quartz with crystallinity of 10 is shown in Figure 7. Then, we measured the values for a and b of the peak (2132) (Figure 7), and calculated the crystallinity index according to the formula: crystallinity = 10·F·a/b, where F is the scale factor [24]. Since the F values for each diffractometer are different, it needs to be repeatedly measured and calculated with a standard sample. In this experiment, an artificial crystal is selected as the standard sample, and the test conditions are the same as those used for the other eight samples. According to the formula, F = 1.29 is calculated and substituted into the calculation formula for the crystallinity index.

Figure 7.
X-ray diffraction pattern of natural white quartz with a crystallinity index of 10 in the 2θ range of 67–69°.
The crystallinity index of the agate samples is as follows: AG-1 (1.55), AG-2 (1.81), AR-1 (3.28), AR-2 (2.75), AR-3 (2.97), AY-1 (2.14), AY-2 (2.83) and AR-1 (3.14), as shown in Figure S1. In general, except for the high crystallinity of AR-1 in the yellow group and AR-3 in the red group, the crystallinity of quartz in the Moqi agate samples is low.
3.7. Composition Analysis of Agate
To observe the micro-area morphology of the green agate, we performed scanning electron microscopy tests. As shown in Figure 8a, the Moqi green agate has a fine scalelike structure with a scale size of about a dozen micrometers and gaps between the scales. As shown in Figure 8b, the Moqi green agate contains small amounts of Fe, K, Al, Mg and other elements in addition to Si and O elements. Celadonite with a scale-like structure has been reported as the chromogenic mineral in green agate [25]. In this study, considering the structural characteristics, color, and EDS analysis of the Moqi green agate, the green mineral is presumed to be celadonite.
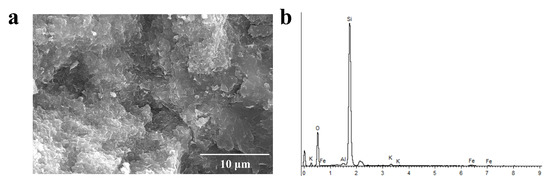
Figure 8.
SEM (a) and EDS (b) of AG-1 plate edge.
To quantify the chemical composition of the Moqi agate, each sample was tested using an EPMA, and the results are shown in Table 1. The main constituent in the Moqi agate is SiO2, and the content of SiO2 in all samples is greater than 95%; in addition, the Moqi agate also contains Na, Cu, Cr, Ti, Mg, Al, Fe and other elements. The green samples have a much higher content of Fe and Mg than the red and yellow samples, as the celadonite in green agate is a magnesium- and iron-rich mineral, which further indicates that celadonite is the color-causing mineral in the green agate, with Fe being the main color-causing element. Yellow samples AY-2 and AY-3 show a clear red tone and their Fe content is similar to that for the red group of agates, averaging 0.14%. Sample AY-1 has a pure yellow tone and it has the lowest Fe content of 0.05%. The yellow sample also contains more Cu, and we hypothesize that the yellow concentration is related to the Cu content; the more Cu, the more pronounced the yellow. As a result, we hypothesize that the red and yellow agates are related to the Fe and Cu elements; the higher the Fe content, the more pronounced the red; the lower the Fe content, and the higher the Cu content, the purer the yellow. In addition, the element Ti may have played a role in aiding the color of the agate, but no clear pattern is seen in the table.

Table 1.
EPMA data for the Moqi agate (wt.%).
The green agate has the highest Fe content, while the red and yellow groups are relatively low. This is also evident in the red tones of samples AY-2 and AY-3, and their Fe content is similar to that in the red group agates, with an average of 0.14%. The AY-1 sample, on the other hand, has a pure yellow tone, and it has a minimum Fe content of 0.05%. Therefore, we speculate that the colors of Moqi agates are affected by the Fe content. The content of Fe in green agate reflects the content of celadonite inclusions; the higher the content of Fe, the more obvious the green color. In red and yellow agate, the higher the Fe content, the more obvious the red tone; the lower the Fe content, the purer the yellow tone.
3.8. UV–Visible Spectroscopy
Figure 9 shows the ultraviolet–visible absorption spectra we tested in order to obtain the coloring mechanism in agate with different colors.
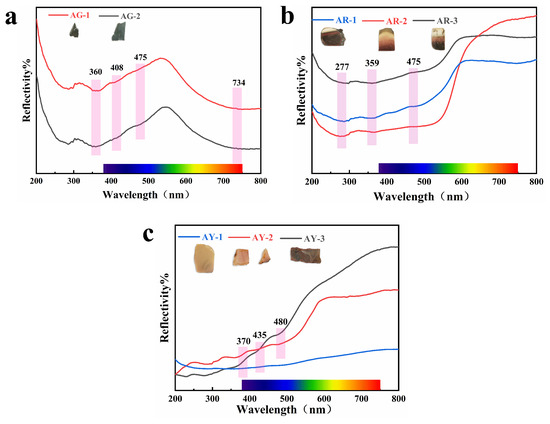
Figure 9.
UV–visible spectra of the agate.
The green tone of Moqi agate is mainly affected by celadonite, and the green tone of celadonite is mainly affected by Fe3+ and Fe2+ in the crystal structure of mineral, in which the selective absorption of chromic element ions to visible light leads to its green color. The absorption peaks at 403 and 475 nm in visible light are attributed to 6A1g→4Eg (4D) and 6A1g→4Eg+4A1g (4G) six-quadruple spin forbidden transitions of Fe3+ in the octahedral field, respectively. The wide absorption peak at 734 nm is related to the 6A1g→4T2g (4G) transition of Fe3+ and charge transfer of Fe2+-Fe3+ [26]. Celadonite may be associated with goethite and hematite [27]; it is speculated that the absorption peak at 360 nm is related to the 6Al→4E transition of Fe3+ in goethite [28].
The yellow group samples AY-1 and AY-2 have more obvious absorption peaks in the blue-violet region at 370 and 435 nm and in the blue region at 480 nm. Among them, the absorptions at 370 nm and 435 nm are respectively attributed to the 6A1→4E transition of Fe3+ in hematite and goethite [28,29]. The absorption at 480 nm is attributed to the 2 (6Al)→2 (4T1) (4G) transition of Fe3+ in goethite [28,30]. However, sample AY-3 has no obvious absorption peak due to its dark color. The three samples of the red group, AR-1, AR-2 and AR-3, all have absorption in the green–blue–purple region, and the absorption intensity of AR-2 is higher than that of the other two. The brighter the red part is, the greater the absorption degree of the sample. The absorption of the Moqi red agate at 359 nm is the 6A1→4E transition of Fe3+ in goethite, and the absorption at 475 nm is the 2 (6A1)→2 (4T1) (4G) transition of Fe3+ in goethite. The faint shoulder peaks at 215–228 nm and 277 nm are produced by the joint influence of goethite and hematite and are attributed to the charge transfer between O2− and Fe3+ in goethite and hematite [28,31,32]. According to the UV–visible absorption spectra of red and yellow agates, the red and yellow are caused by the crystal field transitions of various modes of Fe3+ and the charge transfer between O2− and Fe3+ in goethite and hematite. In the figure, we do not see the obvious absorption peaks for Cu and Ti, and the influence of Cu and Ti on color needs to be further described.
4. Conclusions
In summary, the gemological characteristics and color formation mechanism of Moqi agate are studied in this paper. The results indicate that the color of Moqi agate is related to the minerals and trace elements contained in it. The green color of Moqi agate is caused by Fe in celadonite. The red and yellow color is caused by electron transition and charge transfer of Fe3+ in hematite and goethite. Red agate contains more iron elements than yellow agate. Cu and Ti may also have effects on the color of agates, and further studies are needed. The structure of Moqi agates is mainly fine equigranular. The content of moganite in Moqi agate is 0–30%. The crystallinity of the SiO2 in Moqi agate is about 1.5–3.5; it is generally higher than that in ordinary agate. The Moqi agate studied in this paper is classified as quartzite jade. This work expands some information about the origin of agate and provides a theoretical and experimental basis for tracing the origin of Moqi agate in the future.
Supplementary Materials
The following supporting information can be downloaded at:https://www.mdpi.com/article/10.3390/cryst13060977/s1, Supporting document Table S1—Appearance characteristics of the experimental agate samples; Supporting document Table S2—Attributes of characteristic peaks in the agate infrared spectra; Supporting document Table S3—Calculation data for I(502)/I(464) [%] for the Moqi agate and estimated content of plagioclase wt.%; Supporting document Figure S1—The five-finger peak in the 67–69° range for Moqi agate.
Author Contributions
S.Z. and L.C., performing experiments and writing the original manuscript; Q.G., reviewing and editing; N.L., carrying out the analysis; Y.L., translating; Y.R., drawing pictures; and L.L., reviewing and editing. All authors have read and agreed to the published version of the manuscript.
Funding
This study was supported by the National Science and Technology Infrastructure—The National Infrastructure of Mineral, Rock and Fossil Resources for Science and Technology (http://www.nimrf.net.cn, accessed on 25 December 2021), and the Program for Data Integration and Standardization in Geological Science and Technology from MOST, China, grant number 2013FY110900-3.
Acknowledgments
We gratefully thank the laboratory of the School of Gemology, China University of Geosciences (Beijing), and thank Professor Xuemei He of the School of Gemology, China University of Geosciences (Beijing), for providing samples for this study.
Conflicts of Interest
The authors declare no conflict of interest.
References
- Cai, W.; Tian, J. Classification of Agate. China Nonmetal Min. Ind. Guide 2000, 4, 29–31. [Google Scholar]
- Xie, T. Study on Coloration Mechanism and Structural Genesis of “Warring States Red” Agate in Fuxin, Liaoning. Master’s Thesis, China University of Geosciences (Beijing), Beijing, China, 2014. [Google Scholar]
- Götze, J.; Nasdala, L.; Kleeberg, R. Occurrence and distribution of “moganite” in agate/chalcedony: A combined micro-Raman, Rietveld, and cathodoluminescence study. Contrib. Mineral. Petrol. 1998, 133, 96–105. [Google Scholar] [CrossRef]
- Currier, R.H. Amethyst, agate, and calcite ‘skunks’ from Uruguay. Rocks Miner. 1997, 72, 94. [Google Scholar] [CrossRef]
- Moxon, T. Agates from Western Australia Found in a 3,480-Million-Year-Old Host Rock. Rocks Miner. 2010, 85, 66–73. [Google Scholar] [CrossRef]
- Zhou, D.; Chen, H.; Lu, T.; Ke, J.; He, M. The relationship between the relative content of moganite and the crystallinity of quartz jade was studied based on Raman spectroscopy infrared spectroscopy X-ray diffraction. Rock Miner. Test. 2015, 6, 652–658. [Google Scholar]
- Guo, W.; Wang, S. Mineralogical characteristics and chromogenic mechanism of Nanhong agate in Baoshan, Yunnan. J. Rock Mineral. 2017, 36, 419–430. [Google Scholar]
- Zhu, L.; Yang, M.; Tang, J.; Yang, X. Gemmological Characteristic of Nanhong Agate and Formation of Red Stripe. J. Gemol. Gemol. 2015, 6, 31–38. [Google Scholar]
- Lu, Z.; He, X.; Lin, C.; Jin, X.; Pan, Y. Identification of Beihong Agate and Nanhong Agate from China Based on Chromaticity and Raman Spectra. Spectrosc. Spectr. Anal. 2019, 39, 2153–2159. [Google Scholar]
- Tao, M.; Xu, H. Structure, water content and genetic mechanism of agate. J. Rock Mineral. 2016, 35, 333–343. [Google Scholar]
- Zhang, Z.; Zhao, T.; Liu, L.; Li, Y. Spectral Characteristics of Madagascar Agates. Spectrosc. Spectr. Anal. 2021, 41, 3227–3232. [Google Scholar]
- Farmer, V.C. Infrared Spectra of Minerals; Mineralogical Society: London, UK, 1992; p. 100. [Google Scholar]
- Heaney, P.J.; Post, J.E. The widespread distribution of a novel silica polymorph in microcrystalline quartz varieties. Science 1992, 255, 441–443. [Google Scholar] [CrossRef] [PubMed]
- Luo, Y.; Wang, C. Distinguishing between phanerocrystalline quartzite and cryptocrystalline chalcedony by infrared specular reflection. In Proceedings of the China Jewelry Academic Exchange Conference, Beijing, China, 30 November 2015; Volume 7. [Google Scholar]
- Yang, L.; Yan, S.; Wang, H.; Zhang, Y.; Wang, R.; Yang, M. Spectral Characteristics of Two Kinds of Nanhong Agate Imitations. Spectrosc. Spectr. Anal. 2022, 42, 835–840. [Google Scholar]
- Dana, P.; Ciprian, C.; Tătar, D.; Wolfgang, K. Raman spectroscopy on gem-quality microcrystalline and amorphous silica varieties from Romania. Stud. UBB Geol. 2004, 49, 41–52. [Google Scholar]
- Kingma, K.J.; Hemley, R.J. Raman spectroscopic study of microcrystalline silica. Am. Mineral. 1994, 79, 269–273. [Google Scholar]
- Zhou, D.; Shi, G.; Liu, S.; Wu, B. Mineralogy and Magnetic Behavior of Yellow to Red Xuanhua-Type Agate and Its Indication to the Forming Condition. Minerals 2021, 11, 877. [Google Scholar] [CrossRef]
- Liu, F.; Lin, X. Goethite morphologies of some soils in south of central China. Pedosphere 1996, 3, 193–200. [Google Scholar]
- Hatipoğlu, M. Moganite and quartz inclusions in the nano-structured Anatolian fire opals from Turkey. J. Afr. Earth Sci. 2009, 54, 1–21. [Google Scholar] [CrossRef]
- Kingma, K.J. Pressure-Induced Transformations in Silica. Ph.D. Thesis, The Johns Hopkins University, Baltimore, MD, USA, 1994. [Google Scholar]
- Peter, J. Heaney Moganite as an indicator for vanished evaporites: A testament reborn? J. Sediment. Res. 1995, 65, 633–638. [Google Scholar]
- He, M.; Wang, P. Crystallinity index of quartz and its typomorphic significance. Miner. Rocks 1994, 14, 22–28. [Google Scholar]
- Murata, K.J.; Norman, M.B. An index of crystallinity for quartz. Am. J. Sci. 1976, 276, 1120–1130. [Google Scholar] [CrossRef]
- Zhang, R.; Du, J. A study of gemological characteristics and color origin of green Gobi agate from Alxa area, Inner Mongolia. Acta Petrol. Mineral. 2023, 42, 104–112. [Google Scholar]
- Zhong, Q.; Liao, Z.; Lai, M.; Cui, D.; Li, L.; Zhou, Z.; Zhang, L. Compositions, Structures and Coloration Mechanism of Quartzite Jade from Taxkorgan, Xinjiang. J. Chin. Ceram. Soc. 2020, 48, 104–111. [Google Scholar]
- Huang, S. The celadonite in the Sandstones, South Songliao Basin. Miner. Rocks 1987, 7, 16–20. [Google Scholar]
- Lu, Z.; He, X.; Guo, Q. Color and Genesis of Beihong Agate and Its Spectroscopic Characteristics. Spectrosc. Spectr. Anal. 2020, 40, 2531–2537. [Google Scholar]
- Sherman, D.M. The electronic structures of Fe3+ coordination sites in iron oxides: Applications to spectra, bonding, and magnetism. Phys. Chem. Miner. 1985, 12, 161–175. [Google Scholar] [CrossRef]
- Götze, J.; Tichomirowa, M.; Fuchs, H.; Pilot, J.; Sharp, Z.D. Geochemistry of agates: A trace element and stable isotope study. Chem. Geol. 2001, 175, 523–541. [Google Scholar] [CrossRef]
- Zhang, Y.; Wei, R.; Ke, J.; Chen, H.; Lu, T. Study on the color genesis of yellow and red quartz jade. J. Rock Mineral. 2016, 1, 139–146. [Google Scholar]
- Zhang, Y.; Lu, T.; Yang, T.; Chen, H.; Ke, J. Color distribution and trace element analysis of quartz jade. J. Rock Mineral. 2014, 201, 83–88. [Google Scholar]


Disclaimer/Publisher’s Note: The statements, opinions and data contained in all publications are solely those of the individual author(s) and contributor(s) and not of MDPI and/or the editor(s). MDPI and/or the editor(s) disclaim responsibility for any injury to people or property resulting from any ideas, methods, instructions or products referred to in the content. |
© 2023 by the authors. Licensee MDPI, Basel, Switzerland. This article is an open access article distributed under the terms and conditions of the Creative Commons Attribution (CC BY) license (https://creativecommons.org/licenses/by/4.0/).