

Laser Machining of Nickel Oxide–Yttria Stabilized Zirconia Composite for Surface Modification in Solid Oxide Fuel Cells

 ,
, 
Abstract
:1. Introduction
2. Materials and Methods
2.1. Preparation of NiO–YSZ Substrates
2.2. Laser Machining Treatment
2.3. Characterization Techniques
2.3.1. Surface Topography
2.3.2. Scanning Electron Microscopy (SEM)
2.3.3. X-ray Diffraction (XRD)
2.3.4. Raman Spectroscopy
2.3.5. X-ray Photoelectron Spectroscopy (XPS)
2.3.6. Nanoindentation Tests
3. Results and Discussion
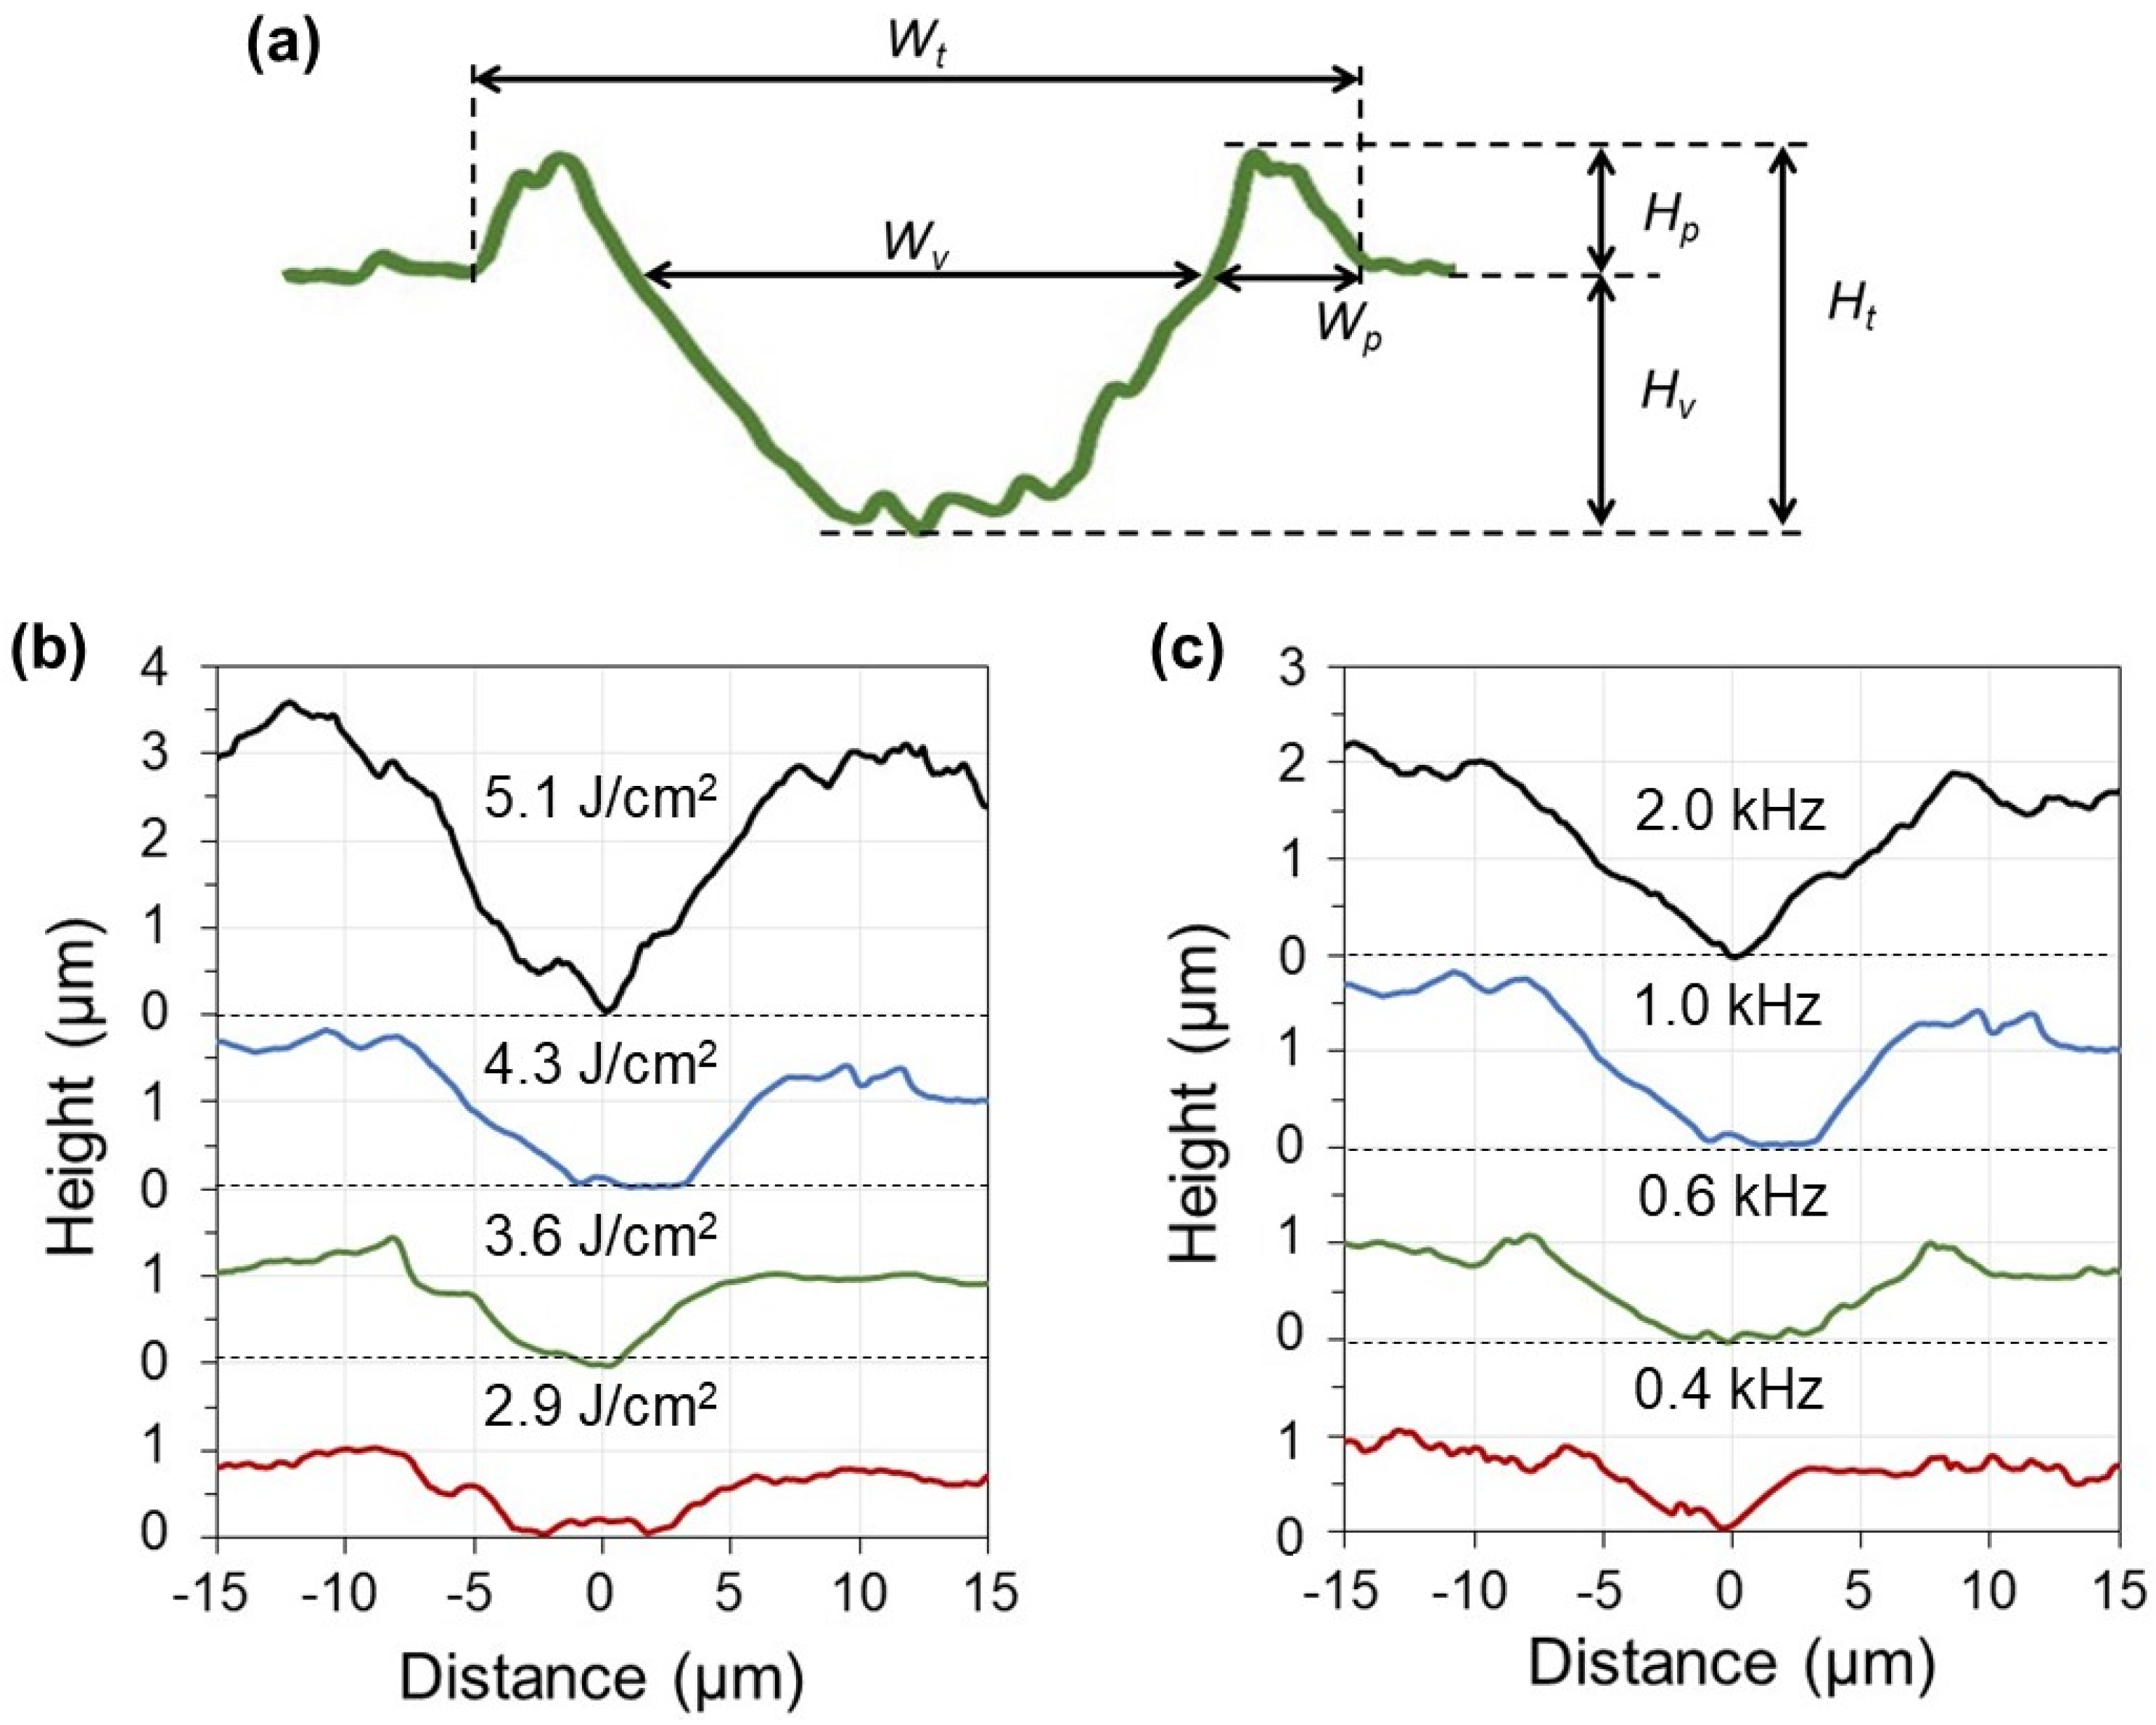
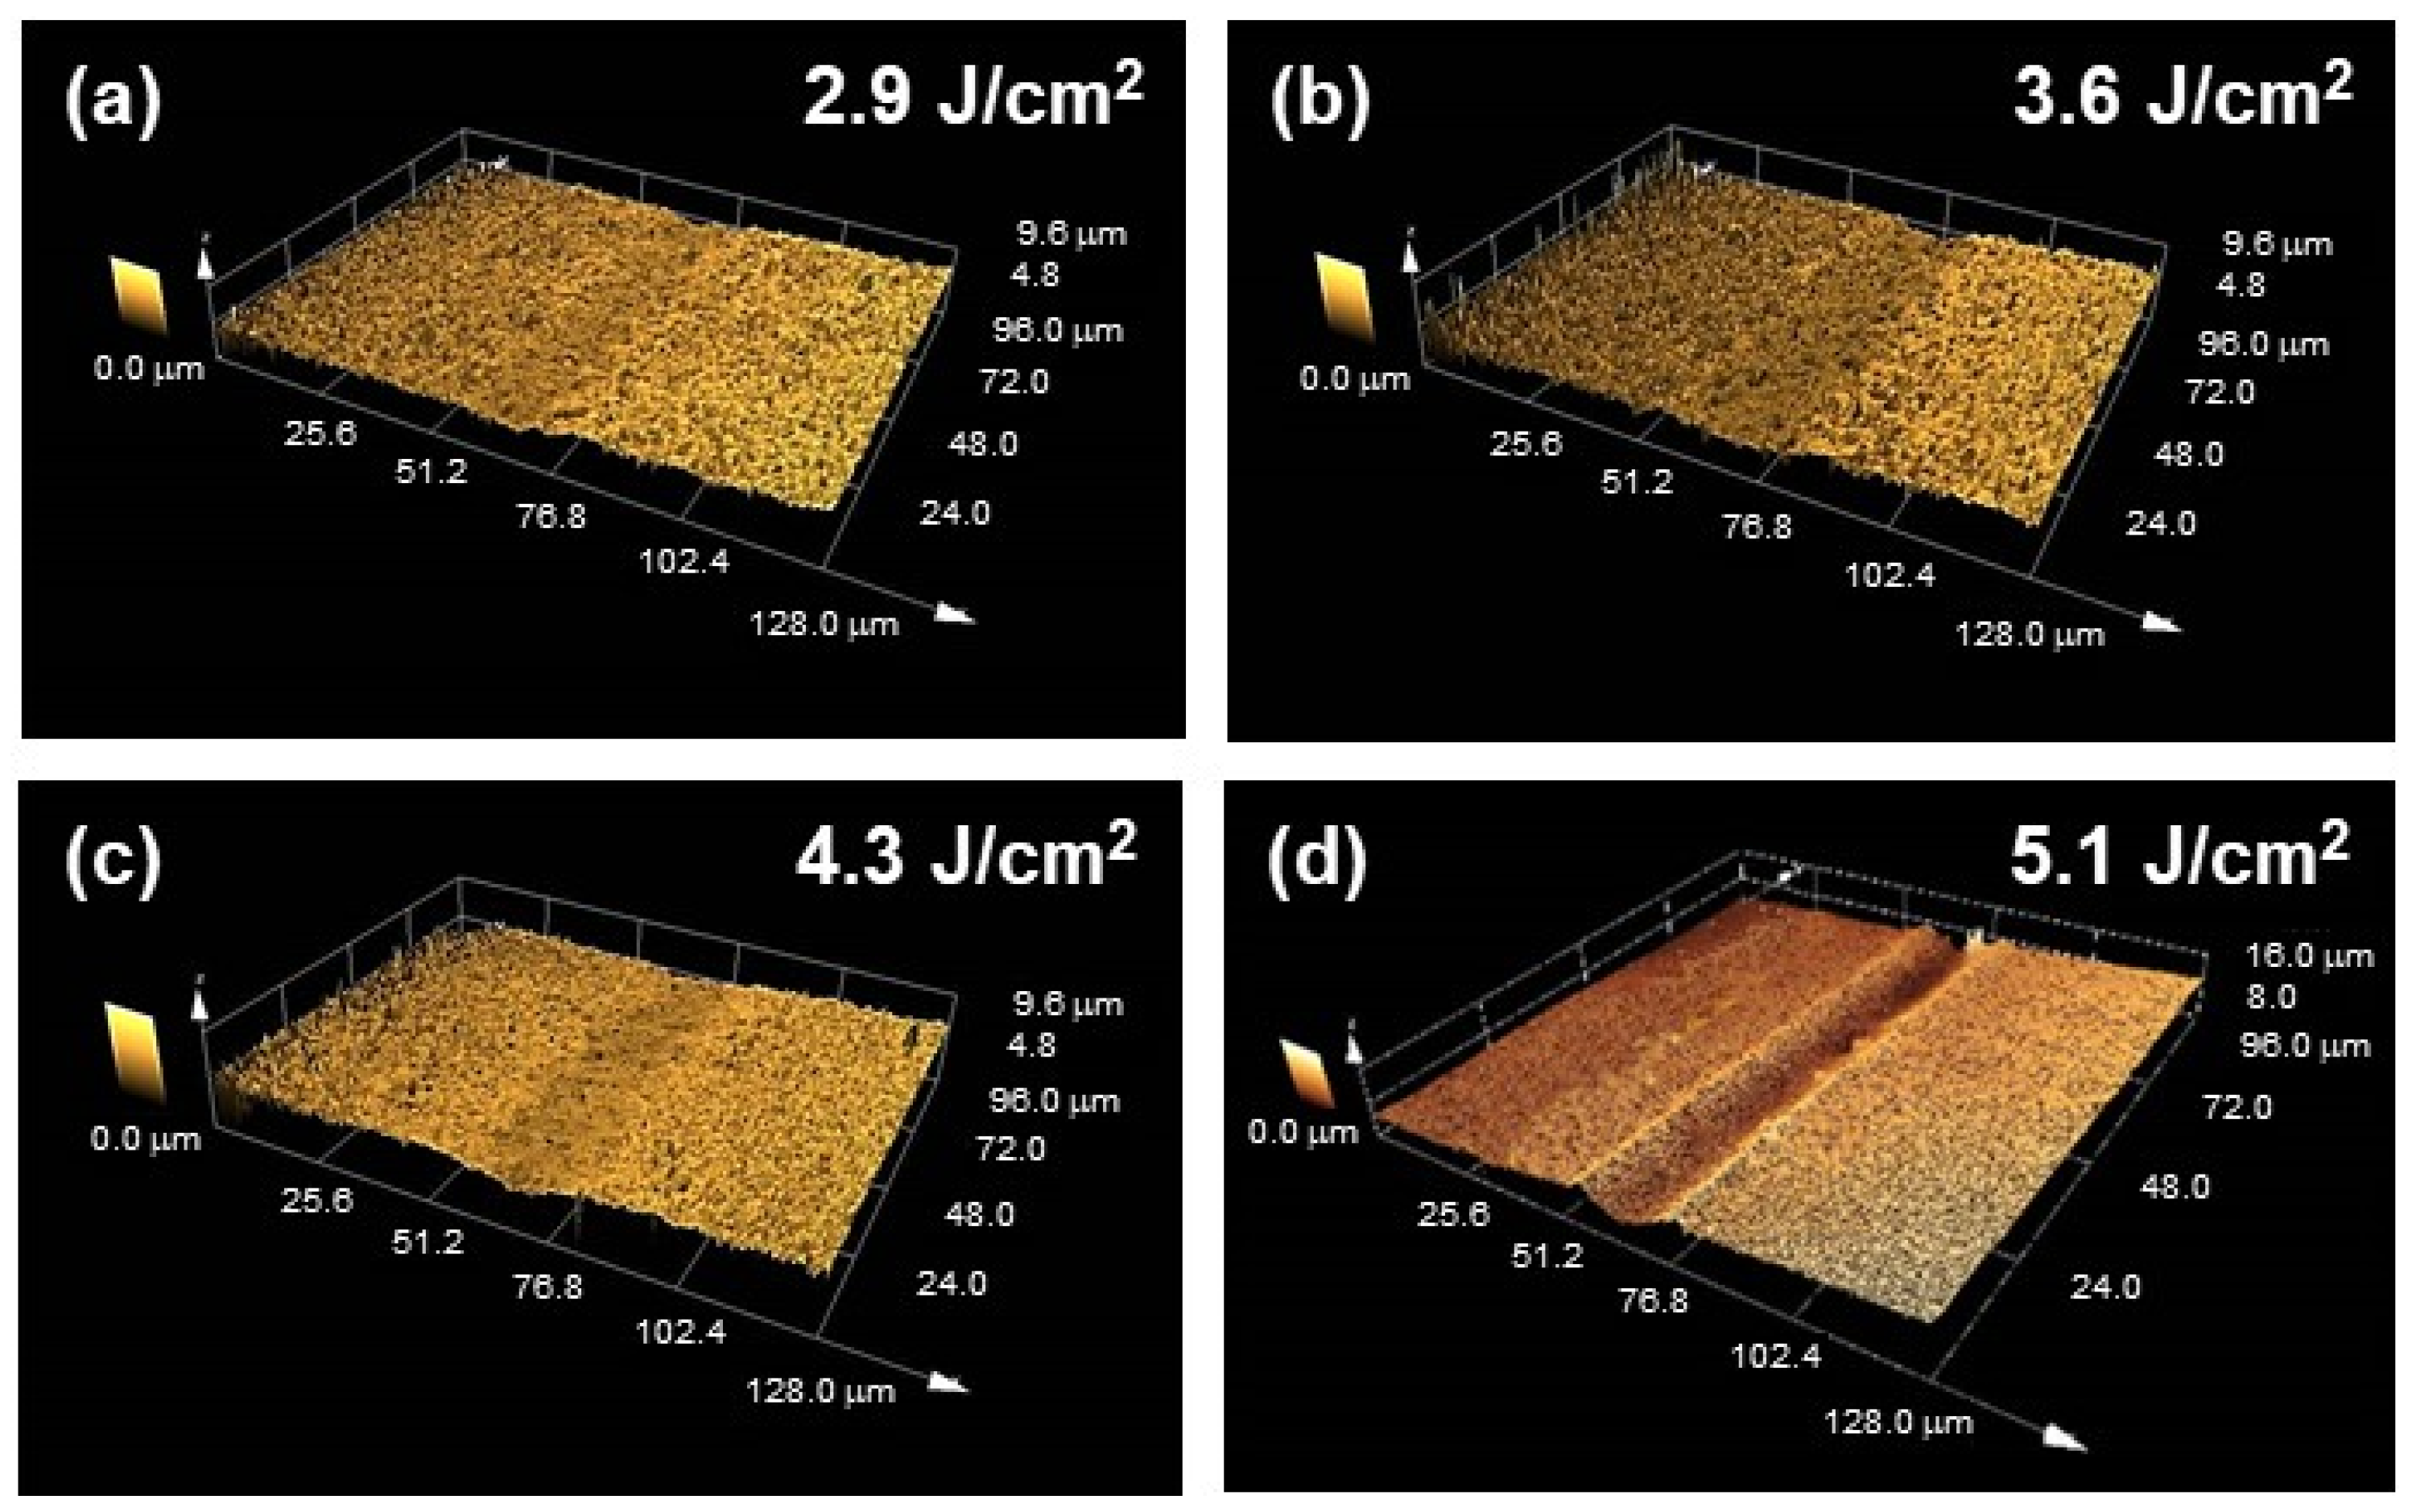
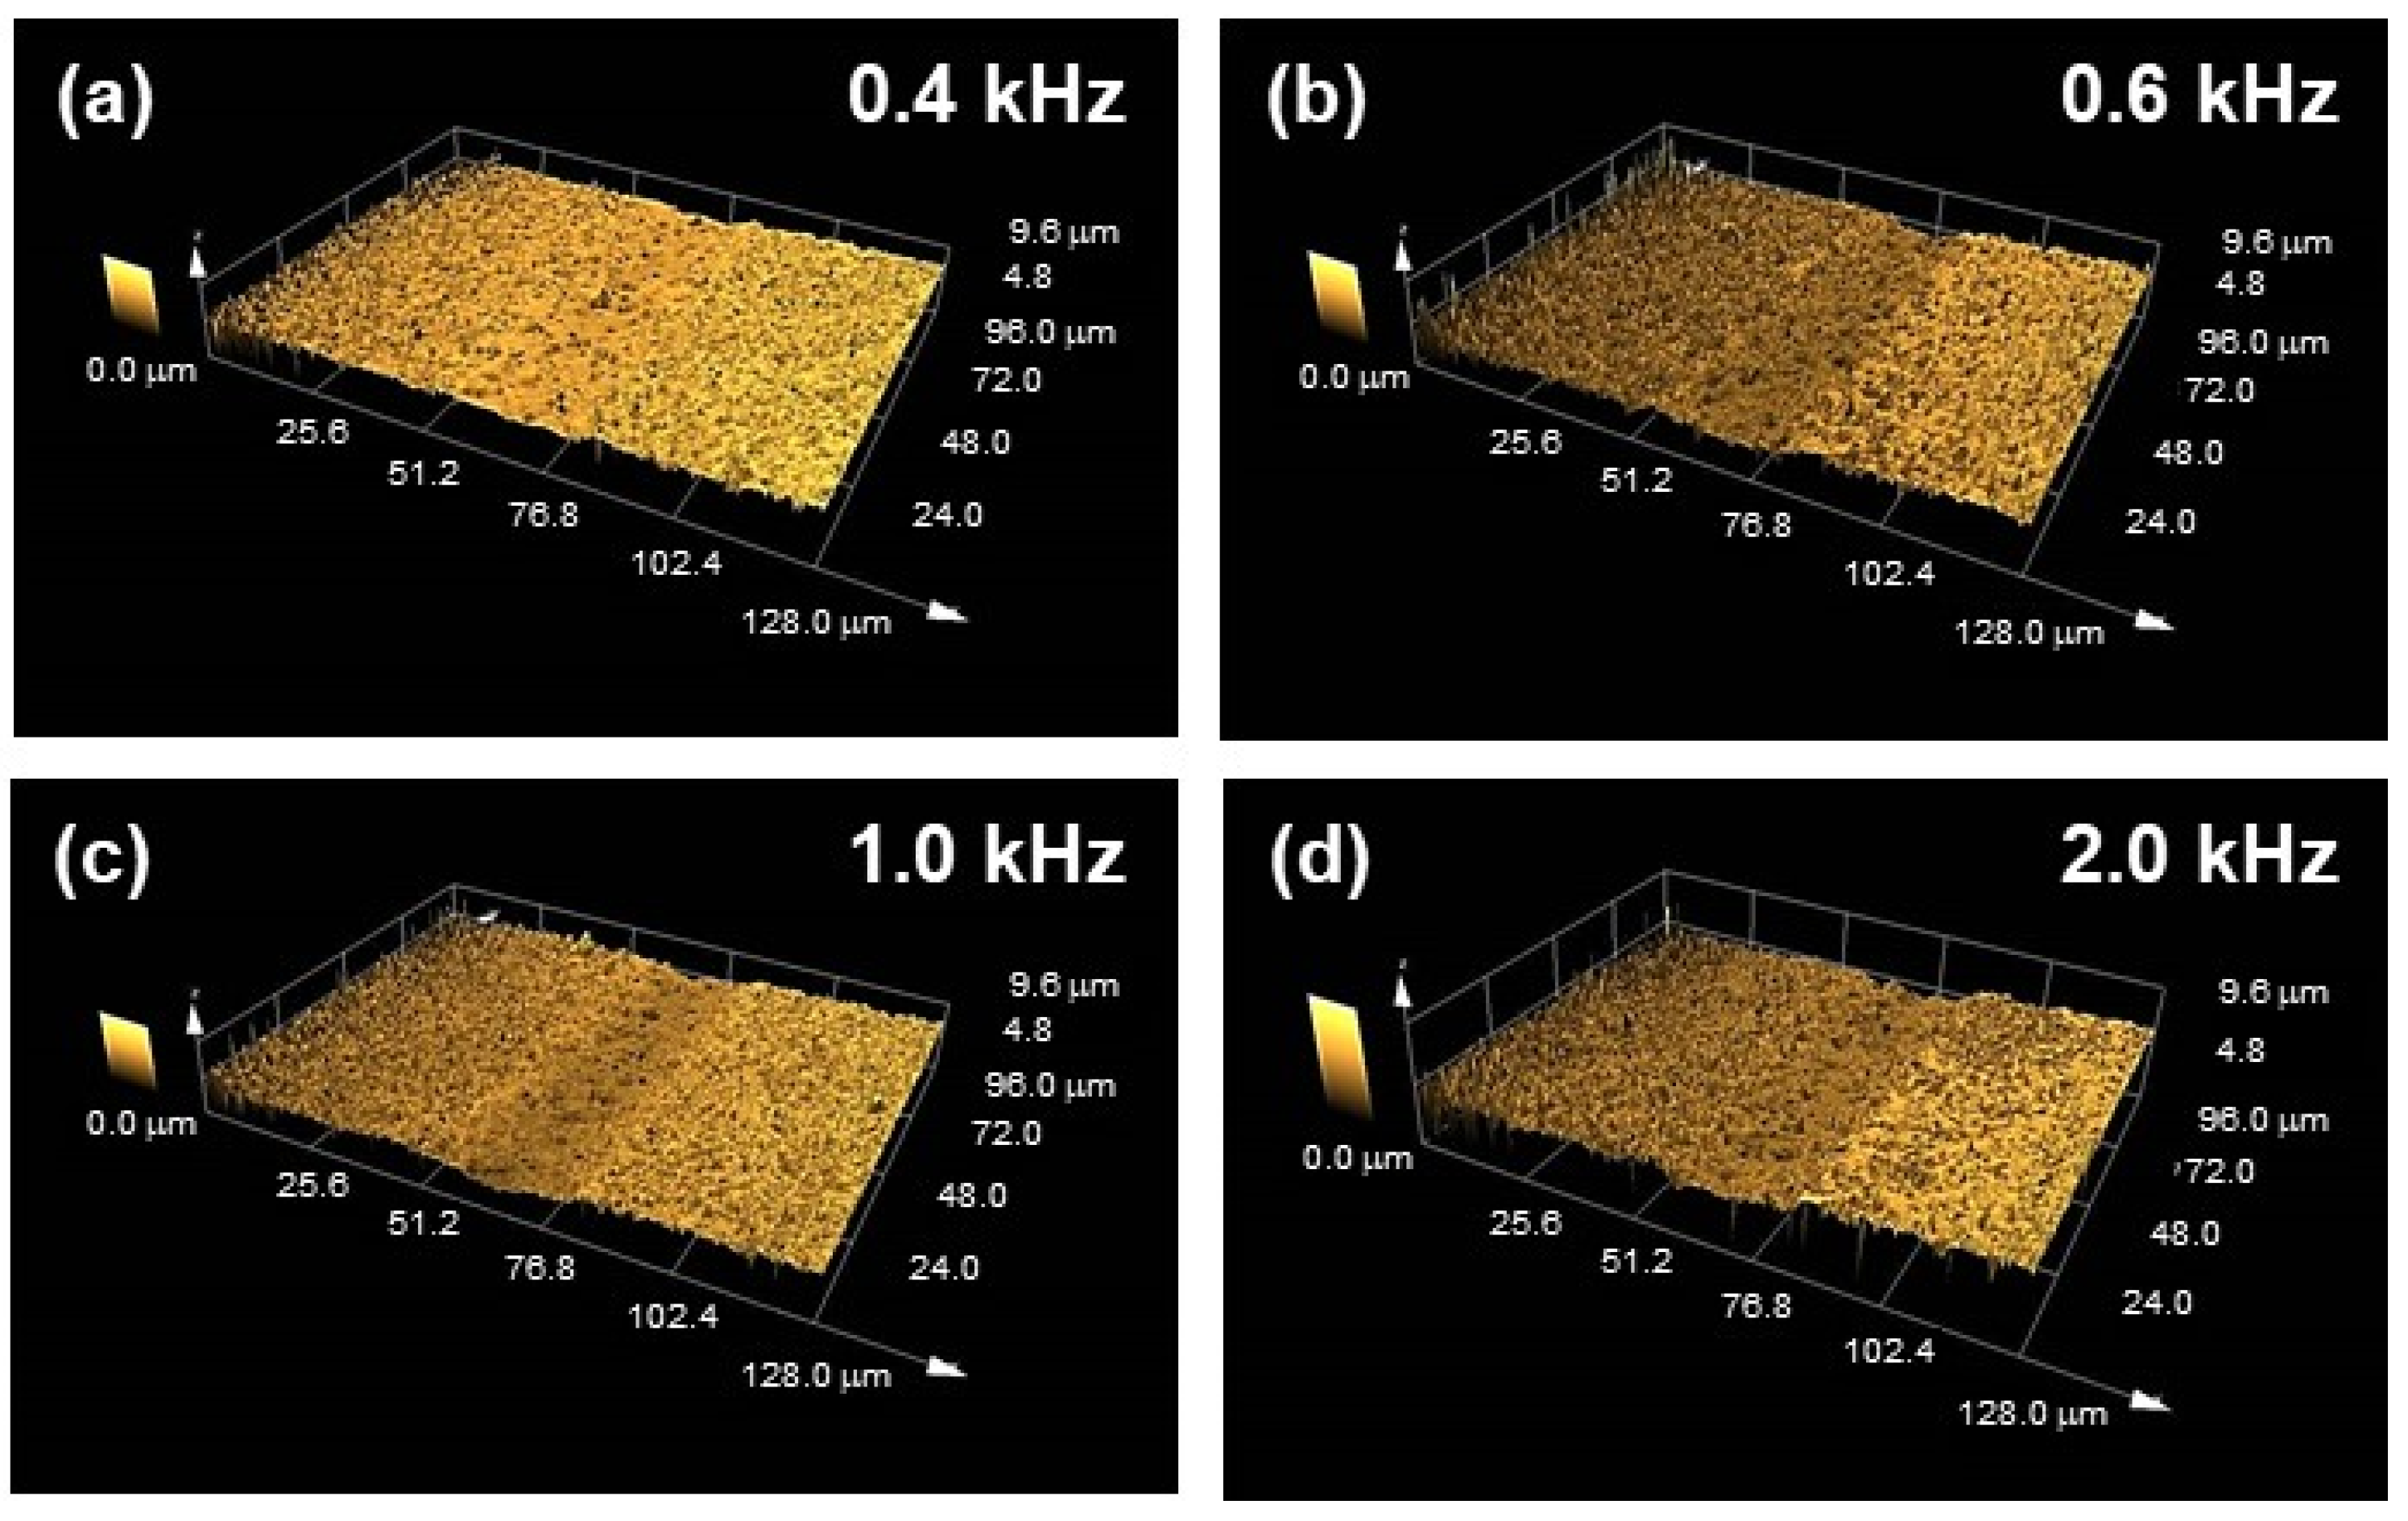
3.1. Surface Topography
3.2. Microstructure
3.3. Crystalline Phases
3.4. Chemical Composition
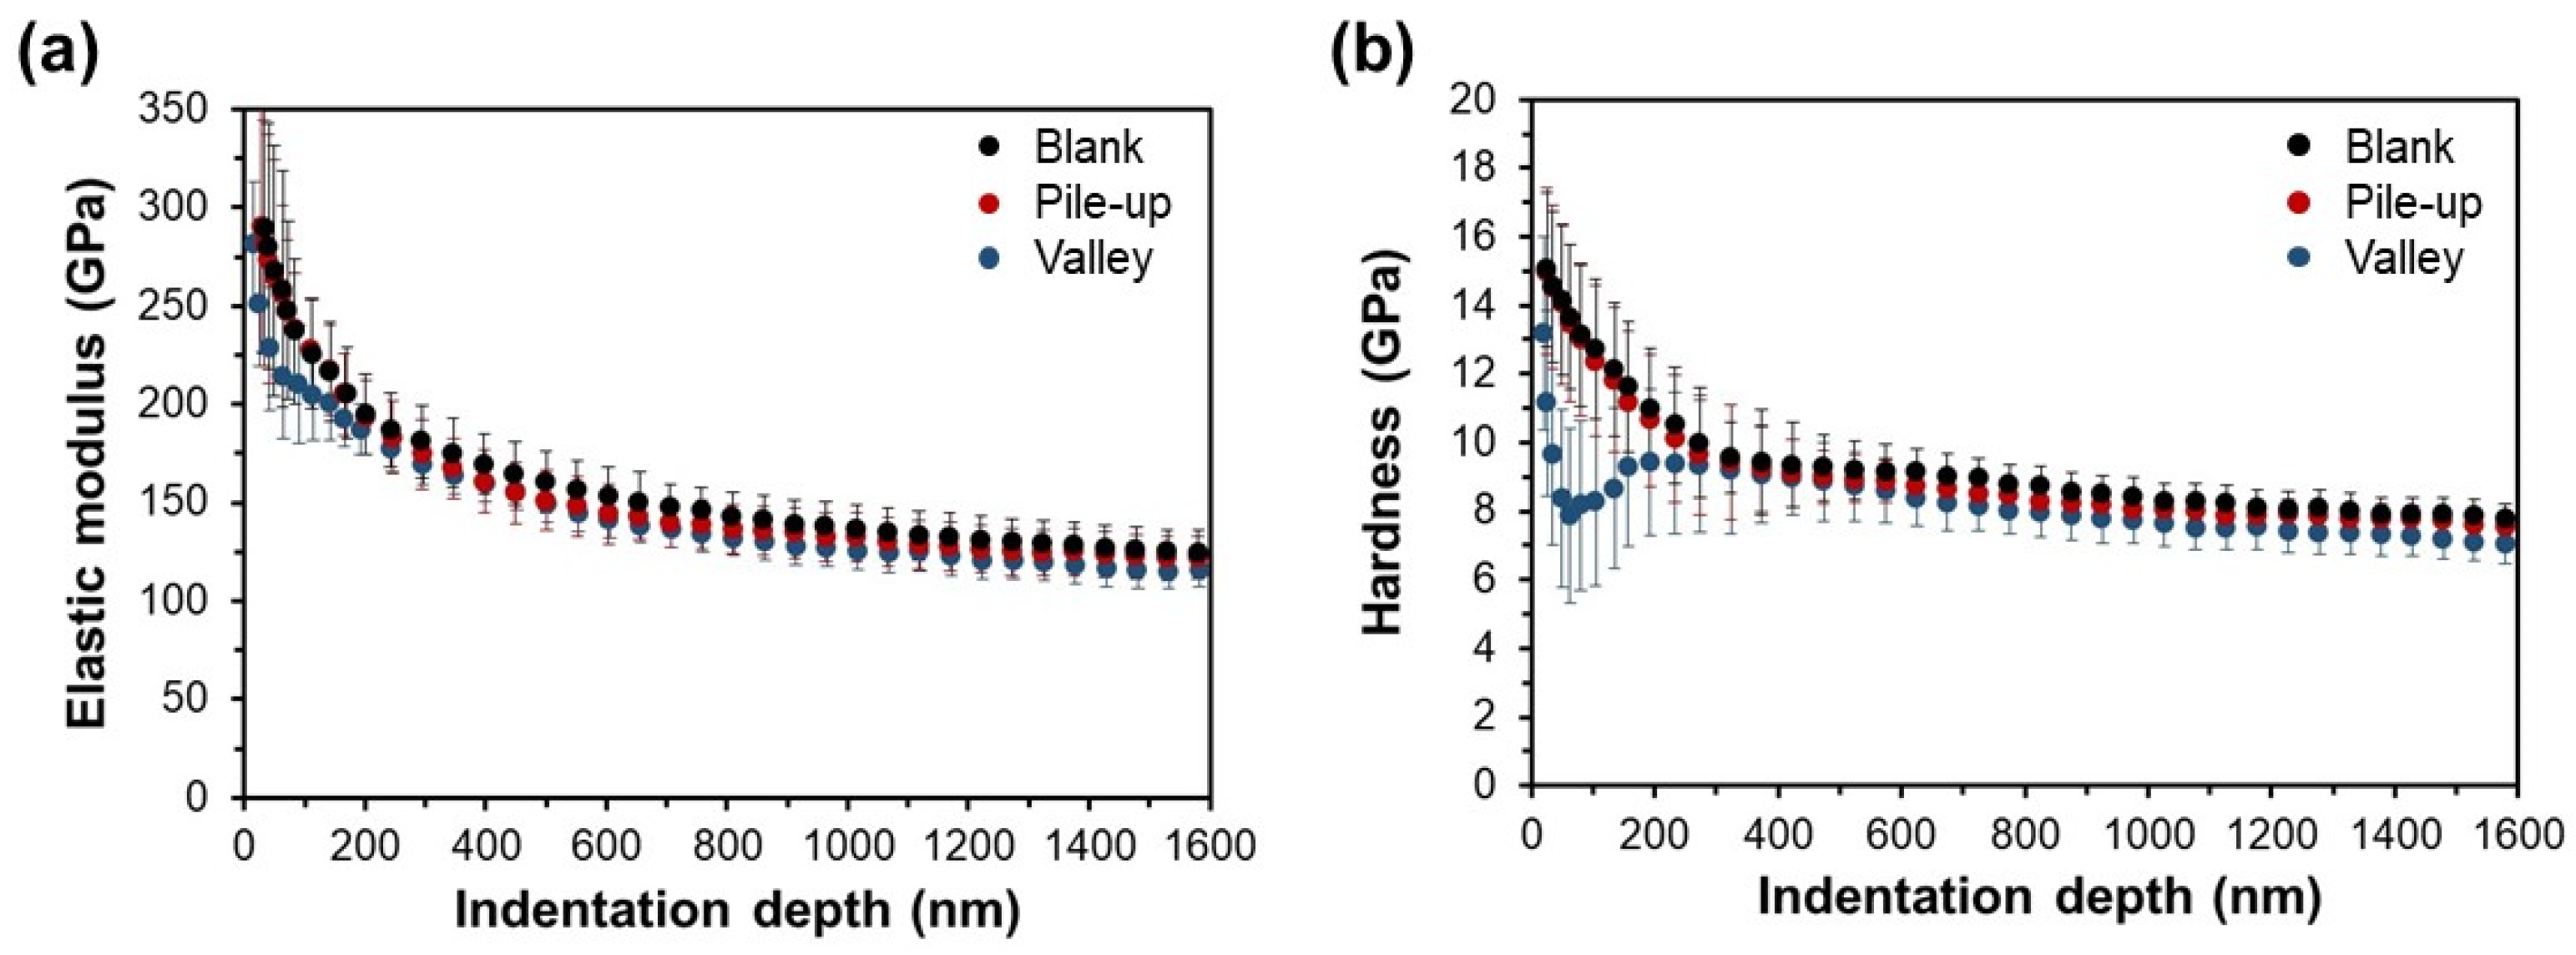
3.5. Mechanical Properties
4. Conclusions
- -
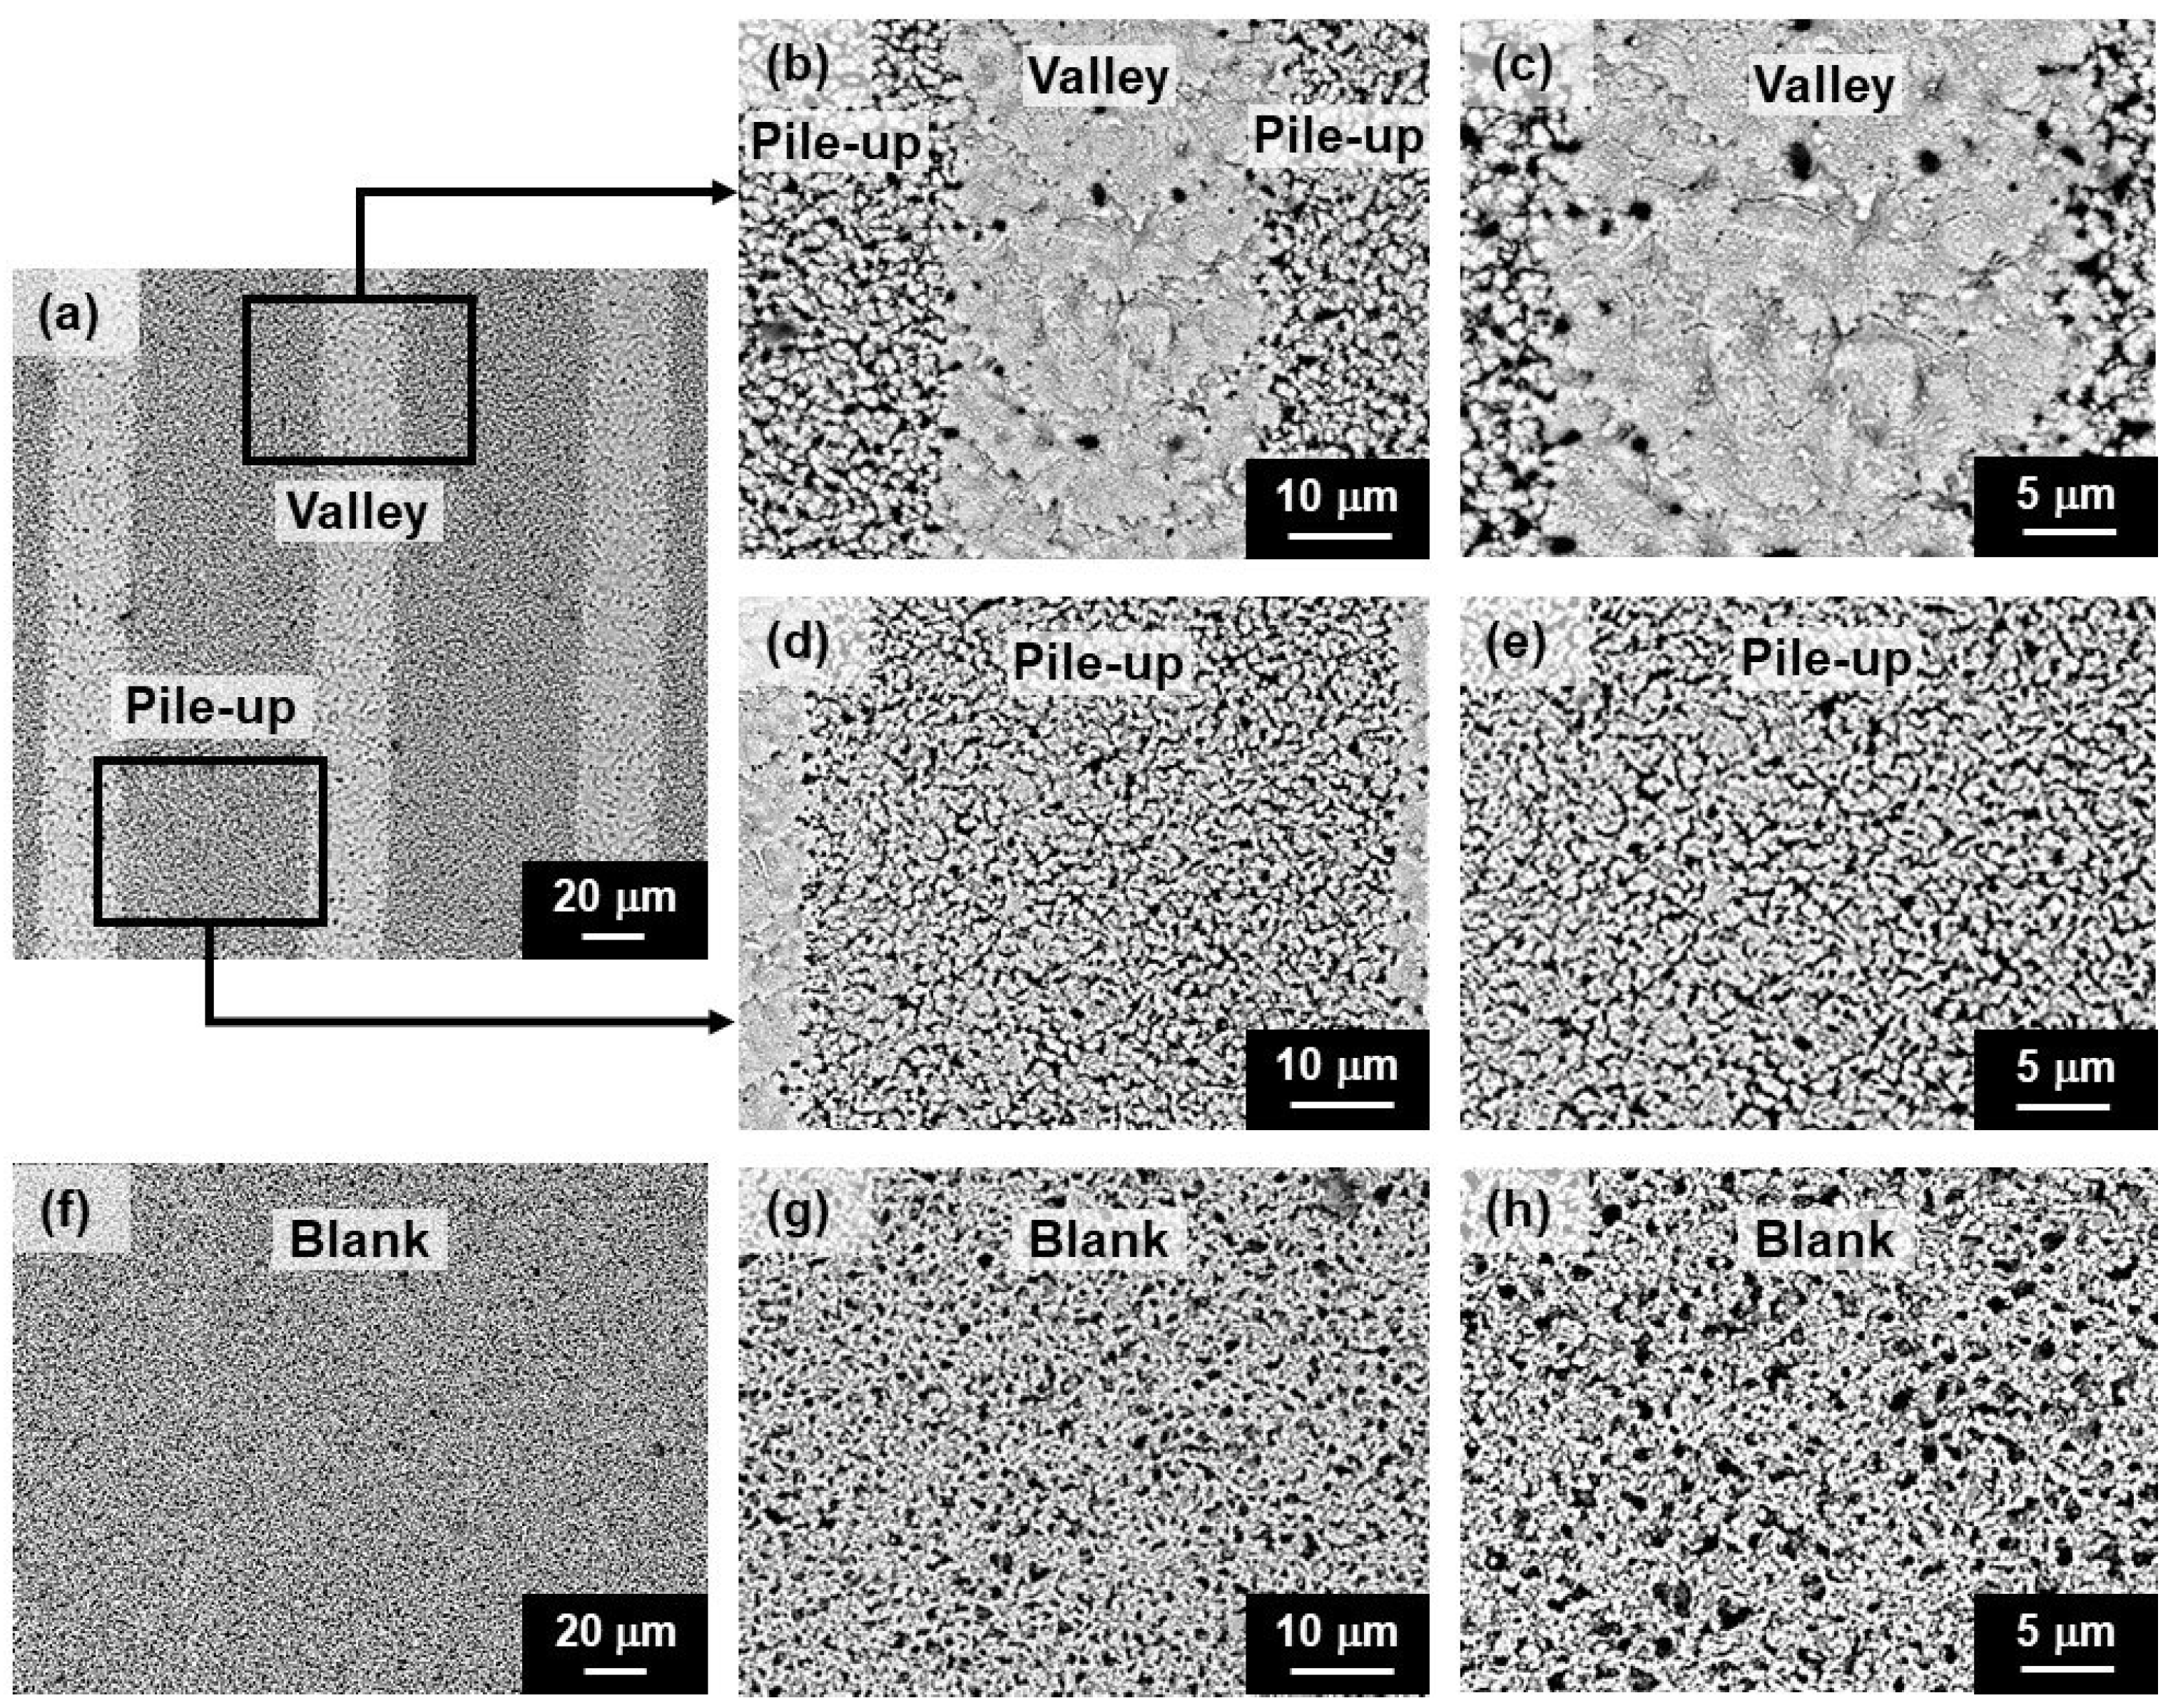
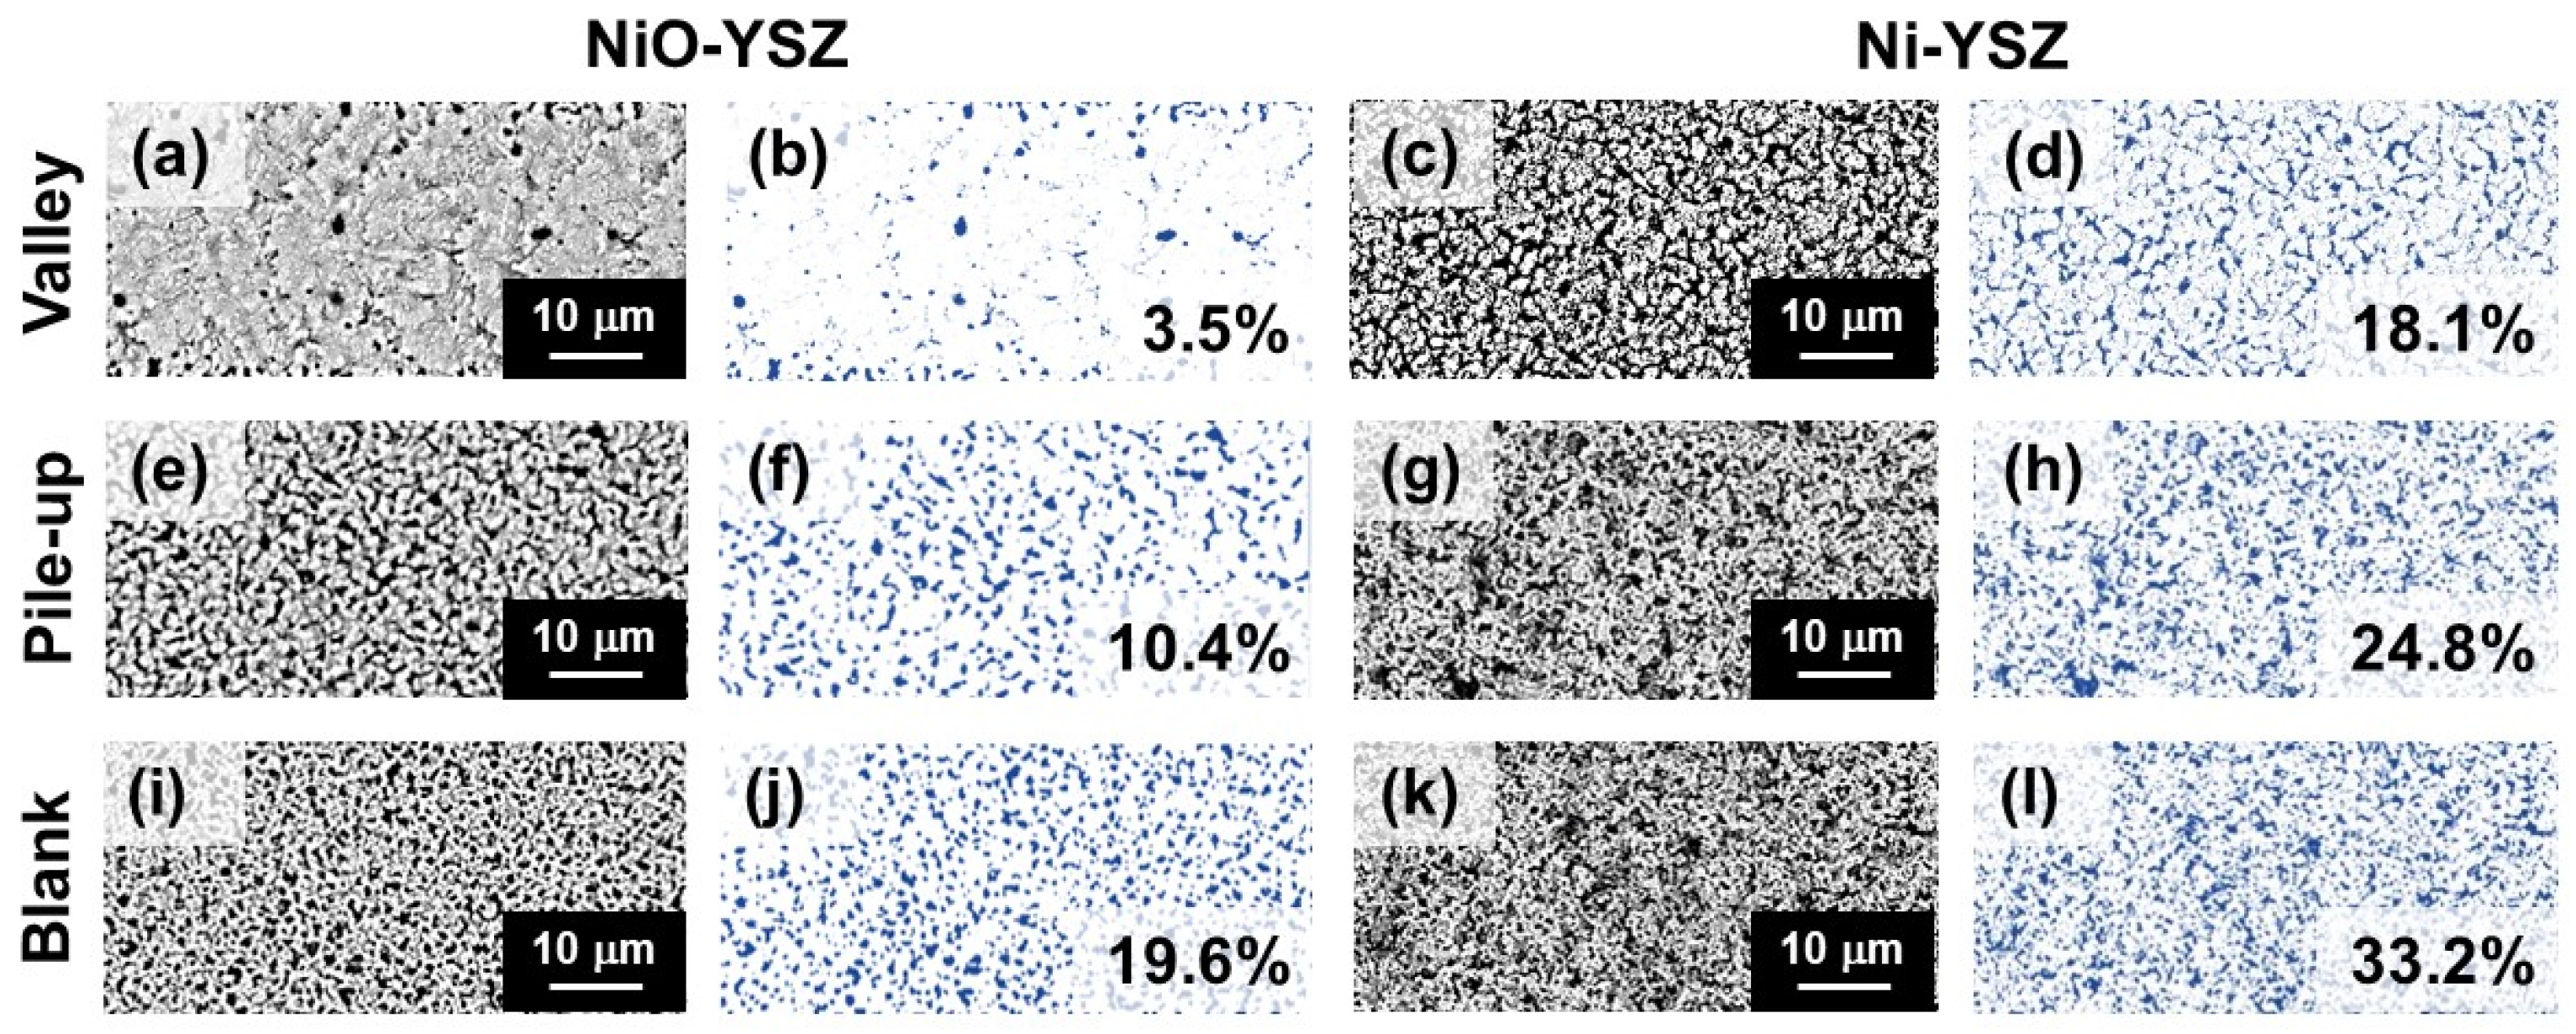
- The laser machining generated up to 2 µm thick laser-affected region, which presented intergranular microcracks and recrystallization with equaxial grains. The valley surface of laser tracks presented micro-cracks and a denser microstructure than the blank one, which was attributed to the thermal effects of laser machining. The microstructure of the pile-up region also exhibited a lower porosity than the blank surface, due to the partly deposited material from vaporization.
- -
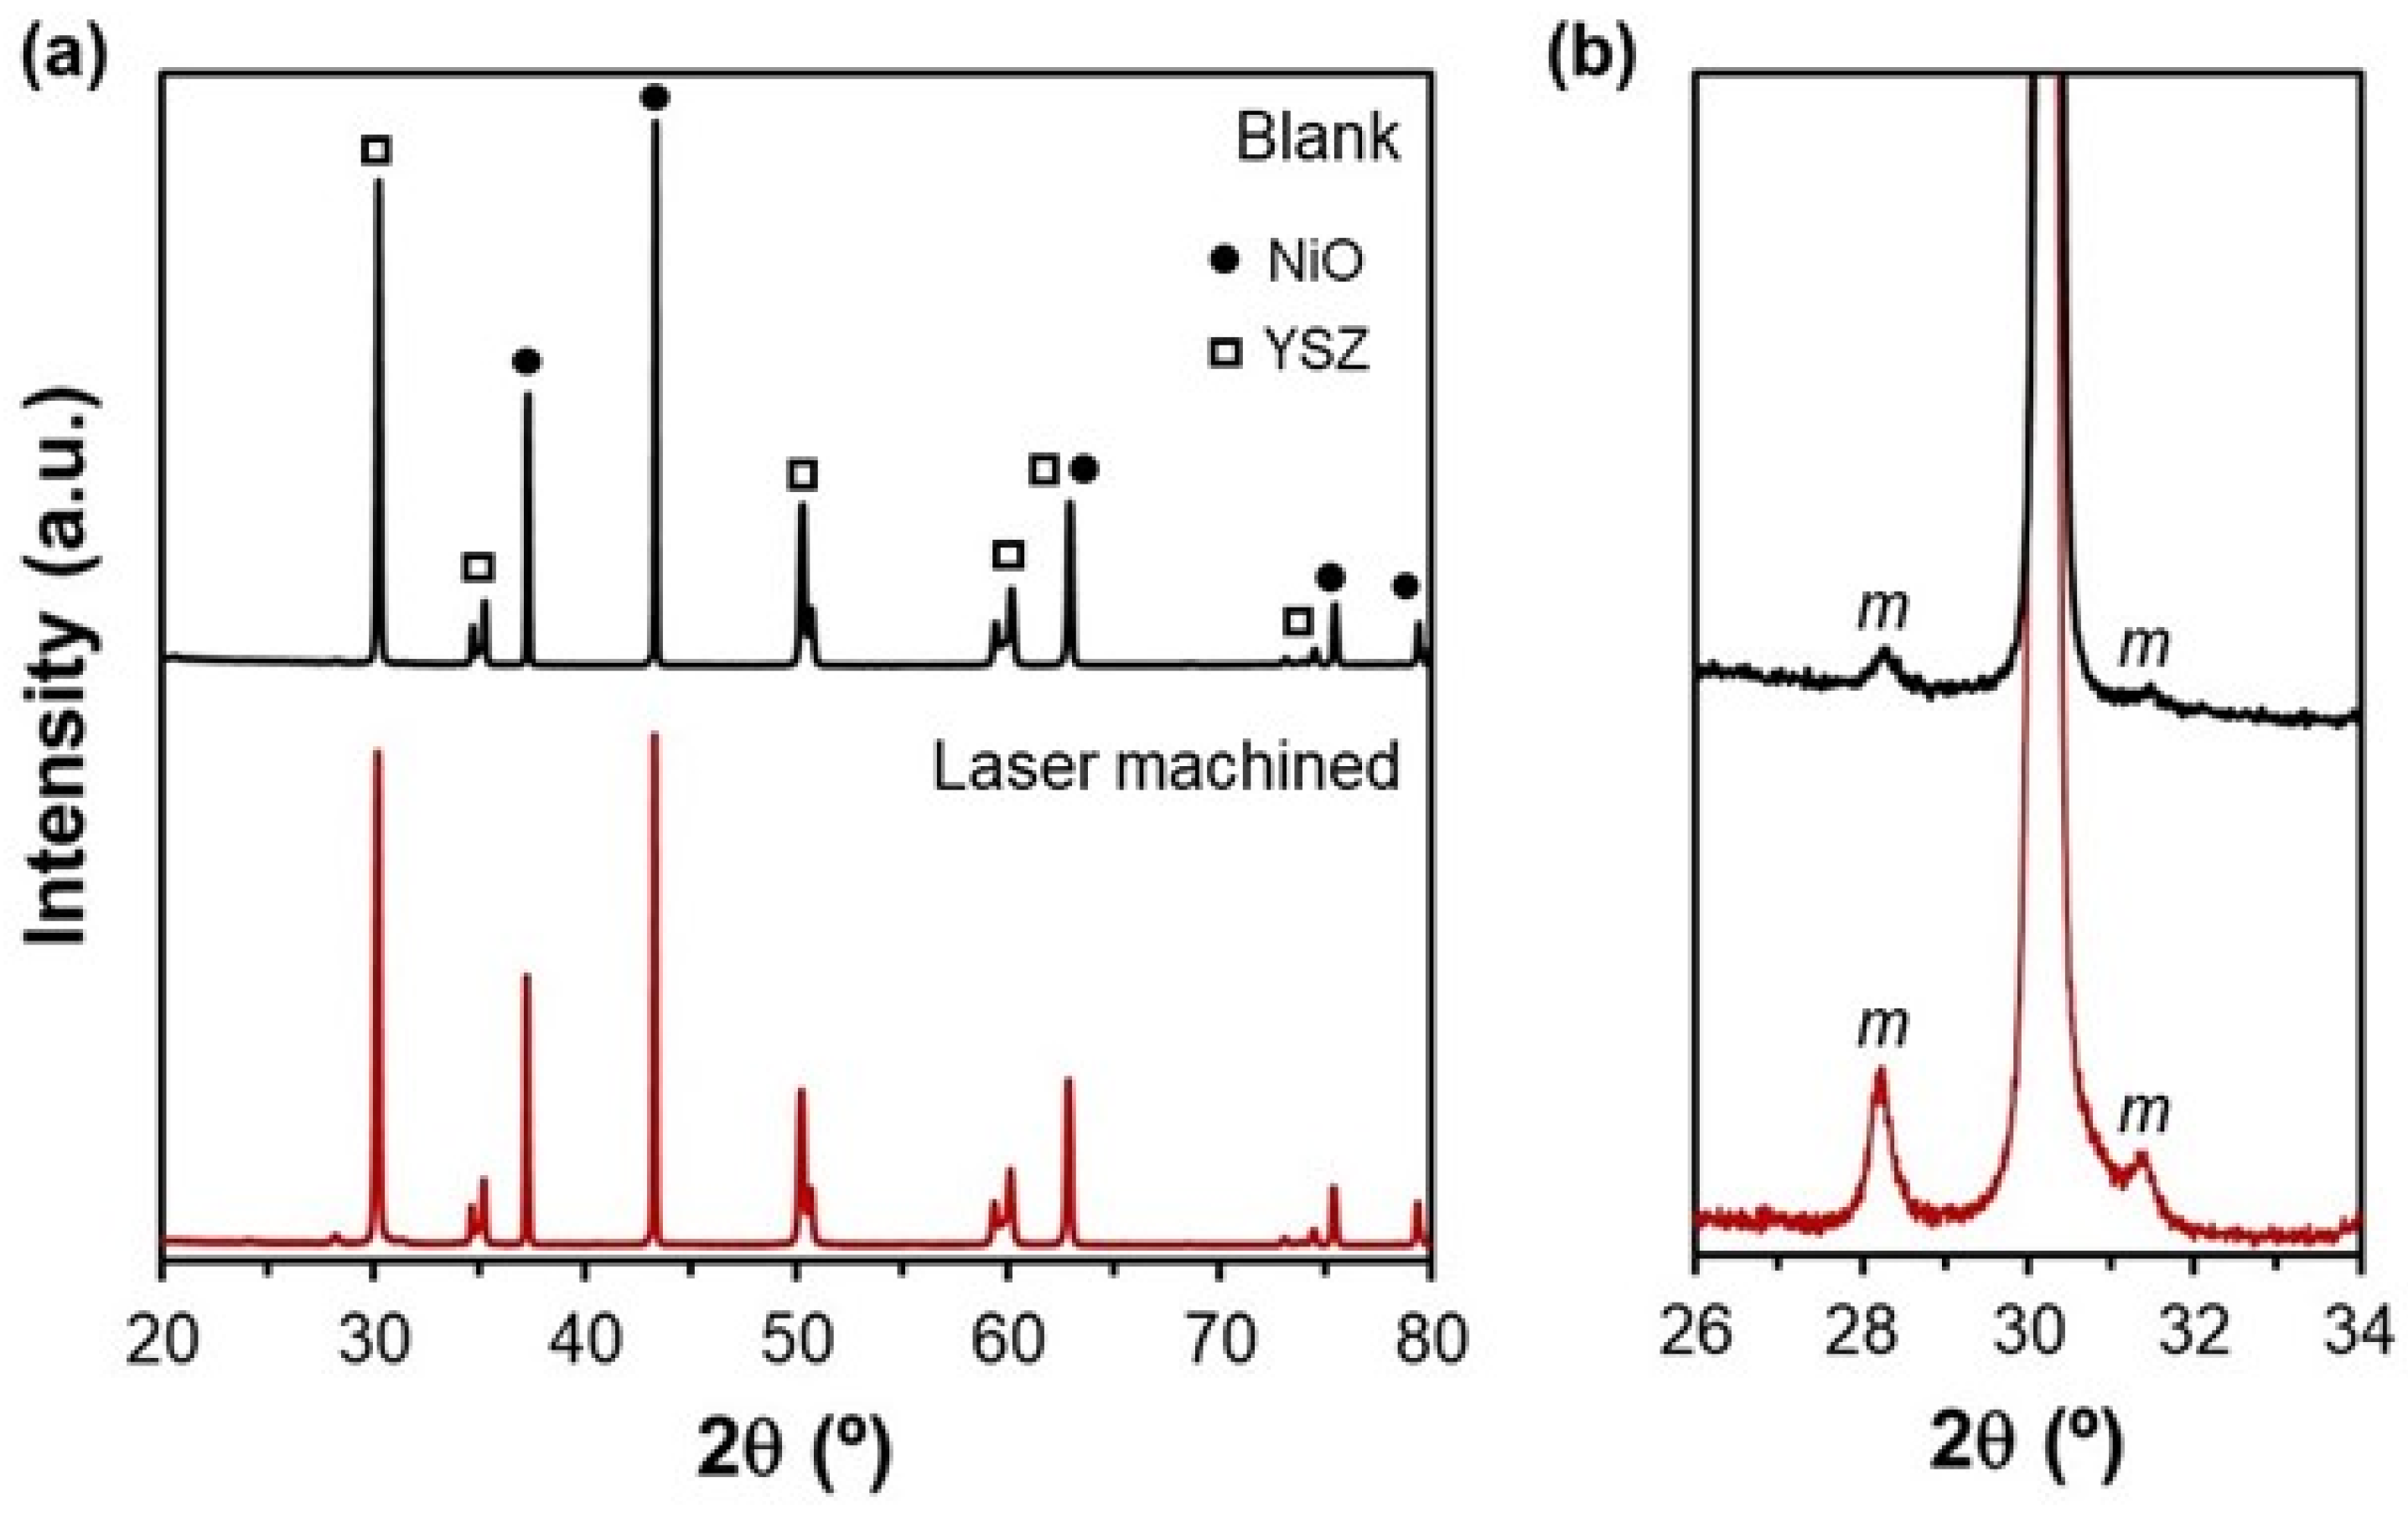
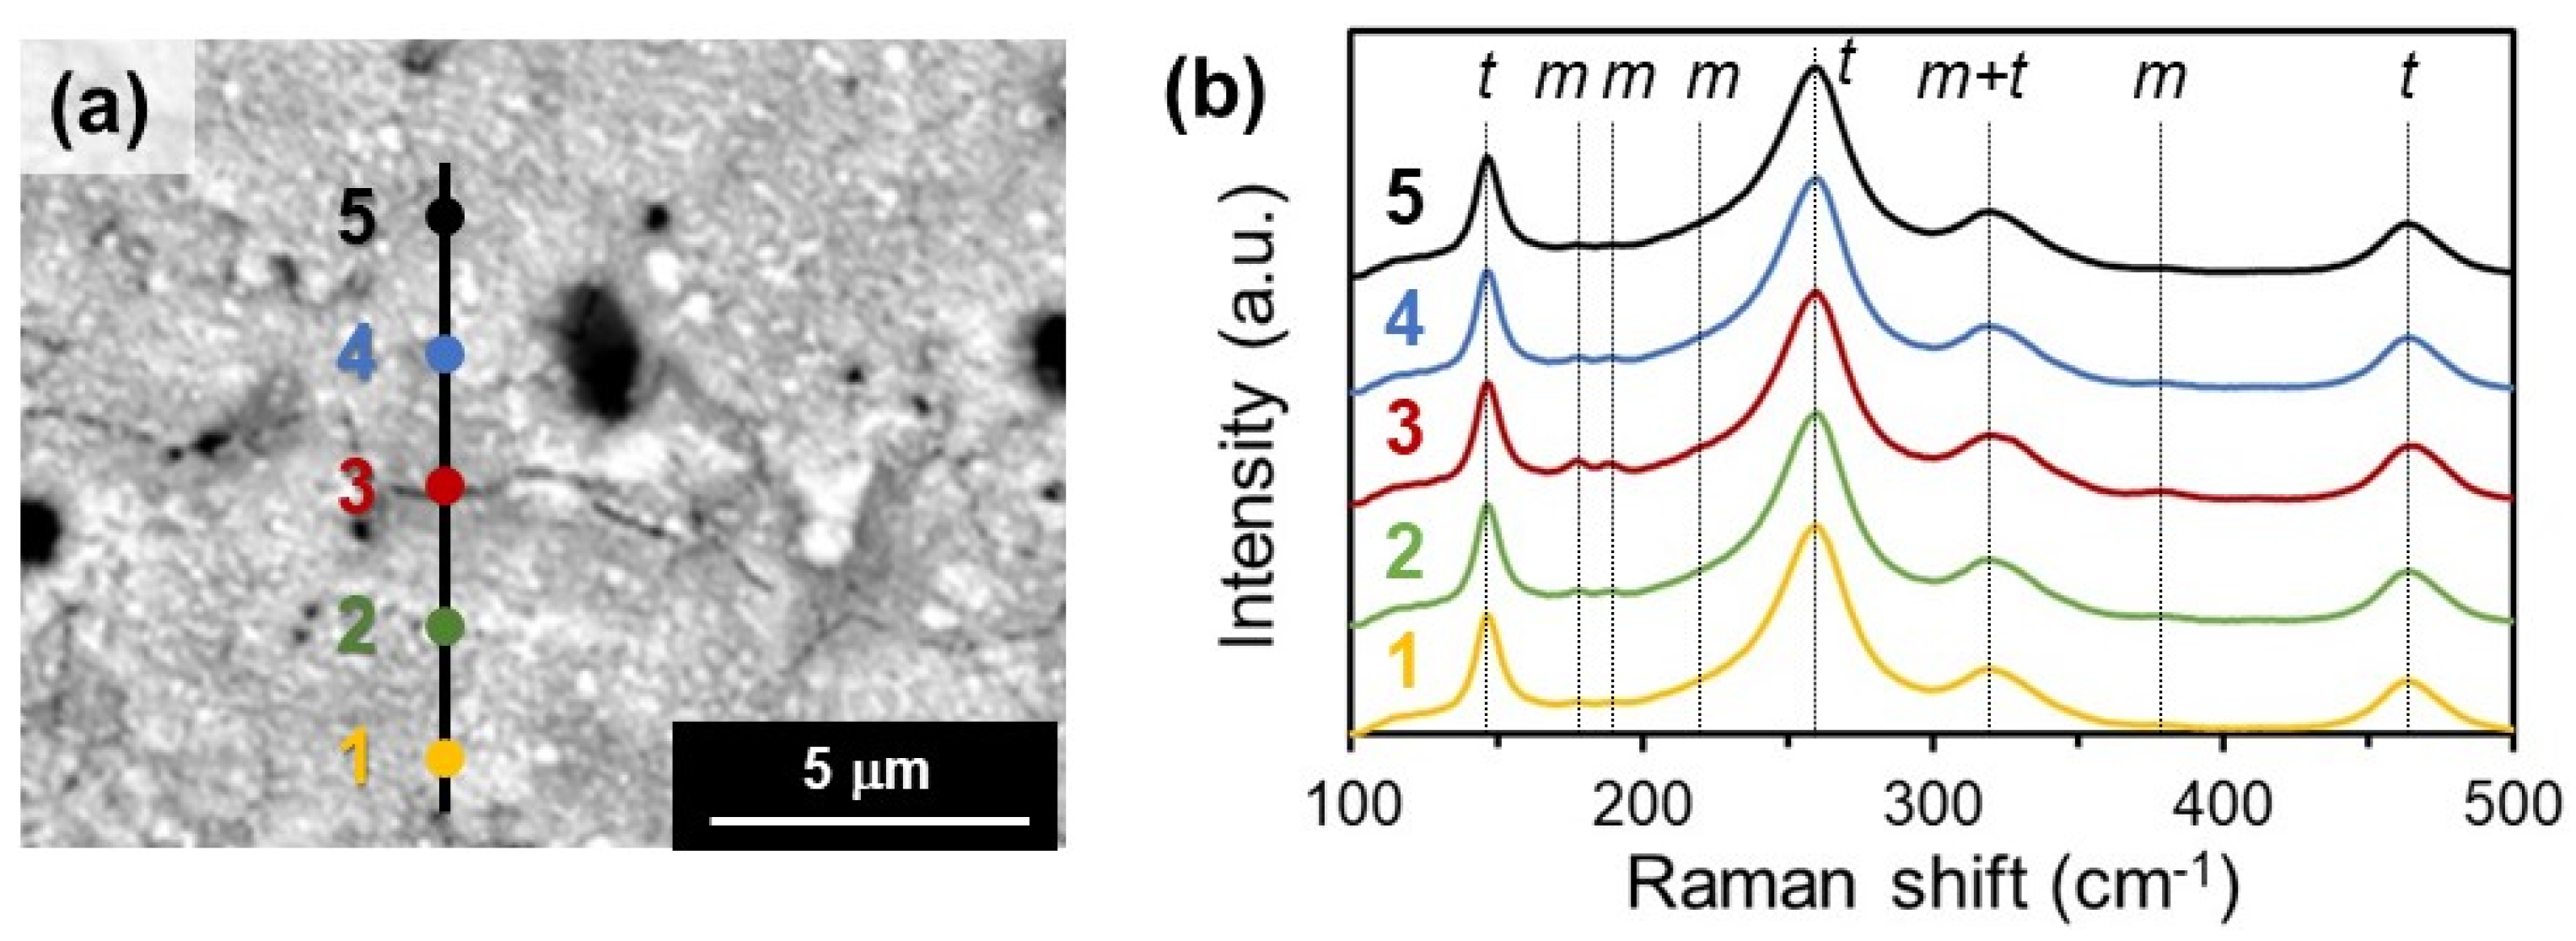
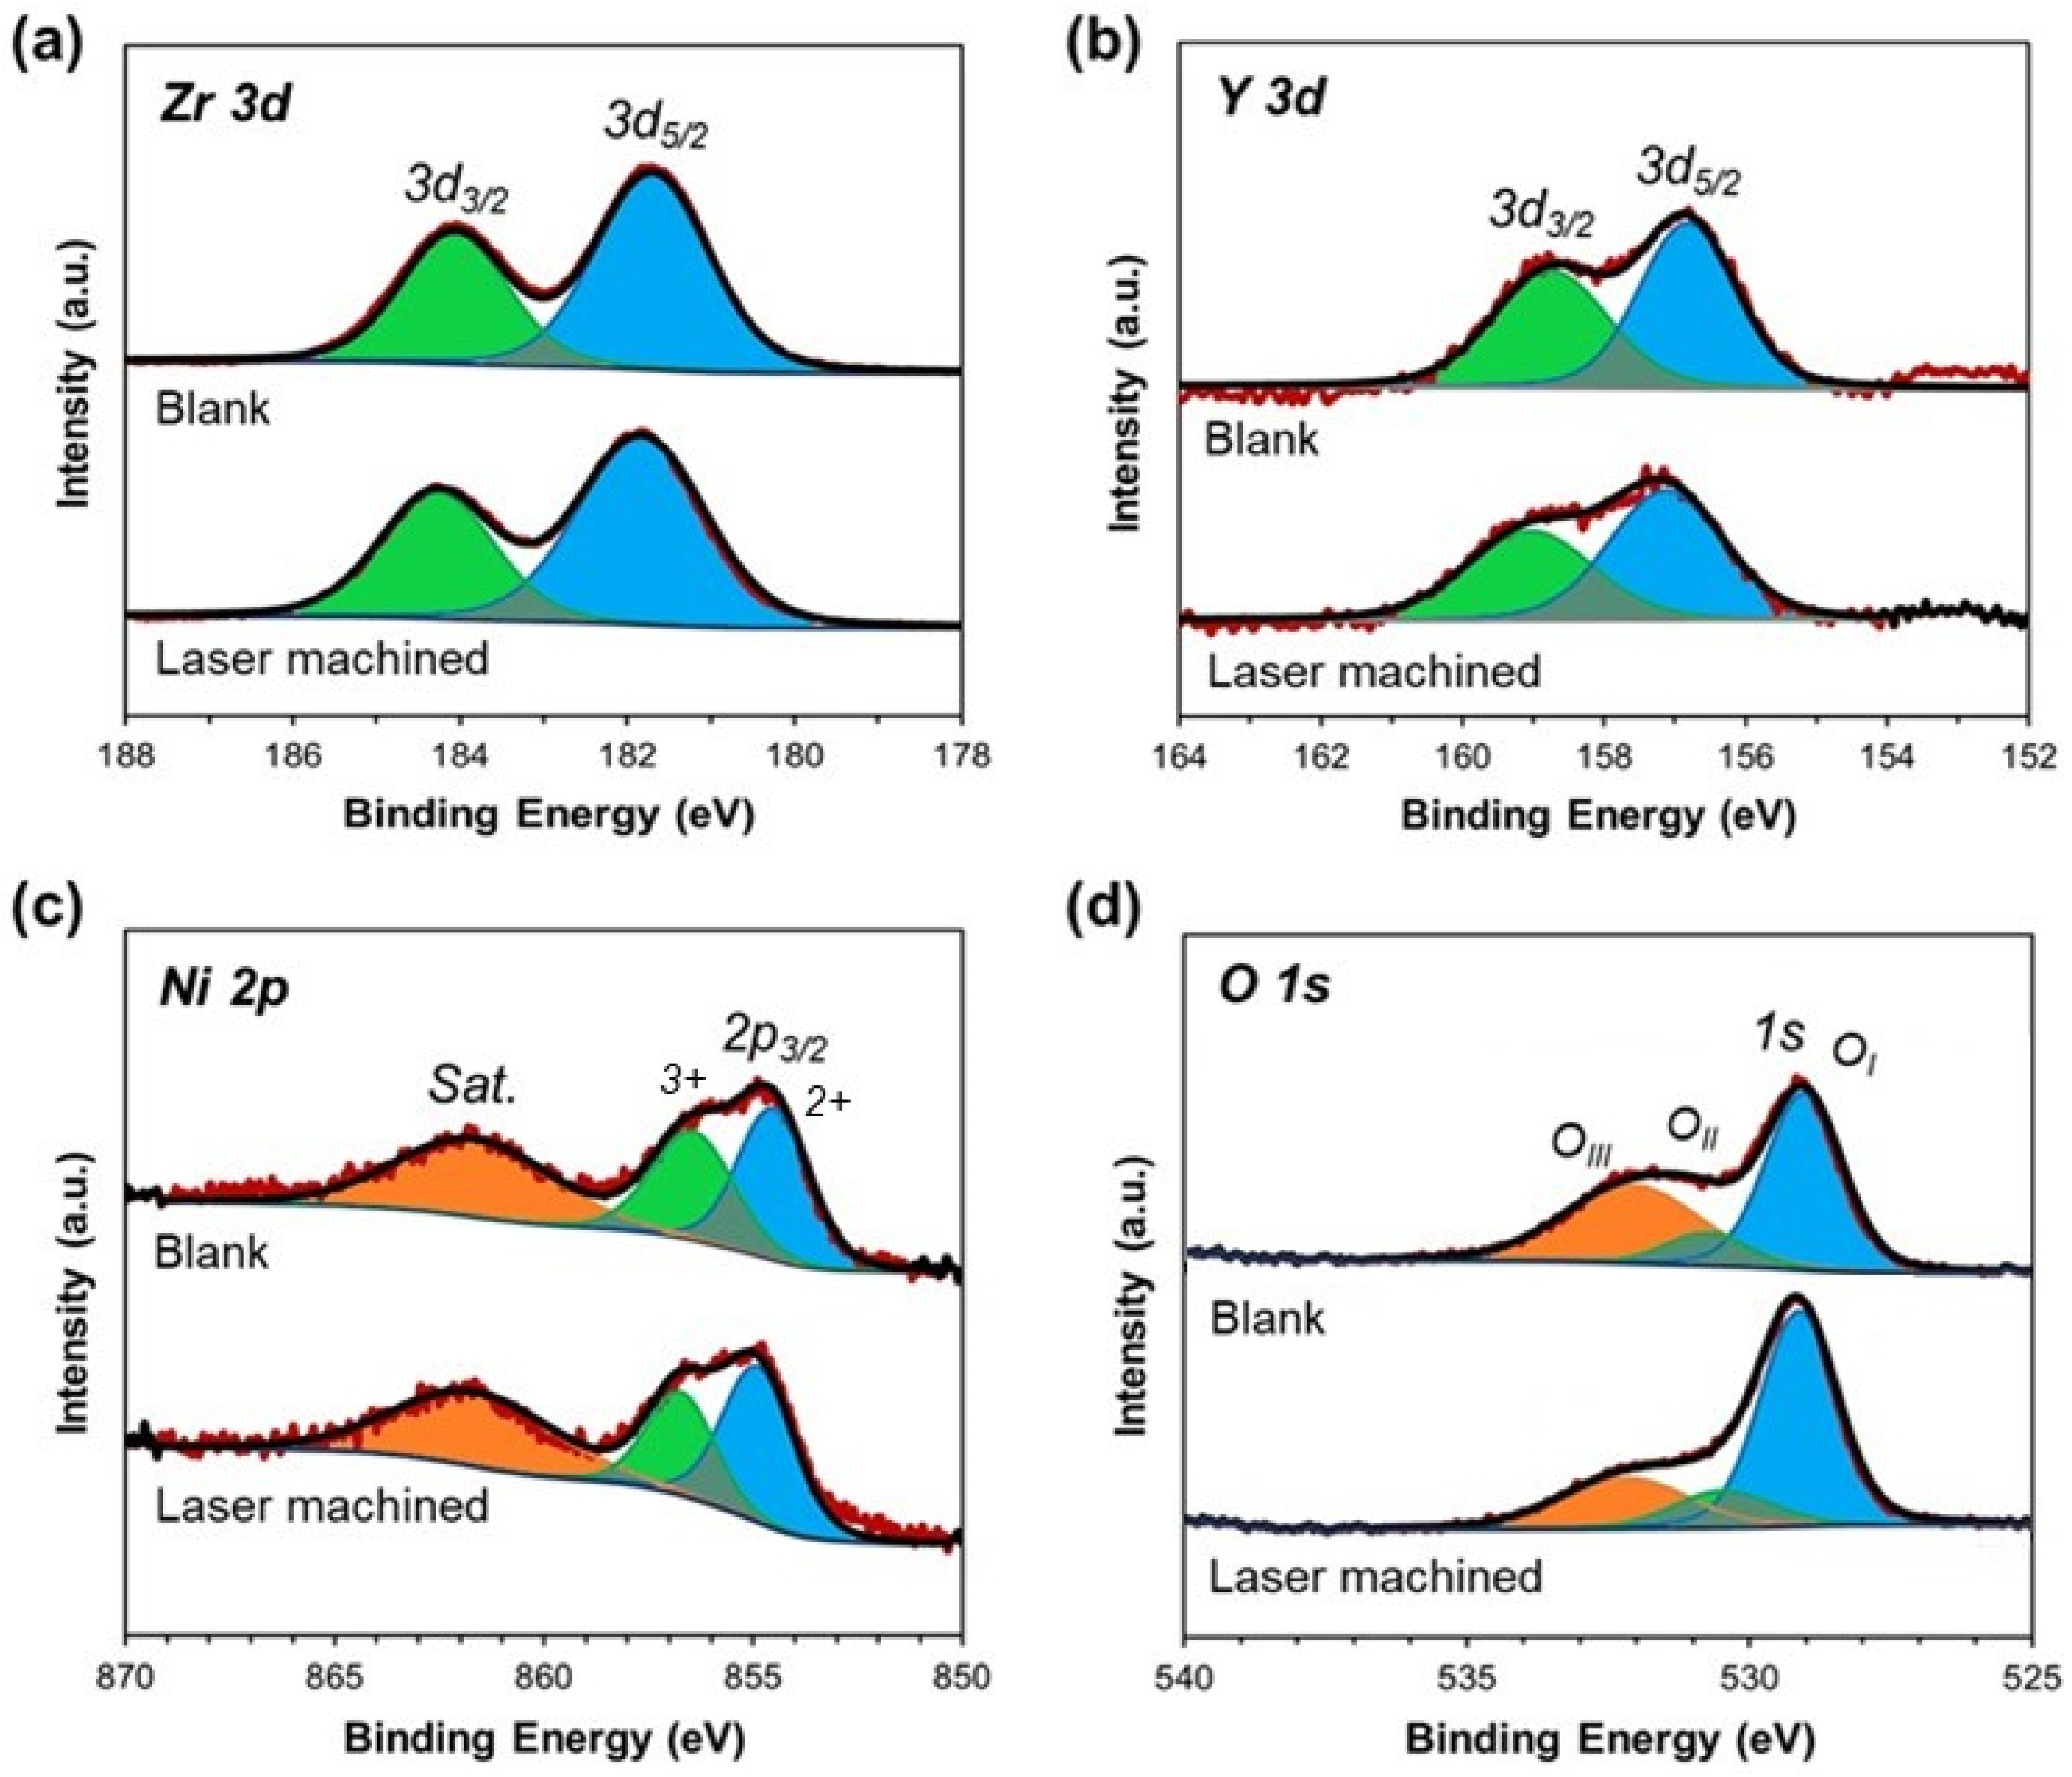
- XRD and XPS analyses evidenced a small decrease in Ni (<5%) in the machined sample, which was mainly due to the major evaporation and ejection of NiO compared to YSZ during laser treatment. In addition, laser machining induced the doped zirconia transformation from the tetragonal to monoclinic phase on the treated surface, which was limited to only the regions close to cracks.
- -
- Nanoindentation tests showed that the laser-treated surfaces only presented a decrease in elastic modulus and hardness at low indentation depths (within the range of 0–200 nm). It was attributed to the presence of micro-cracks, and certain roughness at the laser-treated surface, due to the thermal effects and the induced topography caused by laser treatment. Therefore, this corroborated that the damage and the extension of HAZ induced during the laser treatment were very limited.
Author Contributions
Funding
Conflicts of Interest
References
- Stambouli, A.B.; Traversa, E. Solid Oxide Fuel Cells (SOFCs): A Review of an Environmentally Clean and Efficient Source of Energy. Renew. Sustain. Energy Rev. 2002, 6, 433–455. [Google Scholar] [CrossRef]
- Singhal, S.C.; Kendall, K. High-Temperature Solid Oxide Fuel Cells: Fundamentals, Design, and Applications; Elsevier: Amsterdam, The Netherlands, 2003; p. 405. [Google Scholar]
- Zakaria, Z.; Abu Hassan, S.H.; Shaari, N.; Yahaya, A.Z.; Boon Kar, Y. A Review on Recent Status and Challenges of Yttria Stabilized Zirconia Modification to Lowering the Temperature of Solid Oxide Fuel Cells Operation. Int. J. Energy Res. 2020, 44, 631–650. [Google Scholar] [CrossRef]
- Hussain, S.; Yangping, L. Review of Solid Oxide Fuel Cell Materials: Cathode, Anode, and Electrolyte. Energy Transit. 2020, 4, 113–126. [Google Scholar] [CrossRef]
- Mahato, N.; Banerjee, A.; Gupta, A.; Omar, S.; Balani, K. Progress in Material Selection for Solid Oxide Fuel Cell Technology: A Review. Prog. Mater. Sci. 2015, 72, 141–337. [Google Scholar] [CrossRef]
- Lee, J.H.; Moon, H.; Lee, H.W.; Kim, J.; Kim, J.D.; Yoon, K.H. Quantitative Analysis of Microstructure and Its Related Electrical Property of SOFC Anode, Ni–YSZ Cermet. Solid State Ionics 2002, 148, 15–26. [Google Scholar] [CrossRef]
- Morales, M.; Laguna-Bercero, M.Á. Influence of Anode Functional Layers on Electrochemical Performance and Mechanical Strength in Microtubular Solid Oxide Fuel Cells Fabricated by Gel-Casting. ACS Appl. Energy Mater. 2018, 1, 2024–2031. [Google Scholar] [CrossRef] [Green Version]
- Brus, G.; Miyawaki, K.; Iwai, H.; Saito, M.; Yoshida, H. Tortuosity of an SOFC Anode Estimated from Saturation Currents and a Mass Transport Model in Comparison with a Real Micro-Structure. Solid State Ionics 2014, 265, 13–21. [Google Scholar] [CrossRef]
- Morales, M.; Laguna-Bercero, M.A.; Navarro, M.E.; Espiell, F.; Segarra, M. The Effect of Anode Support on the Electrochemical Performance of Microtubular Solid Oxide Fuel Cells Fabricated by Gel-Casting. RSC Adv. 2015, 5, 39350–39357. [Google Scholar] [CrossRef] [Green Version]
- Tjaden, B.; Brett, D.J.L.; Shearing, P.R. Tortuosity in Electrochemical Devices: A Review of Calculation Approaches. Int. Mater. Rev. 2016, 63, 47–67. [Google Scholar] [CrossRef] [Green Version]
- Smith, J.R.; Chen, A.; Gostovic, D.; Hickey, D.; Kundinger, D.; Duncan, K.L.; DeHoff, R.T.; Jones, K.S.; Wachsman, E.D. Evaluation of the Relationship between Cathode Microstructure and Electrochemical Behavior for SOFCs. Solid State Ionics 2009, 180, 90–98. [Google Scholar] [CrossRef]
- Bertei, A.; Ruiz-Trejo, E.; Kareh, K.; Yufit, V.; Wang, X.; Tariq, F.; Brandon, N.P. The Fractal Nature of the Three-Phase Boundary: A Heuristic Approach to the Degradation of Nanostructured Solid Oxide Fuel Cell Anodes. Nano Energy 2017, 38, 526–536. [Google Scholar] [CrossRef]
- Morales, M.; Laguna-Bercero, M.A. Microtubular Solid Oxide Fuel Cells Fabricated by Gel-Casting: The Role of Supporting Microstructure on the Mechanical Properties. RSC Adv. 2017, 7, 17620–17628. [Google Scholar] [CrossRef] [Green Version]
- Su, H.; Hu, Y.H. Progress in Low-Temperature Solid Oxide Fuel Cells with Hydrocarbon Fuels. Chem. Eng. J. 2020, 402, 126235. [Google Scholar] [CrossRef]
- Bernadet, L.; Morales, M.; Capdevila, X.G.; Ramos, F.; Monterde, M.C.; Calero, J.A.; Morata, A.; Torrell, M.; Tarancón, A. Reversible Fuel Electrode Supported Solid Oxide Cells Fabricated by Aqueous Multilayered Tape Casting. J. Phys. Energy 2021, 3, 024002. [Google Scholar] [CrossRef]
- Morales, M.; Laguna-Bercero, M.A.; Jiménez-Piqué, E. Direct-Methane Anode-Supported Solid Oxide Fuel Cells Fabricated by Aqueous Gel-Casting. J. Eur. Ceram. Soc. 2023, 43, 2740–2751. [Google Scholar] [CrossRef]
- He, S.; Jiang, S.P. Electrode/Electrolyte Interface and Interface Reactions of Solid Oxide Cells: Recent Development and Advances. Prog. Nat. Sci. Mater. Int. 2021, 31, 341–372. [Google Scholar] [CrossRef]
- Tsumori, F.; Xu, Y.; Tanaka, Y.; Osada, T.; Miura, H. Micrometer-Scale Imprinting Process for Ceramic Sheet from Powder Compound Material. Procedia Eng. 2014, 81, 1433–1438. [Google Scholar] [CrossRef] [Green Version]
- Dai, H.; He, S.; Chen, H.; Guo, L. A Novel Method of Modifying Electrolyte Surface at Mesoscale for Intermediate-Temperature Solid Oxide Fuel Cells. Ceram. Int. 2016, 42, 2045–2050. [Google Scholar] [CrossRef]
- Timurkutluk, C.; Altan, T.; Yildirim, F.; Onbilgin, S.; Yagiz, M.; Timurkutluk, B. Improving the Electrochemical Performance of Solid Oxide Fuel Cells by Surface Patterning of the Electrolyte. J. Power Sources 2021, 512, 230489. [Google Scholar] [CrossRef]
- Timurkutluk, C.; Altan, T.; Onbilgin, S.; Yildirim, F.; Yagiz, M.; Timurkutluk, B. Mesh Patterned Electrolyte Supports for High-Performance Solid Oxide Fuel Cells. Int. J. Energy Res. 2022, 46, 10689–10703. [Google Scholar] [CrossRef]
- Gao, M.; Li, C.X.; De Wang, M.; Wang, H.L.; Li, C.J. Influence of the Surface Roughness of Plasma-Sprayed YSZ on LSM Cathode Polarization in Solid Oxide Fuel Cells. Key Eng. Mater. 2008, 373–374, 641–644. [Google Scholar] [CrossRef]
- Wang, X.M.; Li, C.X.; Huang, J.Y.; Yang, G.J.; Li, C.J. Deposition Mechanism of Convex YSZ Particles and Effect of Electrolyte/Cathode Interface Structure on Cathode Performance of Solid Oxide Fuel Cell. Int. J. Hydrogen Energy 2014, 39, 13650–13657. [Google Scholar] [CrossRef]
- Xu, Y.; Tsumori, F.; Osada, T.; Miura, H. Improvement of Solid Oxide Fuel Cell by Imprinted Micropatterns on Electrolyte. Micro Nano Lett. 2013, 8, 571–574. [Google Scholar] [CrossRef]
- Farandos, N.M.; Kleiminger, L.; Li, T.; Hankin, A.; Kelsall, G.H. Three-Dimensional Inkjet Printed Solid Oxide Electrochemical Reactors. I. Yttria-Stabilized Zirconia Electrolyte. Electrochim. Acta 2016, 213, 324–331. [Google Scholar] [CrossRef] [Green Version]
- Salari, F.; Badihi Najafabadi, A.; Ghatee, M.; Golmohammad, M. Hybrid Additive Manufacturing of the Modified Electrolyte-Electrode Surface of Planar Solid Oxide Fuel Cells. Int. J. Appl. Ceram. Technol. 2020, 17, 1554–1561. [Google Scholar] [CrossRef]
- Okabe, T.; Kim, Y.; Jiao, Z.; Shikazono, N.; Taniguchi, J. Fabrication Process for Micropatterned Ceramics via UV-Nanoimprint Lithography Using UV-Curable Binder. Jpn. J. Appl. Phys. 2018, 57, 106501. [Google Scholar] [CrossRef]
- Akama, R.; Okabe, T.; Sato, K.; Inaba, Y.; Shikazono, N.; Sciazko, A.; Taniguchi, J. Fabrication of a Micropatterned Composite Electrode for Solid Oxide Fuel Cells via Ultraviolet Nanoimprint Lithography. Microelectron. Eng. 2020, 225, 111277. [Google Scholar] [CrossRef]
- Masciandaro, S.; Torrell, M.; Leone, P.; Tarancón, A. Three-Dimensional Printed Yttria-Stabilized Zirconia Self-Supported Electrolytes for Solid Oxide Fuel Cell Applications. J. Eur. Ceram. Soc. 2019, 39, 9–16. [Google Scholar] [CrossRef] [Green Version]
- Pesce, A.; Hornés, A.; Núñez, M.; Morata, A.; Torrell, M.; Tarancón, A. 3D Printing the next Generation of Enhanced Solid Oxide Fuel and Electrolysis Cells. J. Mater. Chem. A 2020, 8, 16926–16932. [Google Scholar] [CrossRef]
- Merino, R.I.; Laguna-Bercero, M.A.; Lahoz, R.; Larrea, Á.; Oliete, P.B.; Orera, A.; Peña, J.I.; Sanjuán, M.L.; Sola, D. Laser Processing of Ceramic Materials for Electrochemical and High Temperature Energy Applications. Boletín Soc. Española Cerámica Vidr. 2021, 61, S19–S39. [Google Scholar] [CrossRef]
- Cebollero, J.A.; Lahoz, R.; Laguna-Bercero, M.A.; Larrea, A. Tailoring the Electrode-Electrolyte Interface of Solid Oxide Fuel Cells (SOFC) by Laser Micro-Patterning to Improve Their Electrochemical Performance. J. Power Sources 2017, 360, 336–344. [Google Scholar] [CrossRef]
- Cebollero, J.A.; Laguna-Bercero, M.A.; Lahoz, R.; Silva, J.; Moreno, R.; Larrea, A. Optimization of Laser-Patterned YSZ-LSM Composite Cathode-Electrolyte Interfaces for Solid Oxide Fuel Cells. J. Eur. Ceram. Soc. 2019, 39, 3466–3474. [Google Scholar] [CrossRef] [Green Version]
- Cebollero, J.A.; Lahoz, R.; Laguna-Bercero, M.A.; Peña, J.I.; Larrea, A.; Orera, V.M. Characterization of Laser-Processed Thin Ceramic Membranes for Electrolyte-Supported Solid Oxide Fuel Cells. Int. J. Hydrogen Energy 2017, 42, 13939–13948. [Google Scholar] [CrossRef]
- Cai, G.; Zhang, Y.; Dai, H.; He, S.; Ge, L.; Chen, H.; Guo, L. Modification of Electrode/Electrolyte Interface by Laser Micro-Processing for Solid Oxide Fuel Cell. Mater. Lett. 2017, 195, 232–235. [Google Scholar] [CrossRef]
- Konno, A.; Iwai, H.; Saito, M.; Yoshida, H. A Corrugated Mesoscale Structure on Electrode–Electrolyte Interface for Enhancing Cell Performance in Anode-Supported SOFC. J. Power Sources 2011, 196, 7442–7449. [Google Scholar] [CrossRef]
- Seo, H.; Kishimoto, M.; Nakagawa, T.; Iwai, H.; Yoshida, H. Mechanism of Improved Electrochemical Performance of Anode-Supported Solid Oxide Fuel Cells by Mesostructural Modification of Electrode–Electrolyte Interface. J. Power Sources 2021, 506, 230107. [Google Scholar] [CrossRef]
- Liu, P.; Fan, S.; Liu, Y.; Han, X.; Jin, Z. Three-Dimensional Modeling of Anode-Supported Planar SOFC with Corrugated Electrolyte. J. Electrochem. Soc. 2021, 168, 104501. [Google Scholar] [CrossRef]
- Zhang, Y.; Cai, G.; Gu, Y.; Ge, L.; Zheng, Y.; Chen, H.; Guo, L. Modifying the Electrode-Electrolyte Interface of Anode Supported Solid Oxide Fuel Cells (SOFCs) by Laser-Machining. Energy Convers. Manag. 2018, 171, 1030–1037. [Google Scholar] [CrossRef]
- Gurauskis, J.; Sola, D.; Peña, J.I.; Orera, V.M. Laser Drilling of Ni–YSZ Cermets. J. Eur. Ceram. Soc. 2008, 28, 2673–2680. [Google Scholar] [CrossRef]
- Gu, D.; Shi, N.; Yu, F.; Zheng, Y.; Chen, H.; Guo, L. Asymmetric Anode Substrate Fabricated by Phase Inversion Process and Its Interface Modification for Solid Oxide Fuel Cells. J. Alloys Compd. 2018, 742, 20–28. [Google Scholar] [CrossRef]
- Samant, A.N.; Dahotre, N.B. Laser Machining of Structural Ceramics—A Review. J. Eur. Ceram. Soc. 2009, 29, 969–993. [Google Scholar] [CrossRef]
- Gautam, G.D.; Pandey, A.K. Pulsed Nd:YAG Laser Beam Drilling: A Review. Opt. Laser Technol. 2018, 100, 183–215. [Google Scholar] [CrossRef]
- Liang, L.; Yuan, J.; Lin, G. Effect of the Scanning Speed on the Microgroove Formation Regime in Nanosecond-Pulsed Laser Scanning Ablation of Cermet. Int. J. Adv. Manuf. Technol. 2020, 107, 97–107. [Google Scholar] [CrossRef]
- Tsibidis, G.D.; Mansour, D.; Stratakis, E. Damage Threshold Evaluation of Thin Metallic Films Exposed to Femtosecond Laser Pulses: The Role of Material Thickness. Opt. Laser Technol. 2022, 156, 108484. [Google Scholar] [CrossRef]
- Mutlu, M.; Kacar, E.; Akman, E.; Akkan, C.K.; Demir, P.; Demir, A. Effects of The Laser Wavelength on Drilling Process of Ceramic Using Nd:YAG Laser. JLMN J. Laser Micro/Nanoeng. 2009, 4, 84–88. [Google Scholar] [CrossRef]
- Hejjaji, A.; Singh, D.; Kubher, S.; Kalyanasundaram, D.; Gururaja, S. Machining damage in FRPs: Laser versus conventional drilling. Compos. A: Appl. Sci. Manuf. 2016, 82, 42–52. [Google Scholar] [CrossRef]
- Solati, A.; Hamedi, M.; Safarabadi, M. Comprehensive Investigation of Surface Quality and Mechanical Properties in CO 2 Laser Drilling of GFRP Composites. Int. J. Adv. Manuf. Technol. 2019, 102, 791–808. [Google Scholar] [CrossRef]
- Sola, D.; Gurauskis, J.; Peña, J.I.; Orera, V.M. Cold Laser Machining of Nickel-Yttrium Stabilised Zirconia Cermets: Composition Dependence. Mater. Res. Bull. 2009, 44, 1910–1915. [Google Scholar] [CrossRef]
- Malbakhova, I.; Bagishev, A.; Vorobyev, A.; Borisenko, T.; Logutenko, O.; Titkov, A. Fabrication of NiO/YSZ-Based Anodes for Solid Oxide Fuel Cells by Hybrid 3D Inkjet Printing and Laser Treatment. Ceramics 2022, 5, 1115–1127. [Google Scholar] [CrossRef]
- Roitero, E.; Lasserre, F.; Anglada, M.; Mücklich, F.; Jiménez-Piqué, E. A Parametric Study of Laser Interference Surface Patterning of Dental Zirconia: Effects of Laser Parameters on Topography and Surface Quality. Dent. Mater. 2017, 33, e28–e38. [Google Scholar] [CrossRef] [Green Version]
- Roitero, E.; Lasserre, F.; Roa, J.J.; Anglada, M.; Mücklich, F.; Jiménez-Piqué, E. Nanosecond-Laser Patterning of 3Y-TZP: Damage and Microstructural Changes. J. Eur. Ceram. Soc. 2017, 37, 4876–4887. [Google Scholar] [CrossRef]
- Roitero, E.; Anglada, M.; Mücklich, F.; Jiménez-Piqué, E. Mechanical Reliability of Dental Grade Zirconia after Laser Patterning. J. Mech. Behav. Biomed. Mater. 2018, 86, 257–263. [Google Scholar] [CrossRef] [Green Version]
- Morales, M.; García-González, S.; Rieux, J.; Jiménez-Piqué, E. Nanosecond Pulsed Laser Surface Modification of Yttria Doped Zirconia for Solid Oxide Fuel Cell Applications: Damage and Microstructural Changes. J. Eur. Ceram. Soc. 2023, 43, 3396–3403. [Google Scholar] [CrossRef]
- Alenazey, F.; Alyousef, Y.; Brancaccio, E.; Montinaro, D. Parameters Affecting CO2 Production in a Planar Anode Supported SOFC Based System. Int. J. Hydrogen Energy 2015, 40, 642–651. [Google Scholar] [CrossRef]
- Alenazey, F.; Alyousef, Y.; Almisned, O.; Almutairi, G.; Ghouse, M.; Montinaro, D.; Ghigliazza, F. Production of Synthesis Gas (H2 and CO) by High-Temperature Co-Electrolysis of H2O and CO2. Int. J. Hydrogen Energy 2015, 40, 10274–10280. [Google Scholar] [CrossRef]
- Oliver, W.C.; Pharr, G.M. Measurement of Hardness and Elastic Modulus by Instrumented Indentation: Advances in Understanding and Refinements to Methodology. J. Mater. Res. 2004, 19, 3–20. [Google Scholar] [CrossRef]
- Marquardt, T.; Hollmann, J.; Gimpel, T.; Schade, W.; Kabelac, S. Femtosecond Laser-Induced Surface Modification of the Electrolyte in Solid Oxide Electrolysis Cells. Energies 2020, 13, 6562. [Google Scholar] [CrossRef]
- Zhu, W.; Nakashima, S.; Marin, E.; Gu, H.; Pezzotti, G. Microscopic Mapping of Dopant Content and Its Link to the Structural and Thermal Stability of Yttria-Stabilized Zirconia Polycrystals. J. Mater. Sci. 2020, 55, 524–534. [Google Scholar] [CrossRef]
- Parmigiani, F.; Depero, L.E.; Sangaletti, L.; Samoggia, G. An XPS Study of Yttria-Stabilised Zirconia Single Crystals. J. Electron Spectros. Relat. Phenomena 1993, 63, 1–10. [Google Scholar] [CrossRef]
- Lu, Q.H.; Huang, R.; Wang, L.S.; Wu, Z.G.; Li, C.; Luo, Q.; Zuo, S.Y.; Li, J.; Peng, D.L.; Han, G.L.; et al. Thermal Annealing and Magnetic Anisotropy of NiFe Thin Films on N+-Si for Spintronic Device Applications. J. Magn. Magn. Mater. 2015, 394, 253–259. [Google Scholar] [CrossRef]
- Kalita, C.; Sarkar, R.D.; Verma, V.; Bharadwaj, S.K.; Kalita, M.C.; Boruah, P.K.; Das, M.R.; Saikia, P. Bayesian Modeling Coherenced Green Synthesis of NiO Nanoparticles Using Camellia Sinensis for Efficient Antimicrobial Activity. Bionanoscience 2021, 11, 825–837. [Google Scholar] [CrossRef]
- Cabello, A.; Gayán, P.; García-Labiano, F.; De Diego, L.F.; Abad, A.; Izquierdo, M.T.; Adánez, J. Relevance of the Catalytic Activity on the Performance of a NiO/CaAl2O4 Oxygen Carrier in a CLC Process. Appl. Catal. B Environ. 2014, 147, 980–987. [Google Scholar] [CrossRef]
- Grosvenor, A.P.; Biesinger, M.C.; Smart, R.S.C.; McIntyre, N.S. New Interpretations of XPS Spectra of Nickel Metal and Oxides. Surf. Sci. 2006, 600, 1771–1779. [Google Scholar] [CrossRef]
- Ji, S.; Kim, S.K.; Choi, S.H.; Byun, J.S.; Kim, D.K.; Lee, H.J.; Choi, H.M.; Song, W.; Myung, S.; Suk, J.; et al. Yttria-Stabilized Zirconia Nanoparticles Carbon Nanotube Composite as a Polysulfide-Capturing Lithium-Sulfur Battery Separator. ACS Appl. Energy Mater. 2022, 5, 12196–12205. [Google Scholar] [CrossRef]
- Luo, S.; Li, X.; Wang, M.; Zhang, X.; Gao, W.; Su, S.; Liu, G.; Luo, M. Long-term electrocatalytic N2 fixation by MOF-derived Y-stabilized ZrO2: An insight into deactivation mechanism. J. Mater. Chem. A. 2020, 8, 5647–5654. [Google Scholar] [CrossRef]
- Roa, J.J.; Ruiz-Morales, J.C.; Canales-Vazquez, J.; Morales, M.; Capdevila, X.G.; Nuñez, P.; Segarra, M. Mechanical characterisation at nanometric scale of a new design of SOFCs. Fuel Cells 2011, 11, 124–130. [Google Scholar] [CrossRef]
- Xiang, Z.; Fenghui, W.; Jianye, H.; Tiejun, L. Determining the mechanical properties of solid oxide fuel cell by an improved work of indentation approach. J. Power Sources 2012, 201, 231–235. [Google Scholar] [CrossRef]


| Energy Density (J/cm2) | Frequency (kHz) | Hv (µm) | Hp (µm) | Ht (µm) | Wv (µm) | Wp (µm) | Wt (µm) |
|---|---|---|---|---|---|---|---|
| 2.9 | 1.0 | 0.72 ± 0.07 | 0.27 ± 0.08 | 0.91 ± 0.12 | 13.2 ± 0.5 | 4.1 ± 0.3 | 20.8 ± 1.2 |
| 4.3 | 0.4 | 0.67 ± 0.07 | 0.23 ± 0.07 | 0.87 ± 0.14 | 11.5 ± 0.4 | 3.8 ± 0.3 | 18.5 ± 1.1 |
| 4.3 | 0.6 | 0.81 ± 0.09 | 0.36 ± 0.08 | 1.05 ± 0.15 | 15.3 ± 0.7 | 4.4 ± 0.2 | 24.1 ± 1.2 |
| 3.6 | 1.0 | 1.12 ± 0.11 | 0.41 ± 0.10 | 1.31 ± 0.18 | 15.1 ± 0.8 | 5.8 ± 0.8 | 26.7 ± 2.2 |
| 4.3 | 1.0 | 1.48 ± 0.13 | 0.45 ± 0.11 | 1.86 ± 0.21 | 16.4 ± 0.9 | 6.1 ± 0.9 | 28.6 ± 2.6 |
| 4.3 | 2.0 | 1.71 ± 0.18 | 0.59 ± 0.12 | 2.08 ± 0.28 | 18.7 ± 0.8 | 8.2 ± 1.1 | 35.1 ± 2.8 |
| 5.1 | 1.0 | 2.82 ± 0.26 | 0.86 ± 0.13 | 3.38 ± 0.38 | 19.3 ± 0.9 | 8.9 ± 1.2 | 37.1 ± 2.7 |
| Energy Density (J/cm2) | Frequency (kHz) | Ra at Valley (µm) |
|---|---|---|
| 2.9 | 1.0 | 0.16 ± 0.03 |
| 4.3 | 0.4 | 0.14 ± 0.03 |
| 4.3 | 0.6 | 0.15 ± 0.02 |
| 3.6 | 1.0 | 0.17 ± 0.02 |
| 4.3 | 1.0 | 0.18 ± 0.03 |
| 4.3 | 2.0 | 0.28 ± 0.08 |
| 5.1 | 1.0 | 0.31 ± 0.09 |
Disclaimer/Publisher’s Note: The statements, opinions and data contained in all publications are solely those of the individual author(s) and contributor(s) and not of MDPI and/or the editor(s). MDPI and/or the editor(s) disclaim responsibility for any injury to people or property resulting from any ideas, methods, instructions or products referred to in the content. |
© 2023 by the authors. Licensee MDPI, Basel, Switzerland. This article is an open access article distributed under the terms and conditions of the Creative Commons Attribution (CC BY) license (https://creativecommons.org/licenses/by/4.0/).
Share and Cite
Morales, M.; García-González, S.; Plch, M.; Montinaro, D.; Jiménez-Piqué, E. Laser Machining of Nickel Oxide–Yttria Stabilized Zirconia Composite for Surface Modification in Solid Oxide Fuel Cells. Crystals 2023, 13, 1016. https://doi.org/10.3390/cryst13071016
Morales M, García-González S, Plch M, Montinaro D, Jiménez-Piqué E. Laser Machining of Nickel Oxide–Yttria Stabilized Zirconia Composite for Surface Modification in Solid Oxide Fuel Cells. Crystals. 2023; 13(7):1016. https://doi.org/10.3390/cryst13071016
Chicago/Turabian StyleMorales, Miguel, Sandra García-González, Michaela Plch, Dario Montinaro, and Emilio Jiménez-Piqué. 2023. "Laser Machining of Nickel Oxide–Yttria Stabilized Zirconia Composite for Surface Modification in Solid Oxide Fuel Cells" Crystals 13, no. 7: 1016. https://doi.org/10.3390/cryst13071016
APA StyleMorales, M., García-González, S., Plch, M., Montinaro, D., & Jiménez-Piqué, E. (2023). Laser Machining of Nickel Oxide–Yttria Stabilized Zirconia Composite for Surface Modification in Solid Oxide Fuel Cells. Crystals, 13(7), 1016. https://doi.org/10.3390/cryst13071016