Article

Cobalt Ferrite Nanoparticles Capped with Perchloric Acid for Life-Science Application

1
Physics Department, Physics Faculty, Alexandru Ioan Cuza University, 700506 Iasi, Romania
2
Materials Characterization Laboratory, National Institute of Research and Development for Technical Physics, 47 Mangeron Blvd., 700050 Iasi, Romania
3
Advanced Research Center for Bionanoconjugates and Biopolymers, P. Poni Institute of Macromolecular Chemistry, 700487 Iasi, Romania
4
Orthodox Theology Faculty, Alexandru Ioan Cuza University, 700506 Iasi, Romania
5
Optical Atmosphere, Spectroscopy and Laser Department, Alexandru Ioan Cuza University, 700506 Iasi, Romania
*
Author to whom correspondence should be addressed.
Crystals 2023, 13(7), 1058; https://doi.org/10.3390/cryst13071058
Submission received: 30 May 2023 / Revised: 23 June 2023 / Accepted: 26 June 2023 / Published: 4 July 2023

Abstract

:
Among the modern oncological therapies, one of the most promising is based on tumor hyperthermia with magnetic nanoparticles resulting from the crystallization of iron and cobalt oxides. We synthesized core–shell magnetic nanoparticles of perchlorate-CoxFe3−xO4 (x = 0; 0.5; 1.0) via the co-precipitation method and stabilized them in aqueous suspensions. Fine granulation of the dispersed ferrophase was revealed by Transmission Electron Microscopy and Dynamical Light Scattering, with FTIR data detailing the surface-interaction phenomena. X-ray diffractometry revealed specific crystallization features of inverse spinel lattice, providing crystallite size and lattice parameters dependent on the cobalt content. The results of the Vibrating Sample Magnetometry investigations indicated that cobalt doping has reduced the magnetic core size and increased the nanoparticle dimension, which could be the result of crystallization defects at the nanoparticle surface related to the presence of cobalt ions. A mathematical model was applied with a focus on the quantitative description of the temperature distribution around magnetic nanoparticles. Further development of our research will consider new cobalt ferrite nanoparticles with new cobalt contents and different organic coatings to contribute to their biocompatibility and stability in aqueous suspensions, as required by administration in living organisms.

1. Introduction

In the last decades, considerable scientific work focused on cobalt ferrite nanoparticle applications in life sciences for magnetic resonance imaging in medical diagnosis, as well as for tumor hyperthermia, magnetically assisted drug delivery, biosensors, and purification. Some examples could be relevant. In [1], cobalt ferrite nanoparticles synthesized by co-precipitation method with saturation magnetization up to 40 Am2/kg were studied as a possible contrast agent in MRI. The possible formation of a dead-magnetic surface layer is assumed to affect their magnetizability. In [2], cobalt ferrite nanoparticles treated with nitric acid and sodium citrate were determined to be biocompatible and capable of maintaining their magnetic properties (about 40 Am2/kg saturation magnetization) for several magnetization cycles after administration in mice cells; they were recommended for tumor hyperthermia as a result. Cobalt ferrite nanoparticles functionalized with folic acid and loaded with doxorubicin were tested for drug delivery with studies in cancer chemotherapy [3]. In [4], cobalt ferrite nanoparticles coated with TEOS, characterized by high magnetic anisotropy, were synthesized for utilization as a biosensor for single molecular detection. Meanwhile, in [5], methylene blue wastewater treatment with cobalt ferrite nanoparticles was reported. Cobalt ferrite nanoparticles with a citric acid-modified surface and functionalized with glucose–oxidase were studied for glucose detection based on the generation of hydrogen peroxide in the glucose–oxidase reaction with glucose [6].
Various studies in the fields of biotechnology, bioengineering, and environmental sciences were dedicated to cobalt ferrite nanoparticle synthesis and characterization. These biocompatible nanomaterials are easily produced by various methods and able to ensure the adjustment of their microstructural and magnetic properties according to the intended use [7,8,9,10]. Thermal decomposition of iron and cobalt compounds in organic solvents was applied to obtain cobalt ferrite nanoparticles [7] with well-controlled size and morphology. The organic acid precursor route was used [8] to yield octahedral cobalt ferrite nanoparticles with high saturation magnetization (over 70 Am2/kg). Wet chemistry and sol–gel methods [9] were utilized to produce cobalt ferrite nanoparticles characterized by saturation magnetization of 13 to 60 Am2/kg; it is assumed the spin anisotropy characterizes the samples. Green chemistry was also found useful in producing cobalt ferrite nanoparticles with moderate saturation magnetization [10], which depends on the nature and quantity of the biological material chosen for interactions with iron and cobalt salts.
Cobalt ferrites are characterized by inverse spinel crystalline structures, like other oxides of iron and transition metals. They are denoted as MFe2O4 (M being the transition metal like Co, Ni, Zn, etc.), they are usually described as the cubic arrangement of M2+ and Fe3+ ions, they are closely packed with oxygen anions, and they occupy either tetrahedral (A) or octahedral (B) sites [11,12]. That is, cobalt ferrite crystals form a cubic lattice with the space group Fd-3m and are divided into face-centered cubic (fcc) unit cells. In the ideal model of crystalline structure of inverse spinel architecture, all Co2+ ions occupy B sites, while Fe3+ ions are equally located between A and B sites [13]. In [14,15], the authors studied the effects of cobalt doping on the crystalline ferrophase heating efficiency in the presence of external magnetic fields and determined that the increase of cobalt content has resulted in the increase of nanoparticle coercivity and magnetic anisotropy, which in turn led to the increase of the specific absorption rate and, finally, to the increase in the nanoparticle heating power.
In [16], the authors reported the synthesis of cobalt ferrite nanoparticles of 13–28 nm, which were supplied to Hella cancer cell cultures under magnetic field of 51 mT and 32–101 Hz. Maximum heat absorption was found by using nanoparticles with a crystal size of 28 nm at a 101-kHz and 51-mT magnetic field.
Tumor treatment through hyperthermia with magnetic nanoparticles was also studied from a theoretical viewpoint since ethical reasons limited a lot of the experimental approaches. First, the mathematical model focusing on heat transfers into living tissues, known as bioheat equation, was proposed by Pennes [17] to describe the effect of blood perfusion as well as that of the metabolic heat generation rate on the local heating of the living tissue. Among various applications of this first model, which was developed over years, we mention the approach of [18], which considered the use of magnetic nanoparticles injected into a liver tumor in the form of prepared nanofluid under the applied radio-frequency field.
The magnetic nanoparticles synthesized and characterized in this study were simply coated with small capping molecule. Their properties for heat transfer were mathematically modeled for certain skin tissues since tumor hyperthermia seems to be suitable in such cases where the transfer of energy is more controllable than with deep tumors.

2. Materials and Methods

2.1. Materials

Aqueous suspensions of CoxFe3−xO4 magnetic nanoparticles (x = 0; 0.5; 1) were prepared using the following high-purity reagents (Table 1): ferric chloride hexahydrate (FeCl3 × 6H2O), ferrous sulfate heptahydrate (FeSO4 × 7H2O), cobalt heptahydrate (CoSO4 × 7H2O), and crystalline sodium hydroxide (NaOH) purchased from Lachner, Merck, Sigma–Aldrich. Perchloric acid (HClO4) from Merck was used as a stabilizing agent, while the water used for solving and dispersing was purified before use by the Barnstead EasyPureII water purification system.

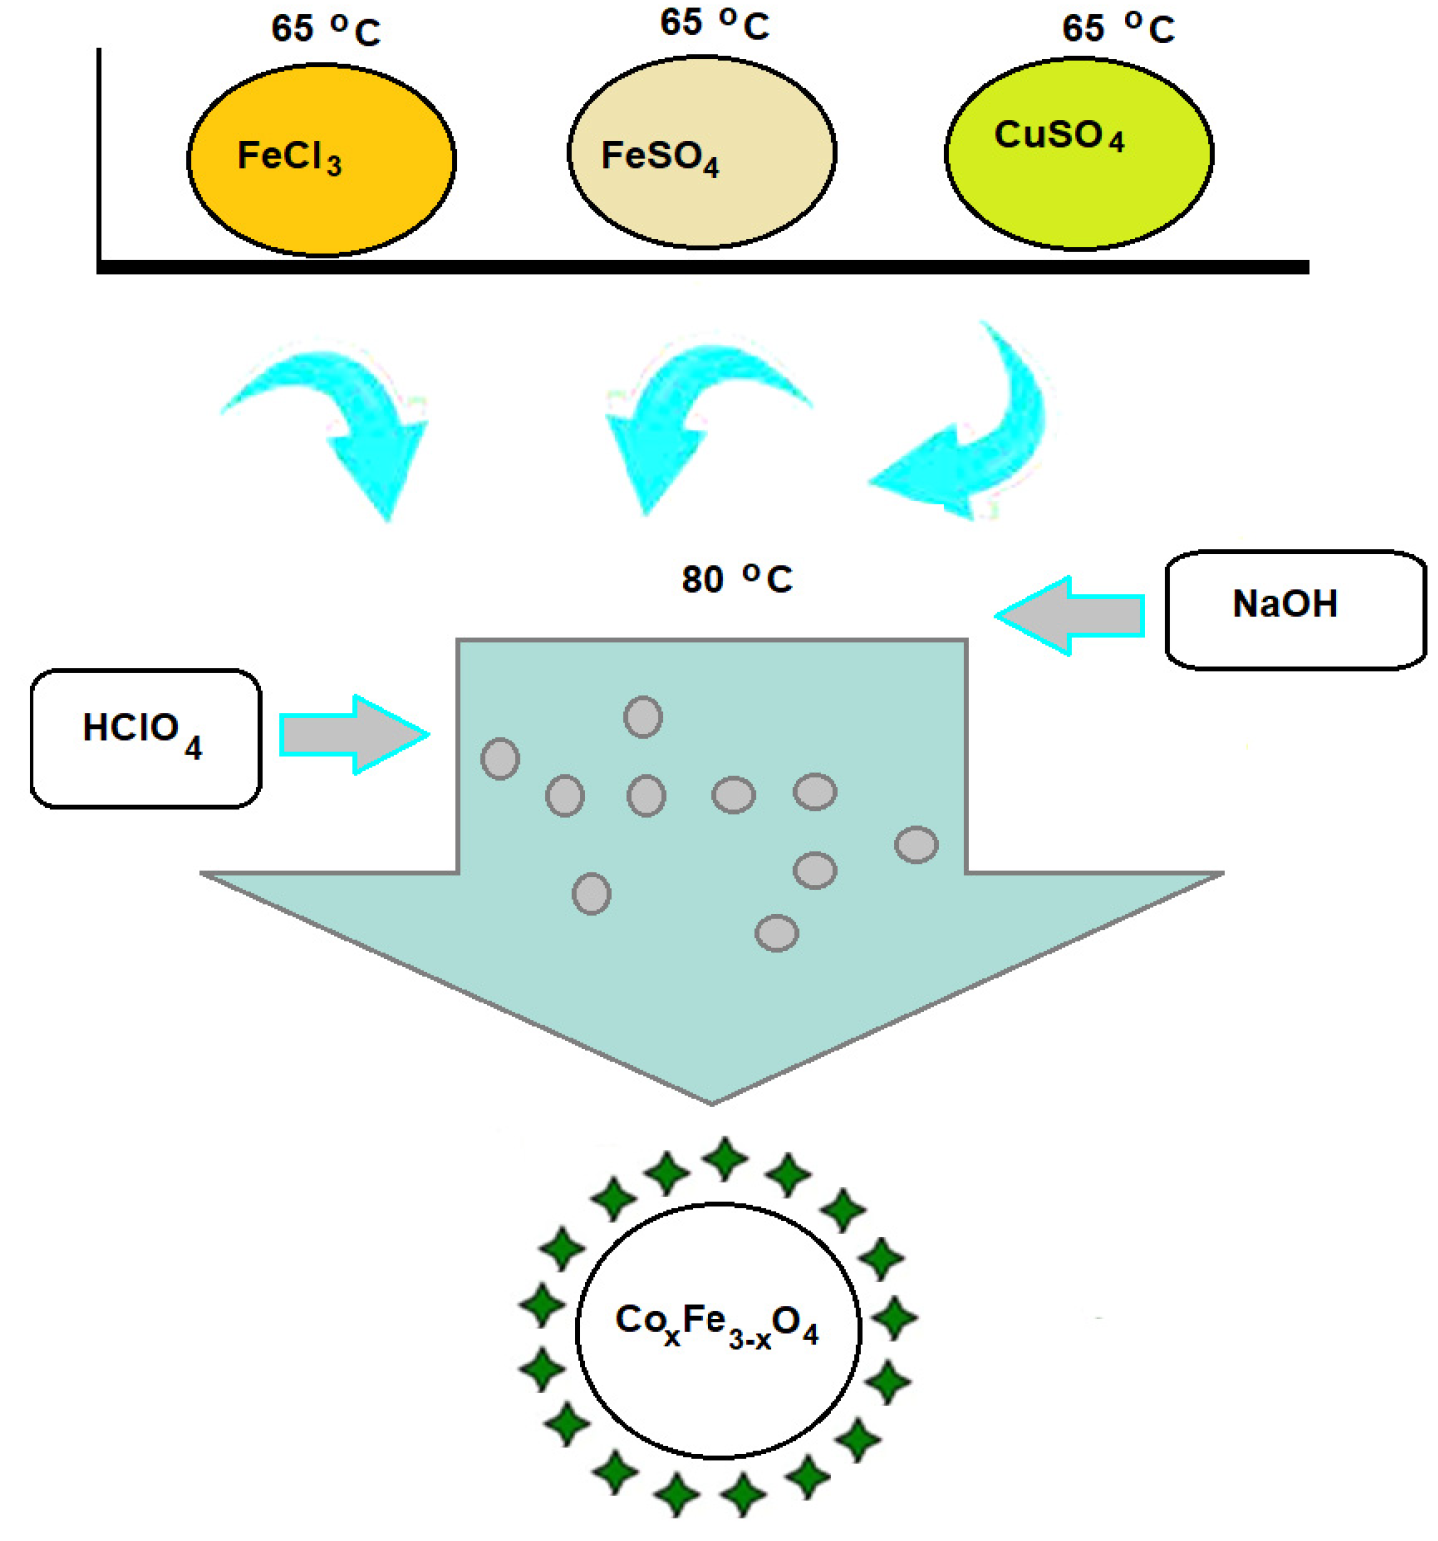
2.2. Synthesis of Suspensions of CoxFe3−xO4 Nanoparticles Stabilized with Perchloric Acid

The nanoparticles were synthesized using the adapted co-precipitation procedure of Massart [19]. The iron and cobalt precursor salts (Table 1) were dissolved in water and mixed under magnetic stirring, on a hot plate at a temperature of 65 °C. Afterwards, the hot sodium hydroxide solution was dropped into the mixture under mechanic stirring at the temperature of around 80 °C. Then, the black ferrophase formed was extracted in magnetic field gradient and washed three times with hot water to remove unreacted salts or impurities (Scheme 1).
To stabilize the magnetic nanoparticles in deionized water, 3 mL of 25% perchloric acid were added to 50 mL of nanoparticle suspension and allowed to react under mechanical mixing at about 85 °C for more than one hour. The coated nanoparticles were washed twice with hot distilled water to remove excess of coating agent.

2.3. Nanoparticle Characterization Methods

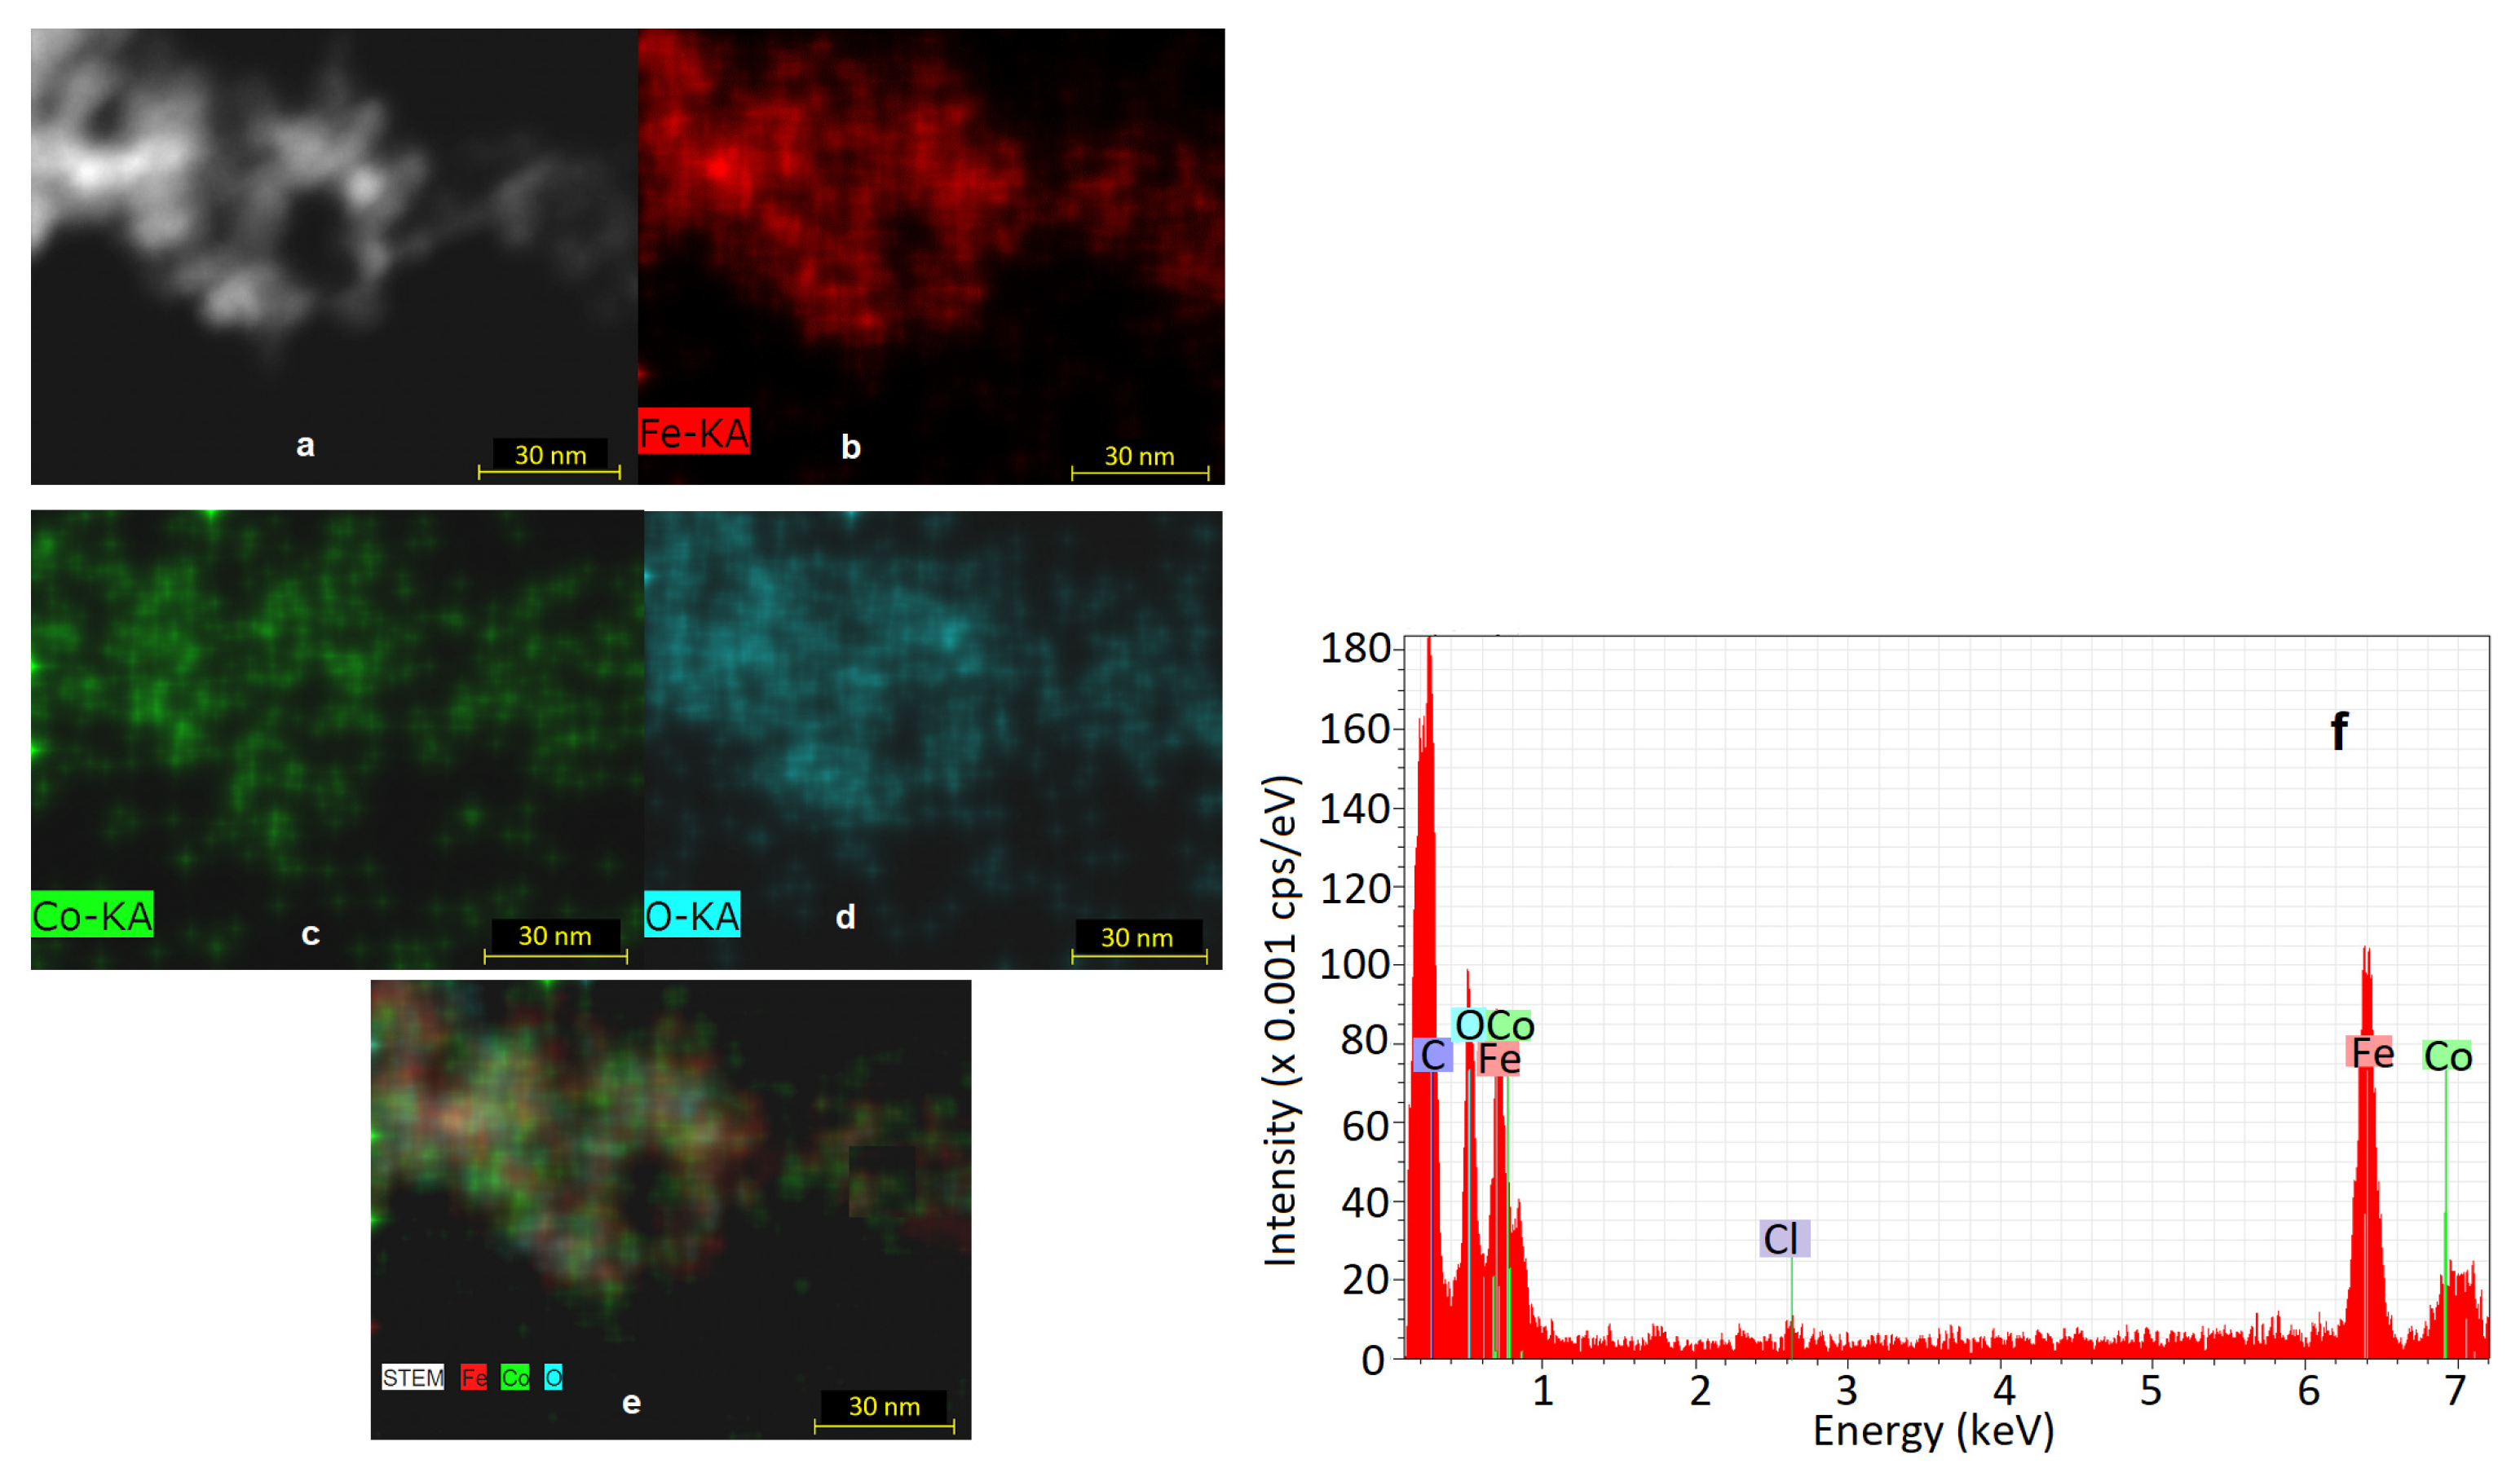
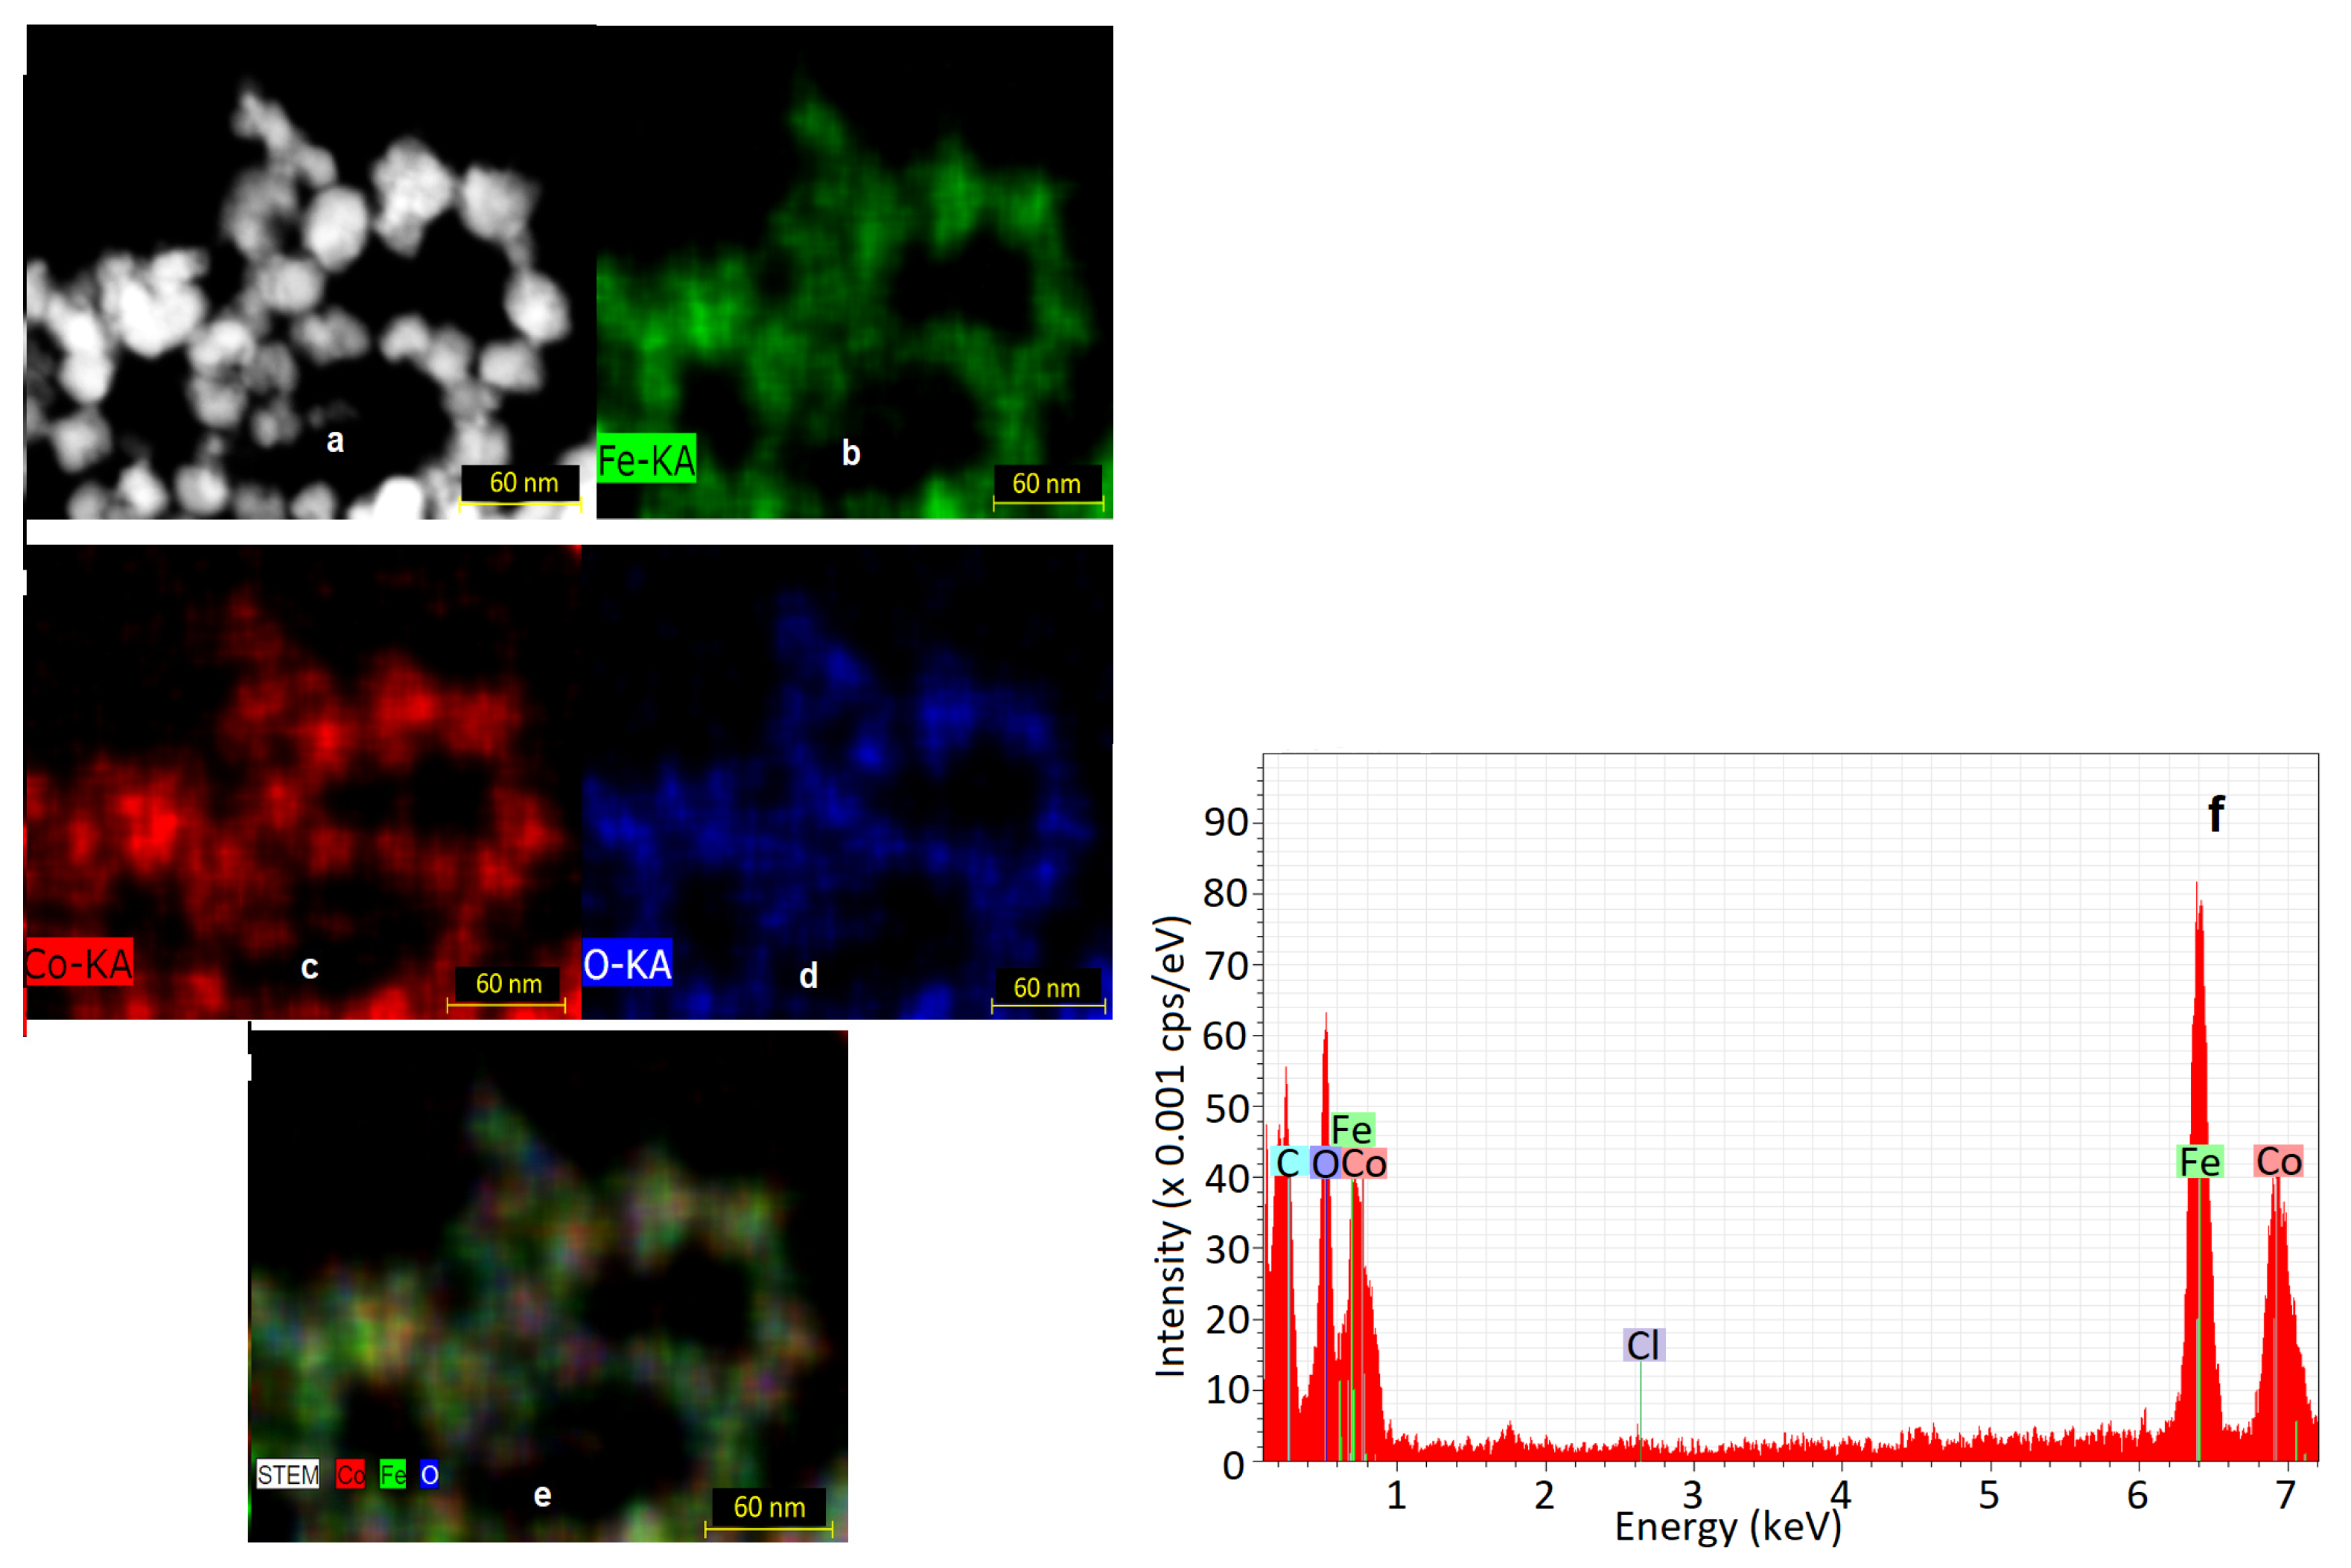
2.3.1. Microstructural and Elemental Investigation

Microstructural study was accomplished with Ultra-High Resolution Scanning Transmission Electron Microscope UHR-TEM LIBRA®200MC, with EDS facility attached; size measurements were performed with ImageJ software.

2.3.2. Investigations of Crystallinity Properties

The crystallinity characteristics were studied using a Shimadzu LabX XRD-6000 diffractometer with an incident beam of Cu–Kα radiation with λ = 1.5406 Å. The powders resulting from the drying of magnetic nanoparticle suspensions were analyzed in Bragg–Bentano geometry. The diffractograms were recorded in the 20°–80° range of 2θ angle, with a scanning step of 0.02° and a 0.5 deg/min scan speed.

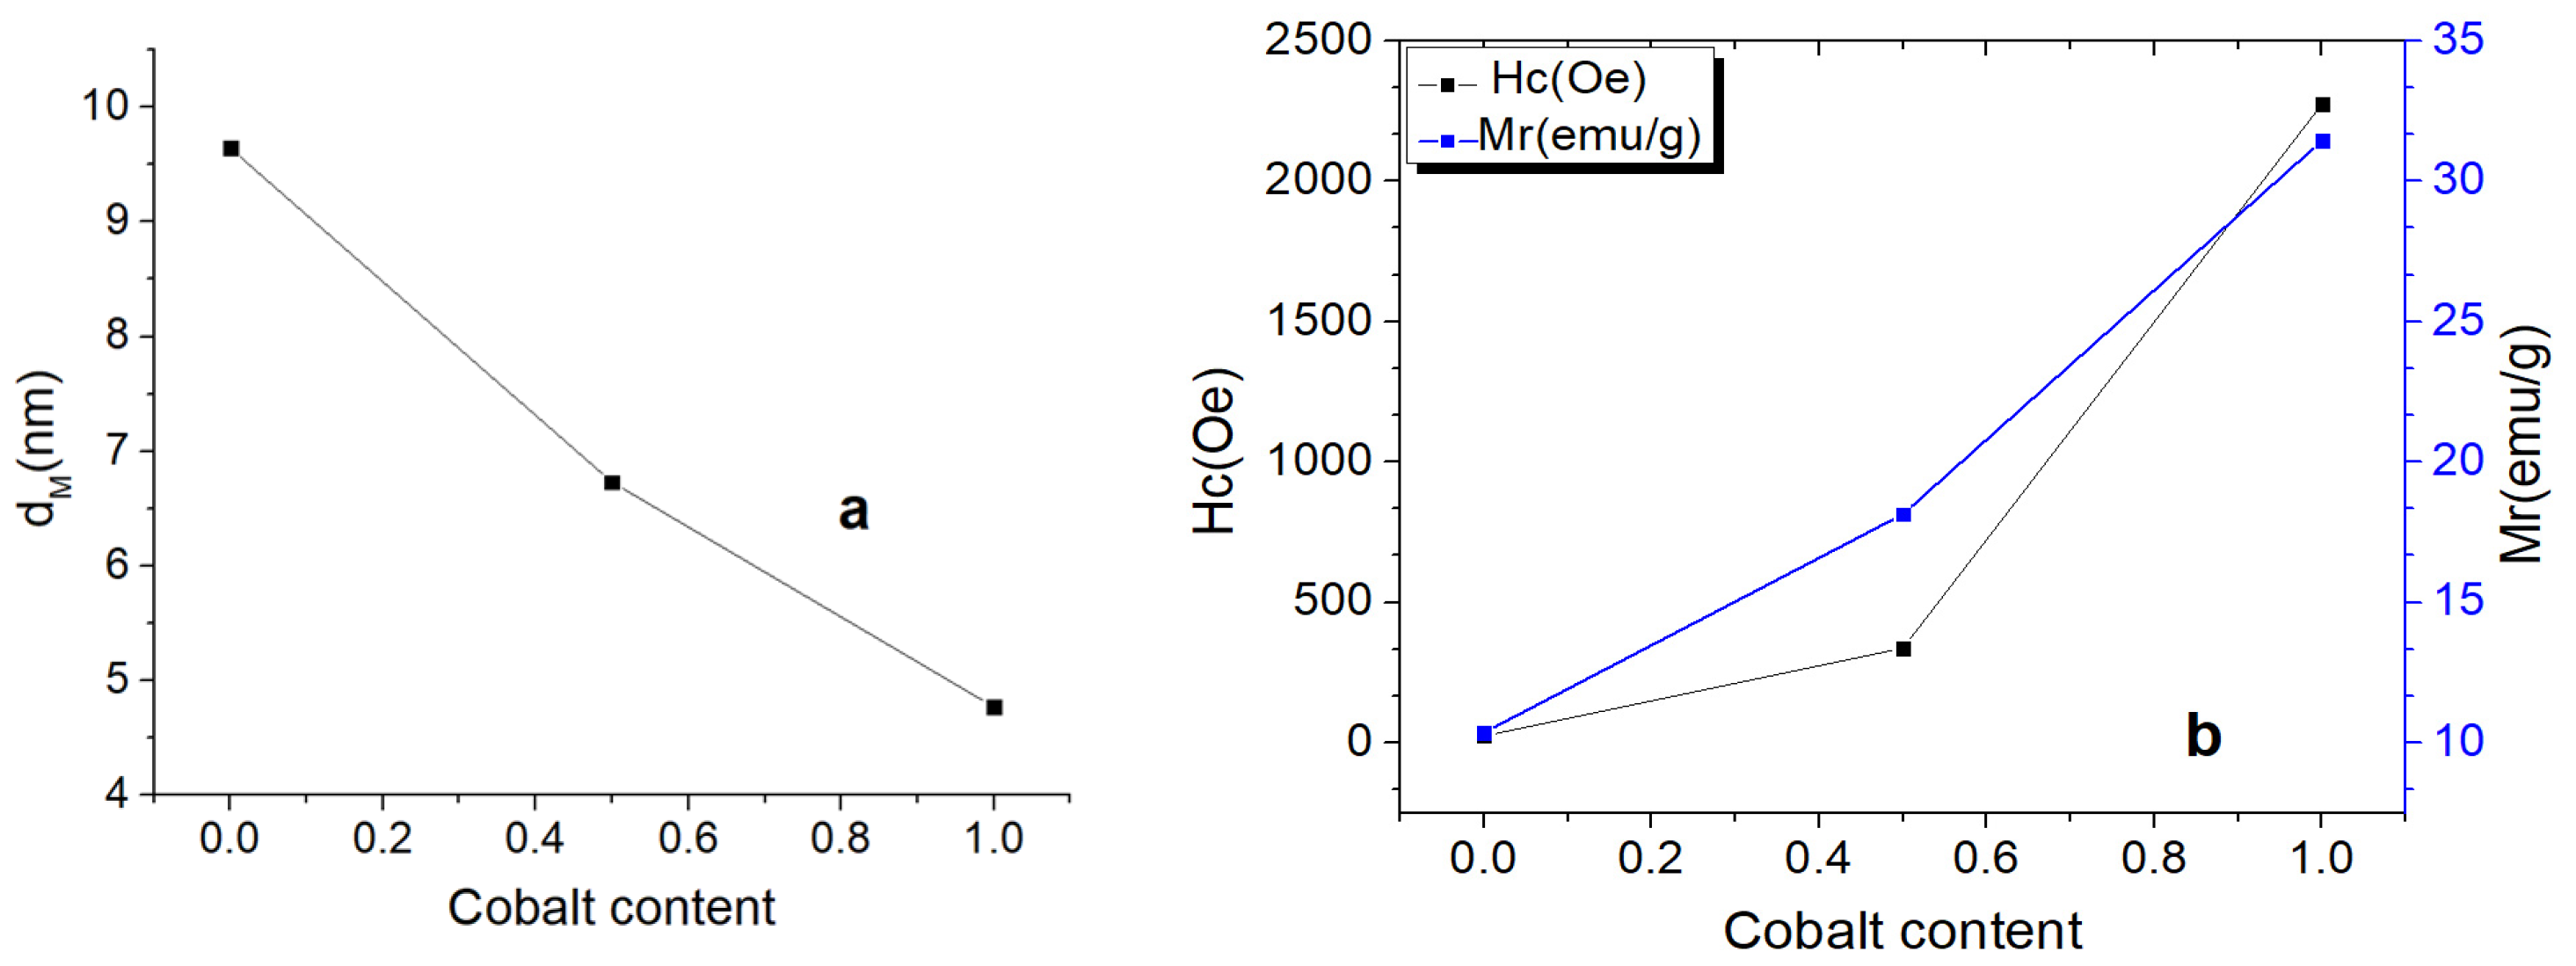
2.3.3. Magnetic Properties Investigation by Vibrating Sample Magnetometry (VSM)

Magnetization characteristics were analyzed using the Lake Shore VSM 7410 device on dry suspensions under magnetic field up to 20 kOe at room temperature in order to determine magnetization capacity and evaluate magnetic features as particle magnetic core size, coercive, and remanent field.

2.3.4. FTIR Investigation

FTIR spectrometer, Bruker Vertex 70 model, and potassium chloride solid dispersion of dried magnetic nanoparticle samples were used to demonstrate the core–shell interactions at the nanoparticle surface.

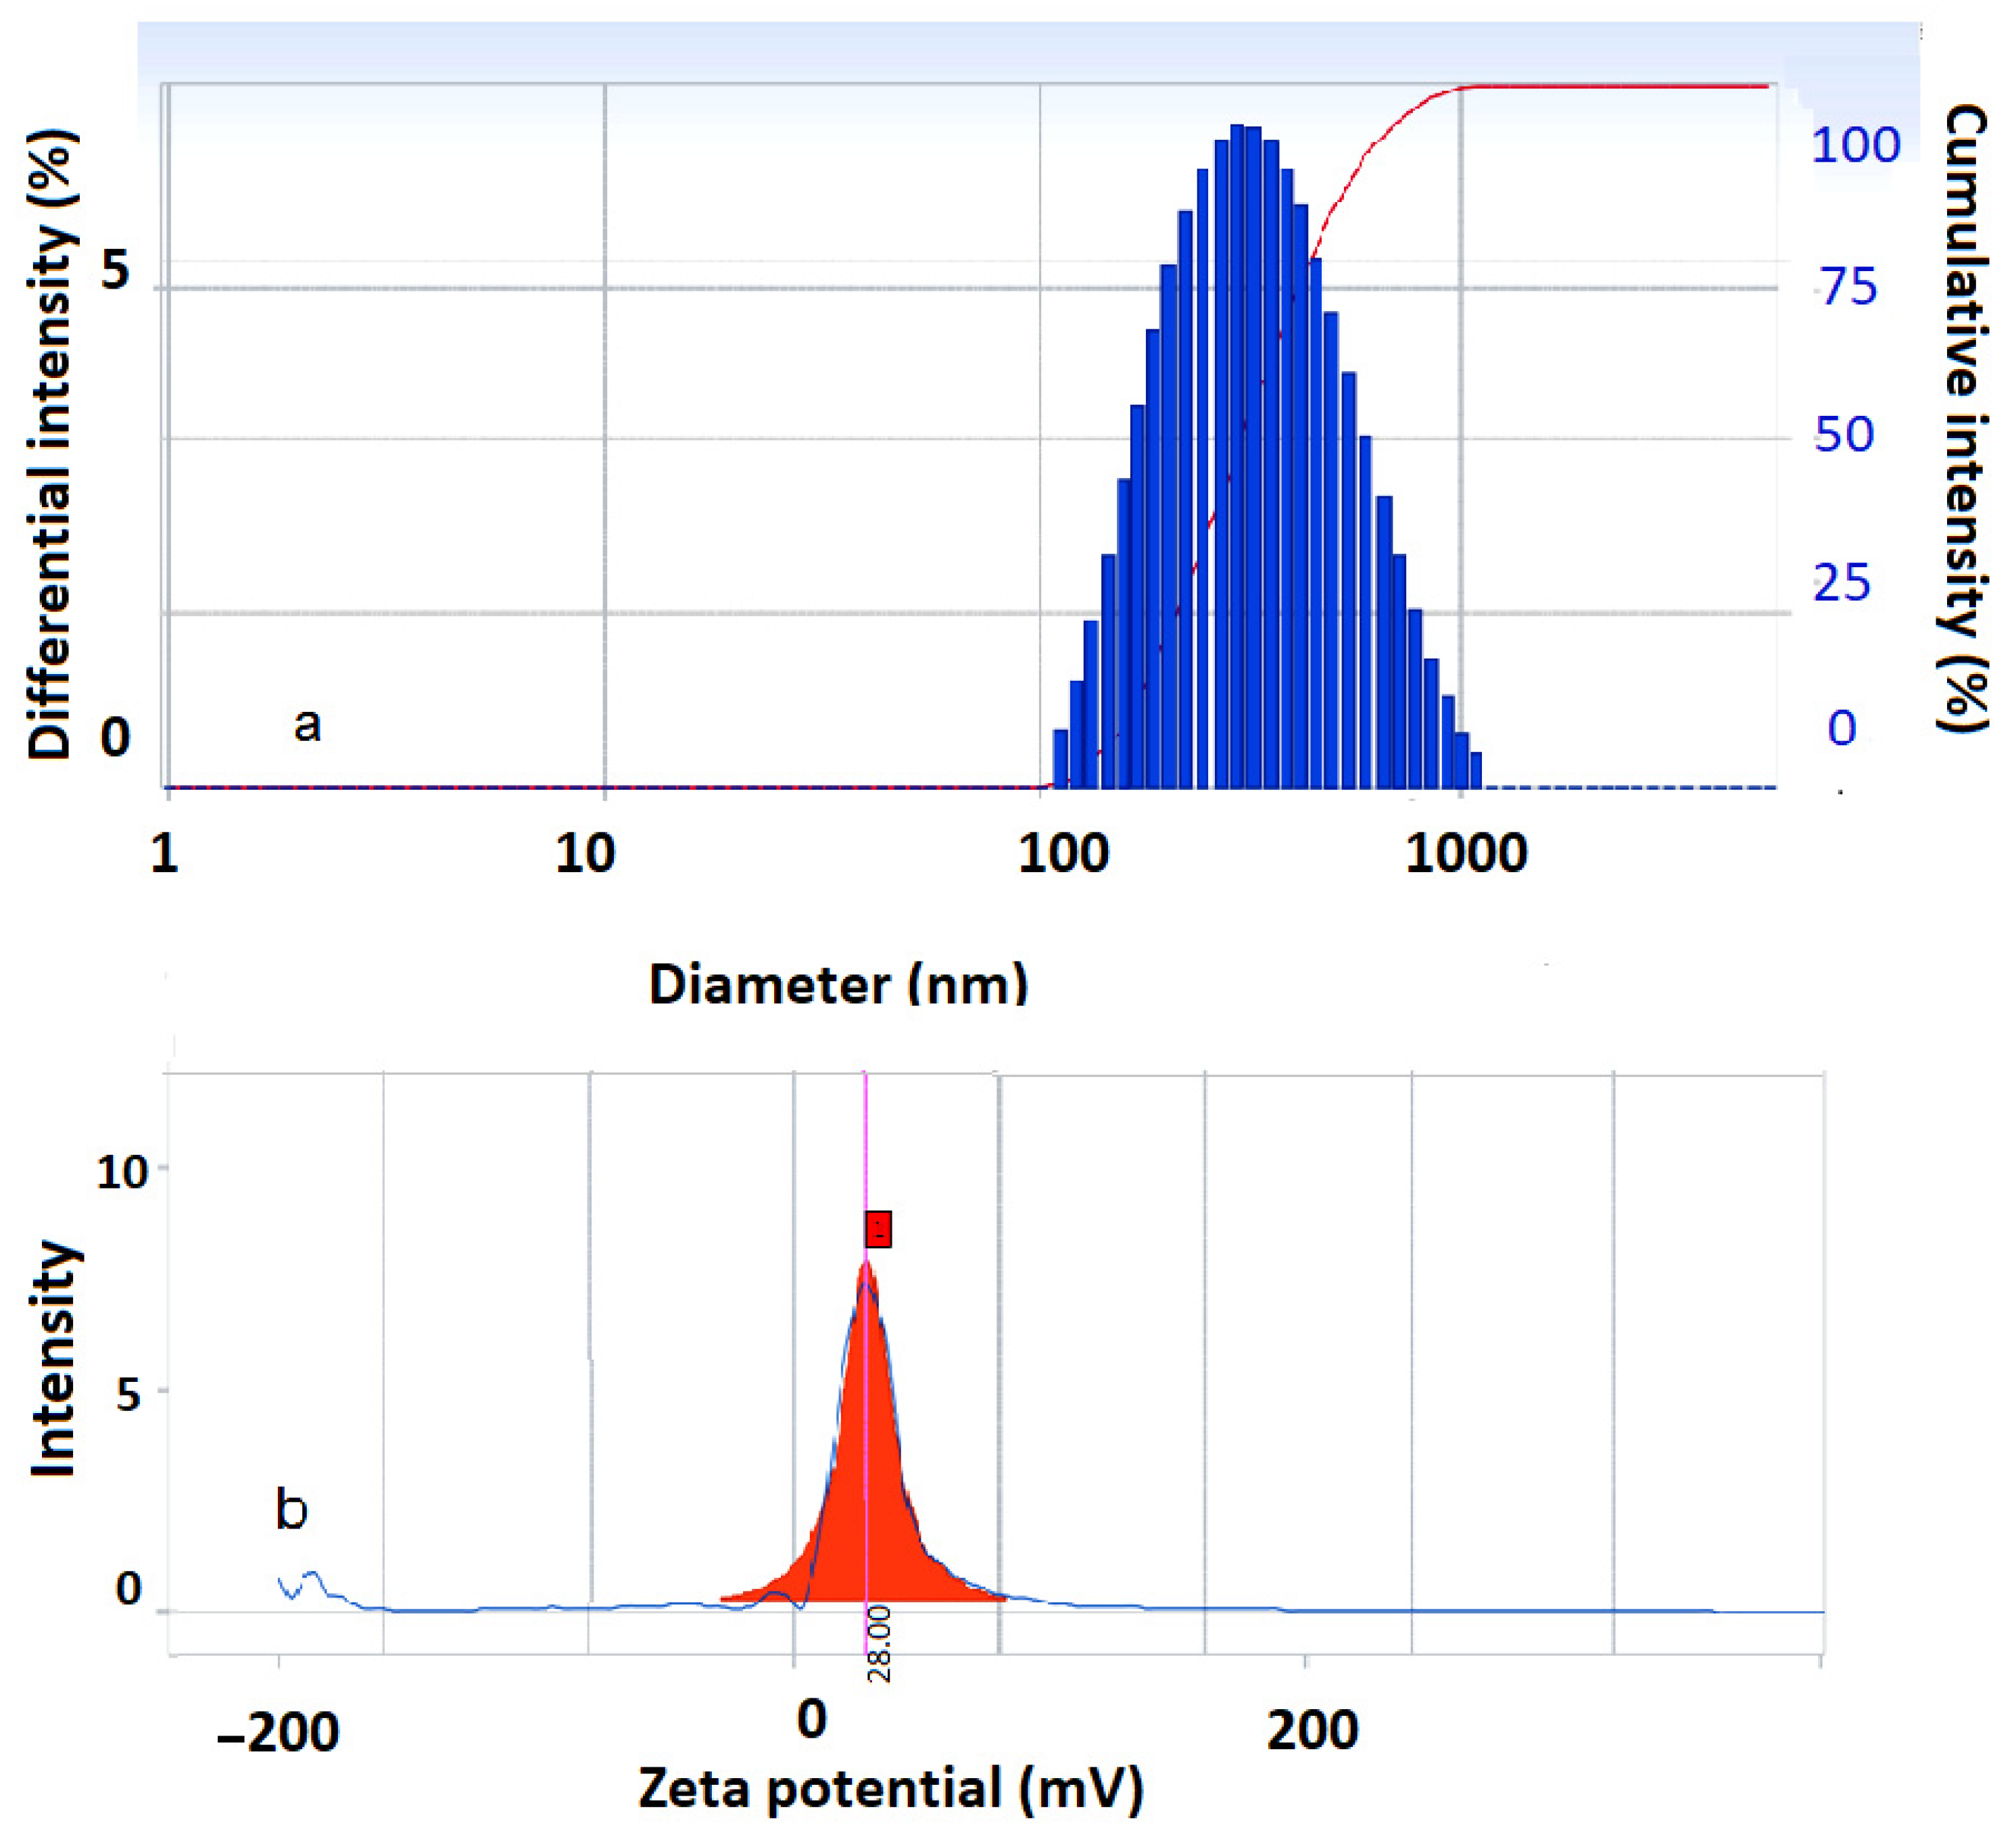
2.3.5. Dynamic Light Scattering Investigation

Measurements of zeta potential and hydrodynamic diameter were carried out with DelsaNano C analyzer coupled with an Autotitrator DelsaNanoAT module.

3. Results and Discussion

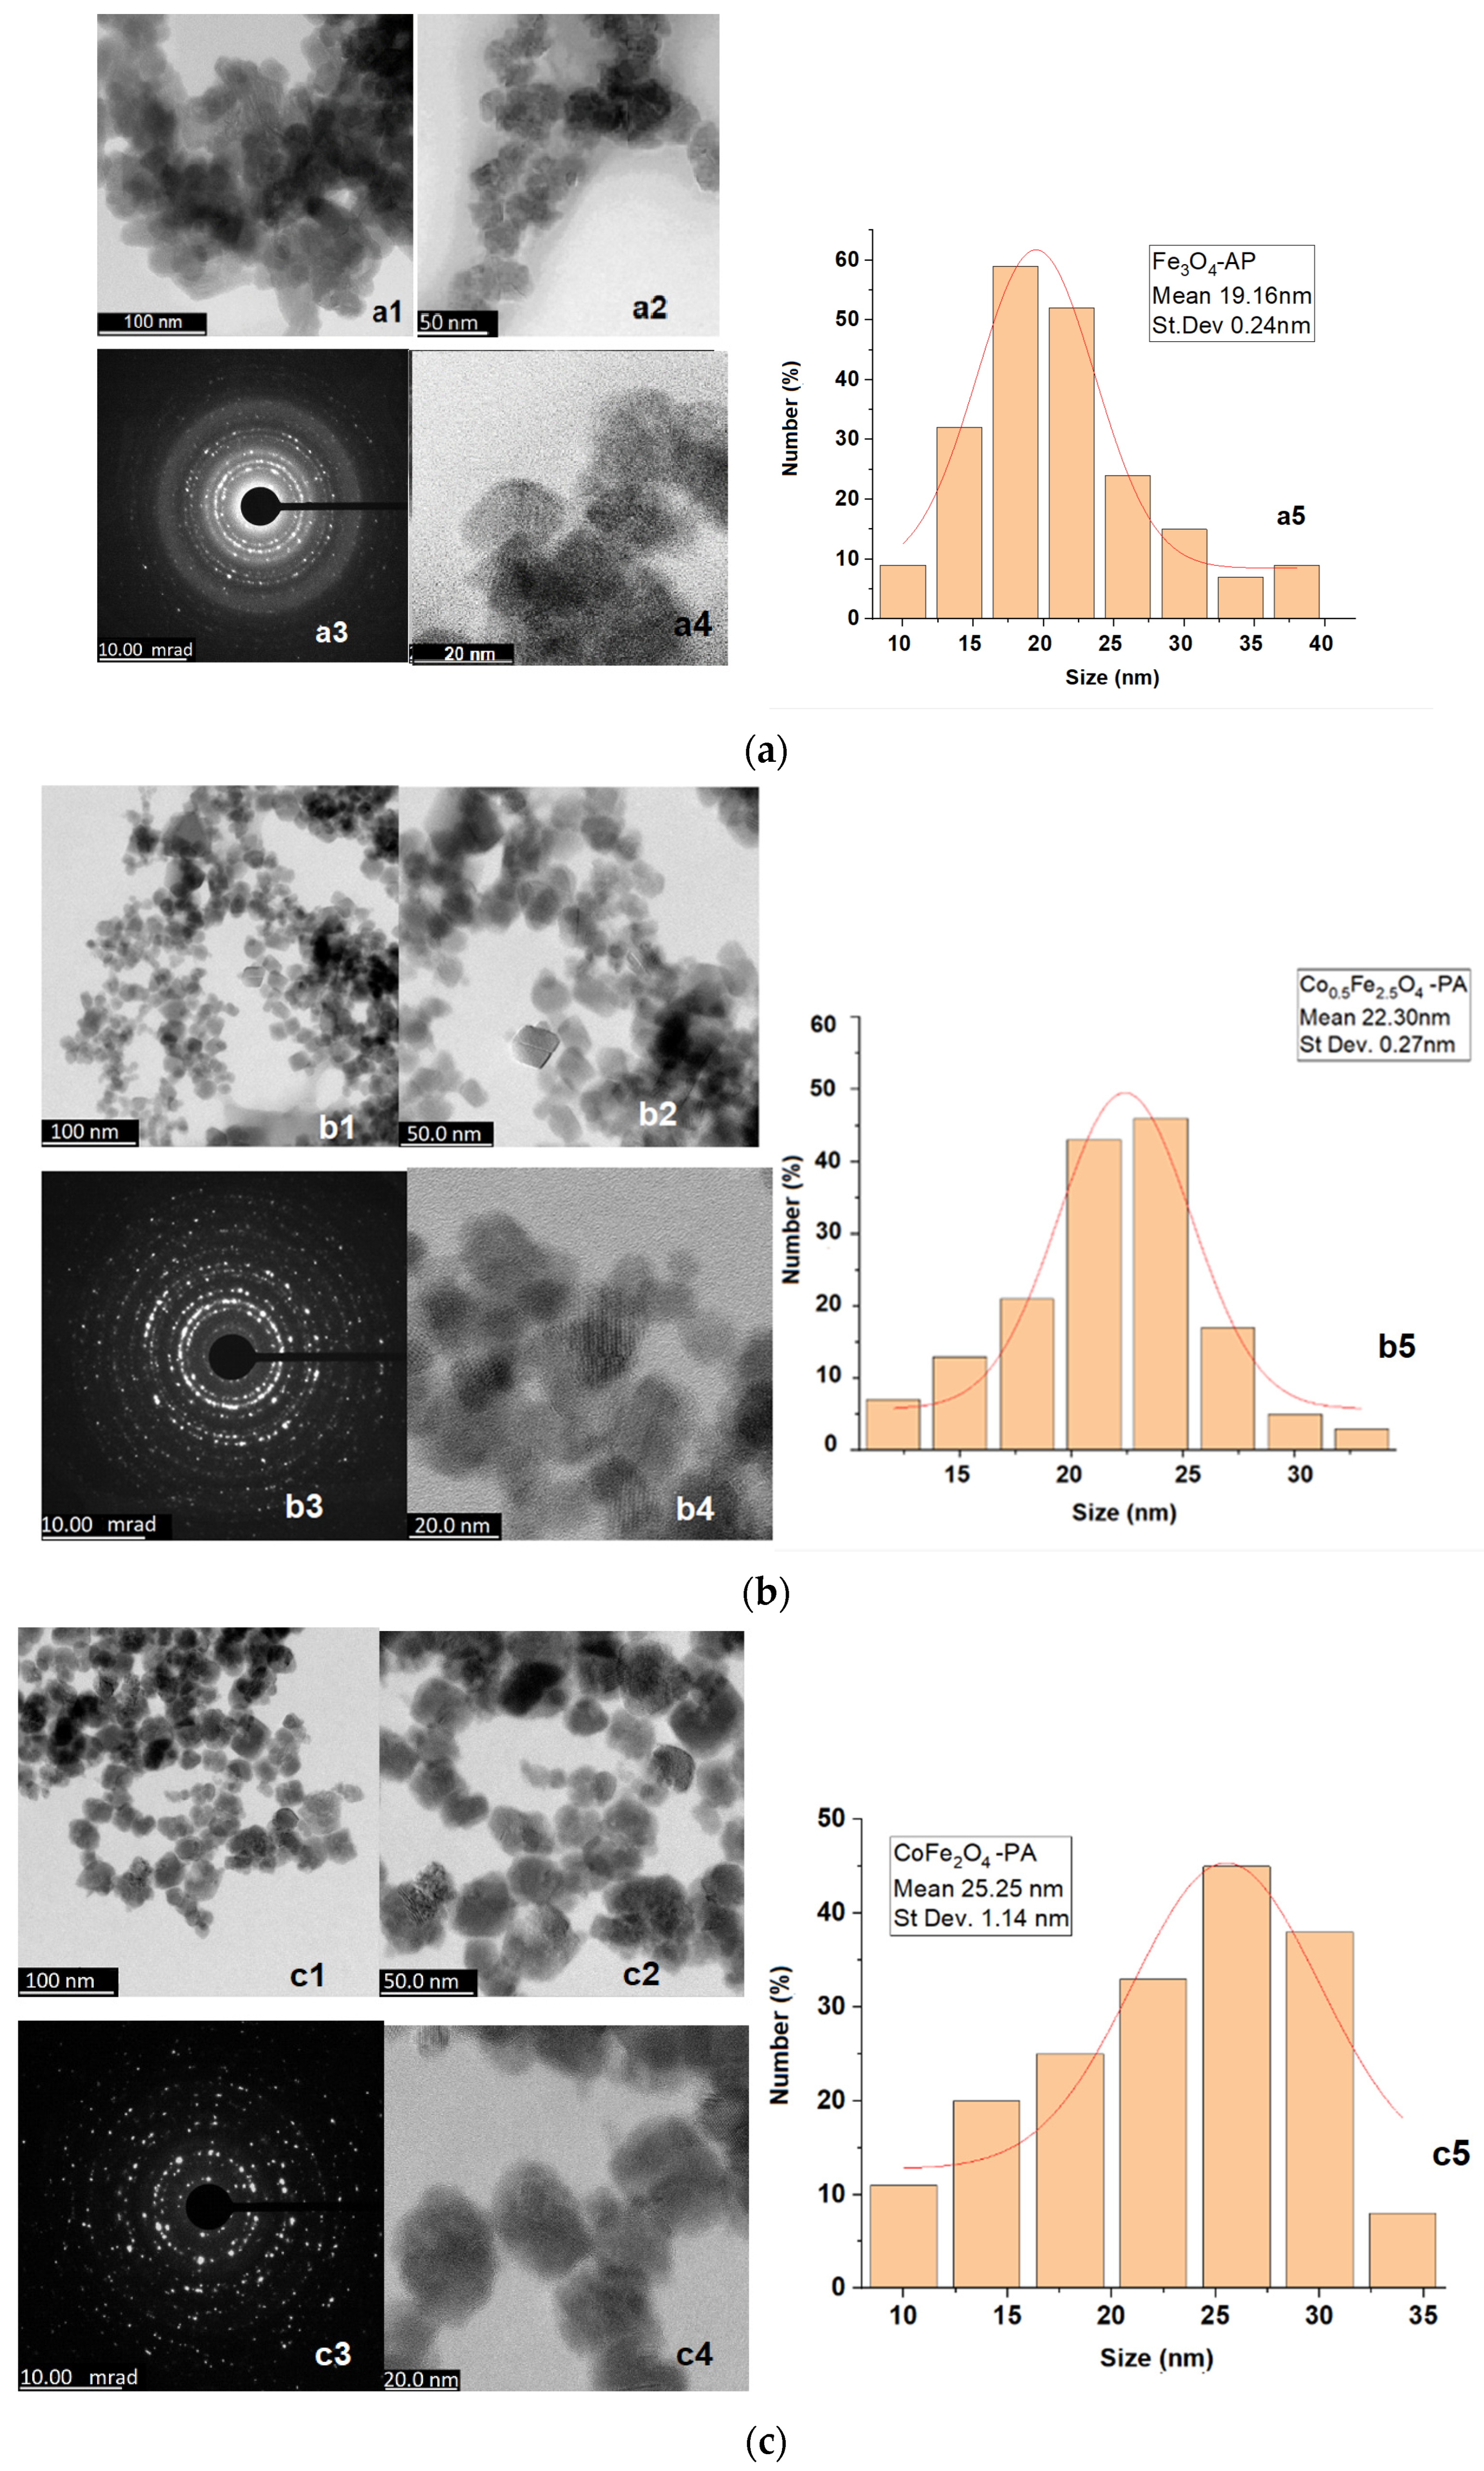
3.1. Microstructural Characterization

The granularity investigation by the TEM technique was conducted on 10−4 diluted magnetic nanoparticle suspensions, which were deposited and dried on the grid supports. In Figure 1, mainly cubic and quasi-spherical structures, which frequently possessed a diameter of 19 to 25 nm for the three analyzed samples (Table 2), were observed. These nanoparticles are randomly distributed; certain forms of agglomerations are either present in the suspension of nanoparticles or are possibly the result of the suspension deposition and drying on the sample support. Among the three analyzed samples, the cobalt ferrite particles CoFe2O4, have the largest diameter (of 25 nm), which is concordant with XRD results as shown below.
High-Resolution TEM images demonstrated phase composition with the crystallization planes of the individual nanoparticles, while the coating shell surrounds either particle cluster, such as for the magnetite sample (Figure 1(a2)) or individual particles, in the case of cobalt containing ferrites (Figure 1b,c). As for particle morphology, quasi-spheric and frequent polyhedric nanoparticles were visualized by TEM.

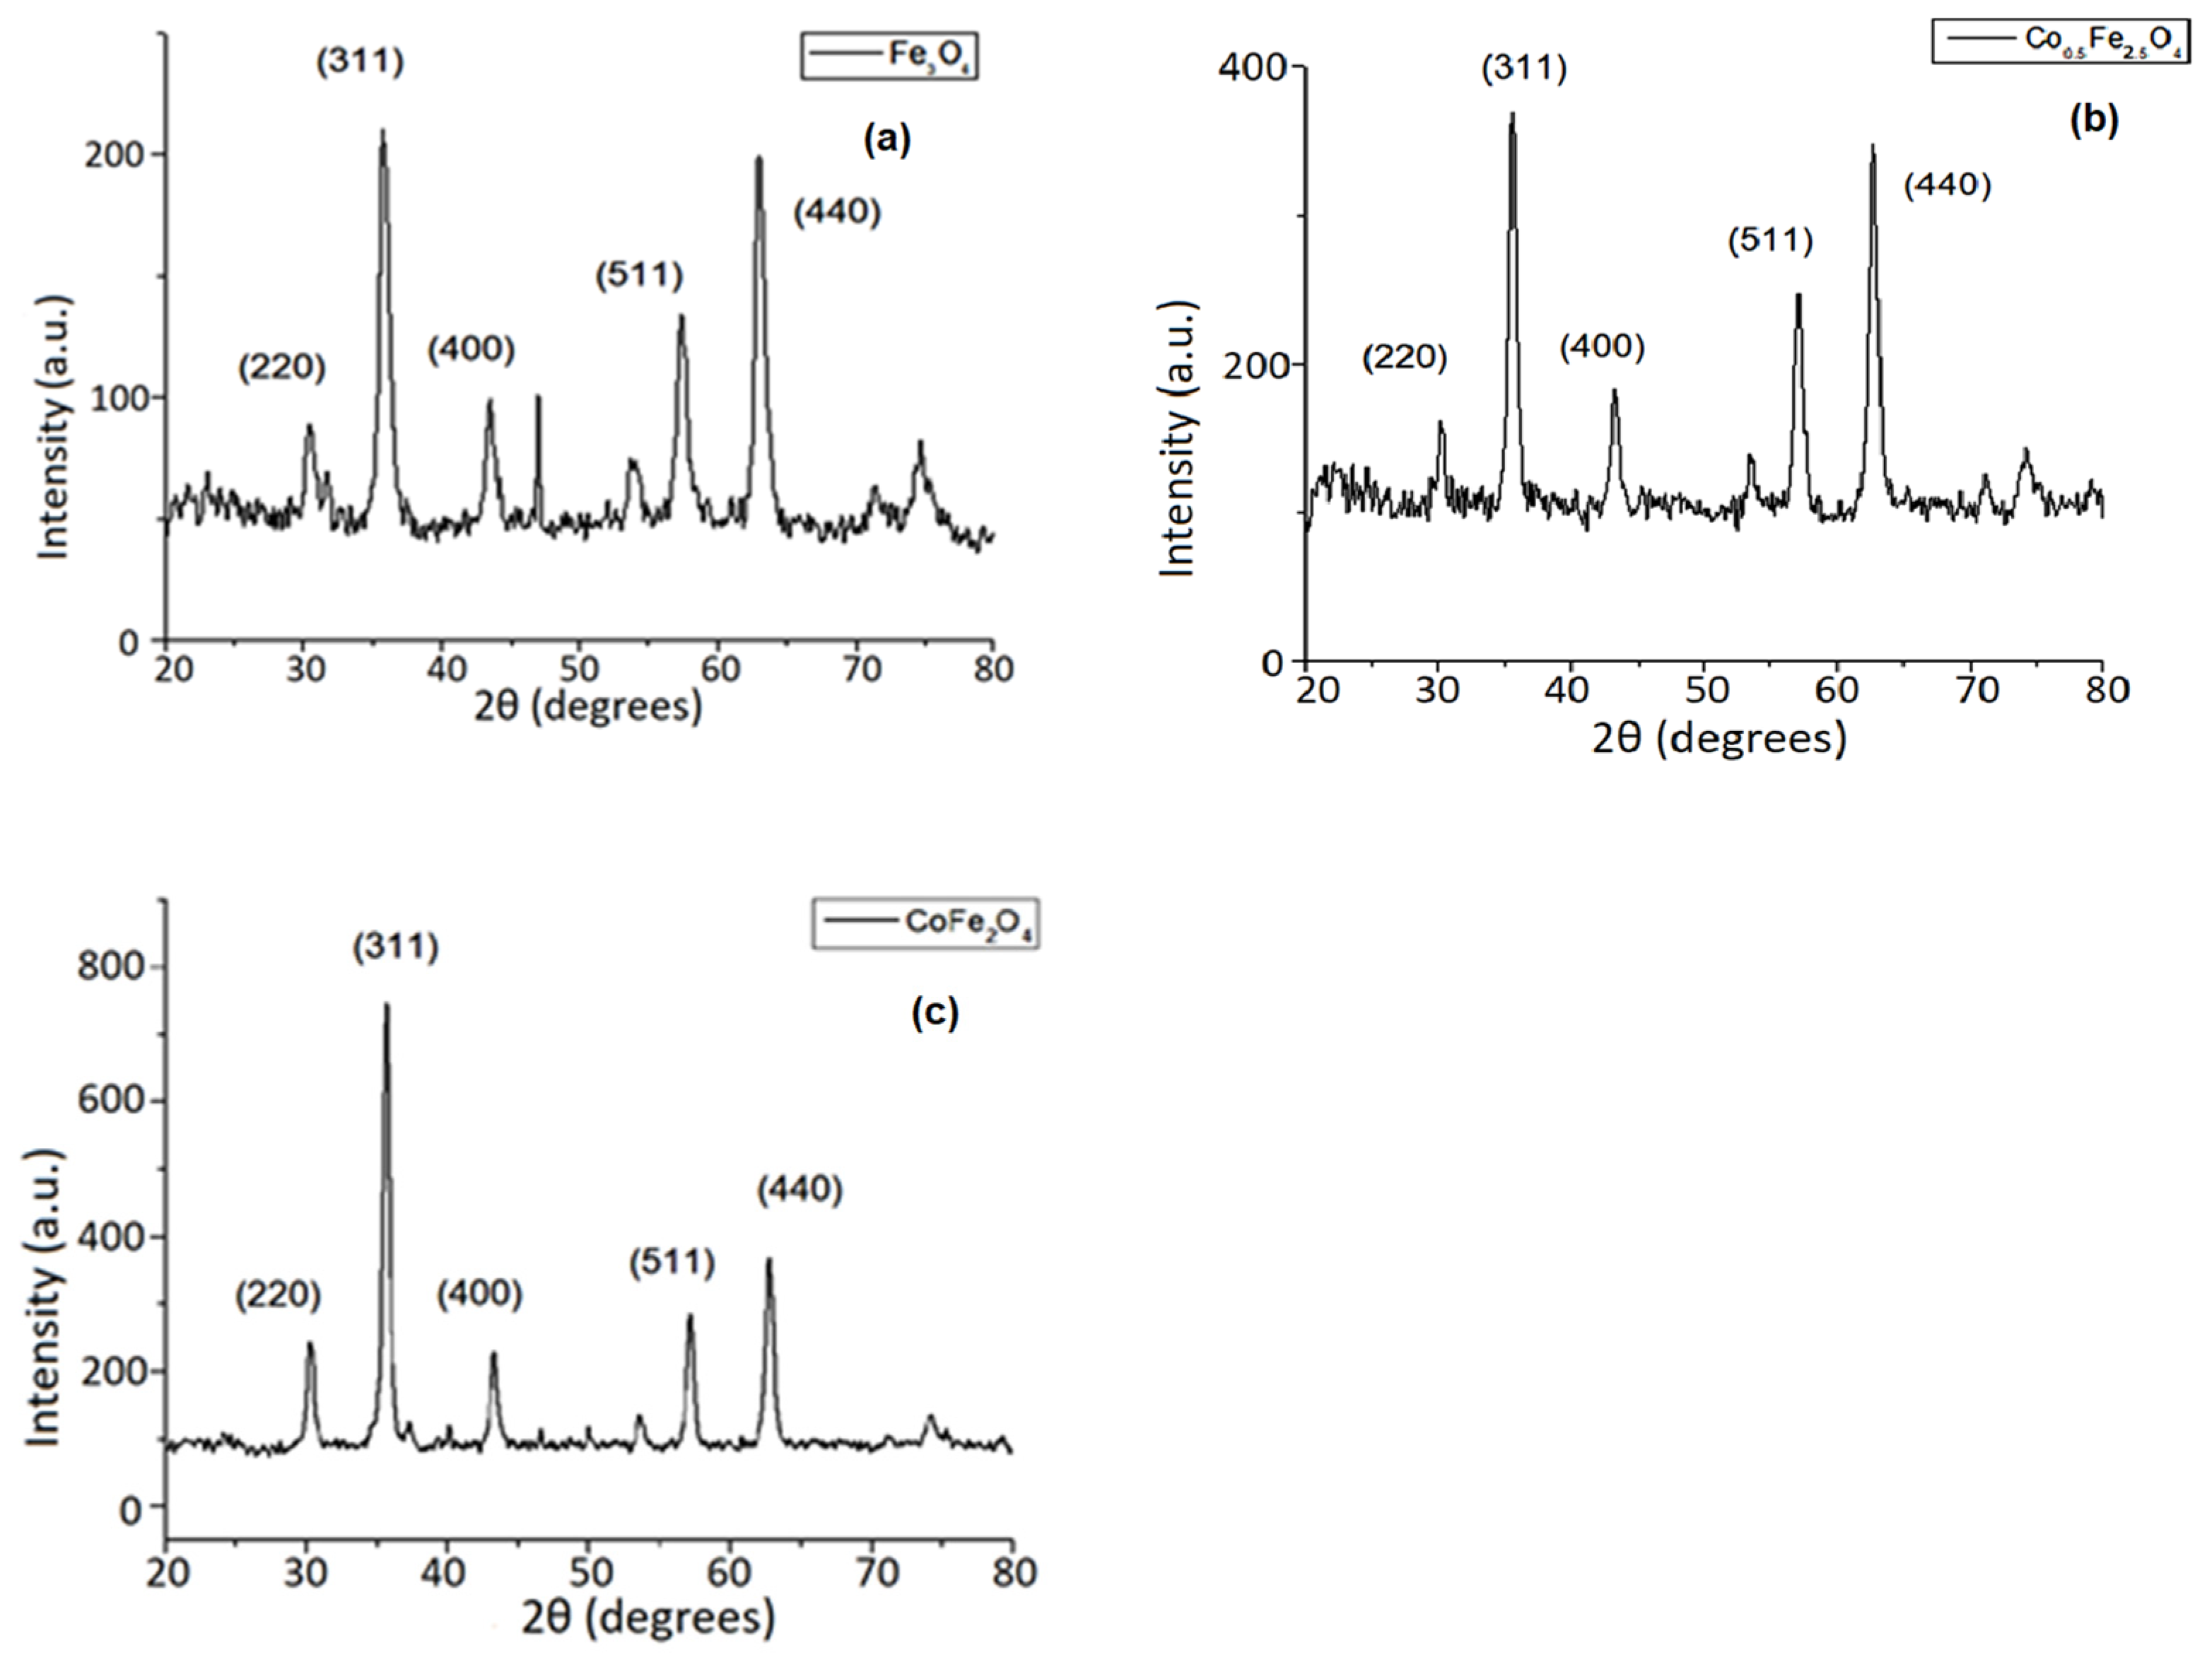
3.2. XRD Investigation Results

The crystalline structure of the dried ferrophase from the colloidal suspension samples was described by the XRD procedure (Figure 2). The peaks indexation could be conducted according to reference data for magnetite (Card No. ICSD 98-015-8505) and cobalt ferrite (Card No. ICSD 98-010-9045) crystallites with spinel structures. Characteristic crystallization peaks were identified for Miller indexes (220), (311), (400), (511), and (440). In the magnetite sample (Fe3O4), the diffraction peaks at about 31.7° and 46.9° could be generated by small traces of goethite (pdf ref. 00-029-0713) (Fe-O-OH), formed as intermediate in the iron oxide crystallization, or siderite (FeCO3) (pdf ref. 00-029-0696), resulted from either air-borne carbon dioxide that interacted with iron [20] or sodium (traces from the precipitation agent, NaOH [21]).
The average crystallite size of the nanoparticles, Dhkl, was calculated (Equation (1)) from the diffraction peak data, with Scherrer formula:
D h k l = K λ β c o s θ h k l
where K is a shape factor with a value close to unity, λ is the X-ray wavelength, β is the line broadening at half the maximum intensity, θhkl is the peak position (the Bragg angle). In Figure 3a, the values of D311 are represented for different cobalt content values. It was determined that the size of the crystallites is in the range of 9–16 nm, increasing with the cobalt content. When compared to other reports, we found that in [22], the authors reported synthesized cobalt ferrite with the average size of 42.5 nm, while in [23], the synthesis of cobalt ferrite nanoparticles of 34 nm was presented. The lattice parameter a was calculated (Equation (2)) as below, with h, k, l being the Miller indexes and dhkl the interplanar distance:
1 d h k l 2 = h 2 + k 2 + l 2 a 2 .
where the interplanar distance (Equation (3)) is:
d h k l = λ 2 s i n θ h k l
Analyzing the crystallization data, the cobalt-doping influence on the lattice parameters was observed. According to Figure 3b, the values of the lattice parameter, a, linearly depend on the cobalt content (linear correlation coefficient over 0.989). This reflects the progressive increase of cobalt content (Figure 3b).
Similarly, some reports specified that the lattice parameter for magnetite was determined to be 8.36 Å [24] or 8.39 Å for cobalt ferrite [22,25]. The increase in lattice parameter with cobalt content was also reported in [26].

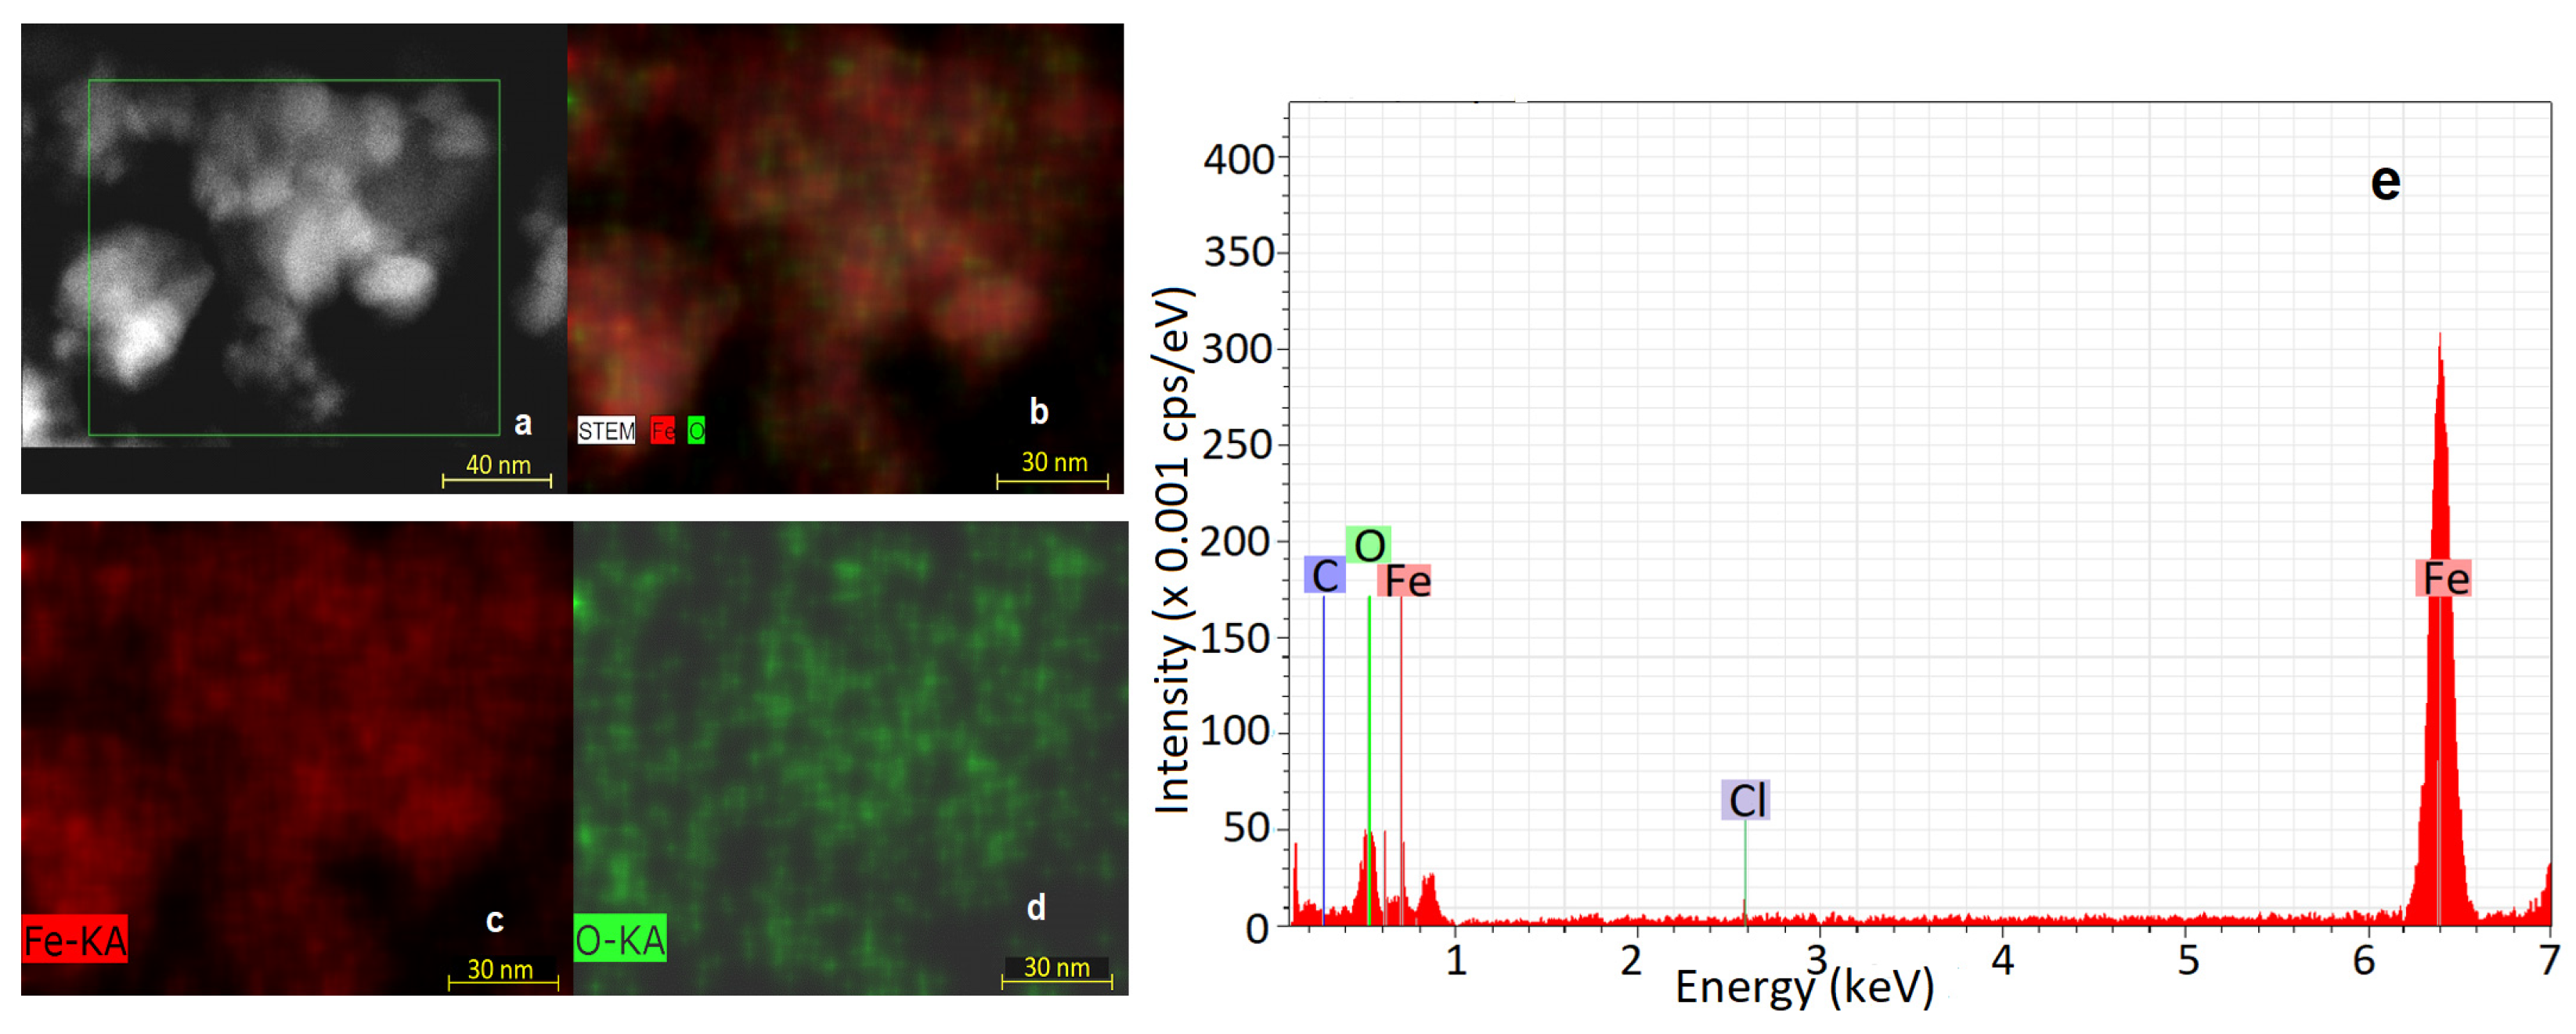
3.3. EDS Analysis Results

Elemental analysis in the selected sample area (Figure 4a) corresponding to Fe3O4 nanoparticles was conducted based on Scanning Transmission Electron Microscopy recordings with distinct images for the presence of iron and oxygen (Figure 4b–d). In Figure 4, the qualitative elemental maps present the distribution of iron, oxygen, and iron with oxygen, as resulted from the Kα shell emission lines obtained by STEM analysis. In Figure 4e, the more detailed representation of the EDS investigation is shown. In Figure 4e, the iron lines Kα (at about 6.5 KeV, with highest intensity) and Lα (at about 0.65 KeV, with much lower intensity) are evidenced together with oxygen Kα line (at about 0.52 KeV) with rather small intensity, related to the fact that oxygen, as well as carbon recording accuracy, are known as quite low in EDS and cannot be quantified reliably.
In the present case, the carbon is received from the sample support (carbon Kα line at about 0.27 KeV), and the very small peak of chlorine at about 0.26 KeV stems from perchlorate thin coating (Kα line, not visualized by STEM image since the intensity values are close to the recording noise). In Figure 5a–e, the uniform spread of iron (Figure 5b), cobalt (Figure 5c), and oxygen atoms (Figure 5d) at nanoscale is suggested from the image similarity (for cobalt doped magnetite as in the case of magnetite, presented above).
In Figure 5f, the cobalt lines are evidenced (Co 0.5Fe2.5O4) at about 6.9 KeV (Kα line) and 0.77 KeV (Lα line), close to iron Kα and L lines and possessing smaller relative intensities. Carbon from the sample support appears with the highest intensity Kα line at about 0.27 KeV, which is in accordance with the apparent largest zone lacking nanoparticles presented in Figure 6a. The very small peak of chlorine (from perchlorate coating) at about 0.26 KeV appeared, too (Kα line [27]), with oxygen also present with Kα line at about 0.52 KeV. According to Figure 6a–e, the elemental composition of the studied cobalt ferrite nanoparticles is confirmed by the emphasizing of Kα shell emission lines of iron (Figure 6b), cobalt (Figure 6c), and oxygen (Figure 6d), which appeared to be distributed very similarly on the selected area of the sample. Due to the very small amount of perchlorate anions at the nanoparticle surface, the chlorine visualization was not a reliable capture, although the corresponding emission line is expected to be implicitly contained in Figure 6e. According to Figure 6f, the cobalt Kα line of CoFe2O4 nanoparticles has a higher relative intensity compared to the previous sample (Co0.5Fe2.5O4), as expected, while the chlorine line appears doubtable among noise lines (approximately 2.6 eV). Thus, this report observed expected composition for the magnetic nanoparticles synthesized, while approximative identification could be conducted for the capping shell by means of the very low line of chlorine. The fact that, for the Fe3O4 sample, the chlorine appears to be the least represented suggested that perchlorate ions binding to nanoparticle surface is different than for the nanoparticles containing cobalt ions, i.e., the capping shell covers clusters of particles rather than individual ones, meaning a smaller amount of perchlorate ions. Thus, the hydrodynamic diameter evidenced in the DLS analysis (presented further below) is noticeably higher than for cobalt-containing nanoparticles.

3.4. DLS Investigation Results

In Figure 7, Figure 8 and Figure 9, the nanoparticle hydrodynamic diameter and Zeta potential are presented. In each case, three repetitions of the measurements were accomplished.
Zeta potential was determined to be 28 mV for magnetite (Figure 7), while for cobalt-doped magnetite (Figure 8) and cobalt ferrite (Figure 9), the values were 20.47 and 30.29 mV, respectively, denoting good stability for the three suspensions.
The mean hydrodynamic diameter ranged between 77.8 and 311.2 nm as summarized in Table 3; the relatively high values suggest that fluid layers are surrounding particles as well as particle agglomerates, with the agglomeration being the consequence of a moderate or small coating effect. Smaller diameters for the cobalt-containing samples suggest a greater binding of perchlorate ions on individual particles, which imped particle agglomeration. The dispersity index (PI) appears to be almost the same in all samples.

3.5. VSM Investigation Results

The magnetic properties of the nano-powders synthesized by us are mainly determined by the distribution of Co2+ and Fe2+ ions in the crystalline structure. The (M, H) hysteresis curves for the studied samples recorded at room temperature under high external fields (up to 20 kOe) are shown below (Figure 10).
The saturated hysterezis curves suggest that the samples present, along with ferrimagnetic characteristics, also superparamagnetic characteristics, due to large and respectively small particles that have different magetic behaviors. The saturation magnetization of magnetite nanoparticles (x = 0) was 64.68 emu/g, while an increased value was demonstrated for cobalt-doped magnetite nanoparticles (x = 0.5), of 72.48 emu/g; the decrease at 54.13 emu/g was demonstrated for cobalt ferrite nanoparticles (x = 1).
The distribution of Co2+ and Fe2+ ions in the tetrahedral and octahedral sites constitutes a role in establishing the typology of the spinel structure and, consequently, for the magnetic properties, especially the saturation magnetization [28]. As is known, cobalt ions can generate defects in the structure of the cobalt ferrite nanoparticles, but also on their surface [29]. Thus, the magnetic properties are influenced by the crystallization defects inside the nanoparticles.
Another important factor influencing the magnetic properties is the anisotropy of the surface and the disordered spin coating, as suggested by [30] where the saturation magnetization is decreasing because of surface anisotropy and spin perturbations that influence the magnetic moment of nanoparticles and the magnetic interactions of neighboring nanoparticles. In [1], a dead magnetic layer at the cobalt ferrite nanoparticle surface is mentioned. In addition, other authors [31] stated that the decrease in saturation magnetization is due to the morphology and surface defects that lead to a non-collinearity of the magnetic moments on the surface. In another study [32], the authors affirmed that, according to the theory of the core–shell model, the disordered spines at the surface shell can form a dead magnetic layer (magnetically disordered), leading to the decrease of the saturation magnetization values.
Magnetic parameters such as saturation magnetization (MS), remanent magnetization (Mr), and coercive field (Hc) are determined from the hysteresis loops and tabled in Table 4. Based on the Langevin theory [33], the diameter of the magnetic core can be estimated, as in Equation (4)
d M = 18 k B T π μ 0 M s · M b d M d H H 0 1 / 3
where kB represents the Boltzmann constant, MS and Mb represent the saturation magnetization of the magnetic nanoparticle sample and of the pure bulk magnetite, µ0 represents vacuum magnetic permeability, and (dM/dH) represent the slope in the origin of the (M, H) graph. According to the graph in Figure 11, it is observed that the magnetic diameter decreases as the cobalt content in the nanoparticles increases.
From the graphs represented in Figure 11b, it is observed that with the increase in the cobalt content, the values of both coercive field and remanent magnetization have increased, which suggests an increase in the ferrimagnetic properties. The relationship between magnetic coercivity and particle size has also been widely reported [34,35,36]. The increase in coercivity could be due to the presence of magneto-crystalline anisotropy in the crystal. Surface phenomena related to spin anisotropy [37] can impair nanoparticle magnetic momentum and magnetic dipole–dipole interactions among neighbor nanoparticles. One could assume that different properties of the nanoparticle surface layer for different cobalt contents could influence the perchlorate binding so that the non-magnetic coating shell was enhanced, and the magnetic core size was significantly diminished (Figure 11a). A summary of the results regarding nanoparticle size is presented in Table 5. In Figure 12a–c, the vibrational behavior of CoxFe3−xO4 powders is presented in comparison to the corresponding samples after stabilization with perchloric acid in aqueous suspension.

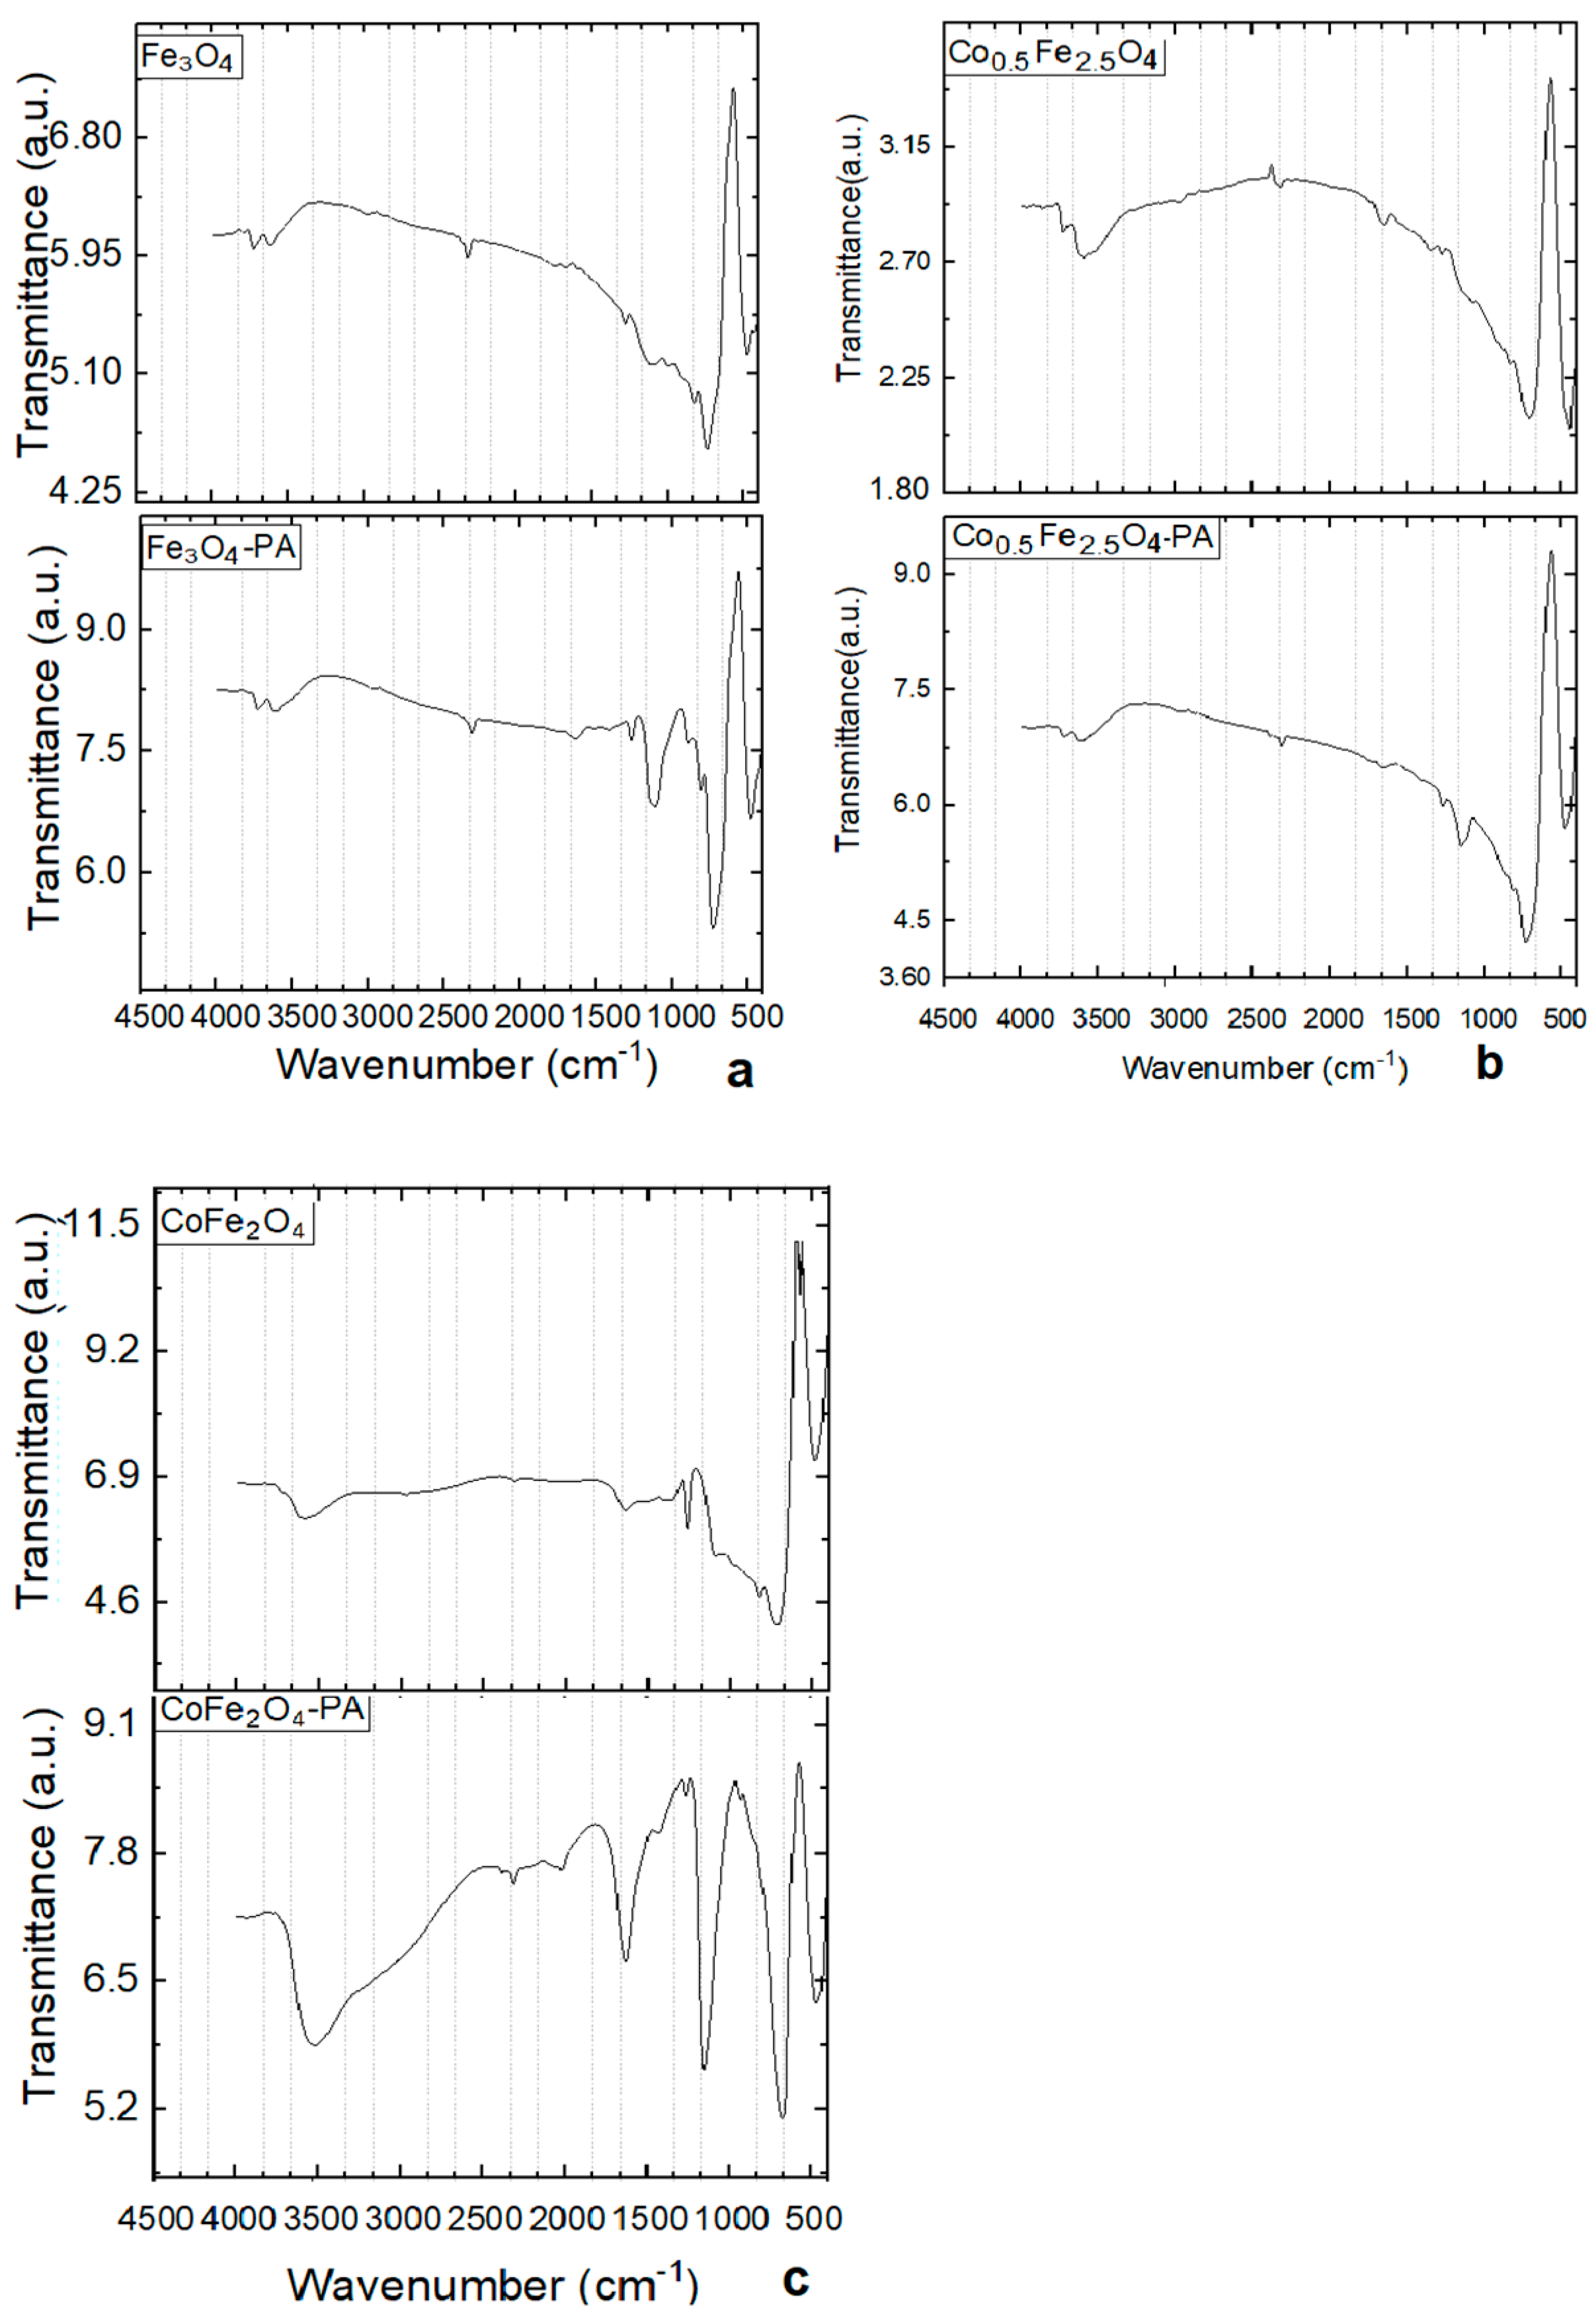
3.6. FTIR Investigatig Results

The interaction of perchlorate ions with the magnetic nanoparticles is indicated by the presence of the vibration band at about 1097–1136 cm−1 in magnetite (Figure 12a), at 1145 cm−1–1264 cm−1 in cobalt-doped magnetite (Figure 12b), and at 1150 cm−1 in cobalt ferrite (Figure 12c), in accordance with data [38] that mention the antisymmetric vibrations of perchlorate at 1125–1170 cm−1 for free perchlorate (while for organic molecule bound, the band is at 1032–1115 cm−1).
The vibrations found between 400 cm−1 and 900 cm−1 (Figure 12a) represent skeleton vibrations or fingerprint of iron oxide spinel crystals with an Fe-O vibration band at 472 cm−1 and the shoulder at 665 cm−1 according to [39], where these vibrations at 695.29 and 468.80 cm−1 were reported. The bands at 736 cm−1 and 820 cm−1 could represent the vibrations of Fe-O-OH from traces of goethite, possibly present in the sample from the partial oxidization process [40,41,42]. At 2310 cm−1, one can see the band that could be assigned to the adsorption of CO2 [43,44] from the reaction medium.
The OH-stretching vibrations (from the water traces adsorbed at the surface of nanoparticles) can be found at 3500–3700 cm−1 [45]. In Figure 12b, the cobalt ferrite crystallite vibrations present in the Co–O vibration band at 730 cm−1 (cobalt ions in octahedral positions), and the Fe–O vibration at 470 cm−1 (iron ions in tetrahedral positions) in accordance with [46]. The small-intensity band at 2339 cm−1 could represent the CO2 adsorbed from the reaction medium [43,44], while the small intensity band at 1635–1656 cm−1 could be emitted by the bending vibrations of hydroxyl from small amounts of adsorbed water [47], with the water-stretching vibrations found at high wavenumbers (3500–3700 cm−1).
The analysis of FTIR investigation results could be useful mainly for the discussion on the perchlorate binding at the nanoparticle surface, as well as other aspects regarding nanoparticle crystalline features. According to Figure 12c, the increase of cobalt content (x = 1) resulted in the revealing of the vibration bands at 820–1260 cm−1 corresponding to the Co–Fe bonds in the alloy system [48,49]. Small amounts of adsorbed CO2 or water bound at the nanoparticle surface are susceptible from the low-intensity vibrations at 1260 cm−1 [42,43] and 2350 cm−1 and 3500 cm−1, respectively.

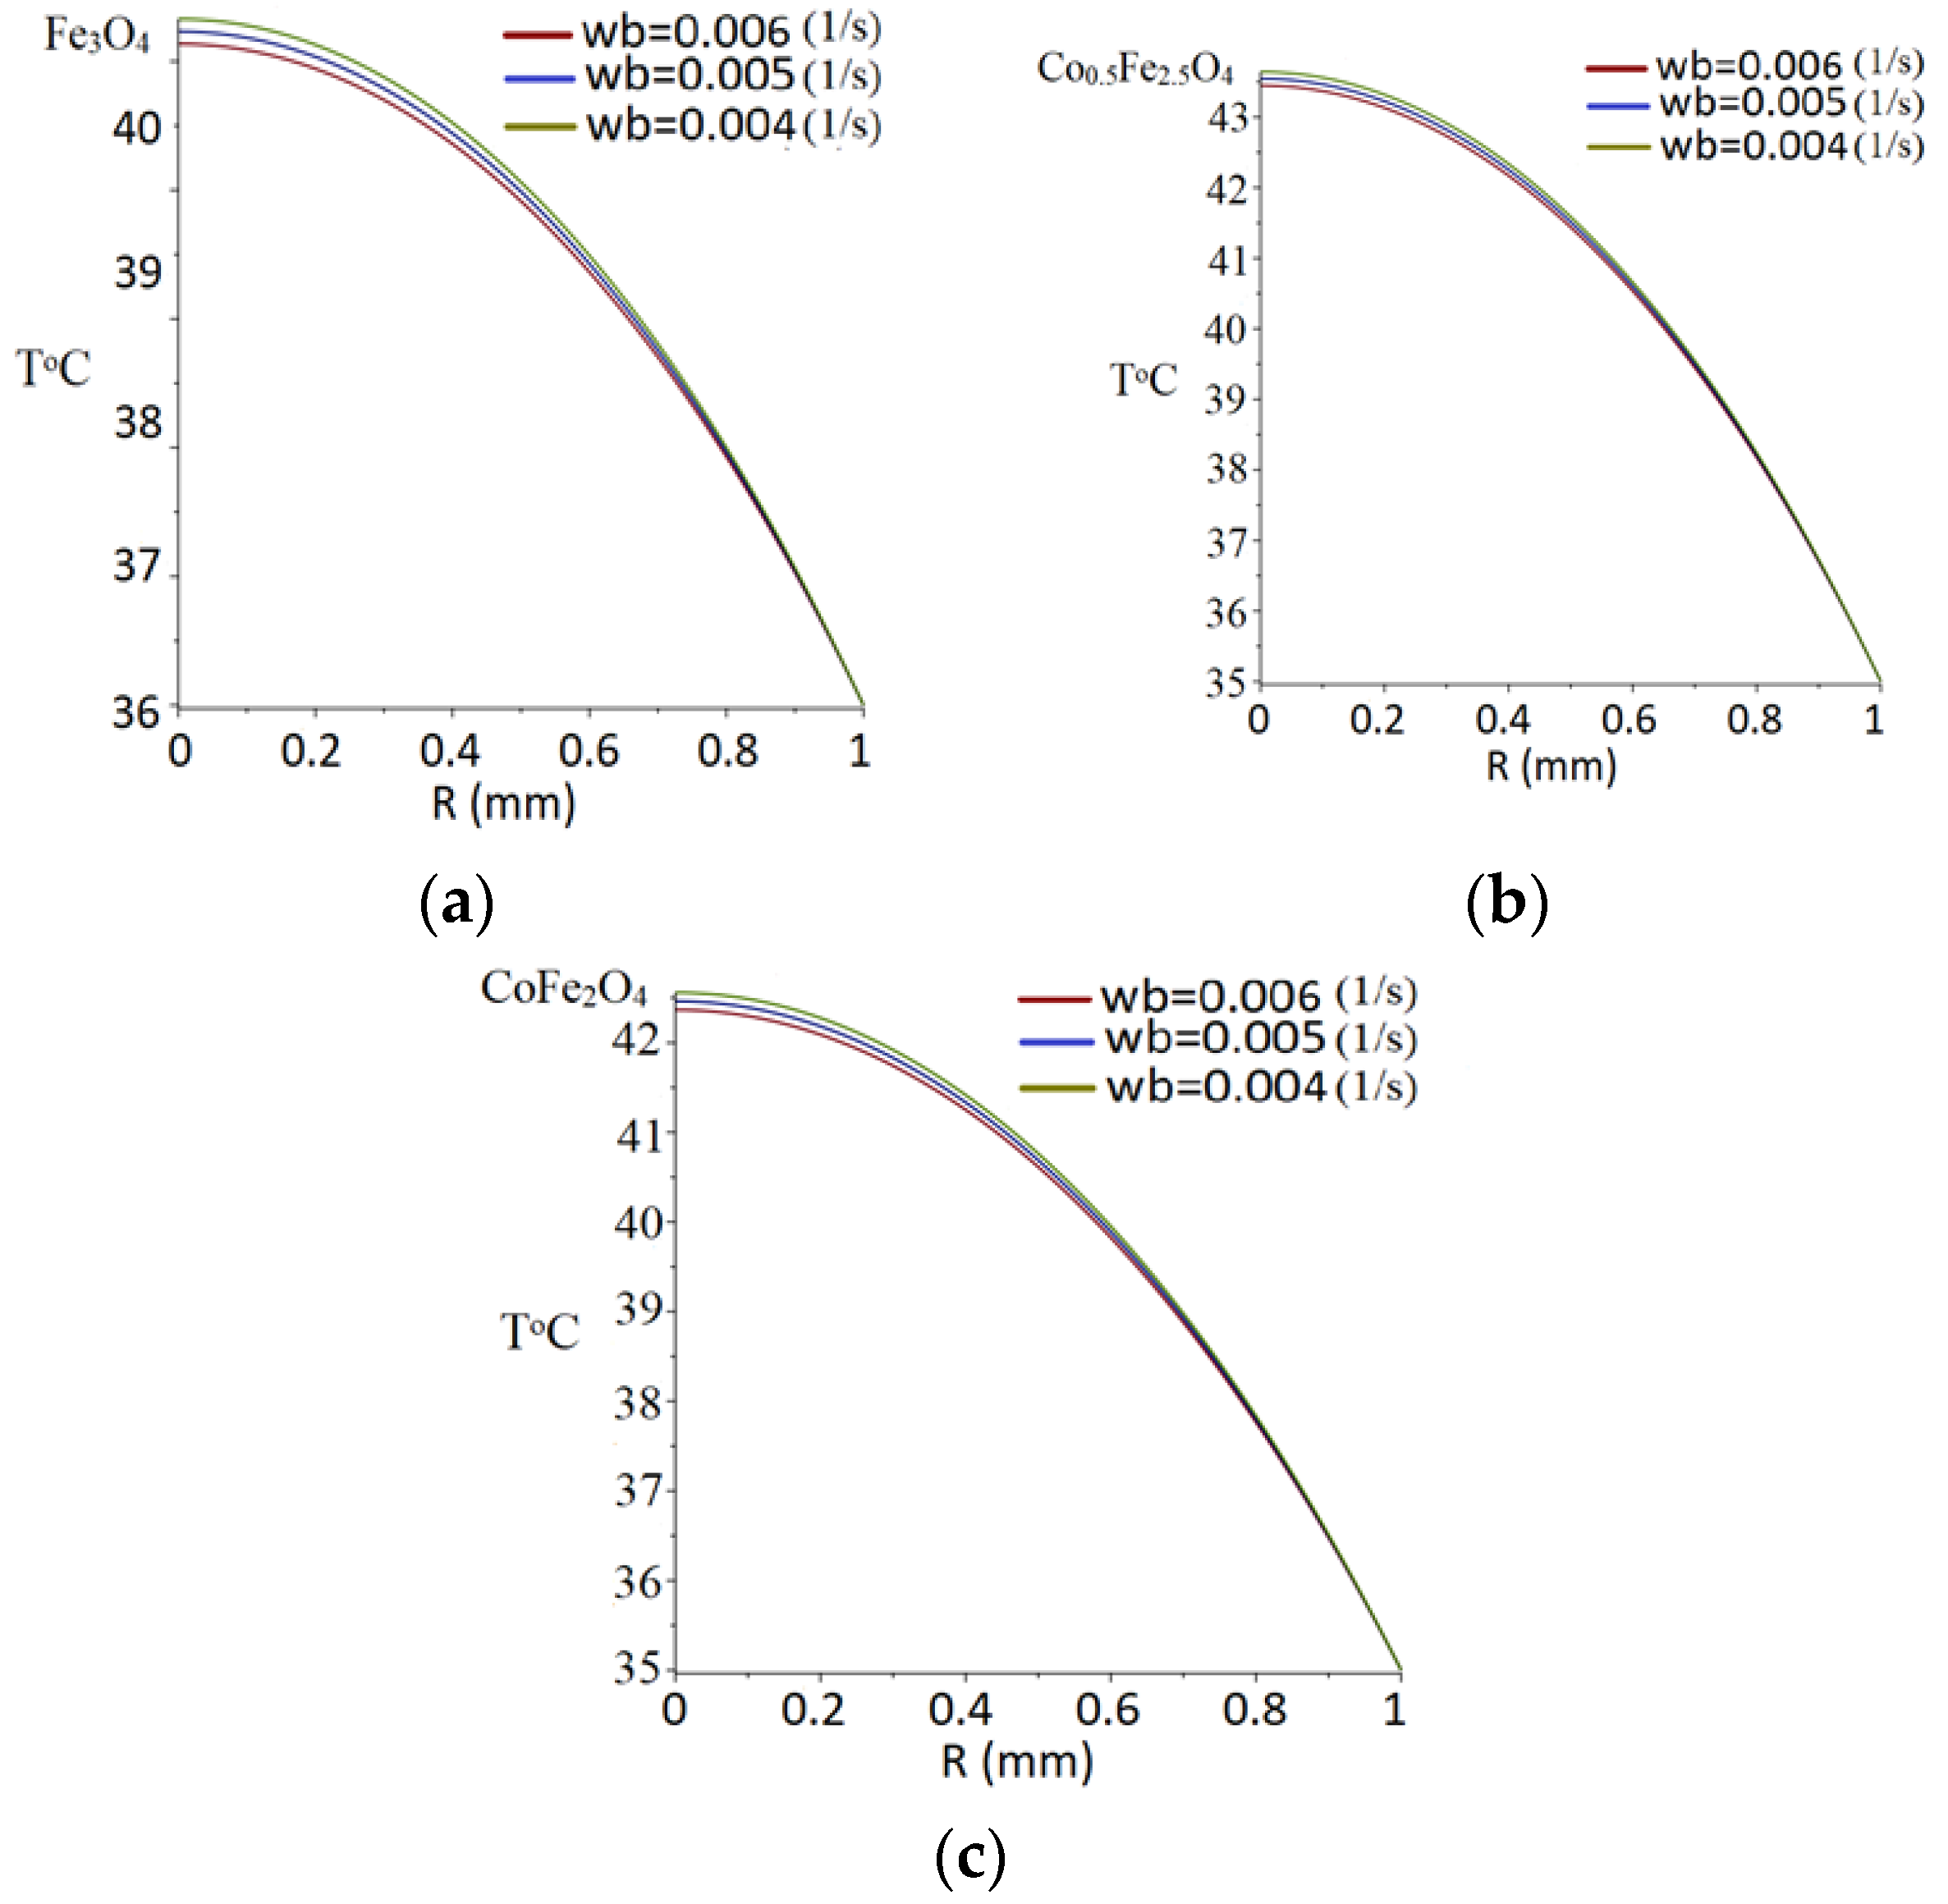
3.7. Temperature Field Modeling

The temperature field within malignant and healthy tissues is described by the solutions of the bioheat transfer equation (Pennes equation) in the living tissues [17]:
ρ c T t = 𝛻 k   𝛻 T + ρ b ω b c b T a r t T + Q m e t + Q ,  
with the following thermal characteristics (Table 6) for the blood and the tissue, detailed as the skin: ρ represents the tissue’s mass density; c represents specific heat capacity of the tissue; k represents the skin thermal conductivity; ρb represents the mass density of the blood; cb represents the specific heat capacity of the blood; Tart represents blood temperature; ωb represents the blood perfusion rate; and Qmet represents the metabolic heat production in the tissue [50,51,52]. Q (W/m3) represents power density (volumetric heating rate) dissipated by the magnetic particles within geometric configuration when the magnetic field is applied.
At thermal equilibrium, the Equation (1) can be written as:
1 r 2 r r 2 T r + ω b c b ρ b k T a T + Q m + Q e x t k = 0
1 r ¯ 2 r ¯ r ¯ 2 T ¯ r ¯ α T ¯ + β = 0
with the notations:
α = ω ¯ b β = ω ¯ b + Q ¯ m ω ¯ b = ω b c b ρ b R 2 k Q ¯ m = Q m + Q e x t R 2 k T a T e T ¯ = T T e T a T e
The solution of this equation has the form:
T ¯ r ¯ = C 1 r ¯ I 1 2 r ¯ α + β α
T r = T e + T ¯ T a T e ,
T r = T e + T a T e β α 1 I 1 2 r ¯ α I 1 2 α r ¯
where I1/2 is Bessel function of 1/2 order and c1 is an integration constant.
The boundary conditions are:
(i) The Dirichlet boundary condition was considered on the external surface of the healthy tissue:
T r = R = 37   ° C  
The amount of heat produced in unit volume per unit time by individual magnetic nanoparticle in the alternating magnetic field with amplitude H is determined by the frequency of the field f multiplied by the hysteresis loop area in the (M, H) coordinates (where M is magnetic nanoparticle magnetization) Q e x t = f   W l o s s   , and W l o s s = μ 0 H d M is the hysteresis loop area; μ 0 = 4 π · 10 7   H/m is the permeability.
The power density Q was computed from the hysteresis loop area, which was determined experimentally [53,54].
The value of frequency of the magnetic field was considered as f = 100 kHz. The temperature field generated by individual nanoparticle coated with perchloric acid was described for a spherical configuration of radius R of the malignant tissue, where we assumed that the nanoparticle-diluted suspension was injected right in the center. The magnetizability properties of the prepared samples were the basis for the simulation of heat transfer in the simplified tumor model. Mathematical modeling was carried out using Maple software. The thermal and magnetic characteristics that were used are detailed in Table 6. Figure 13 illustrates the temperature field that is dependent on the distance from the center of the tumor, which resulted in the therapeutic range from 40–44 °C. In addition, the blood perfusion rate influences the temperature field, so it can be observed that the temperature field values increase as the perfusion rate values decrease but remains in the therapeutic range. In the case of each type of magnetic nanoparticle, the graphical curves were generated for three values of the ωb parameter (Table 6). It could be observed that the local heating is occurring up to 1 mm in distance by monotonous decrease to zero for R = 1 mm. It was observed that the highest temperatures were reached for cobalt-doped magnetite of over 43 °C in dependence on the ωb value, the maximum heating observed for ωb = 0.004 s−1. This result is concordant with the experimental magnetization data that showed the highest magnetizability for cobalt-doped magnetite Co0.5Fe2.5O4. The model development is planned for the next study step for new nanoparticles that will be synthesized and characterized further.

4. Conclusions

Magnetic nanoparticles of CoxFe3−xO4 crystals (x = 0/0.5/1) with 9.8–15.2 nm of crystallite size were synthesized, aiming their study for applications in tumor hyperthermia. High-Resolution TEM displayed the capping shell covering individual particles for the samples containing cobalt but covering particle clusters rather than individual particles in the case of magnetite, which could be related to a very weak chlorine peak in EDS spectrum. In addition, the largest hydrodynamic diameter resulted from DLS investigation for magnetite. Vibrational spectroscopy evidenced the core-shell interactions that ensured the sample stabilization in aqueous suspensions, as required for medical administration.
VSM investigation revealed some peculiarities of magnetic nanoparticles containing cobalt, like increased coercivity (337 to 2274 Oe) and magnetic remanence (18 to 31 emu/g) that allow them to be responsive gradually to external magnetic field gradients.
The theoretical approach of magnetic nanoparticle behavior was attempted based on a simple algorithm. The proposed mathematical modeling of local temperature fields generated by magnetic nanoparticles of iron oxides and iron and cobalt oxides introduced in living tissues was carried out, with the influence of cobalt content being found in accordance with experimental results that were obtained for their magnetization properties.
The study will be continued with new nanoparticles containing different cobalt contents to reveal the optimal properties for tumor hyperthermia applications.

Author Contributions

Conceptualization, H.A., I.A. and D.C.; methodology, H.A., D.C., I.A. and D.P.; validation, H.A. and N.L.; investigation, M.G., G.A., N.M.-P. and L.U.; writing—original draft preparation, H.A., I.A. and D.C.; writing—review and editing, D.C. and D.P.; supervision, N.L. All authors have read and agreed to the published version of the manuscript.

Funding

This research received no external funding.

Data Availability Statement

Not applicable.

Conflicts of Interest

The authors declare no conflict of interest.

References

  1. Liu, F.; Laurent, S.; Roch, A.; Elst, L.V.; Muller, R.N. Size-controlled synthesis of CoFe2O4 nanoparticles potential contrast agent for MRI and investigation on their size-dependent magnetic properties. J. Nanomater. 2013, 2013, 462540. [Google Scholar] [CrossRef] [Green Version]
  2. Garanina, A.S.; Nikitin, A.A.; Abakumova, T.O.; Semkina, A.S.; Prelovskaya, A.O.; Naumenko, V.A.; Erofeev, A.S.; Gorelkin, P.V.; Majouga, A.G.; Abakumov, M.A.; et al. Cobalt ferrite nanoparticles for tumor therapy: Effective heating versus possible toxicity. Nanomaterials 2021, 12, 38. [Google Scholar] [CrossRef] [PubMed]
  3. Dey, C.; Ghosh, A.; Ahir, M.; Ghosh, A.; Goswami, M.M. Improvement of anticancer drug release by cobalt ferrite magnetic nanoparticles through combined pH and temperature responsive technique. ChemPhysChem 2018, 9, 2872–2878. [Google Scholar] [CrossRef] [PubMed]
  4. Tang, S.Q.; Moon, S.J.; Park, K.H.; Paek, S.H.; Chung, K.-W.; Bae, S. Feasibility of TEOS coated CoFe2O4 nanoparticles to a GMR biosensor agent for single molecular detection. J. Nanosci. Nanotechnol. 2011, 11, 82–89. [Google Scholar] [CrossRef] [PubMed] [Green Version]
  5. Uzunoğlu, D.; Ergüt, M.; Karacabey, P.; Özer, A. Synthesis of cobalt ferrite nanoparticles via chemical precipitation as an effective photocatalyst for photo Fenton-like degradation of methylene blue. Desalin. Water Treat. 2019, 172, 96–105. [Google Scholar] [CrossRef]
  6. Krishna, R.; Titus, E.; Chandra, S.; Bardhan, N.K.; Krishna, R.; Bahadur, D.; Gracio, J. Fabrication of a glucose biosensor based on citric acid assisted cobalt ferrite magnetic nanoparticles. J. Nanosci. Nanotechnol. 2012, 12, 6631–6638. [Google Scholar] [CrossRef]
  7. Lu, L.T.; Dung, N.T.; Tung, L.D.; Thanh, C.T.; Quy, O.K.; Chuc, N.V.; Maenosonoe, S.; Thanh, N.T.K. Synthesis of magnetic cobalt ferrite nanoparticles with controlled morphology, monodispersity and composition: The influence of solvent, surfactant, reductant and synthetic conditions. Nanoscale 2015, 7, 19596–19610. [Google Scholar] [CrossRef] [Green Version]
  8. Mohamed, R.M.; Rashad, M.M.; Haraz, F.A.; Sigmund, W. Structure and magnetic properties of nanocrystalline cobalt ferrite powders synthesized using organic acid precursor method. J. Magn. Magn. Mater. 2010, 322, 2058–2064. [Google Scholar] [CrossRef]
  9. Kurian, S.; Thankachan, D.S.; Nair, A.E.K.; Thomas, A.B.A.; Binu Krishna, K.T. Structural, magnetic, and acidic properties of cobalt ferrite nanoparticles synthesised by wet chemical methods. J. Adv. Ceram. 2015, 4, 199–205. [Google Scholar] [CrossRef] [Green Version]
  10. Tamboli, Q.Y.; Patange, S.M.; Mohanta, Y.K.; Sharma, R.; Zakde, K.R. Green Synthesis of cobalt ferrite nanoparticles: An emerging material for environmental and biomedical applications. J. Nanomater. 2023, 2023, 9770212. [Google Scholar] [CrossRef]
  11. Jeevanantham, B.; Song, Y.; Choe, H.; Shobana, M.K. Structural and optical characteristics of cobalt ferrite nanoparticles. Mater. Lett. X 2021, 12, 100105. [Google Scholar] [CrossRef]
  12. Stein, C.R.; Bezerra, M.T.S.; Holanda, G.H.A.; André-Filho, J.; Morais, P.C. Structural and magnetic properties of cobalt ferrite nanoparticles synthesized by co-precipitation at increasing temperatures. AIP Adv. 2018, 8, 056303. [Google Scholar] [CrossRef]
  13. Sangsuriyonk, K.; Paradee, N.; Rotjanasuworapong, K.; Sirivat, A. Synthesis and characterization of CoxFe1−xFe2O4 nanoparticles by anionic, cationic, and non-ionic surfactant templates via co-precipitation. Sci. Rep. 2022, 12, 4611. [Google Scholar] [CrossRef] [PubMed]
  14. Fantechi, E.; Innocenti, C.; Albino, M.; Lottini, E.; Sangregorio, C. Influence of cobalt doping on the hyperthermic efficiency of magnetite nanoparticles. J. Magn. Magn. Mater. 2015, 380, 365–371. [Google Scholar] [CrossRef]
  15. Sathya, A.; Guardia, P.; Brescia, R.; Silvestri, N.; Pugliese, G.; Nitti, S.; Manna, L.; Pellegrino, T. CoxFe3−xO4 nanocubes for theranostic applications: Effect of cobalt content and particle size. Chem. Mater. 2016, 28, 1769–1780. [Google Scholar] [CrossRef]
  16. Mazario, E.; Menéndez, N.; Herrasti, P.; Cañete, M.; Connord, V.; Carrey, J. Magnetic hyperthermia properties of electrosynthesized cobalt ferrite nanoparticles. J. Phys. Chem. C 2013, 117, 11405–11411. [Google Scholar] [CrossRef]
  17. Pennes, H.H. Analysis of tissue and arterial blood temperatures in the resting human forearm. J. Appl. Physiol. 1948, 1, 93–122. [Google Scholar] [CrossRef] [PubMed]
  18. Shih, T.-C.; Yuan, P.; Lin, W.-L.; Kou, H.-S. Analytical analysis of the Pennes bioheat transfer equation with sinusoidal heat flux condition on skin surface. Med. Eng. Phys. 2007, 29, 946–953. [Google Scholar] [CrossRef]
  19. Massart, R. Preparation of aqueous magnetic liquids in alkaline and acidic media. IEEE Trans. Magn. 1981, 17, 2–5. [Google Scholar] [CrossRef]
  20. Blanco-Andujar, C.; Ortega, D.; Pankhursta, Q.A.; Thanh, N.T.K. Elucidating the morphological and structural evolution of iron oxide nanoparticles formed by sodium carbonate in aqueous medium. J. Mater. Chem. 2012, 22, 12498. [Google Scholar] [CrossRef] [Green Version]
  21. Trivedi, M.K.; Sethi, K.K.; Panda, P.; Jana, S. Physicochemical, Thermal and Spectroscopic Characterization of Sodium Selenate Using XRD, PSD, DSC, TGA/DTG, UV-vis, and FT-IR. Marmara Pharm. J. 2017, 21, 311–318. [Google Scholar] [CrossRef] [Green Version]
  22. Sanpo, N.; Wang, J.; Berndt, C.C. Sol-Gel Synthesized Copper-Substituted Cobalt Ferrite Nanoparticles for Biomedical Applications. J. Nano Res. 2013, 22, 95–106. [Google Scholar] [CrossRef]
  23. Allaedini, G.; Tasirin, S.M.; Aminayi, P. Magnetic properties of cobalt ferrite synthesized by hydrothermal method. Int. Nano Lett. 2015, 5, 183–186. [Google Scholar] [CrossRef] [Green Version]
  24. Culita, D.C.; Patron, L.; Oprea, O.; Bartha, C.; Palade, P.; Teodorescu, V.; Filoti, G. Detailed characterization of functionalized magnetite and ascertained effects. J. Nanopart. Res. 2013, 15, 1916. [Google Scholar] [CrossRef]
  25. Ghorbani, H.; Eshraghi, M.; Sabouri Dodaran, A.A. Structural and magnetic properties of cobalt ferrite nanoparticles doped with cadmium. Phys. B Condens. Matter 2022, 634, 413816. [Google Scholar] [CrossRef]
  26. Olsson, R.T.; Salazar-Alvarez, G.; Hedenqvist, M.S.; Gedde, U.W.; Lindberg, F.; Savage, S.J. Controlled synthesis of near-stoichiometric cobalt ferrite nanoparticles. Chem. Mater. 2005, 17, 5109–5118. [Google Scholar] [CrossRef]
  27. El-Hiti, G.A.; Alotaibi, M.H.; Ahmed, A.A.; Hamad, B.A.; Ahmed, D.S.; Ahmed, A.; Hashim, H.; Yousif, E. The morphology and performance of poly(vinyl chloride) containing melamine schiff bases against ultraviolet light. Molecules 2019, 24, 803. [Google Scholar] [CrossRef] [Green Version]
  28. Vinosha, P.A.; Manikandan, A.; Preetha, A.C.; Dinesh, A.; Slimani, Y.; Almessiere, M.A.; Baykal, A.; Xavier, B.; Nirmala, G.F. Review on recent advances of synthesis, magnetic properties, and water treatment applications of cobalt ferrite nanoparticles and nanocomposites. J. Supercond. Nov. Magn. 2021, 34, 995–1018. [Google Scholar] [CrossRef]
  29. Wetterskog, E.; Tai, C.W.; Bergström, L.; Salazar-Alvarez, G. Anomalous magnetic properties of nanoparticles arising from defect structures: Topotaxial oxidation of Fe1−xO/Fe3−δO4 core /shell nanocubes to single-phase particles. ACS Nano 2013, 7, 7132–7144. [Google Scholar] [CrossRef]
  30. Shendruk, T.N.; Desautels, R.D.; Southern, B.W.; van Lierop, J. The effect of surface spin disorder on the magnetism of γ-Fe2O3 nanoparticle dispersions. Nanotechnology 2007, 18, 455704. [Google Scholar] [CrossRef]
  31. George, T.; Sunnya, A.T.; Varghese, T. Magnetic properties of cobalt ferrite nanoparticles synthesized by sol-gel method. IOP Conf. Ser. Mater. Sci. Eng. 2015, 73, 012050. [Google Scholar] [CrossRef]
  32. Zhang, Y.; Yang, Z.; Yin, D.; Liu, Y.; Fei, C.L.; Xiong, R.; Shi, J.; Yan, G.L. Composition and magnetic properties of cobalt ferrite nano-particles prepared by the co-precipitation method. J. Magn. Magn. Mater. 2010, 322, 3470–3475. [Google Scholar] [CrossRef]
  33. D’yachenko, S.V.; Zhernovoi, A.I. The Langevin formula for describing the magnetization curve of a magnetic liquid. Tech. Phys. 2016, 61, 1835–1837. [Google Scholar] [CrossRef]
  34. Herzer, G. Grain size dependence of coercivity and permeability in nanocrystalline ferromagnets. IEEE Trans. Magn. 1990, 26, 1397–1402. [Google Scholar] [CrossRef]
  35. Tajiri, T.; Terashita, N.; Hamamoto, K.; Deguchi, H.; Mito, M.; Morimoto, Y.; Konishi, K.; Kohno, A. Size dependences of crystal structure and magnetic properties of DyMnO3 nanoparticles. J. Magn. Magn. Mater. 2013, 345, 288–293. [Google Scholar] [CrossRef]
  36. Saafan, S.A.; Assar, S.T.; Mansour, S.F. Magnetic and electrical properties of Co1−xCax Fe2O4 nanoparticles synthesized by the auto combustion method. J. Alloys Compd. 2012, 542, 32–36. [Google Scholar] [CrossRef]
  37. Dehsari, H.S.; Asadi, K. Impact of stoichiometry and size on the magnetic properties of cobalt ferrite nanoparticles. J. Phys. Chem. C 2018, 122, 29106–29121. [Google Scholar] [CrossRef]
  38. Muthuselvi, C.; Rathika, N.; Selvalakshmi, K. Vibrational, Optical and antimicrobial activity studies on diglycine perchlorate single crystal. J. Appl. Sci. 2019, 19, 848–856. [Google Scholar] [CrossRef] [Green Version]
  39. Chaki, S.H.; Malek, T.J.; Chaudhary, M.D.; Tailor, J.P.; Deshpande, M.P. Magnetite Fe3O4 nanoparticles synthesis by wet chemical reduction and their characterization. Adv. Nat. Sci. Nanosci. Nanotechnol. 2015, 6, 035009. [Google Scholar] [CrossRef]
  40. Music, S. Mössbauer, FT-IR and FE SEM investigation of iron oxides precipitated from FeSO4 solutions. J. Mol. Struct. 2007, 834–836, 445–453. [Google Scholar]
  41. Prasad, P.S.R.; Prasad, K.S.; Chaitanya, V.K.; Babu, E.V.S.S.K.; Sreedhar, B.; Murthy, S.R.J. In situ FTIR study on the dehydration of natural goethite. J. Asian Earth Sci. 2006, 27, 503–511. [Google Scholar] [CrossRef]
  42. Cui, H.; Ren, W.; Lin, P.; Liu, Y. Structure control synthesis of iron oxide polymorph nanoparticles through an epoxide precipitation route. J. Exp. Nanosci. 2013, 8, 869–875. [Google Scholar] [CrossRef]
  43. Ristic, M.; De Grave, E.; Music, S.; Popovic, S.; Orehovec, Z. Transformation of low crystalline ferrihydrite to α-Fe2O3 in the solid state. J. Mol. Struct. 2007, 454, 834–836. [Google Scholar] [CrossRef]
  44. Ghosh, M.K.; Poinern, G.E.J.; Issa, T.B.; Singh, P. Arsenic adsorption on goethite nanoparticles produced through hydrazine sulfate assisted synthesis method. Korean J. Chem. Eng. 2012, 29, 95–102. [Google Scholar] [CrossRef]
  45. Safi, R.; Ghasemi, A.; Shoja-Razavi, R.; Tavousi, M. The role of pH on the particle size and magnetic consequence of cobalt ferrite. J. Magn. Magn. Mater. 2015, 396, 288–294. [Google Scholar] [CrossRef]
  46. Anjum, S.; Tufail, R.; Rashid, K.; Zia, R.; Riaz, S. Effect of cobalt doping on crystallinity, stability, magnetic and optical properties of magnetic iron oxide nano-particles. J. Magn. Magn. Mater. 2017, 432, 198–207. [Google Scholar] [CrossRef]
  47. Karthickraja, D.; Karthi, S.; Kumar, G.A.; Sardar, D.K.; Dannangoda, G.C.; Martirosyan, K.S.; Girija, E.K. Fabrication of core–shell CoFe2O4@HAp nanoparticles: A novel magnetic platform for biomedical applications. New J. Chem. 2019, 43, 13584. [Google Scholar] [CrossRef]
  48. Rana, S.; Philip, J.; Raj, B. Micelle based synthesis of cobalt ferrite nanoparticles and its characterization using Fourier transform infrared transmission spectrometry and thermogravimetry. Mater. Chem. Phys. 2010, 124, 264–269. [Google Scholar] [CrossRef]
  49. Oliveira, P.N.; Silva, D.M.; Dias, G.S.; Santos, I.A.; Cotica, L.F. Synthesis and physical property measurements of CoFe2O4:BaTiO3 core-shell composite nanoparticles. Ferroelectrics 2016, 499, 76–82. [Google Scholar] [CrossRef]
  50. Vitello, D.J.; Ripper, R.M.; Fettiplace, M.R.; Weinberg, G.L.; Vitello, J.M. Blood density is nearly equal to water density: A validation study of the gravimetric method of measuring intraoperative blood loss. J. Vet. Med. 2015, 2015, 152730. [Google Scholar] [CrossRef] [Green Version]
  51. Nie, S.; Zhang, C.; Song, J. Thermal management of epidermal electronic devices/skin system considering insensible sweating. Sci. Rep. 2018, 8, 14121. [Google Scholar] [CrossRef] [PubMed] [Green Version]
  52. Specific Heat Capacity and Thermal Conduction of Blood. Available online: https://biology.stackexchange.com/questions/111370/specific-heat-capacity-and-thermal-conduction-of-blood (accessed on 30 May 2023).
  53. Pankhurst, Q.A.; Connolly, J.; Jones, S.K.; Dobson, J. Applications of magnetic nanoparticles in biomedicine. J. Phys. D 2003, 36, R167–R181. [Google Scholar] [CrossRef] [Green Version]
  54. Rosensweig, R.A. Heating magnetic fluid with alternating magnetic field. J. Magn. Magn. Mater. 2002, 252, 370–374. [Google Scholar] [CrossRef]
Scheme 1. The procedure of nanoparticle preparation.
Crystals 13 01058 sch001
Figure 1. (a). TEM micrographs for Fe3O4 nanoparticles (CoxFe3−xO4 with x = 0,), stabilized in the form of colloidal aqueous suspension by using perchloric acid. (a1) Scale bar of 100 nm; (a2) Scale bar of 50 nm; (a3) SAED (Selected Area Electron Diffraction); (a4) Scale bar of 20 nm; (a5) Histogram and lognormal-fitting curve; (b) TEM micrographs for Co0.5Fe2.5O4 nanoparticles (CoxFe3−xO4 with x = 0.5) stabilized in the form of colloidal aqueous suspension by using perchloric acid; (b1) Scale bar of 100 nm; (b2) Scale bar of 50 nm; (b3) SAED (Selected Area Electron Diffraction); (b4) Scale bar of 20 nm; (b5) Histogram with lognormal-fitting curve; (c) TEM micrographs for CoFe2O4 (CoxFe3−xO4, x = 1) nanoparticles stabilized in the form of colloidal aqueous suspension by using perchloric acid; (c1) Scale bar of 100 nm; (c2) Scale bar of 50 nm; (c3) SAED (Selected Area Electron Diffraction); (c4) Scale bar of 20 nm; (c5) Histogram and lognormal-fitting curve.
Crystals 13 01058 g001
Figure 2. XRD recording for the dried samples of magnetic nanoparticle colloidal suspensions in water (a) Fe3O4 (b) Co0.5Fe2.5O4 (c) CoFe2O4.
Crystals 13 01058 g002
Figure 3. (a) Crystallite size (Dhkl) linear dependence on the cobalt content in the ferrophase samples. Best linear variation was evidenced for D311 (correlation coefficient of 0.9993); (b) The lattice parameter increasing with the cobalt content in the studied ferrophase samples.
Crystals 13 01058 g003
Figure 4. (ae). EDS recordings for Fe3O4 sample. (a) Selected area of nanoparticle sample; (b) STEM recording of Fe and O elements in the selected area; (c) Fe ion distribution (Kα shell emission line) in the sample selected area; (d) O ion distribution in the sample selected area (Kα shell emission line); (e) EDS spectrum recorded for Fe3O4 sample.
Crystals 13 01058 g004
Figure 5. (af). The results of EDS investigation for the selected area of cobalt-doped magnetite nanoparticles. (a) Selected area of Co0.5Fe2.5O4 sample; (b) Visualization of Kα emission line of Fe; (c) Visualization of Co Kα emission line; (d) Oxygen Kα emission line; (e) Fe, Co, and O emission lines visualized together at the surface of the selected area; (f) EDS spectrum of cobalt-doped magnetite nanoparticle sample.
Crystals 13 01058 g005
Figure 6. (af) Visualization of the main element distribution at nanoscale in the EDS investigated sample of cobalt ferrite nanoparticles. (a) Selected area of nanoparticle spread. (b) The distribution of Fe ions, resulting from Kα shell emission line; (c) Co ions distributed from Kα line; (d) Oxygen ions in the studied sample of CoFe2O4 nanoparticle resulted from Kα line recording; (e) Summarized presentation of Fe, Co, and O ions in the STEM-investigated sample; (f) EDS spectrum recorded for cobalt ferrite nanoparticles.
Crystals 13 01058 g006
Figure 7. The results of DLS investigation for magnetite sample. (a) Hydrodynamic diameter. (b) Zeta potential.
Crystals 13 01058 g007
Figure 8. The results of DLS investigation for cobalt-doped magnetite. (a) Hydrodynamic diameter. (b) Zeta potential.
Crystals 13 01058 g008
Figure 9. The results of DLS investigation for cobalt ferrite. Hydrodynamic diameter; Zeta potential.
Crystals 13 01058 g009
Figure 10. Magnetization curves for CoxFe3−xO4 nanoparticles stabilized with perchloric acid in aqueous colloidal suspension.
Crystals 13 01058 g010
Figure 11. (a) Magnetic core size correlating to the increase of cobalt content; (b) The influence of cobalt content on the coercive field and remanent magnetization.
Crystals 13 01058 g011
Figure 12. FTIR spectra of (a) magnetite (x = 0) nanoparticle sample (up) and magnetite nanoparticles stabilized with perchloric acid (PA) (down); (b) Cobalt-doped (x = 0.5) magnetite (Co0.5Fe2.5O4) (up) and of perchloric acid-coated, cobalt-doped magnetite nanoparticles (down); (c) Cobalt ferrite (x = 1) (CoFe2O4) (up) and perchloric acid coated cobalt ferrite nanoparticles (down).
Crystals 13 01058 g012
Figure 13. The temperature field generated by (a) Fe3O4 nanoparticles. (b) Co0.5Fe2.5O4 nanoparticles; (c) CoFe2O4 nanoparticles.
Crystals 13 01058 g013
Table 1. Summary on the quantitative landmarks of the synthesis protocol.
SamplexFeCl3 × 6H2O
(134 mM)
FeSO4 × 7H2O
(67 mM)
CoSO4 × 7H2O
(67 mM)
NaOH
(1.7 M)
HClO4
(25%)
Fe3O403.62 g (100 mL)1.86 g (100 mL)-3.4 g (50 mL)3 mL
Co0.5Fe2.5O40.53.62 g (100 mL)0.93 g (50 mL)0.94 g (50 mL)3.4 g (50 mL)3 mL
CoFe2O413.62 g (100 mL)-1.88 g (100 mL)3.4 g (50 mL)3 mL
Table 2. Physical size of the colloidal magnetic nanoparticles, mean values, d, and standard deviations resulted from lognormal fitting, as proven by TEM investigation.
Cobalt ContentFerrophaseD (nm)St Dev (nm)
0Fe3O419.160.24
0.5Co0.5Fe2.5O422.300.27
1CoFe2O425.251.14
Table 3. The summary of DLS analysis results.
SampleDh (nm)PIV (mV)
Fe3O4-PA 311.20.23428.0
Co0.5Fe2.5O4-PA 157.40.23520.47
CoFe2O4-PA77.80.23930.29
Table 4. Magnetic characteristics revealed by VSM investigation.
SampleCobalt ContentdM
(nm)
MS (emu/g)Hc (Oe)Mr (emu/g)Mr/Hc
(emu/g/Oe)
Fe3O409.6464.6824.23810.360.427
Co0.5Fe2.5O40.56.7372.483337.2318.140.053
CoFe2O414.7754.1322274.731.440.013
Table 5. Comparative data regarding nanoparticle dimensional features.
SampledM
(nm)
D311
(nm)
DTEM (nm)Dh (nm)
Fe3O49.649.819.1311.2
Co0.5Fe2.5O46.7311.322.3157.4
CoFe2O44.7715.225.277.8
Table 6. Thermal and magnetic characteristics.
Thermal and Magnetic CharacteristicsValues
Te (K)308
Ta (K)310
ρb (kg/m3)1000
cb (J/kg K)4200
k (W/m·K)0.2
ωb (1/s)0.004/0.005/0.006
Qm (W/m3)400
Qext (W/m3) Fe3O42.06 × 105
Qext (W/m3) Co0.5Fe2.5O43.50 × 105
Qext (W/m3) CoFe2O43.03 × 105
Disclaimer/Publisher’s Note: The statements, opinions and data contained in all publications are solely those of the individual author(s) and contributor(s) and not of MDPI and/or the editor(s). MDPI and/or the editor(s) disclaim responsibility for any injury to people or property resulting from any ideas, methods, instructions or products referred to in the content.

