


Effect of Microchemistry Elements in Relation of Laser Welding Parameters on the Morphology 304 Stainless Steel Welds Using Response Surface Methodology
 , , ,
, , , 
Abstract
:1. Introduction
2. Materials and Methods
2.1. Materials
2.2. Welding Procedure
2.3. Mathematical Modeling
3. Results and Discussion
3.1. 304 HS Stainless Steel Cast
3.1.1. Regression Model for Weld Depth (Yd)
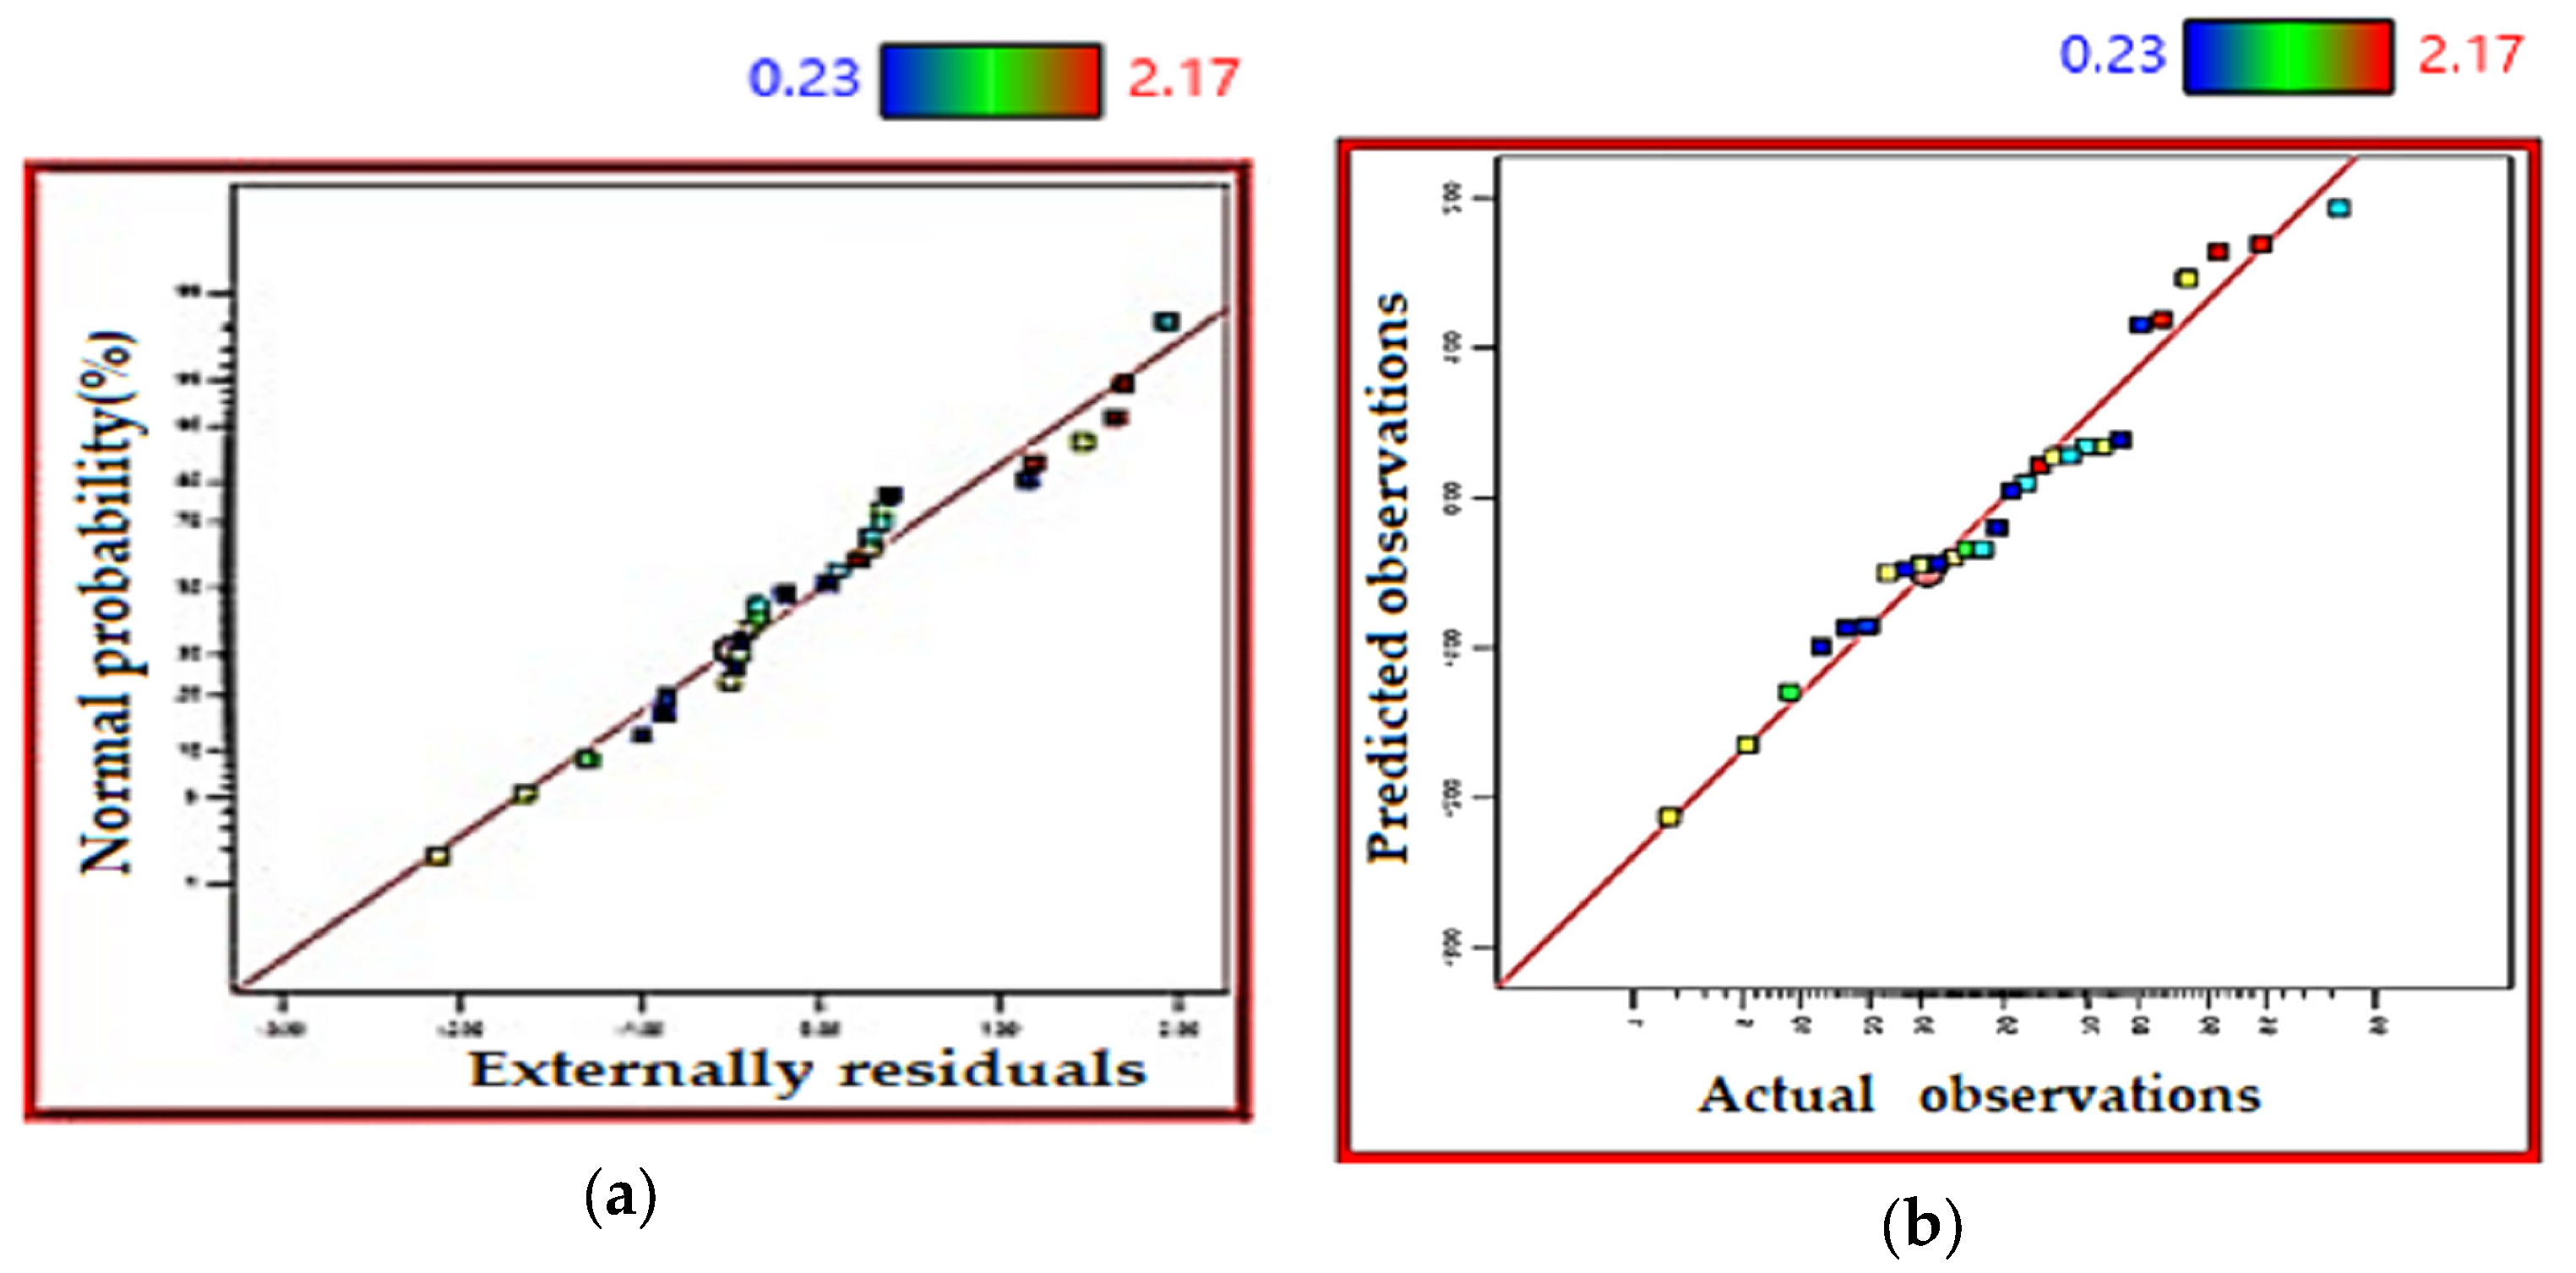
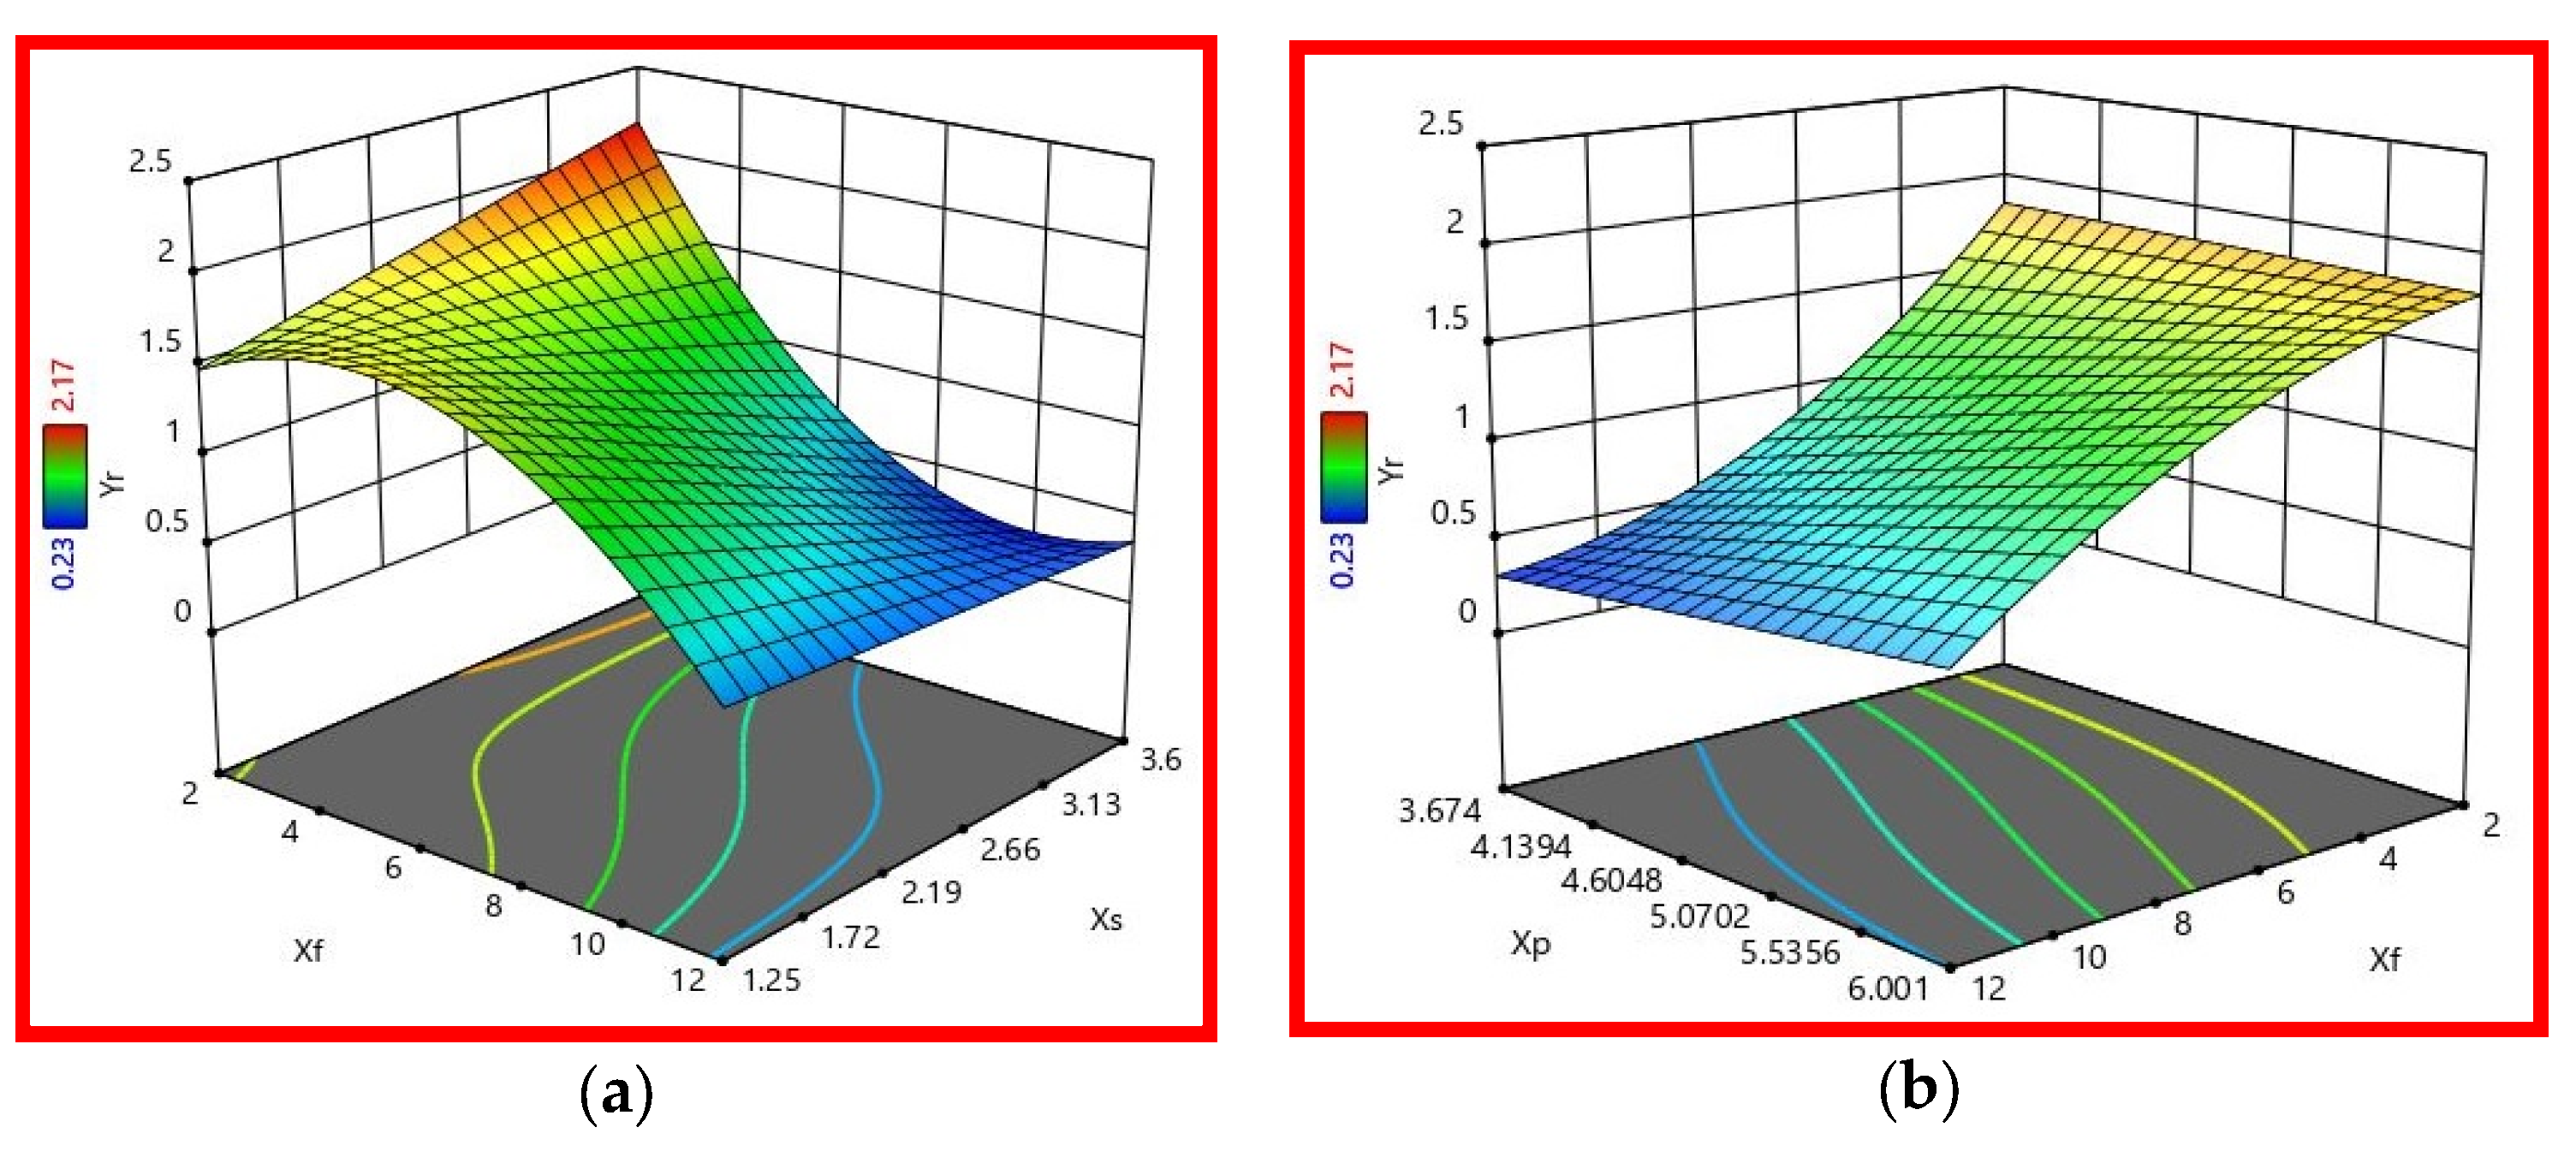
3.1.2. Regression Model for Aspect Ratio (Yr)
3.2. 304 LS Stainless Steel Cast
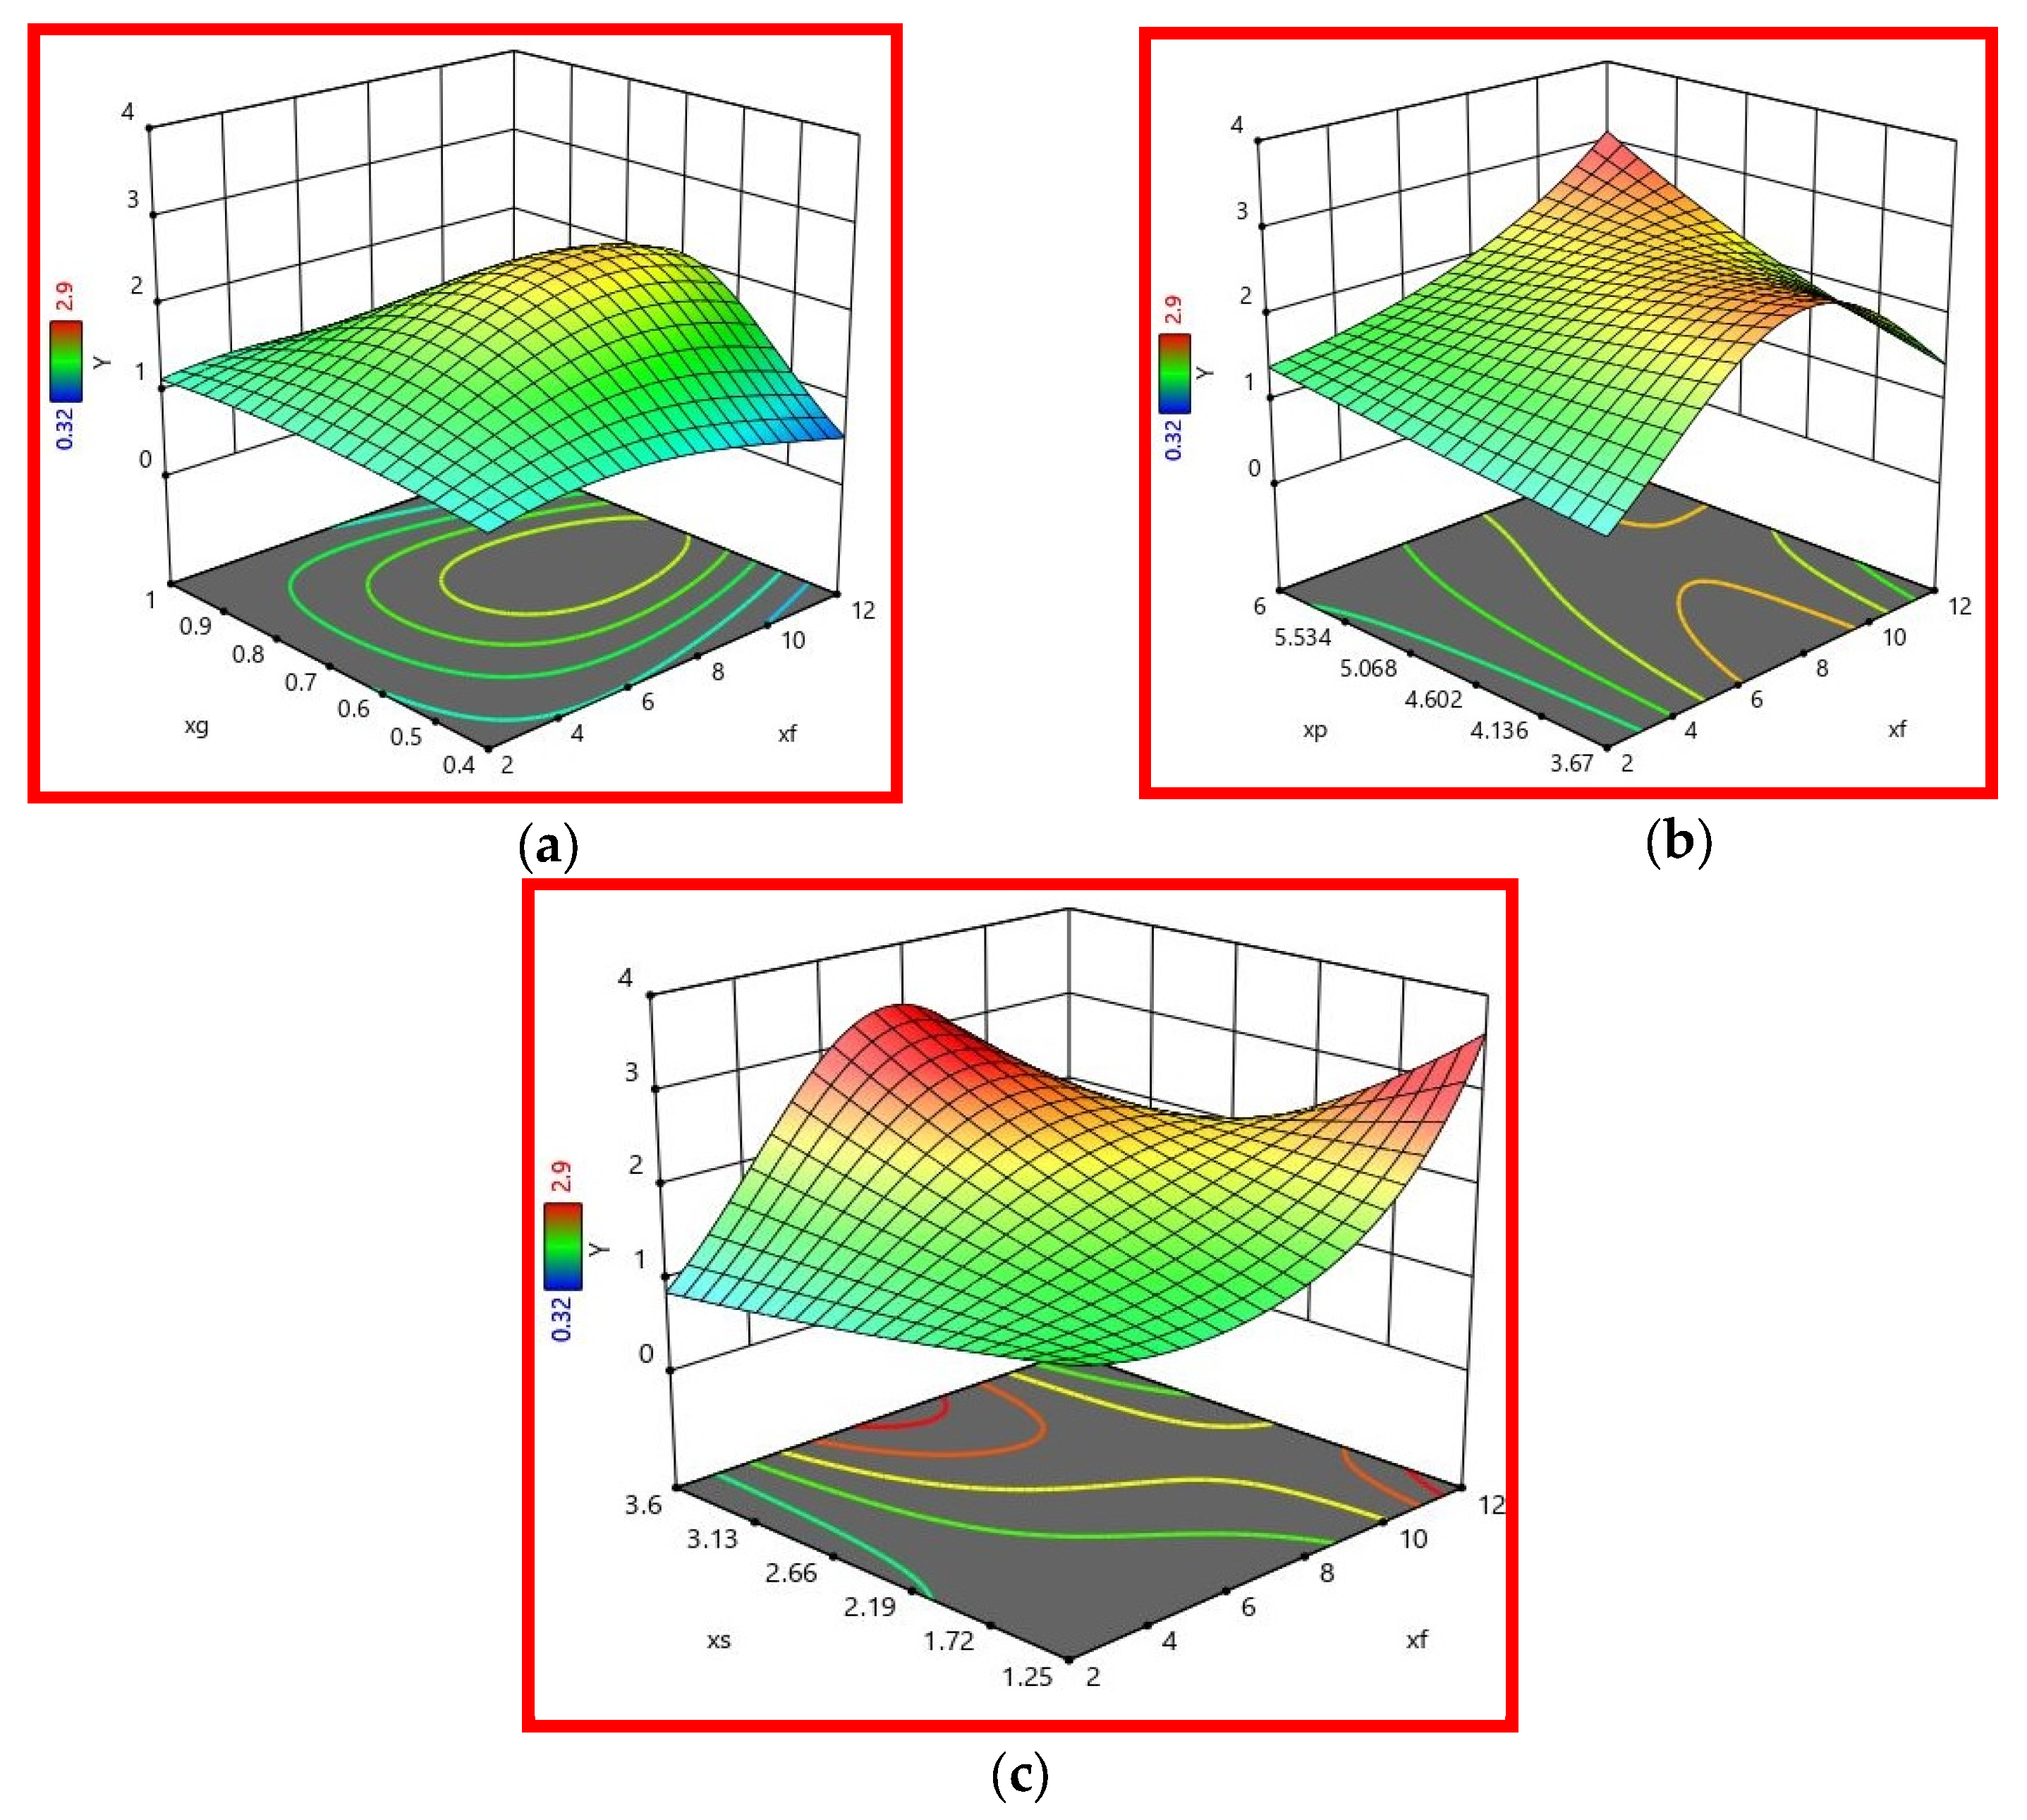
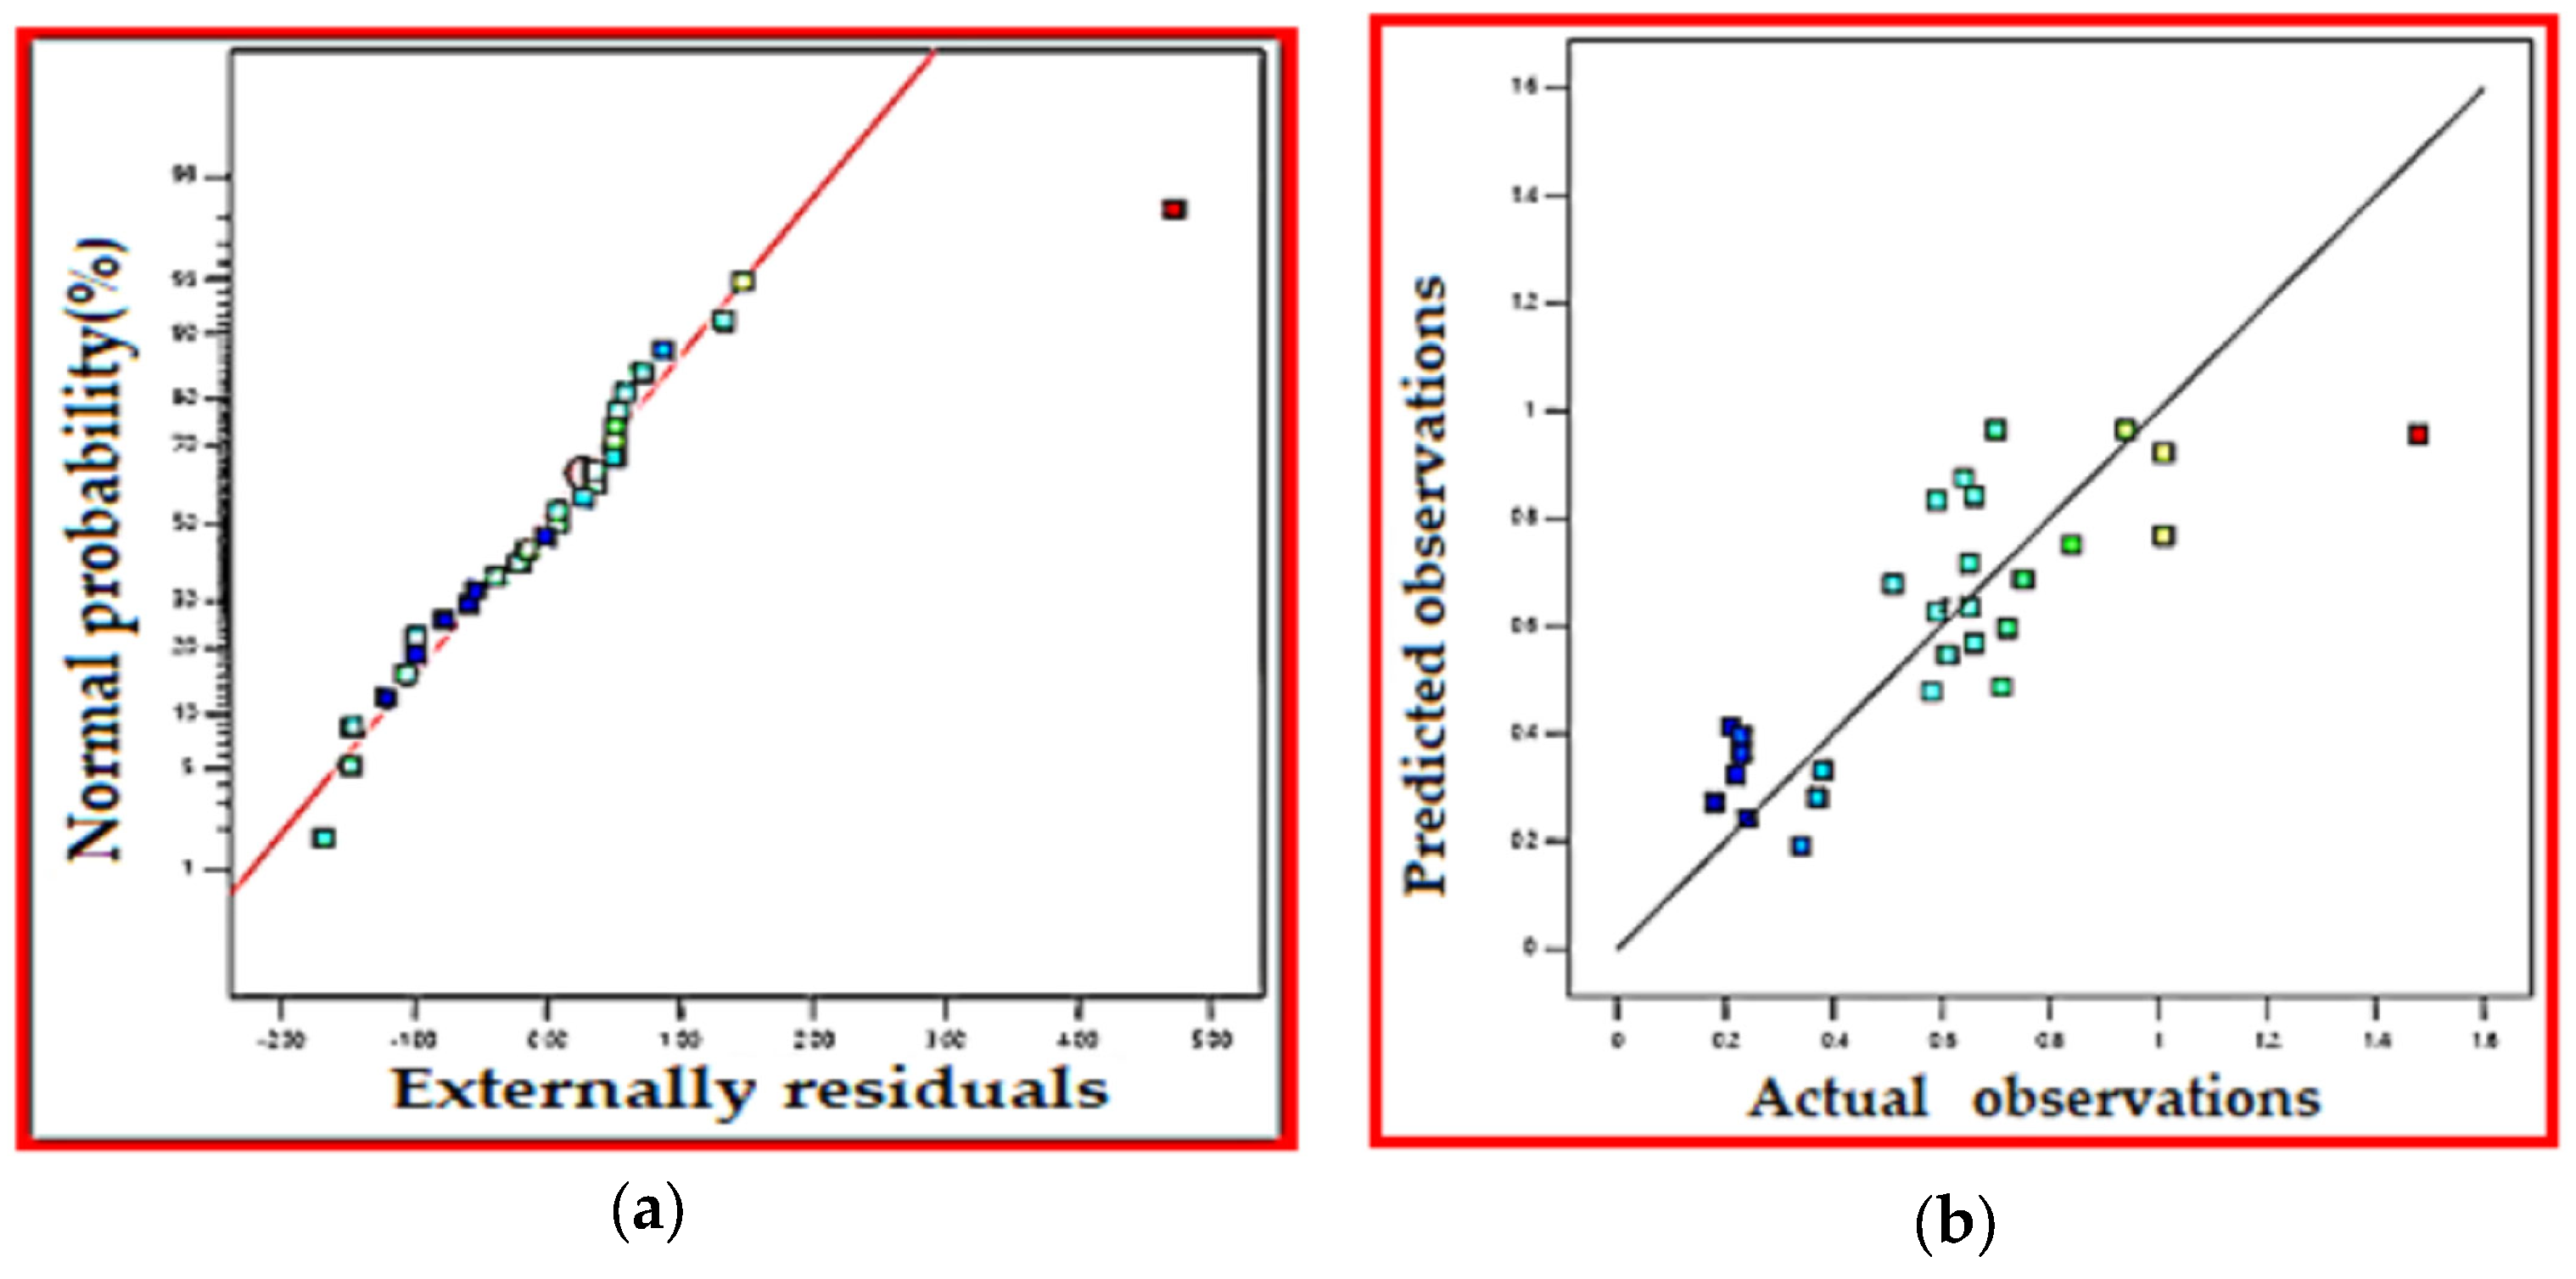
3.2.1. Regression Model for Weld Depth (Yd)
3.2.2. Regression Model for Aspect Ratio (Yr)
3.3. Contributions of Surface Active Elements to AISI 304 CO2 Laser Weld Morphology
4. Conclusions
- For 304 HS, the focus point (Xf) is the major factor in determining the depth of penetration of the laser weld, within a range of chosen welding parameters. The last input parameter is the main input factor, such that its contribution reaches 52.35% in determining the depth of the laser weld. The second parameter is welding speed (Xs); its linear effect contributes about 9.04% of the data variance. The third factor is the Xp, which represents a percentage of 5.66%;
- For 304 LS, the depth of the laser weld is primarily determined by the focus point, with a contribution of up to 6.78% (far greater than the other input factors if we consider only the effects of singular input factors individually). However, the interaction between shield gas and focus point distance from workpiece seems to play an important role, with a contribution of up to 28%;
- The role of the shield gas in protecting the weld pool is also linked to the level of energy supplied. Thus, at a high energy level, helium as well as mixed gas (70% He + 30% Ar) produces weld beads larger than those produced with the shield gas mixture (40% He + 60% Ar). This is attributed to the fact that helium is characterized by a high ionization potential, protecting the weld pool more effectively by expelling the plasma and ensuring less heat loss transfer. On the other hand, under a gas mixture with 60% argon, at a high linear energy, there is a risk of argon ionization causing the formation of plasma;
- A statistical study shows that a partially penetrated weld rate of 56% supports the hypothesis of the role of surface active elements in the formation of the weld pool. In contrast, in the case of full penetration welds, a rate of only 36% confirms the surface active effects of sulfur. Based on all these results, we can conclude that the laser weld morphology depends on the surface active effects of sulfur only if the chosen weld parameters result in partially penetrated welds. The surface active role of sulfur is reduced, if not eliminated, owing to melt evaporation, plasma formation, keyhole instability, the aerodynamic currents of the shield gas, and the interaction between the laser beam and the plasma. The above phenomena are more pronounced when the chosen welding parameters lead to fully penetrated welds;
- The results obtained from this work constitute an interesting database for research dedicated to the numerical simulation of thermal profiles in order to validate mathematical models. The thermal profile and solidification mode can be used to predict the microstructural and mechanical properties. On the other hand, these results may be of great use in industrial applications relating to the laser welding of thin austenitic stainless steel sheets.
Author Contributions
Funding
Data Availability Statement
Conflicts of Interest
References
- Biswas, A.R.; Banerjee, N.; Sen, A.; Maity, S.R. Applications of laser beam welding in automotive sector—A Review. In Advances in Additive Manufacturing and Metal Joining; Springer: Berlin/Heidelberg, Germany, 2023; pp. 43–57. [Google Scholar]
- Narayana, R.B.; Hema, P.; Padmanabhan, G. Experimental investigation on similar and dissimilar alloys of stainless steel joints by laser beam welding. Adv. Mater. Process. Technol. 2022, 8, 13–28. [Google Scholar]
- Hollatz, S.; Hummel, M.; Jaklen, L.; Lipnicki, W.; Olowinsky, A.; Gillner, A. Processing of keyhole depth measurement data during laser beam micro welding. J. Mater. Des. Appl. 2020, 234, 722–731. [Google Scholar] [CrossRef]
- Olson, D.L.; Siewert, T.A.; Liu, S.; Edwards, G.R. (Eds.) ASM Handbook, Volume 6: Welding, Brazing, Soldering; ASM International: Materials Park, OH, USA, 2014. [Google Scholar]
- Kurc-Lisiecka, A.; Kciuk, M. The influence of chemical composition on structure and mechanical properties of austenitic Cr-Ni steels. J. Achiev. Mater. Manuf. Eng. 2013, 61, 210–215. [Google Scholar]
- Dong, X.; Wang, G.; Ghaderi, M. Experimental investigation of the effect of laser parameters on the weld bead shape and temperature distribution during dissimilar laser welding of stainless steel 308 and carbon steel St 37. Infrared Phys. Technol. 2021, 116, 103774. [Google Scholar] [CrossRef]
- Sampreeta, K.R.; Vasareddy, M.; Deepan, B.K.T. Optimization of process parameters in CO2 laser welding of Hastelloy C-276. Mater. Today Proc. 2020, 22, 1572–1581. [Google Scholar] [CrossRef]
- Sathiya, P.; Abdul Jaleel, M.Y.; Katherasan, D. Optimization of welding parameters for laser bead-on-plate welding using Taguchi method. Prod. Eng. 2010, 4, 465–476. [Google Scholar] [CrossRef]
- Anawa, E.; Olabi, A.; Hashmi, M. Optimization of ferritic/austenitic laser welded components. In Proceedings of the AMPT2006 International Conference, Las Vegas, NV, USA, 30 July–3 August 2006. [Google Scholar]
- Benyounis, K.Y.; Olabi, A.G.; Hashmi, M.S.J. Optimization the laser-welded butt joints of medium carbon steel using RSM. J. Mater. Process. Technol. 2005, 164-165, 986–989. [Google Scholar] [CrossRef] [Green Version]
- Indacochea, J.E.; Olson, D.L. Relationship of Weld Metal Microstructure and Penetration to Weld Metal Oxygen Content. J. Mater. Energy Syst. 1983, 5, 139–148. [Google Scholar] [CrossRef]
- Klapczynski, V.; Le Maux, D.; Courtois, M.; Bertrand, E.; Paillard, P. Surface tension measurements of liquid pure iron and 304L stainless steel under different gas mixtures. J. Mol. Liq. 2022, 350, 118558. [Google Scholar] [CrossRef]
- Heiple, C.R.; Burgardt, P. Effect of SO2 Shielding Gas Additions on GTA Weld Shape Welding. Weld. J. 1985, 64, 159–162. [Google Scholar]
- Zhao, C.X.; Kwakernaak, C.; Pan, Y.; Richardson, I.M.; Saldi, Z.; Kenjeres, S.; Kleijn, R. The effect of oxygen on transitional Marangoni flow in laser spot welding. Acta Mater. 2010, 5, 6345–6357. [Google Scholar] [CrossRef]
- Wenchao, K.; Zhi, Z.; Oliveira, J.P.; Bei, P.; Jiajia, S.; Caiwang, T.; Xiaoguo, S.; Wentao, Y. Heat transfer and melt flow of keyhole, transition and conduction modes in laser beam oscillating welding. Int. J. Heat Mass Transf. 2023, 203, 123821. [Google Scholar]
- Coviello, D.; D’Angola, A.; Sorgente, D. Numerical Study on the Influence of the Plasma Properties on the Keyhole Geometry in Laser Beam Welding. Front. Phys. 2022, 9, 754672. [Google Scholar] [CrossRef]
- Hou, Y.C.; Lu, W.; Wentao, Y. Influence of oxygen content on melt pool dynamics in metal additive manufacturing: High-fidelity modeling with experimental validation. Acta Mater. 2023, 249, 118824. [Google Scholar]
- Heiple, C.R.; Roper, J.R.; Stagner, R.T.; Aden, R.J. Surface Active Element Effects on the Shape of GTA, Laser, and Electron Beam Welds. Weld. J. 1983, 62, 72–77. [Google Scholar]
- Kaul, R.; Ganesh, P.; Singh, N.; Jagadeesh, R.; Bhagat, M.S.; Kumar, H.; Tiwari, P.; Vora, H.S.; Nath, A.K. Effect of active flux addition on laser welding of austenitic stainless steel. Sci. Technol. Weld. Join. 2007, 12, 127–137. [Google Scholar] [CrossRef]
- Ding, F.; Ruihua, Z.; Nakata, K.; Tanaka, M.; Ushio, M. YAG laser welding with surface activating flux. China Weld. 2003, 12, 83–86. [Google Scholar]
- Su, Y.; Aarts, R.G.K.M.; Meijer, J.; Guan, Q. Study on effect of active-fluxes in laser welding. In Proceedings of the International Congress of Applications of Lasers & Electro-Optics, Dearborn, MI, USA, 2–5 October 2000; Laser Institute of America: Orlando, FL, USA, 2000; pp. 35–41. [Google Scholar]
- Kou, S. Welding Metallurgy; John Wiley & Sons: Toronto, ON, Canada, 1987; Volume 431, pp. 223–225. [Google Scholar]
- Shahab, A. Contribution a L’etude de la Metallurgie du Soudage de L’inconel 625 et Des Aciers Inoxydables 304 et 316. Ph.D. Thesis, University of Nantes, Nantes, France, 1990. [Google Scholar]
- Novák, V.; Řeháčková, L.; Váňová, P.; Sniego, M.; Matýsek, D.; Konecná, K.; Smetana, B.; Rosypalová, S.; Tkadlecková, M.; Drozdová, L.; et al. The Effect of Trace Oxygen Addition on the Interface Behavior of Low-Alloy Steel. Materials 2022, 15, 1592. [Google Scholar] [CrossRef] [PubMed]
- Kamel, T.; Abdelil, C.H.; Rachid, D.; Abousoufiane, O.; Abdallah, B.; Albaijan, I.; Hany, S.A.; Mohamed, M.Z.A. Mechanical, Microstructure, and Corrosion Characterization of Dissimilar Austenitic 316L and Duplex 2205 Stainless-Steel, ATIG Welded Joints. Materials 2022, 15, 2470. [Google Scholar]
- Besnea, D.; Dontu, O.; Gheorghe, G.I.; Ciobanu, R.; Cuta, A. Laser micro welding of mechatronics components, Romanian Review Precision Mechanics. Opt. Mechatron. 2014, 46, 7–10. [Google Scholar]
- Narayana Reddy, B.; Hema, P.; Padmanabhan, G. Influence of CO2 Laser Beam Welding Process Parameters on Mechanical Properties of Alloy AISI 4130 Steel Welded Joints. In Recent Advances in Material Sciences; Lecture Notes on Multidisciplinary Industrial Engineering; Springer: Singapore, 2019; pp. 65–76. [Google Scholar]


| Elements | C | Mn | Si | P | S | Cr | Ni | Fe |
|---|---|---|---|---|---|---|---|---|
| 304HS SS | 0.06 | 0.86 | 0.41 | 0.024 | 0.008 | 18.29 | 8.40 | Balance |
| 304LS SS | 0.06 | 1.06 | 0.57 | 0.032 | 0.003 | 18.29 | 8.45 | Balance |
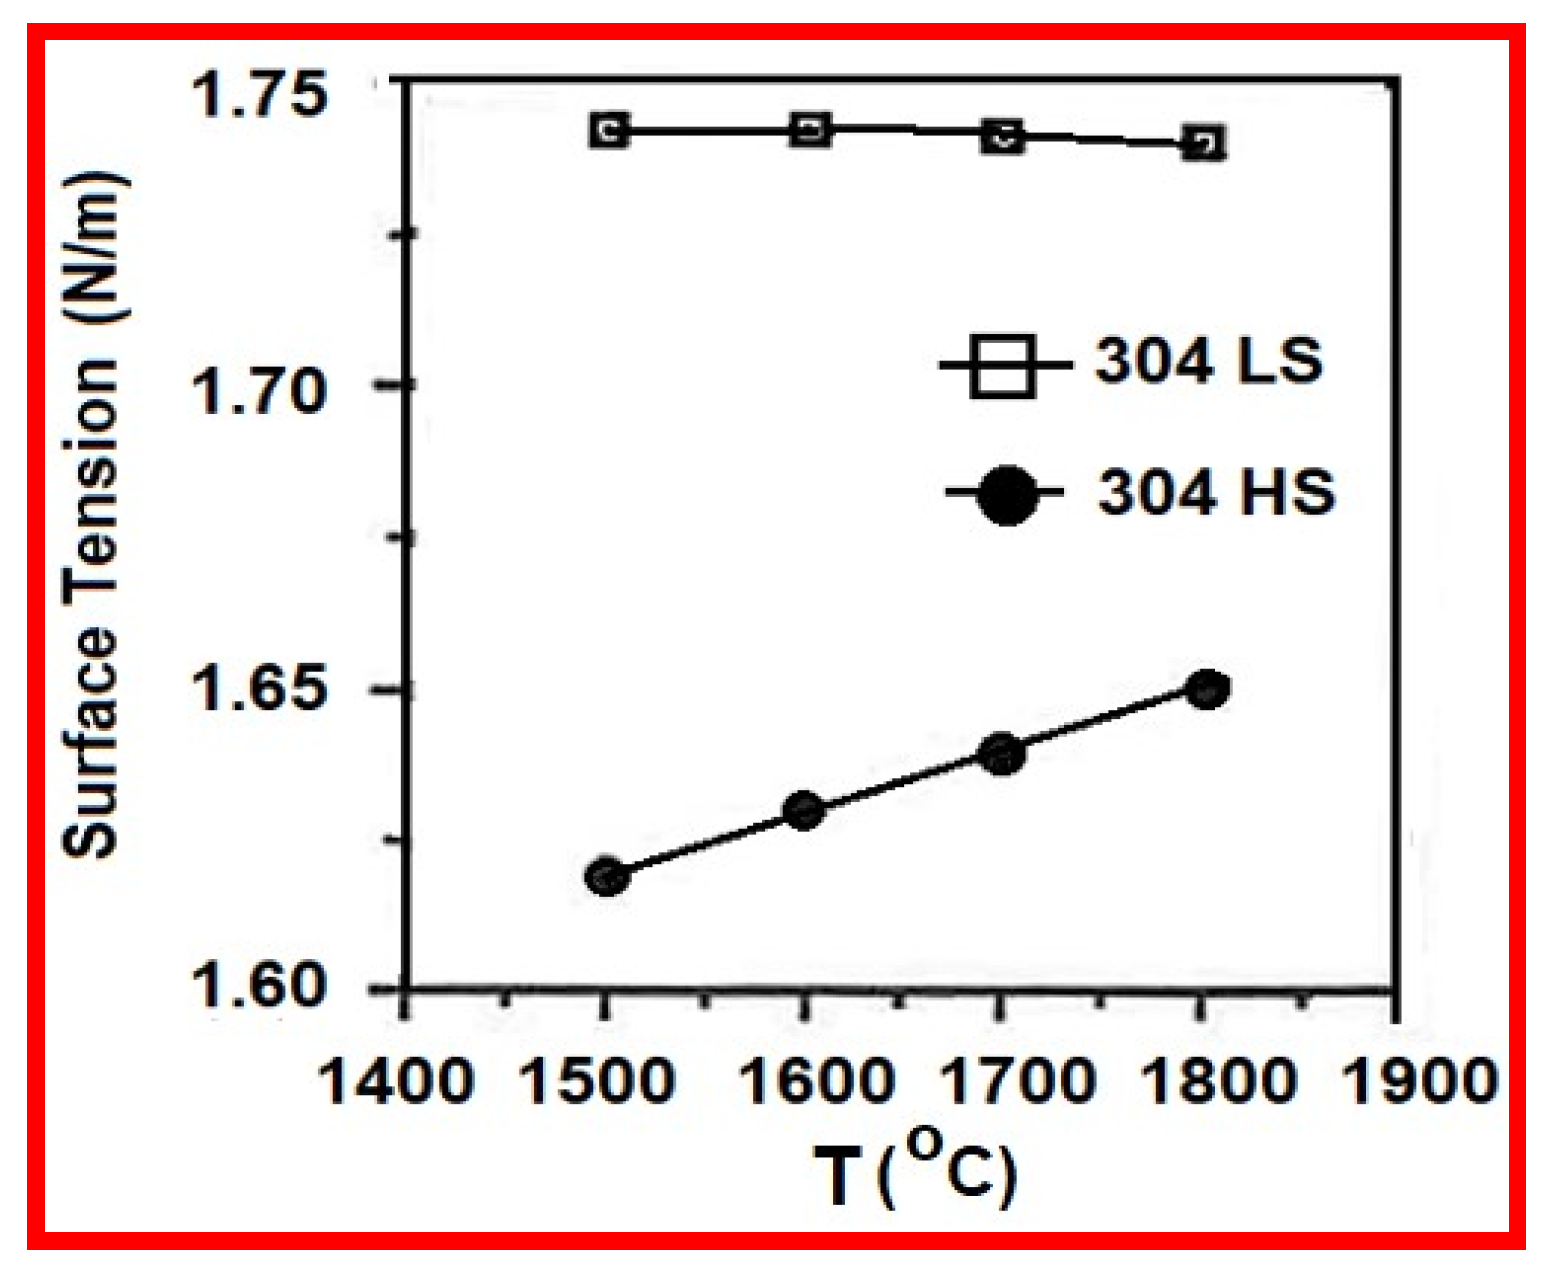
| Elements | γ (N/m) at Melting Temperature | dγ/dT (N/m °K) | Sulfur Content (%) |
|---|---|---|---|
| 304HS SS | 1.62 | +8 × 10⁻⁵ | 0.008 |
| 304LS SS | 1.74 | −10−5 | 0.003 |
| Laser Welding Gas | Molecular Weight (g/mol) | Thermal Conductivity at 1 bar, 15 °C (W/m·K) | Ionization Energy (ev) | Dissociation Energy (ev) | Density Relative to Air |
|---|---|---|---|---|---|
| Helium | 4 | 0.15363 | 24.6 | 0 | 0.14 |
| Argon | 40 | 0.01732 | 15.8 | 0 | 1.38 |
| Runs | Focus Point Position (mm) | Welding Speed (m/min) | Power (kW) | Linear Energy (J/cm) | Shield Gas |
|---|---|---|---|---|---|
| 1 | 2.00 | 1.25 | 3.75 | 180 | 1 (70% He + 30% Ar) |
| 2 | 2.00 | 2.45 | 3.67 | 90 | 1 (70% He + 30% Ar) |
| 3 | 2.00 | 2.40 | 6.00 | 150 | 1 (70% He + 30% Ar) |
| 4 | 2.00 | 3.60 | 6.00 | 100 | 1 (70% He + 30% Ar) |
| 5 | 7.00 | 1.25 | 3.75 | 180 | 1 (70% He + 30% Ar) |
| 6 | 7.00 | 2.40 | 6.00 | 150 | 1 (70% He + 30% Ar) |
| 7 | 2.00 | 1.25 | 3.75 | 180 | 2 (100% He) |
| 8 | 2.00 | 2.45 | 3.67 | 90 | 2 (100% He) |
| 9 | 2.00 | 2.40 | 6.00 | 150 | 2 (100% He) |
| 10 | 2.00 | 3.60 | 6.00 | 100 | 2 (100% He) |
| 11 | 2.00 | 1.25 | 3.75 | 180 | 3 (40% He + 60% Ar) |
| 12 | 2.00 | 2.45 | 3.67 | 90 | 3 (40% He + 60% Ar) |
| 13 | 2.00 | 3.60 | 6.00 | 100 | 3 (40% He + 60% Ar) |
| 14 | 2.00 | 2.40 | 6.00 | 150 | 3 (40% He + 60% Ar) |
| 15 | 12.00 | 1.25 | 3.75 | 180 | 2 (100% He) |
| 16 | 12.00 | 2.45 | 3.67 | 90 | 2 (100% He) |
| 17 | 12.00 | 2.40 | 6.00 | 150 | 2 (100% He) |
| 18 | 12.00 | 3.60 | 6.00 | 100 | 2 (100% He) |
| 19 | 7.00 | 2.40 | 6.00 | 150 | 3 (40% He + 60% Ar) |
| 20 | 7.00 | 2.40 | 6.00 | 150 | 2 (100% He) |
| 21 | 12.00 | 1.25 | 3.75 | 180 | 3 (40% He + 60% Ar) |
| 22 | 12.00 | 2.45 | 3.67 | 90 | 3 (40% He + 60% Ar) |
| 23 | 12.00 | 2.40 | 6.00 | 150 | 3 (40% He + 60% Ar) |
| 24 | 12.00 | 3.60 | 6.00 | 100 | 3 (40% He + 60% Ar) |
| 25 | 7.00 | 2.45 | 3.67 | 90 | 1 (70% He + 30% Ar) |
| 26 | 7.00 | 2.40 | 6.00 | 150 | 1 (70% He + 30% Ar) |
| 27 | 12.00 | 1.25 | 3.75 | 180 | 1 (70% He + 30% Ar) |
| 28 | 12.00 | 2.45 | 3.67 | 90 | 1 (70% He + 30% Ar) |
| 29 | 12.00 | 2.40 | 6.00 | 150 | 1 (70% He + 30% Ar) |
| 30 | 12.00 | 3.60 | 6.00 | 100 | 1 (70% He + 30% Ar) |
| Runs | Investigated Factors | Response Variables | ||||
|---|---|---|---|---|---|---|
| Xf (Focus Point) (mm) | Xs (Weld Speed) (m/min) | Xp (Power) (kW) | Xg (Shield Gas Type) | Yd Depth (mm) | Yr R (D/W) | |
| 1 | 2 | 1.25 | 3.75 | 1 (70% He + 30% Ar) | 3 | 1.6 |
| 2 | 2 | 2.45 | 3.674 | 1 (70% He + 30% Ar) | 3 | 1.8 |
| 3 | 2 | 2.4 | 6 | 1 (70% He + 30% Ar) | 3 | 1.42 |
| 4 | 2 | 3.6 | 6.001 | 1 (70% He + 30% Ar) | 3 | 1.75 |
| 5 | 7 | 1.25 | 3.75 | 1 (70% He + 30% Ar) | 3 | 1.17 |
| 6 | 7 | 2.4 | 6 | 1 (70% He + 30% Ar) | 3 | 1.36 |
| 7 | 2 | 1.25 | 3.75 | 2 (100% He) | 3 | 1.41 |
| 8 | 2 | 2.45 | 3.674 | 2 (100% He) | 3 | 2.1 |
| 9 | 2 | 2.4 | 6 | 2 (100% He) | 3 | 2.1 |
| 10 | 2 | 3.6 | 6.001 | 2 (100% He) | 3 | 2.14 |
| 11 | 2 | 1.25 | 3.75 | 3 (40% He + 60% Ar) | 3 | 1.14 |
| 12 | 2 | 2.45 | 3.674 | 3 (40% He + 60% Ar) | 3 | 1.71 |
| 13 | 2 | 2.4 | 6.00 | 3 (40% He + 60% Ar) | 3 | 1.76 |
| 14 | 2 | 3.6 | 6.001 | 3 (40% He + 60% Ar) | 3 | 2.17 |
| 15 | 12 | 1.25 | 3.75 | 2 (100% He) | 0.6 | 0.29 |
| 16 | 12 | 2.45 | 3.674 | 2 (100% He) | 0.41 | 0.26 |
| 17 | 12 | 2.4 | 6.00 | 2 (100% He) | 1.40 | 0.77 |
| 18 | 12 | 3.6 | 6.001 | 2 (100% He) | 0.55 | 0.31 |
| 19 | 7 | 2.4 | 6.00 | 3 (40% He + 60% Ar) | 2.01 | 0.82 |
| 20 | 7 | 2.4 | 6.00 | 2 (100% He) | 1.92 | 0.71 |
| 21 | 12 | 1.25 | 3.75 | 3 (40% He + 60% Ar) | 0.7 | 0.39 |
| 22 | 12 | 2.45 | 3.674 | 3 (40% He + 60% Ar) | 0.4 | 0.28 |
| 23 | 12 | 2.4 | 6.00 | 3 (40% He + 60% Ar) | 0.79 | 0.47 |
| 24 | 12 | 3.6 | 6.001 | 3 (40% He + 60% Ar) | 0.41 | 0.23 |
| 25 | 7 | 2.45 | 3.674 | 1 (70% He + 30% Ar) | 1.64 | 0.77 |
| 26 | 7 | 3.6 | 6.001 | 1 (70% He + 30% Ar) | 1.96 | 0.73 |
| 27 | 12 | 1.25 | 3.75 | 1 (70% He + 30% Ar) | 0.5 | 0.25 |
| 28 | 12 | 2.45 | 3.674 | 1 (70% He + 30% Ar) | 0.48 | 0.31 |
| 29 | 12 | 2.4 | 6.00 | 1 (70% He + 30% Ar) | 1.77 | 0.61 |
| 30 | 12 | 3.6 | 6.001 | 1 (70% He + 30% Ar) | 1.91 | 1.08 |
| Source | Sum of Squares | DF | Mean Square | F-Value | p-Value | Contribution (%) |
|---|---|---|---|---|---|---|
| Model | 34.37 | 14 | 2.46 | 73.46 | <0.0001 | |
| Xf | 8.34 | 1 | 8.34 | 249.44 | <0.0001 | 52.35 |
| Xs | 1.44 | 1 | 1.44 | 43.06 | <0.0001 | 9.04 |
| Xp | 0.901 | 1 | 0.901 | 26.96 | 0.0002 | 5.66 |
| Xg | 0.0181 | 1 | 0.0181 | 0.5414 | 0.4749 | 0.11 |
| Xf Xs | 0.2058 | 1 | 0.2058 | 6.16 | 0.0275 | 1.29 |
| Xf Xp | 0.5393 | 1 | 0.5393 | 16.14 | 0.0015 | 3.39 |
| Xf Xg | 0.0189 | 1 | 0.0189 | 0.5658 | 0.4654 | 0.12 |
| Xp Xg | 0.0329 | 1 | 0.0329 | 0.9857 | 0.3389 | 0.21 |
| Xf2 | 0.4529 | 1 | 0.4529 | 13.55 | 0.0028 | 2.84 |
| Xg2 | 0.1326 | 1 | 0.1326 | 3.97 | 0.0678 | 0.83 |
| Xf2 Xs | 0.8819 | 1 | 0.8819 | 26.39 | 0.0002 | 5.54 |
| Xf2 Xp | 0.1676 | 1 | 0.1676 | 5.02 | 0.0432 | 1.05 |
| Xf Xg2 | 0.1376 | 1 | 0.1376 | 4.12 | 0.0634 | 0.86 |
| Xp Xg2 | 0.1697 | 1 | 0.1697 | 5.08 | 0.0421 | 1.07 |
| Residual | 0.4344 | 13 | 0.0334 | |||
| Cor Total | 34.8 | 27 | 15.9317 |
| Source | Sum of Squares | DF | Mean Square | F-Value | p-Value | Contribution (%) |
|---|---|---|---|---|---|---|
| Model | 12.86 | 10 | 1.29 | 43.59 | <0.0001 | |
| Xf | 11.64 | 1 | 11.64 | 394.76 | <0.0001 | 79.76 |
| Xs | 0.3061 | 1 | 0.3061 | 10.38 | 0.005 | 2.10 |
| Xp | 0.2238 | 1 | 0.2238 | 7.59 | 0.0135 | 1.53 |
| Xg | 0.0977 | 1 | 0.0977 | 3.31 | 0.0865 | 0.67 |
| Xf Xs | 0.2875 | 1 | 0.2875 | 9.75 | 0.0062 | 1.97 |
| Xf Xp | 0.0738 | 1 | 0.0738 | 2.5 | 0.132 | 0.51 |
| Xs Xp | 0.0929 | 1 | 0.0929 | 3.15 | 0.0939 | 0.64 |
| Xf2 | 0.0085 | 1 | 0.0085 | 0.2886 | 0.5981 | 0.06 |
| Xf2 Xs | 0.41 | 1 | 0.41 | 13.9 | 0.0017 | 2.81 |
| Xf2 Xp | 0.134 | 1 | 0.134 | 4.54 | 0.0479 | 0.92 |
| Residual | 0.5014 | 17 | 0.0295 | |||
| Cor Total | 13.36 | 27 | 14.5938 |
| Runs | Investigated Factors | Response Variables | ||||
|---|---|---|---|---|---|---|
| Xf (Focus Point) (mm) | Xs (Weld Speed) (m/min) | Xp (Power kW) | Xg (Shield Gas Type) | Yd Depth (mm) | Yr R(D/W) | |
| 1 | 2 | 1.25 | 3.75 | 1 (70% He + 30% Ar) | 1.80 | 0.84 |
| 2 | 2 | 2.45 | 3.674 | 1 (70% He + 30% Ar) | 2.75 | 1.06 |
| 3 | 2 | 2.4 | 6 | 1 (70% He + 30% Ar) | 1.27 | 0.66 |
| 4 | 2 | 3.6 | 6.001 | 1 (70% He + 30% Ar) | 1.26 | 1.01 |
| 5 | 7 | 1.25 | 3.75 | 1 (70% He + 30% Ar) | 1.75 | 0.64 |
| 6 | 7 | 2.4 | 6 | 1 (70% He + 30% Ar) | 1.59 | 0.70 |
| 7 | 2 | 1.25 | 3.75 | 2(100% He) | 1.60 | 0.88 |
| 8 | 2 | 2.45 | 3.674 | 2(100% He) | 0.80 | 0.51 |
| 9 | 2 | 2.4 | 6 | 2(100% He) | 1.32 | 0.75 |
| 10 | 2 | 3.6 | 6.001 | 2(100% He) | 1.26 | 1.01 |
| 11 | 2 | 1.25 | 3.75 | 3(40% He + 60% Ar) | 1.07 | 0.61 |
| 12 | 2 | 2.45 | 3.674 | 3(40% He + 60% Ar) | 1.12 | 0.59 |
| 13 | 2 | 2.4 | 6.00 | 3(40% He + 60% Ar) | 0.82 | 0.65 |
| 14 | 2 | 3.6 | 6.001 | 3(40% He + 60% Ar) | 1.24 | 1.02 |
| 15 | 12 | 1.25 | 3.75 | 2(100% He) | 0.52 | 0.24 |
| 16 | 12 | 2.45 | 3.674 | 2(100% He) | 0.37 | 0.22 |
| 17 | 12 | 2.4 | 6 | 2(100% He) | 0.77 | 0.38 |
| 18 | 12 | 3.6 | 6.001 | 2(100% He) | 0.39 | 0.21 |
| 19 | 7 | 2.4 | 6.00 | 3(40% He + 60% Ar) | 1.24 | 0.65 |
| 20 | 7 | 2.4 | 6.00 | 2(100% He) | 0.69 | 0.34 |
| 21 | 12 | 1.25 | 3.75 | 3(40% He + 60% Ar) | 0.32 | 0.16 |
| 22 | 12 | 2.45 | 3.674 | 3(40% He + 60% Ar) | 0.90 | 0.37 |
| 23 | 12 | 2.4 | 6 | 3(40% He + 60% Ar) | 0.39 | 0.18 |
| 24 | 12 | 3.6 | 6.001 | 3(40% He + 60% Ar) | 2.62 | 1.48 |
| 25 | 7 | 2.45 | 3.674 | 1 (70% He + 30% Ar) | 2.65 | 1.20 |
| 26 | 7 | 3.6 | 6.001 | 1 (70% He + 30% Ar) | 1.86 | 0.66 |
| 27 | 12 | 1.25 | 3.75 | 1 (70% He + 30% Ar) | 1.53 | 0.58 |
| 28 | 12 | 2.45 | 3.674 | 1 (70% He + 30% Ar) | 1.5 | 1.07 |
| 29 | 12 | 2.4 | 6 | 1 (70% He + 30% Ar) | 1.76 | 0.66 |
| 30 | 12 | 3.6 | 6.001 | 1 (70% He + 30% Ar) | 1.80 | 0.70 |
| Source | Sum of Squares | DF | Mean Square | F-Value | p-Value | Contribution (%) |
|---|---|---|---|---|---|---|
| Model | 9.30 | 14 | 0.6640 | 21.51 | <0.0001 | |
| Xf | 0.5273 | 1 | 0.5273 | 17.08 | 0.0010 | 6.78 |
| Xs | 0.0772 | 1 | 0.0772 | 2.50 | 0.1360 | 0.99 |
| Xp | 0.0752 | 1 | 0.0752 | 2.44 | 0.1409 | 0.97 |
| Xg | 0.0030 | 1 | 0.0030 | 0.0971 | 0.7599 | 0.04 |
| Xf Xs | 0.0798 | 1 | 0.0798 | 2.58 | 0.1302 | 1.03 |
| Xf Xp | 0.1583 | 1 | 0.1583 | 5.13 | 0.0399 | 2.04 |
| Xf Xg | 0.0419 | 1 | 0.0419 | 1.36 | 0.2633 | 0.54 |
| Xs Xp | 0.0006 | 1 | 0.0006 | 0.0189 | 0.8925 | 0.01 |
| Xf2 | 0.2259 | 1 | 0.2259 | 7.32 | 0.0171 | 2.90 |
| Xg2 | 2.86 | 1 | 2.86 | 92.57 | <0.0001 | 36.77 |
| Xf Xs Xp | 0.1094 | 1 | 0.1094 | 3.54 | 0.0807 | 1.41 |
| Xf2 Xs | 0.3076 | 1 | 0.3076 | 9.97 | 0.0070 | 3.95 |
| Xf2 Xp | 0.4566 | 1 | 0.4566 | 14.79 | 0.0018 | 5.87 |
| Xf Xg2 | 2.16 | 1 | 2.16 | 69.84 | <0.0001 | 27.77 |
| Residual | 0.4321 | 14 | 0.0309 | |||
| Lack of Fit | 0.3837 | 12 | 0.0320 | 1.32 | 0.5094 | not significant |
| Pure Error | 0.0484 | 2 | 0.0242 | |||
| Cor Total | 9.73 | 28 |
| Source | Sum of Squares | df | Mean Square | F-Value | p-Value | Contribution (%) |
|---|---|---|---|---|---|---|
| Model | 1.58 | 6 | 0.2637 | 6.98 | 0.0003 | significant |
| Xf | 0.7805 | 1 | 0.7805 | 20.66 | 0.0002 | 49.83 |
| Xs | 0.0469 | 1 | 0.0469 | 1.24 | 0.277 | 2.99 |
| Xp | 0.0006 | 1 | 0.0006 | 0.0157 | 0.9015 | 0.04 |
| Xg | 0.0108 | 1 | 0.0108 | 0.287 | 0.5975 | 0.69 |
| Xf2 | 0.235 | 1 | 0.235 | 6.22 | 0.0206 | 15.00 |
| Xg2 | 0.1765 | 1 | 0.1765 | 4.67 | 0.0418 | 11.27 |
| Residual | 0.831 | 22 | 0.0378 | |||
| Lack of Fit | 0.8022 | 20 | 0.0401 | 2.79 | 0.2972 | not significant |
| Pure Error | 0.0288 | 2 | 0.0144 | |||
| Cor Total | 2.41 | 28 |
| Exp. # | Cast 304 HS | Cast 304 LS | Occurrences of the Mechanism Proposed by C.R Heiple et al. [18] | ||||
|---|---|---|---|---|---|---|---|
Inverse Marangoni Convection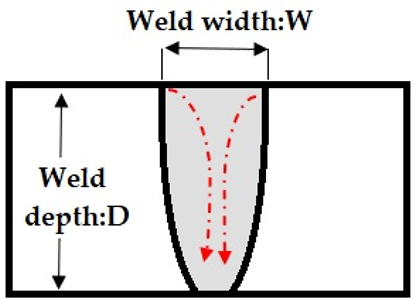 | Marangoni Convection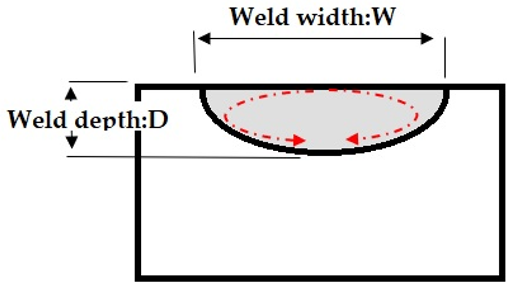 | ||||||
| Weld Depth (D) (mm) | Weld Width (W) (mm) | Full Weld Penetration (F.P)/Partial Penetration Weld (P.P) | Weld Depth (D) (mm) | Weld Width (W) (mm) | Full Weld Penetration (F.P)/Partial Penetration Weld (P.P) | ||
| 1 | 3 | 1.88 | F.P | 1.80 | 2.14 | P.P | Yes |
| 2 | 3 | 1.67 | F.P | 2.75 | 2.6 | P.P | Yes |
| 3 | 3 | 2.1 | F.P | 1.27 | 0.66 | P.P | No |
| 4 | 3 | 1.71 | F.P | 1.26 | 1.25 | P.P | No |
| 5 | 3 | 2.56 | F.P | 1.75 | 2.73 | P.P | Yes |
| 6 | 3 | 2.2 | F.P | 1.59 | 2.07 | P.P | No |
| 7 | 3 | 2.13 | F.P | 1.60 | 1.82 | P.P | No |
| 8 | 3 | 1.42 | F.P | 0.80 | 1.57 | P.P | Yes |
| 9 | 3 | 1.42 | F.P | 1.32 | 1.76 | P.P | Yes |
| 10 | 3 | 2.63 | F.P | 1.26 | 1.01 | P.P | No |
| 11 | 3 | 2.63 | F.P | 1.07 | 0.61 | P.P | No |
| 12 | 3 | 1.75 | F.P | 1.12 | 1.25 | P.P | No |
| 13 | 3 | 1.70 | F.P | 0.82 | 1.26 | P.P | No |
| 14 | 3 | 1.38 | F.P | 1.24 | 1.21 | P.P | No |
| 15 | 0.6 | 2.06 | P.P | 0.52 | 2.17 | P.P | Yes |
| 16 | 0.41 | 1.58 | P.P | 1.55 | 1.22 | P.P | No |
| 17 | 1.40 | 1.80 | P.P | 0.77 | 2.02 | P.P | Yes |
| 18 | 0.55 | 1.77 | P.P | 0.39 | 1.86 | P.P | Yes |
| 19 | 2.01 | 1.91 | P.P | 1.24 | 2.45 | P.P | Yes |
| 20 | 1.92 | 2.03 | P.P | 0.69 | 2.70 | P.P | Yes |
| 21 | 0.7 | 1.78 | P.P | 0.32 | 1.94 | P.P | Yes |
| 22 | 0.4 | 1.43 | P.P | 0.90 | 2.43 | P.P | No |
| 23 | 0.79 | 1.69 | P.P | 0.39 | 2.14 | P.P | Yes |
| 24 | 0.41 | 1.78 | P.P | 2.62 | 1.77 | P.P | No |
| 25 | 2.10 | 2.13 | P.P | 2.65 | 2.23 | P.P | No |
| 26 | 1.96 | 2.68 | P.P | 1.86 | 2.8 | P.P | Yes |
| 27 | 0.5 | 2 | P.P | 1.53 | 2.64 | P.P | No |
| 28 | 0.48 | 1.55 | P.P | 1.5 | 1.4 | P.P | No |
| 29 | 1.77 | 2.90 | P.P | 1.76 | 2.67 | P.P | No |
| 30 | 1.91 | 1.76 | P.P | 1.80 | 2.57 | P.P | Yes |
| Types of Weld Bead | Times Getting Partial Penetration Weld (PP) for Both Casts or Full Penetration Weld (FP) for 304 HS Cast Weld Bead out of 30 Tests | Occurrences of the Mechanism Proposed by C.R Heiple et al. [18] % | Non-Occurrences of the Mechanism Proposed by C.R Heiple et al. [18] % | Percentages of Occurrences of the Mechanism Proposed by C.R Heiple et al. [18] % |
|---|---|---|---|---|
| Partial penetration weld (PP) for both casts. | 16 | 9 | 7 | 56 |
| Full penetration weld (FP) for 304 HS and partial penetration weld (PP) for 304 LS cast weld. | 14 | 5 | 9 | 36 |
Disclaimer/Publisher’s Note: The statements, opinions and data contained in all publications are solely those of the individual author(s) and contributor(s) and not of MDPI and/or the editor(s). MDPI and/or the editor(s) disclaim responsibility for any injury to people or property resulting from any ideas, methods, instructions or products referred to in the content. |
© 2023 by the authors. Licensee MDPI, Basel, Switzerland. This article is an open access article distributed under the terms and conditions of the Creative Commons Attribution (CC BY) license (https://creativecommons.org/licenses/by/4.0/).
Share and Cite
Touileb, K.; Attia, E.; Djoudjou, R.; Hedhibi, A.C.; Benselama, A.; Ibrahim, A.; Ahmed, M.M.Z. Effect of Microchemistry Elements in Relation of Laser Welding Parameters on the Morphology 304 Stainless Steel Welds Using Response Surface Methodology. Crystals 2023, 13, 1138. https://doi.org/10.3390/cryst13071138
Touileb K, Attia E, Djoudjou R, Hedhibi AC, Benselama A, Ibrahim A, Ahmed MMZ. Effect of Microchemistry Elements in Relation of Laser Welding Parameters on the Morphology 304 Stainless Steel Welds Using Response Surface Methodology. Crystals. 2023; 13(7):1138. https://doi.org/10.3390/cryst13071138
Chicago/Turabian StyleTouileb, Kamel, Elawady Attia, Rachid Djoudjou, Abdejlil Chihaoui Hedhibi, Abdallah Benselama, Albaijan Ibrahim, and Mohamed M. Z. Ahmed. 2023. "Effect of Microchemistry Elements in Relation of Laser Welding Parameters on the Morphology 304 Stainless Steel Welds Using Response Surface Methodology" Crystals 13, no. 7: 1138. https://doi.org/10.3390/cryst13071138