


Particle Swarm Method for Optimization of ATIG Welding Process to Joint Mild Steel to 316L Stainless Steel

 , and
, and 
Abstract
:1. Introduction
2. Materials and Methods
2.1. Materials
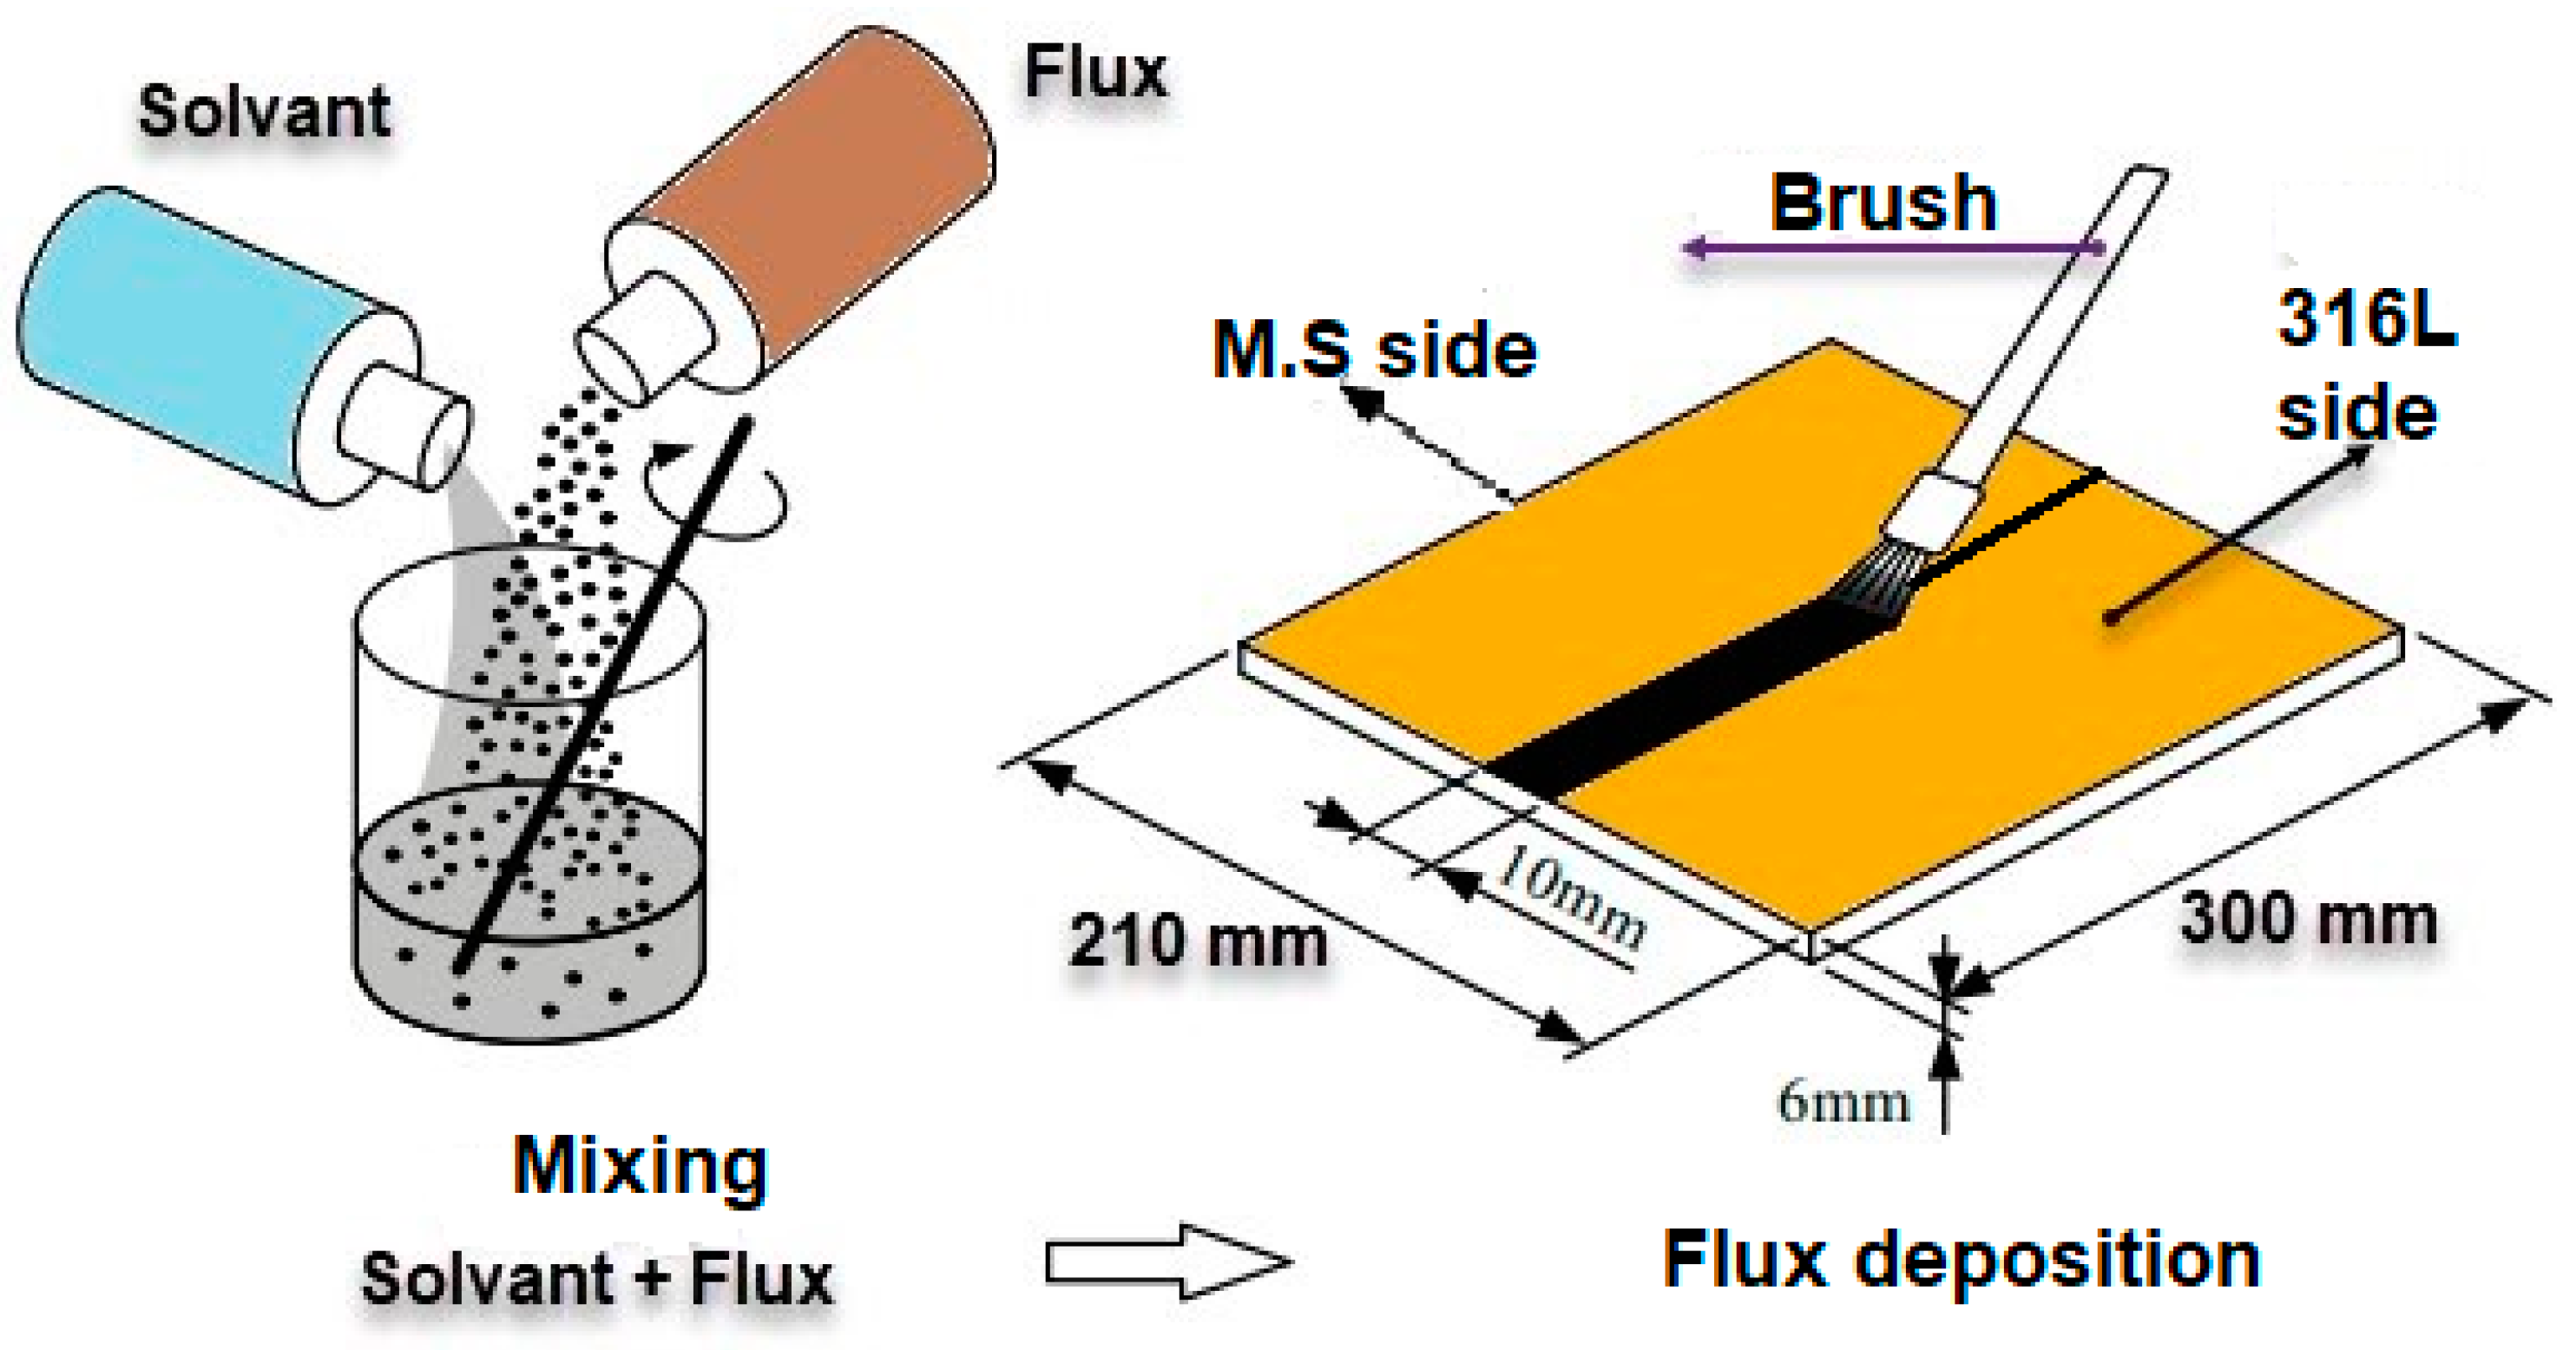
2.2. Welding Procedure
2.3. Design of the Experiment Methodology
3. Results and Discussions
3.1. Weld Bead Aspect
3.1.1. Selection of Appropriate Fluxes
3.1.2. Mathematical Modeling
3.1.3. First Step of the Modeling Process
- -
- The position;
- -
- A speed;
- -
- The best personal position;
- -
- The best common position.
3.1.4. Second-Step Modeling Process
3.1.5. Validation Test
3.2. SEM-EDS investigation
3.2.1. ATIG Weld
3.2.2. TIG Weld
3.3. Tensile Test
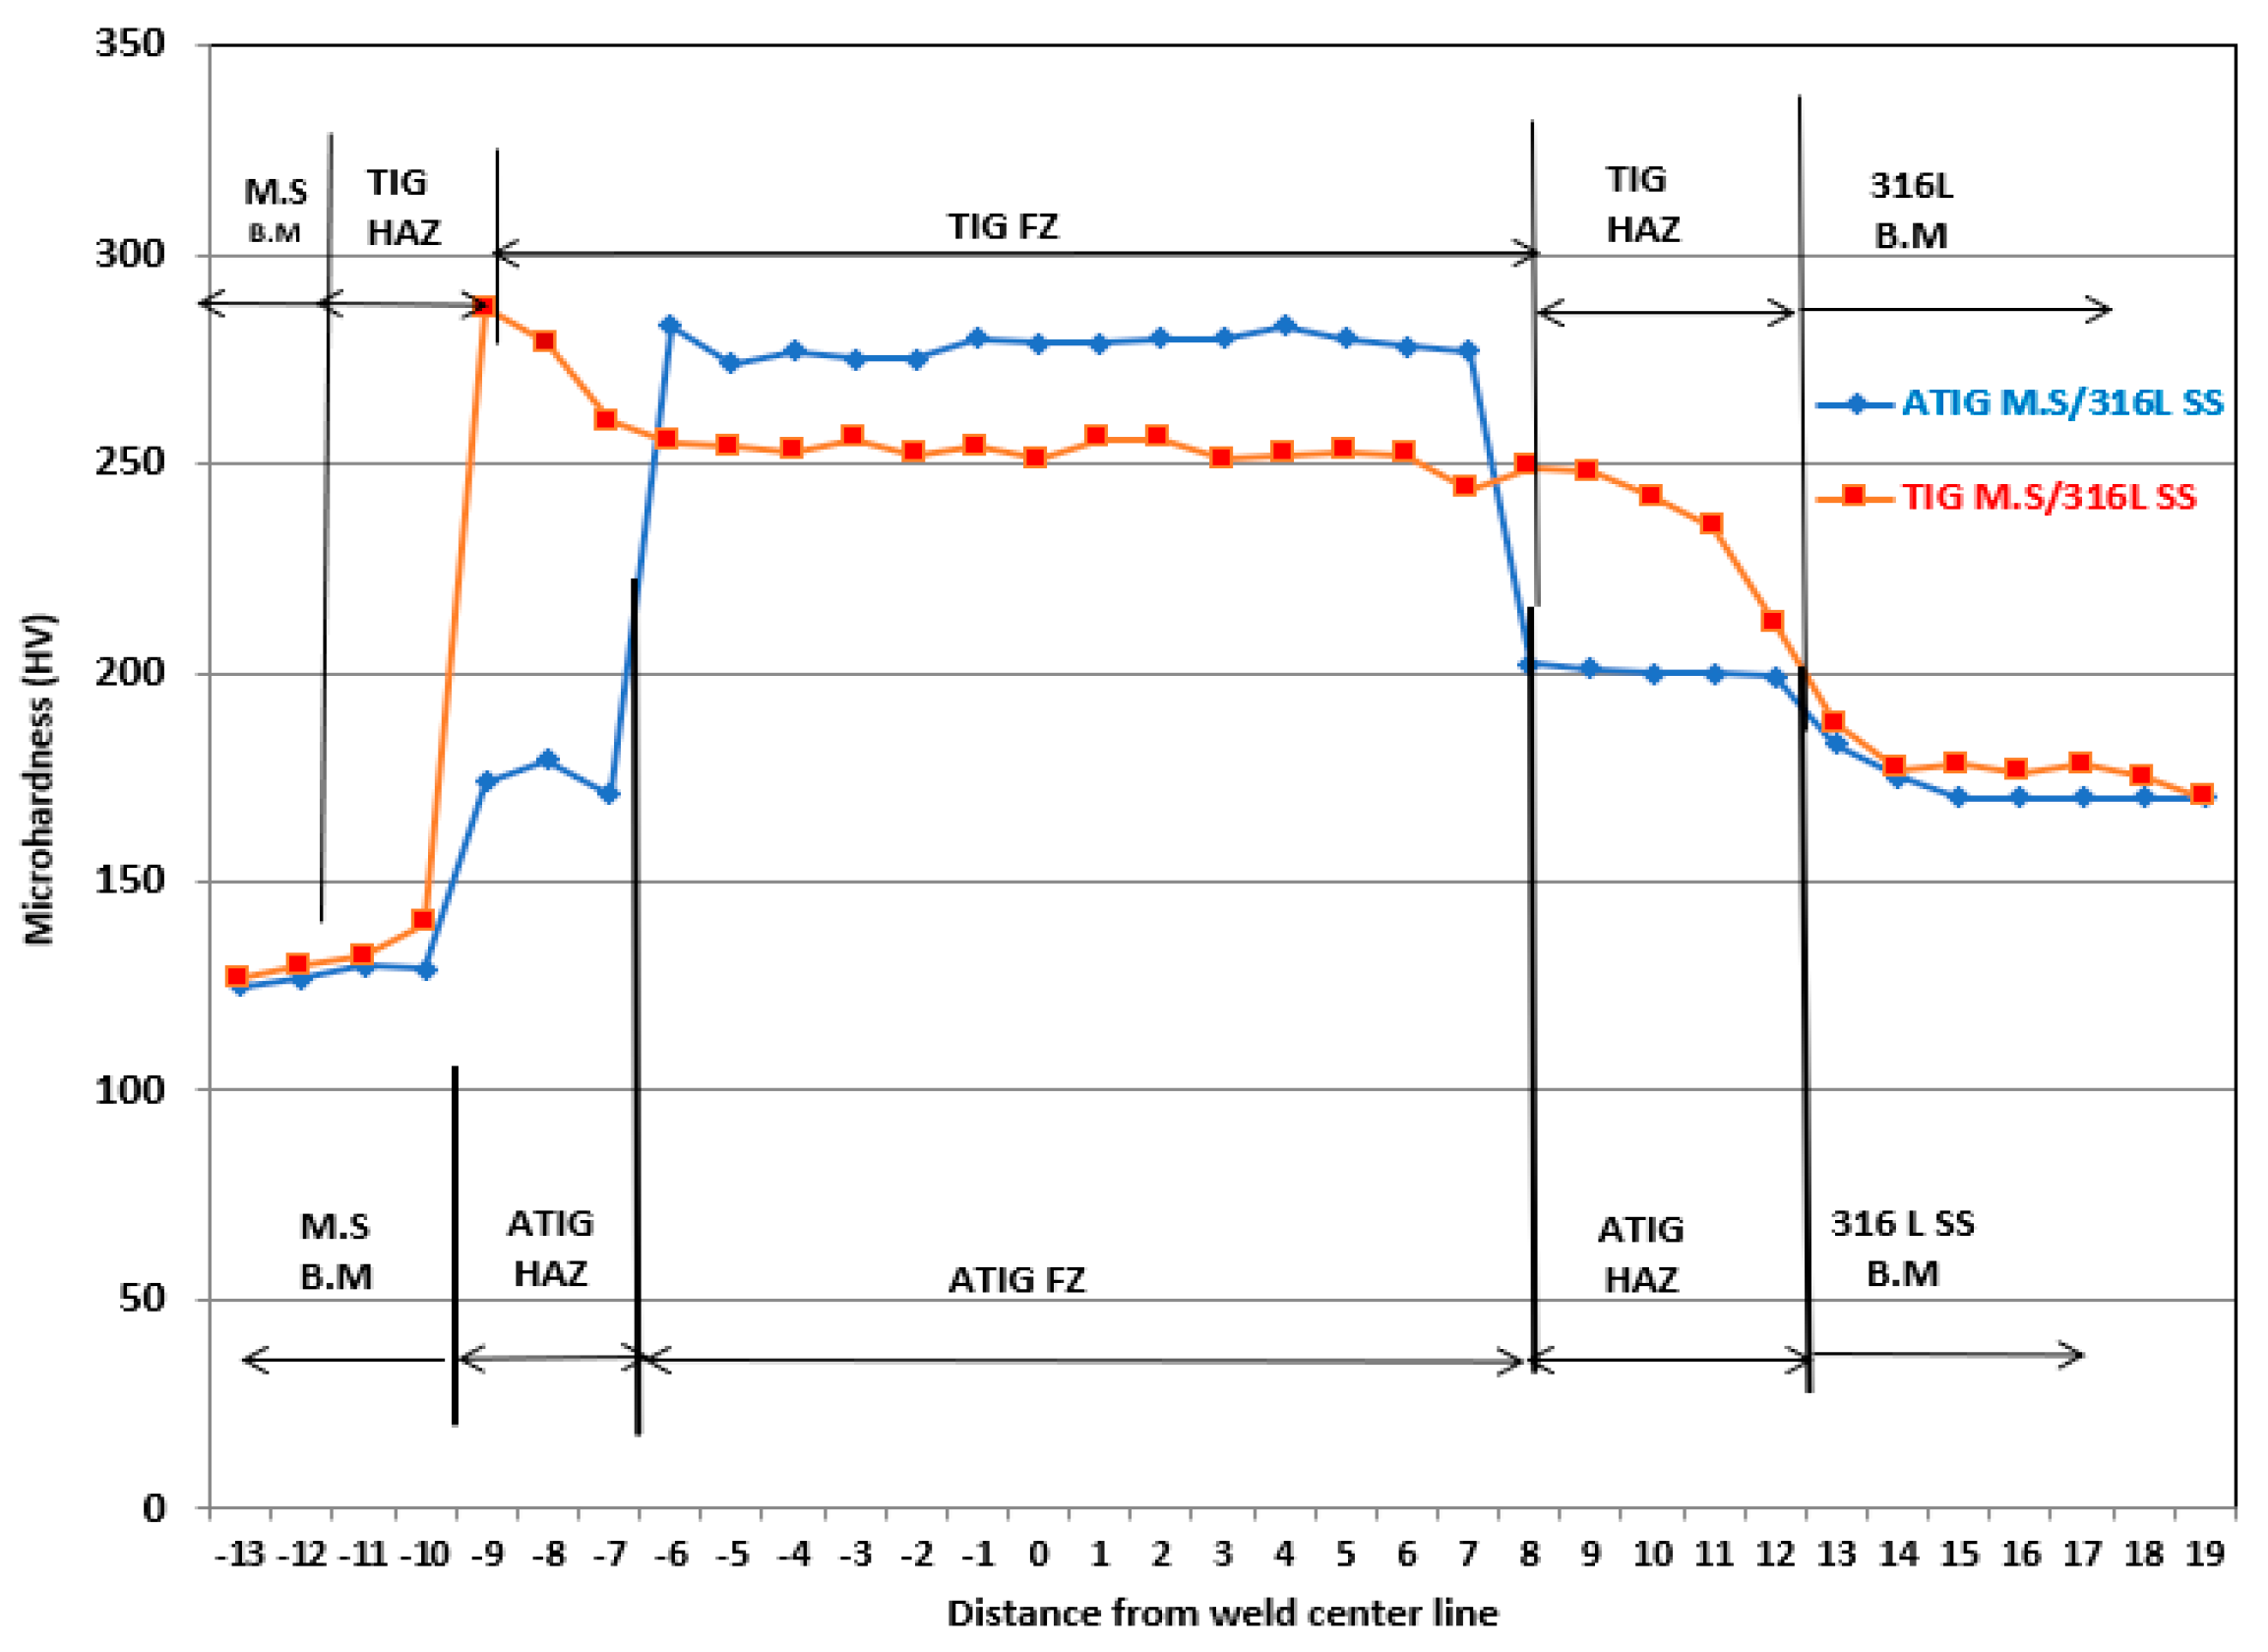
3.4. Hardness Test
3.5. Impact Test
4. Conclusions
- -
- The results of this investigation show that 316L can be joined with MS using a tri-component flux composed of 76.63% SiO2, 13.37% Cr2O3, and 10% NaF.
- -
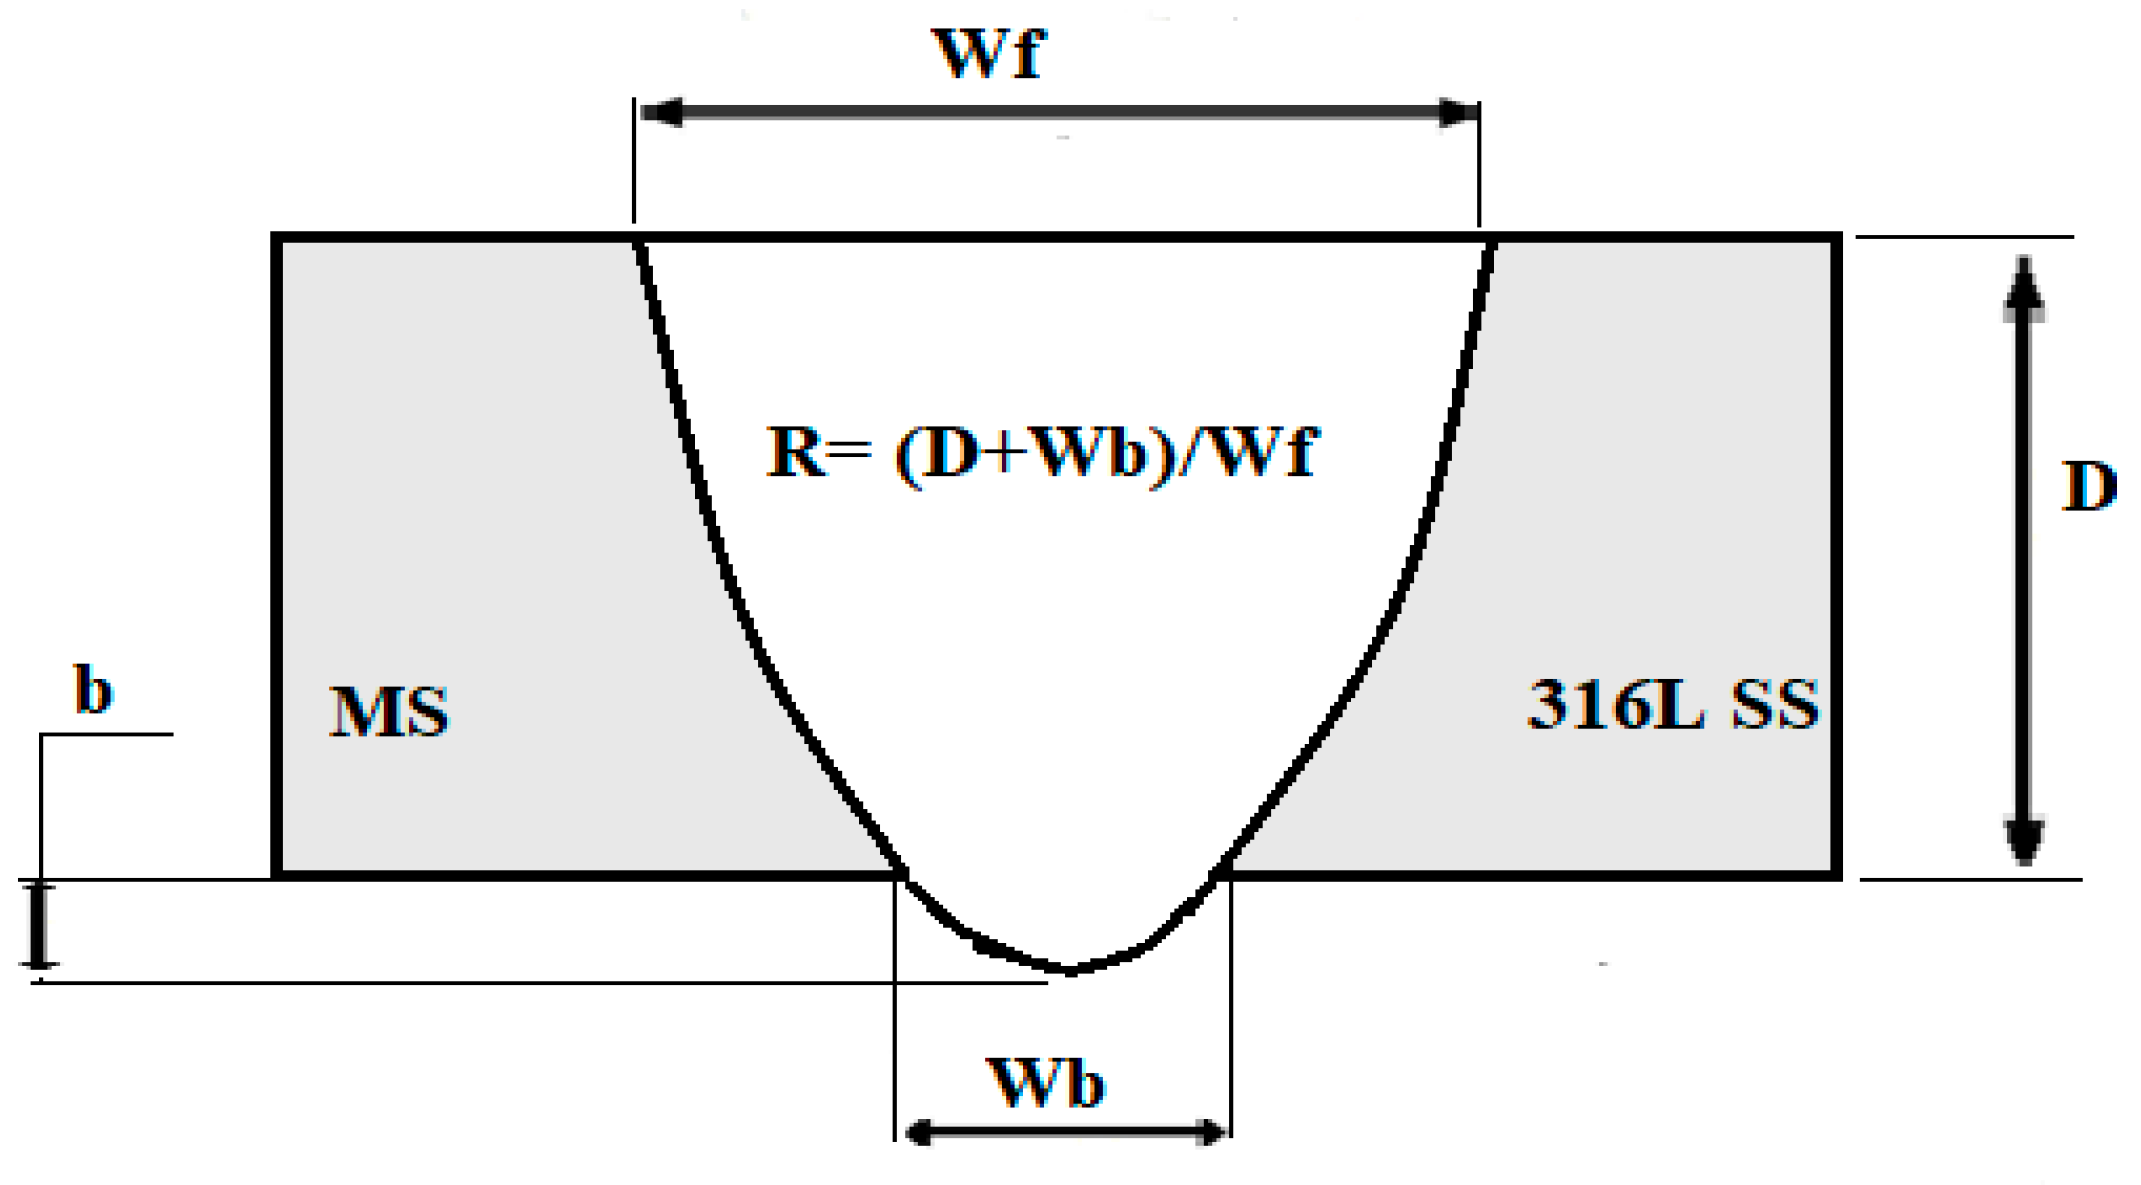
- A fully penetrated bead in a single pass without edge preparation is achieved. The excess root penetration can reach 0.8 mm, which meets the requirements of industrial standards. The obtained depth (D) is 6.8 mm, the bead face width (WF) is 8.8 mm, and the back face width (WB) is 3.5 mm, leading to an aspect ratio (D + WB)/WF of 1.17. Hence, compared to TIG welding, the depth and the ratio increased by 1.83 and 3.77 times, respectively.
- -
- The fluoride in the form of ions present in the modified flux migrates to the welding arc and contributes to an arc constriction. Thus, a phenomenon of reduction of the weld bead is observed, leading to an increase in the penetration of the weld compared to conventional TIG. Moreover, the surfactant elements, such as oxygen liberated in the weld pool, contribute to the reversal of Marangoni convection, resulting in a fully penetrated weld.
- -
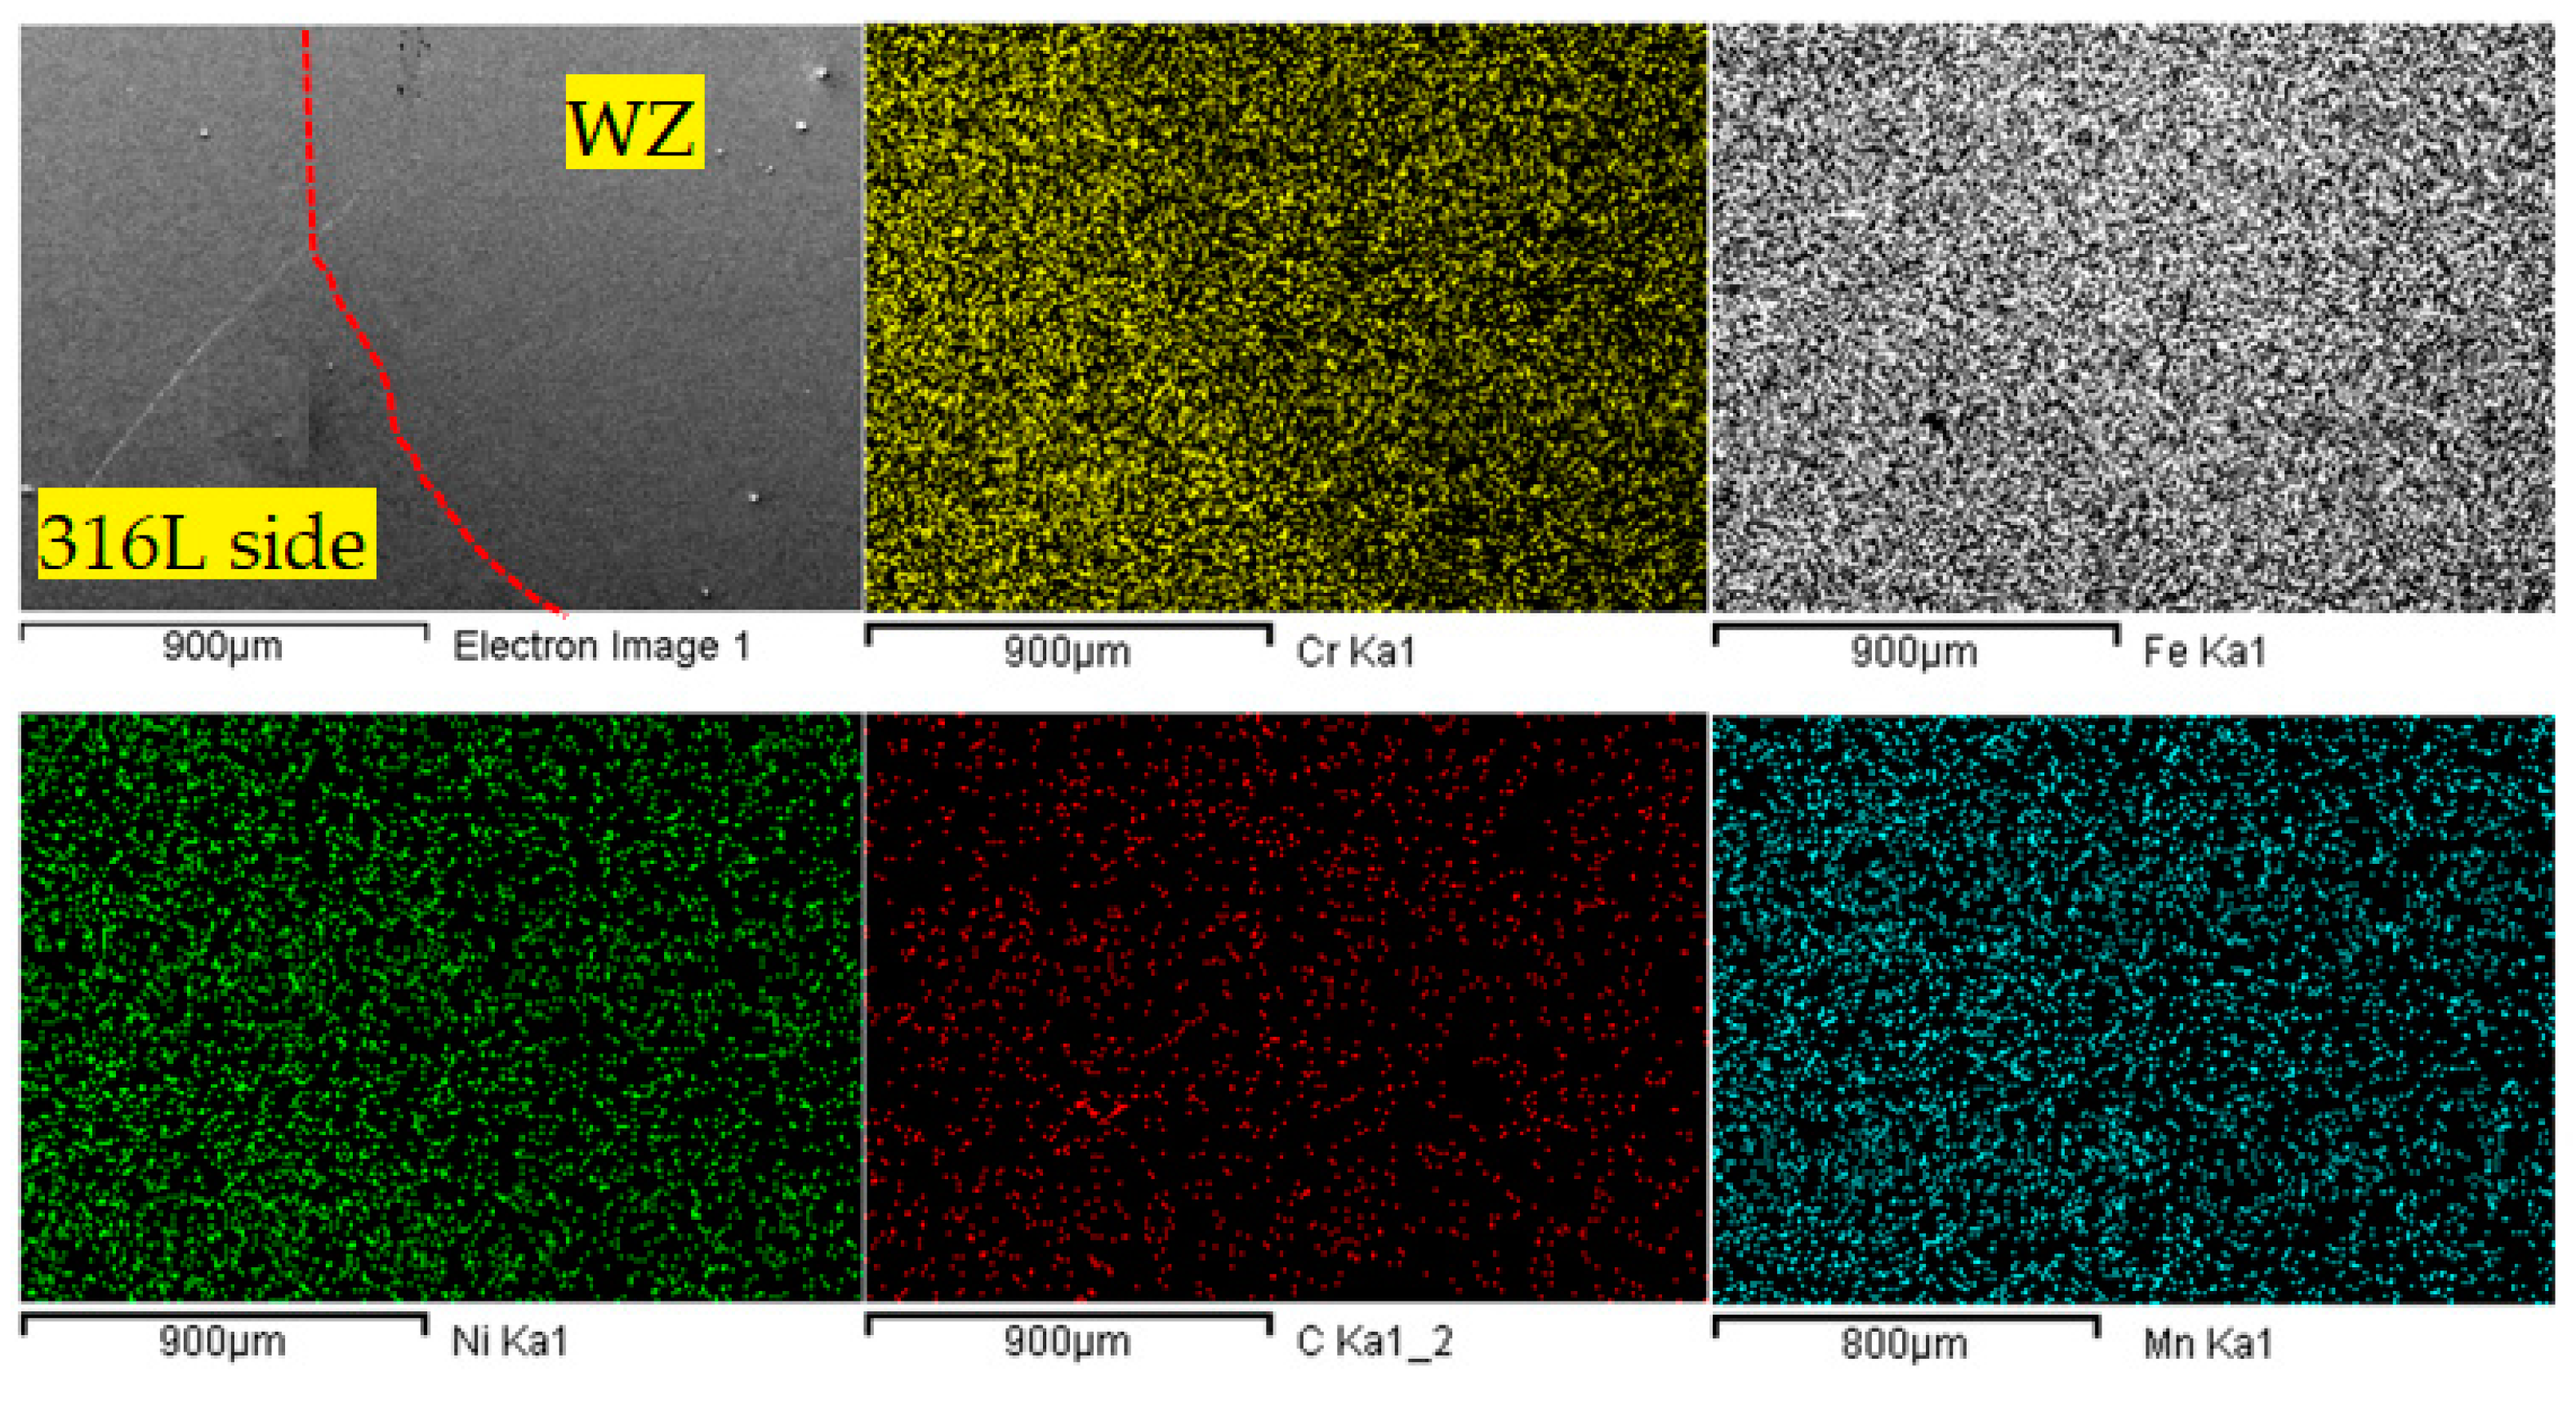
- SEM-EDS analysis shows carbon depletion closest to the weld zone at the MS side border. The migration of carbon from MS to the weld zone is suspected to occur in cases of TIG weldment. However, this situation is very limited or inexistent in ATIG welding due to its high cooling rate.
- -
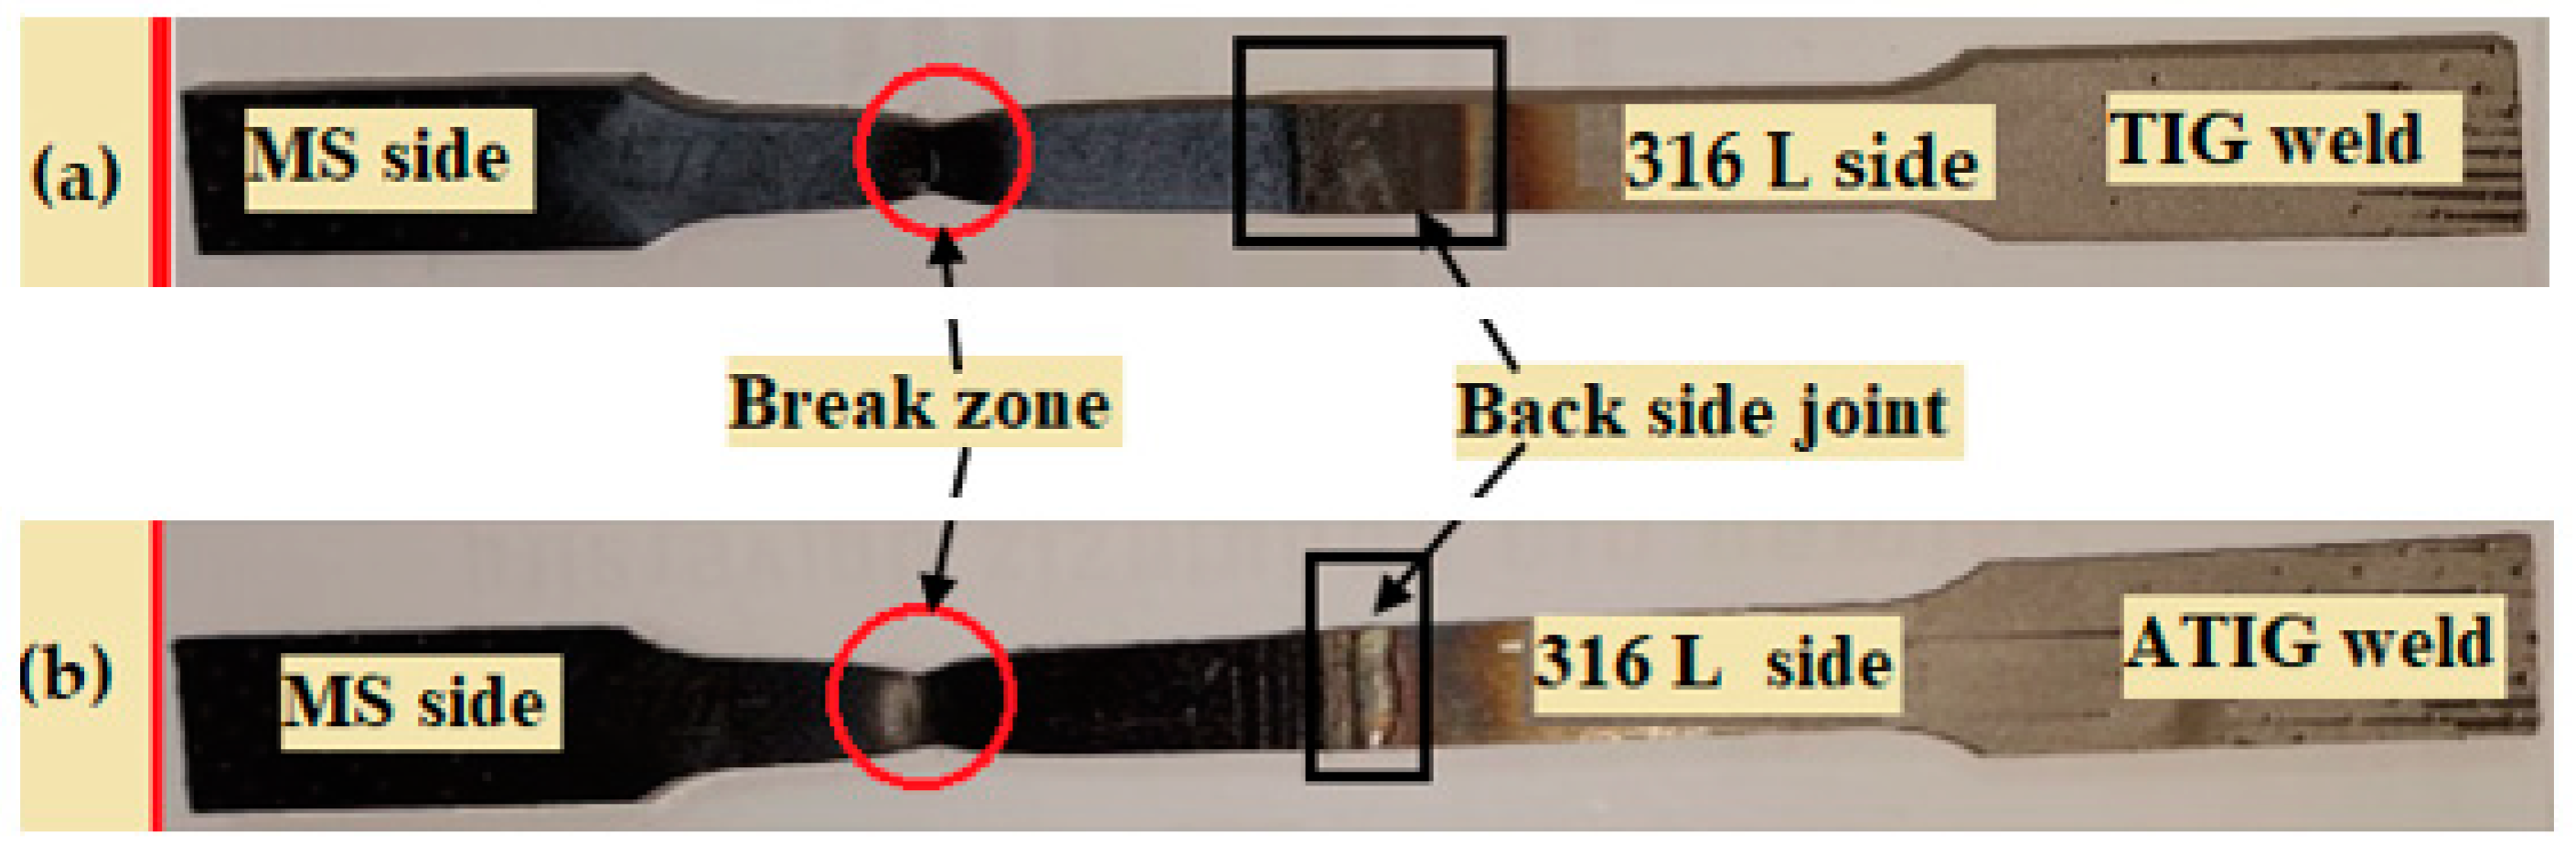
- The tensile test reveals that the strength has almost the same value, and the fracture happens at MS base metal for both ATIG and TIG welding. This indicates that the welding zone is stronger than that of the MS parent metal.
- -
- The hardness of ATIG welds exhibits homogenous values (≈277 HV), and the average value is higher than that of TIG welds (≈255 HV). The disparities in hardness between ATIG weld readings are negligible.
- -
- The fractography in the impact test shows a fully ductile fracture with many fine dimples overall on the fractured surface in ATIG welding, compared to gatherings of dimples separated by quasi-cleavage facies in TIG welding. ATIG welding exhibits more resistance to sudden loads (239 J/cm2) than TIG welding (216 J/cm2).
Author Contributions
Funding
Data Availability Statement
Acknowledgments
Conflicts of Interest
References
- Dixit, P.; Suketu, J. Techniques to weld similar and dissimilar materials by ATIG welding—An overview. Mater. Manuf. Process. 2021, 36, 1–16. [Google Scholar]
- Anbarasu, P.; Yokeswaran, R.; Godwin Antony, A.; Sivachandran, S. Investigation of filler material influence on hardness of TIG welded joints. Mater. Today Proc. 2020, 21, 964–967. [Google Scholar] [CrossRef]
- Singh, A.K.; Dey, V.; Rai, R.N. Techniques to improve weld penetration in TIG welding (a review). Mater. Today Proc. 2017, 4, 1252–1259. [Google Scholar] [CrossRef]
- Vijay, S.J.; Mohanasundaram, S.; Ramkumar, P.; Kim, H.G.; Tugirumubano, A.; Go, S.H. Experimental investigations on activated-TIG welding of Inconel 625 and AISI 304 alloys. In Advances in Materials and Manufacturing Engineering, Proceedings of the ICAMME 2019, Bhubaneswar, India, 15–19 March 2019; Springer: Singapore, 2020; pp. 311–317. [Google Scholar] [CrossRef]
- Patel, D.; Jani, S. ATIG welding: A small step towards sustainable manufacturing. Adv. Mater. Process. Technol. 2021, 7, 514–536. [Google Scholar] [CrossRef]
- Vidyarthy, R.S.; Sivateja, P. Influence of activating flux tungsten inert gas welding on mechanical and metallurgical properties of the mild steel. Mater. Today Proc. 2020, 28, 977–981. [Google Scholar] [CrossRef]
- Chern, S.K.; Tseng, H.; Tsai, H.-L. Study of the characteristics of duplex stainless steel activated tungsten inert gas welds. Mater. Des. 2011, 32, 255–263. [Google Scholar] [CrossRef]
- Heiple, C.R.; Roper, J.R. Mechanism for minor element effect on GTA fusion zone geometry. Weld. J. 1982, 61, 97–102. [Google Scholar]
- Howse, D.S.; Lucas, W. An investigation into arc constriction by active fluxes for TIG (A-TIG). Weld. Sci. Technol. Weld. Join. 2000, 5, 189–193. [Google Scholar] [CrossRef]
- Lowke, J.J.; Tanaka, M.; Ushio, M. Mechanisms giving increased weld depth due to a flux. J. Phys. D Appl. Phys. 2005, 38, 3438–3445. [Google Scholar] [CrossRef]
- Kumar, M.S.; Sankarapandian, S.; Shanmugam, N.S. Investigations on mechanical properties and microstructural examination of activated TIG-welded Nuclear grade stainless steel. J. Braz. Soc. Mech. Sci. Eng. 2020, 42, 292. [Google Scholar] [CrossRef]
- Singh, R.S.; Khanna, P. A-TIG (activated flux tungsten inert gas) welding:—A review. Mater. Today Proc. 2020, 44, 808–820. [Google Scholar] [CrossRef]
- Baghel, A.; Sharma, C.; Rathee, S.; Srivastava, M. Activated flux TIG welding of dissimilar SS202 and SS304 alloys: Effect of oxide and chloride fluxes on microstructure and mechanical properties of joints. Mater. Today Proc. 2021, 47, 7189–7195. [Google Scholar] [CrossRef]
- Niagaj, J. Influence of Activated Fluxes on the Bead Shape of A-TIG Welds on Carbon and Low-Alloy Steels in Comparison with Stainless Steel AISI 304L. Metals 2021, 11, 530. [Google Scholar] [CrossRef]
- Bhanu, V.; Gupta, A.; Pandey, C. Role of A-TIG process in joining of martensitic and austenitic steels for ultra-supercritical power plants -a state of the art review. Nucl. Eng. Technol. 2022, 54, 2755–2770. [Google Scholar] [CrossRef]
- Kumar, K.; Deheri, C.S.; Masanta, M. Effect of Activated Flux on TIG Welding of 304 Austenitic Stainless Steel. Mater. Today Proc. 2019, 18, 4792–4798. [Google Scholar] [CrossRef]
- Prasadarao Pydi, H.; Prakash Pasupulla, A.; Vijayakumar, S.; Abebe Agisho, H. Study on microstructure, behavior and Al2O3 content flux A-TIG weldment of SS-316L steel. Mater. Today Proc. 2022, 51, 728–734. [Google Scholar] [CrossRef]
- Paul, B.G.; Ramesh Kumar, K.C. Effect of single component and binary fluxes on the depth of penetration in a-TIG welding of Inconel alloy 800H austenitic stainless steel. Int. J. Adv. Eng. Global Technol. 2017, 5, 1791–1795. [Google Scholar]
- Rajesh Kumar, G.; Chandra Sekhara Reddy, M. Stainless steel effect of flux activated TIG tungsten inert gas welding on weld bead morphology of austenitic stainless steel 304. JETIR 2019, 6, 433–439. [Google Scholar]
- Patel, N.P.; Badheka, V.J.; Vora, J.J.; Upadhyay, G.H. Effect of oxide fluxes in activated TIG welding of stainless steel 316LN to low activation ferritic/martensitic steel (LAFM) dissimilar combination. Trans. Indian Inst. Met. 2019, 72, 2753–2761. [Google Scholar] [CrossRef]
- Mishra, D.; Rajanikanth, K.; Shunmugasundaram, M.; Praveen Kumar, A.; Maneiah, D. Dissimilar resistance spot welding of mild steel and stainless steel metal sheets for optimum weld nugget size. Mater. Today Proc. 2021, 46, 913–924. [Google Scholar] [CrossRef]
- Sharma, P.; Dwivedi, D.K. A-TIG welding of dissimilar P92 steel and 304H austenitic stainless steel: Mechanisms, microstructure and mechanical properties. J. Manuf. Process. 2019, 44, 166–178. [Google Scholar] [CrossRef]
- Landowski, M.; Swierczynska, A.; Rogalski, G.; Fydrych, D. Autogenous fiber laser welding of 316L austenitic and 2304 lean duplex stainless steels. Materials 2020, 13, 2930. [Google Scholar] [CrossRef] [PubMed]
- Khan, M.; Dewan, M.W.; Sarkar, M.Z. Effects of welding technique, filler metal and post-weld heat treatment on stainless steel and mild steel dissimilar welding joint. J. Manuf. Process. 2021, 64, 1307–1321. [Google Scholar] [CrossRef]
- Chen, H.-C.; Ng, F.L.; Du, Z. Hybrid laser-TIG welding of dissimilar ferrous steels: 10 mm thick low carbon steel to 304 austenitic stainless steel. J. Manuf. Process. 2019, 47, 324–336. [Google Scholar] [CrossRef]
- Pandey, C. Mechanical and metallurgical characterization of dissimilar P92/SS 304L welded joints under varying heat treatment regimes. Metall. Mater. Trans. A Phys. Metall. Mater. Sci. 2020, 51, 2126–2142. [Google Scholar] [CrossRef]
- Maurya, A.K.; Kumar, N.; Chhibber, R.; Pandey, C. Study on microstructure mechanical integrity of the dissimilar gas tungsten arc weld joint of SSDs 2057/x-70 steels for marine applications. J. Mater. Sci. 2023, 58, 11392–11423. [Google Scholar] [CrossRef]
- Kumar, A.; Pandey, S.M.; Bhattacharyya, A.; Fydrych, A.; Sirohi, S.; Pandey, C. Selection of electrode material for Inconel 617/P92 steel SMAW Dissimilar welds. J. Press. Vessel Technol. 2023, 145, 051503. [Google Scholar] [CrossRef]
- Atul, B.; Kumar, A.; Jain, V.; Gupta, D. Enhancement of activated tungsten inert gas (A-TIG) welding using multi-component TiO2 -SiO2-Al2O3 hybrid flux. Measurement 2019, 148, 106912. [Google Scholar]
- Sanjay, G.; Nayee, A.; Vishvesh, J. Effect of oxide-based fluxes on mechanical and metallurgical properties of Dissimilar Activating Flux Assisted-Tungsten Inert Gas Welds. J. Manuf. Process. 2014, 16, 137–143. [Google Scholar]
- Chaudhari, V.; Bodkhe, V.; Deokate, S.; Mali, B.; Mahale, R. Parametric optimization of TIG welding on SS 304 and MS using Taguchi approach. Int. Res. J. Eng. Technol. 2019, 6, 880–885. [Google Scholar]
- Ramadan, N.; Boghdadi, A. Parametric Optimization of TIG Welding Influence on Tensile Strength of Dissimilar Metals SS-304 And Low Carbon Steel by Using Taguchi Approach. Am. J. Eng. Res. 2020, 9, 7–14. [Google Scholar]
- Nagaraju, S.; Vasantharaja, P.; Chandrasekhar, N.; Vasudevan, M.; Jayakumar, T. Optimization of Welding Process Parameters for 9cr-1mo Steel Using RSM and GA. Mater. Manuf. Process. 2016, 31, 319–327. [Google Scholar] [CrossRef]
- Ragavendran, M.; Chandrasekhar, N.; Ravikumar, R.; Saxena, R.; Vasudevan, M.; Bhaduri, A.K. Optimization of Hybrid Laser—TIG Welding of 316LN Steel Using Response Surface Methodology (RSM). Opt. Lasers Eng. 2017, 94, 27–36. [Google Scholar] [CrossRef]
- Vora, J.J.; Abhishek, K.; Srinivasan, S. Attaining Optimized A-TIG Welding Parameters for Carbon Steels by Advanced Parameter-less Optimization Techniques: With Experimental Validation. J. Braz. Soc. Mech. Sci. Eng. 2019, 41, 261. [Google Scholar] [CrossRef]
- Chihaoui Hedhibi, A.; Touileb, K.; Ouis, A.; Djoudjou, R.; Ahmed, M.Z. Mechanical Properties and Microstructure of TIG and ATIG Welded 316L Austenitic Stainless Steel with Multicomponent Flux Optimization using Mixing Design method and Particle Swarm Optimization (PSO). Materials 2021, 14, 7139. [Google Scholar] [CrossRef] [PubMed]
- Kshirsagar, R.; Jones, S.; Lawrence, J.; Tabor, J. Prediction of Bead Geometry Using a Two-Stage SVM–ANN Algorithm for Automated Tungsten Inert Gas (TIG) Welds. J. Manuf. Mater. Process. 2019, 3, 39. [Google Scholar] [CrossRef]
- Ran, L.; Manshu, D.; Hongming, G. Prediction of Bead Geometry with Changing Welding Speed Using Artificial Neural Network. Materials 2021, 14, 1494. [Google Scholar]
- Kulkani, A.; Dwivedi, K.; Vasudevan, M. Effect of oxide fluxes on activated TIG welding of AISI 316L austenitic stainless steel. Mater. Today Proc. 2019, 18, 4695–4702. [Google Scholar] [CrossRef]
- Vasudevan, M. Effect of A-TIG Welding Process on the Weld Attributes of Type 304LN and 316LN Stainless Steels. J. Mater. Eng. Perform. 2017, 26, 1325–1336. [Google Scholar] [CrossRef]
- Touileb, K.; Ouis, A.; Djoudjou, R.; Chihaoui Hedhibi, A.; Alrobei, H.; Albaijan, I.; Alzahrani, B.; El-Sayed, M.; Hany, S. Effects of ATIG Welding on Weld Shape, Mechanical Properties and Corrosion Resistance of 430 Ferritic Stainless Steel Alloy. Metals 2020, 10, 404. [Google Scholar] [CrossRef]
- Lin, H.-L.; Wu, T.-M. Effects of Activating Flux on Weld Bead Geometry of Inconel 718 Alloy TIG Welds. Mater. Manuf. Process. 2012, 27, 1457–1461. [Google Scholar] [CrossRef]
- Albaijan, I.; Chihaoui Hedhibi, A.; Touileb, K.; Djoudjou, R.; Ouis, A.; Alrobei, H. Effect of binary oxide flux on ATIG 2205 duplex stainless steel welds. Adv. Mater. Sci. Eng. 2020, 2020, 5842741. [Google Scholar] [CrossRef]
- Touileb, K.; Chihaoui Hedhibi, A.; Djoudjou, R.; Ouis, A.; Bensalama, A.; Albaijan, I.; Hany, S.; Mohamed, M.Z. Mechanical Microstructure, and Corrosion Characterization of Dissimilar Austenitic 316L and Duplex 2205 Stainless-Steel ATIG Welded Joints. Materials 2022, 15, 2470. [Google Scholar] [CrossRef] [PubMed]
- Venkatesan, G.; George, J.; Sowmyasri, M.; Muthupandi, V. Effect of Ternary Fluxes on Depth of Penetration in A-TIG Welding of AISI 409 Ferritic Stainless Steel. Procedia Mater. Sci. 2014, 5, 2402–2410. [Google Scholar] [CrossRef]
- Ahmed, A.N.; Noor, C.W.M.; Allawi, M.F.; El-Shafie, A. RBF-NN-based model for prediction of weld bead geometry in Shielded Metal Arc Welding (SMAW). Neural Comput. Appl. 2018, 29, 889–899. [Google Scholar] [CrossRef]
- Kumar, R.; Saurav, S.K. Modeling of TIG welding process by regression analysis and neural network technique. Int. J. Mech. Eng. Technol. 2015, 6, 10–27. [Google Scholar]
- Kshirsagar, R.; Jones, S.; Lawrence, J.; Tabor, J. Optimization of TIG Welding Parameters Using a Hybrid Nelder Mead-Evolutionary Algorithms Method. J. Manuf. Mater. Process. 2020, 4, 10. [Google Scholar] [CrossRef]
- Boubaker, S.; Kamel, S.; Kolsi, L.; Kahouli, O. Forecasting of One-Day-Ahead Global Horizontal Irradiation Using Block-Oriented Models Combined with a Swarm Intelligence Approach. Nat. Resour. Res. 2020, 30, 1–26. [Google Scholar] [CrossRef]
- Touileb, K.; Djoudjou, R.; Chihaoui Hedhibi, A.; Ouis, A.; Benselama, A.; Albaijan, I.; Hany, S.A.; Abdus Samad, U. Comparative Microstructural, Mechanical and Corrosion Study between Dissimilar ATIG and Conventional TIG Weldments of 316L Stainless Steel and Mild Steel. Metals 2022, 12, 635. [Google Scholar] [CrossRef]
- Engineering Standards Manual ISD 341-2, Section WFP 2-01—Welding Fabrication Procedure. Available online: https://engstandards.lanl.gov/esm/welding/vol1/GWS%201-05-Att.09-R1.pdf (accessed on 30 June 2023).
- BS EN ISO 15614-1-2017; Specification and Qualification of Welding Procedures for Metallic Materials—Welding Procedure Test. ISO: Geneva, Switzerland, 2017.
- Coetzee, T. Phase chemistry of Submerged Arc Welding (SAW) fluoride based slag. J. Mater. Res. Technol. 2020, 9, 9766–9776. [Google Scholar] [CrossRef]
- Leconte, S.; Paillard, P.; Chapelle, P.; Henrion, G.; Saindrenan, J. Effects of flux containing fluorides on TIG welding process. Sci. Technol. Weld. Join. 2007, 12, 120–126. [Google Scholar] [CrossRef]
- Dong, J.; Han, X.; Xu, D.; Gao, X. Arc behavior of fluoride effects in the A-TIG welding of Ti6Al4V. Trans. China Weld. Inst. 2017, 38, 6–10. [Google Scholar]
- Wu, W.; Hu, S.; Shen, J. Microstructure, mechanical properties and corrosion behavior of laser welded dissimilar joints between ferritic stainless steel and carbon steel. Mater. Des. 2015, 65, 855–861. [Google Scholar] [CrossRef]
- Osoba, L.O.; Ayoola, W.A.; Adegbuji, Q.A.; Ajibade, O.A. Influence of Heat Inputs on Weld Profiles and Mechanical Properties of Carbon and Stainless Steel. Niger. J. Technol. Dev. 2021, 18, 135–143. [Google Scholar] [CrossRef]


| Elements | C | Mn | Si | P | S | Cr | Ni | Mo | N | Cu | Al | Fe |
|---|---|---|---|---|---|---|---|---|---|---|---|---|
| 316L | 0.026 | 1.47 | 0.42 | 0.034 | 0.0016 | 16.60 | 10.08 | 2.14 | 0.044 | 0.50 | - | Balance |
| Mild steel | 0.0521 | 0.165 | 0.009 | 0.0098 | 0.0137 | 0.0234 | 0.0277 | 0.00647 | 0.0053 | 0.0985 | 0.0245 | Balance |
| Powders | Melting Temperature (°C) | Evaporation Temperature (°C) | Free Enthalpy of Formation |∆dH°|(kJ/mol) | Oxygen Percentages in Oxide % |
|---|---|---|---|---|
| SiO2 | 1722 | 2950 | 902 | 68.35 |
| TiO2 | 1830 | 2972 | 941 | 63.26 |
| Fe2O3 | 1540 | 1987 | 826 | 68.35 |
| Cr2O3 | 2435 | 300 | 1128 | 61.71 |
| V2O5 | 681 | 1750 | 1550.6 | 49.05 |
| MoO3 | 802 | 1155 | 745.1 | 67.73 |
| NaF | 933 | 1704 | 573.6 | - |
| Parameters | Range |
|---|---|
| Welding speed | 150 mm/min |
| Welding current | 150 A |
| Arc Length | 2 mm |
| Electrode tip angle | 45° |
| Shielding gas on the workpiece | Argon with flow rate 8 L/min |
| Shielding gas on the backside | Argon with flow rate 4 L/min |
| Welding mode | Negative direct current electrode |
| Oxides | SiO2 | TiO2 | Fe2O3 | Cr2O3 | V2O5 | MoO3 |
|---|---|---|---|---|---|---|
| Depth (mm) | 5.96 | 3.28 | 4.59 | 4.33 | 3.26 | 3.95 |
| Width (mm) | 12.22 | 11.28 | 11.40 | 11.08 | 11.54 | 11.16 |
| Ratio | 0.49 | 0.29 | 0.40 | 0.39 | 0.28 | 0.35 |
| Order | X1 (en%) | X2 (en%) | X3 (en%) | D Actual | D Predicted |
|---|---|---|---|---|---|
| 1 | 75 | 25 | 0 | 6.4625 | 6.2868 |
| 2 | 75 | 0 | 25 | 6.4575 | 6.0203 |
| 3 | 0 | 75 | 25 | 6.2875 | 6.0868 |
| 4 | 25 | 75 | 0 | 6.2375 | 6.0402 |
| 5 | 25 | 0 | 75 | 6.7733 | 7.3305 |
| 6 | 0 | 25 | 75 | 8.2467 | 7.6437 |
| 7 | 0 | 50 | 50 | 6.7867 | 7.1309 |
| 8 | 50 | 0 | 50 | 7.1200 | 6.7955 |
| 9 | 50 | 50 | 0 | 6.1275 | 6.632 |
| 10 | 50 | 25 | 25 | 7.5467 | 6.9794 |
| 11 | 25 | 50 | 25 | 7.4600 | 7.0016 |
| 12 | 25 | 25 | 50 | 7.4700 | 7.4317 |
| 13 | 33.33 | 33.33 | 33.33 | 6.4125 | 7.2325 |
| 14 | 66.67 | 16.67 | 16.67 | 6.7033 | 6.5238 |
| 15 | 16.67 | 66.67 | 16.67 | 6.6600 | 6.4711 |
| 16 | 16.67 | 16.67 | 66.67 | 6.6900 | 7.5636 |
| 17 | 100 | 0 | 0 | 4.5850 | 5.0048 |
| 18 | 0 | 100 | 0 | 4.3250 | 4.5114 |
| 19 | 0 | 0 | 100 | 7.9600 | 7.6253 |
| Welds | D | WF | WB | (D + WB)/WF |
|---|---|---|---|---|
| TIG Weld [50] | 3.7 | 12.02 | 0 | 0.31 |
| ATIG Weld (optimal flux) | 8.2 | 9.94 | 7.3 | 1.56 |
| Welds | D | WF | WB | (D + WB)/WF |
|---|---|---|---|---|
| Conventional TIG Weld [50] | 3.7 | 12.02 | 0 | 0.31 |
| ATIG Weld (optimal flux) | 8.2 | 9.9 | 7.3 | 1.56 |
| ATIG Weld (with modified optimal flux) | 6.8 | 8.8 | 3.5 | 1.17 |
 | ||||||||||
|---|---|---|---|---|---|---|---|---|---|---|
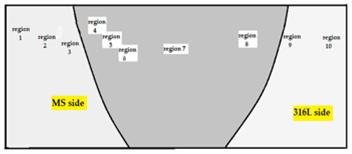
| Elements | Reg.1 | Reg.2 | Reg.3 | Reg.4 | Reg.5 | Reg.6 | Reg.7 | Reg.8 | Reg.9 | Reg.10 |
| C | 2.51 | 2.30 | 2.17 | 2.62 | 2.44 | 2.45 | 0 | 0 | 0 | 0 |
| Cr | 0 | 0 | 0 | 4.49 | 9.81 | 11.25 | 10.75 | 10.56 | 18.82 | 18.63 |
| Fe | 97.49 | 97.70 | 97.83 | 90.73 | 83.29 | 81.82 | 84.42 | 83.40 | 70.82 | 71.21 |
| Ni | 0 | 0 | 0 | 2.16 | 4.46 | 4.48 | 4.82 | 4.92 | 8.29 | 8.13 |
| Regions | EDS Spectrum for Dissimilar 316-MS ATIG Weld | |
|---|---|---|
| Inside MS region 1 | 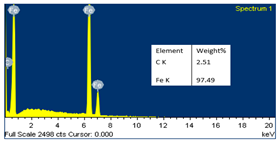 | 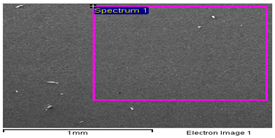 |
| Inside MS region 2 |  | 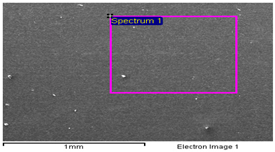 |
| MS/WZ border (MS side) region 3 | 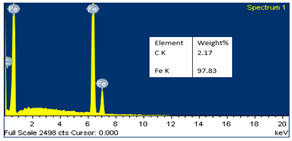 | 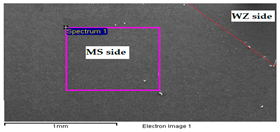 |
| MS/WZ border (WZ side) region 4 | 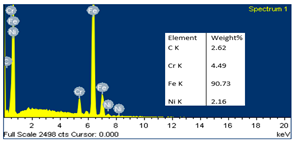 | 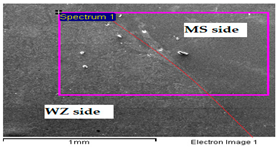 |
| MS/WZ border (WZ side) Region 5 | 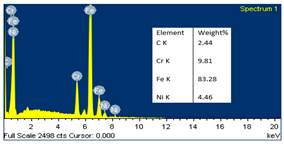 | 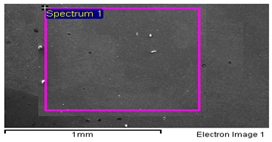 |
| MS/WZ border (WZ side) region 6 | 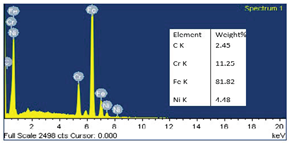 | 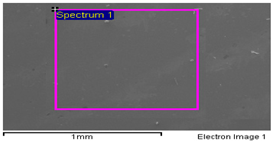 |
| Inside WZ region 7 |  | 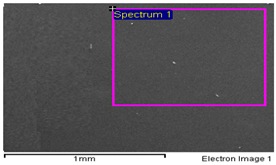 |
| WZ/316L border (WZ side) region 8 | 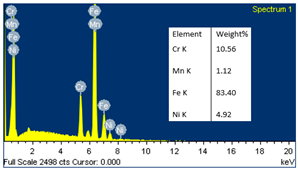 | 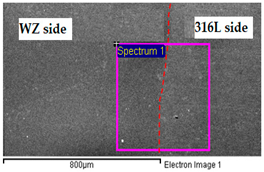 |
| {49}sWZ/316L border (316L side) region 9 |  |  |
| Inside 316L region 10 |  |  |
 | ||||||||||
|---|---|---|---|---|---|---|---|---|---|---|
| Elements | Reg.1 | Reg.2 | Reg.3 | Reg.4 | Reg.5 | Reg.6 | Reg.7 | Reg.8 | Reg.9 | Reg.10 |
| C | 5.03 | 4.99 | 1.82 | 4.67 | 3.58 | 1.92 | 0 | 0 | 0 | 0 |
| Cr | 0 | 0 | 0 | 4.98 | 4.86 | 14.41 | 11.47 | 16.09 | 18.55 | 18.50 |
| Fe | 94.97 | 95.01 | 98.18 | 87.46 | 89.51 | 76.01 | 82.69 | 75.08 | 70.89 | 71.17 |
| Ni | 0 | 0 | 0 | 2.89 | 2.06 | 6.41 | 4.83 | 6.53 | 8.06 | 8.30 |
| Regions | EDS Spectrum for Dissimilar 316-MS Weld | |
|---|---|---|
| Inside MS region 1 | 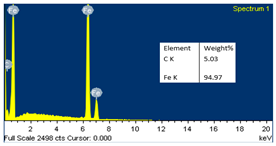 | 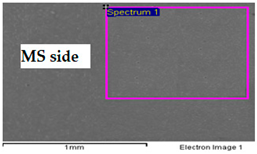 |
| Inside MS region 2 |  | 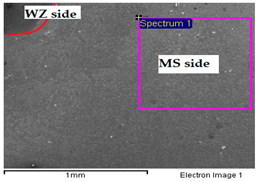 |
| MS/WZ border (MS side) region 3 |  | 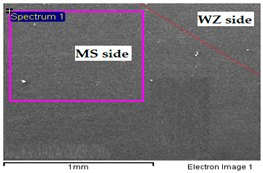 |
| MS/WZ border (WZ side) region 4 | 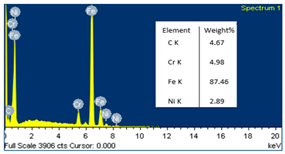 | 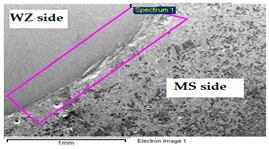 |
| MS/WZ border (WZ side) Region 5 | 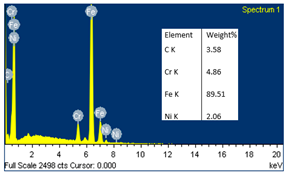 | 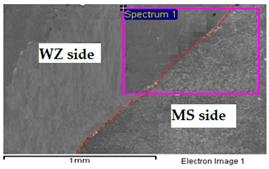 |
| MS/WZ border (WZ side) region 6 | 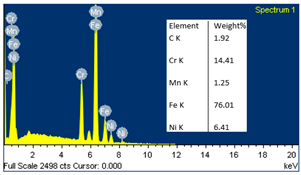 | 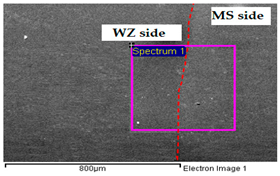 |
| Inside WZ region 7 | 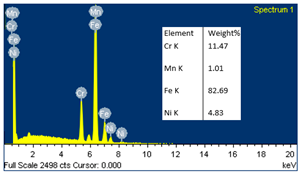 |  |
| WZ/316L border (WZ side) region 8 | 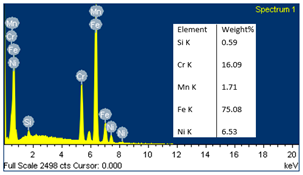 | 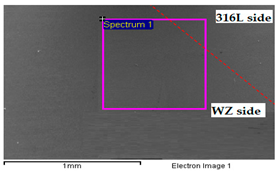 |
| WZ/316L border (316L side) region 9 |  |  |
| Inside 316L region 10 | 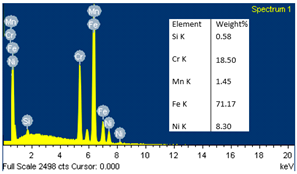 |  |
| Sample | Number of Tests | UTS Max. (MPa) | UTS Min. (MPa) | UTS Average (MPa) | Standard Deviations σ |
|---|---|---|---|---|---|
| As received MS base metal | 3 | 364 | 361 | 362 | 2.02 |
| As received 316L base metal | 3 | 626 | 623 | 624 | 1.4 |
| TIG MS/316L [50] | 3 | 380 | 372 | 376 | 4.00 |
| ATIG MS/316L | 3 | 382 | 370 | 377 | 4.04 |
| Sample | Zone of Tests | HV Max. | HV Min. | HV Average | Standard Deviations σ |
|---|---|---|---|---|---|
| TIG [50] | FZ | 287 | 235 | 252 | 12.75 |
| ATIG | FZ | 283 | 270 | 277 | 4.84 |
| Sample | Number of Tests | Absorbed Energy (J/cm2) Min | Absorbed Energy (J/cm2) Max | Absorbed Energy (J/cm2) Average | Standard Deviations σ |
|---|---|---|---|---|---|
| TIG—316L SS/MS [50] | 3 | 215 | 238 | 216 | 15.56 |
| ATIG—316L SS/MS | 3 | 234 | 243 | 239 | 4.58 |
Disclaimer/Publisher’s Note: The statements, opinions and data contained in all publications are solely those of the individual author(s) and contributor(s) and not of MDPI and/or the editor(s). MDPI and/or the editor(s) disclaim responsibility for any injury to people or property resulting from any ideas, methods, instructions or products referred to in the content. |
© 2023 by the authors. Licensee MDPI, Basel, Switzerland. This article is an open access article distributed under the terms and conditions of the Creative Commons Attribution (CC BY) license (https://creativecommons.org/licenses/by/4.0/).
Share and Cite
Touileb, K.; Djoudjou, R.; Ouis, A.; Hedhibi, A.C.; Boubaker, S.; Ahmed, M.M.Z. Particle Swarm Method for Optimization of ATIG Welding Process to Joint Mild Steel to 316L Stainless Steel. Crystals 2023, 13, 1377. https://doi.org/10.3390/cryst13091377
Touileb K, Djoudjou R, Ouis A, Hedhibi AC, Boubaker S, Ahmed MMZ. Particle Swarm Method for Optimization of ATIG Welding Process to Joint Mild Steel to 316L Stainless Steel. Crystals. 2023; 13(9):1377. https://doi.org/10.3390/cryst13091377
Chicago/Turabian StyleTouileb, Kamel, Rachid Djoudjou, Abousoufiane Ouis, Abdeljlil Chihaoui Hedhibi, Sahbi Boubaker, and Mohamed M. Z. Ahmed. 2023. "Particle Swarm Method for Optimization of ATIG Welding Process to Joint Mild Steel to 316L Stainless Steel" Crystals 13, no. 9: 1377. https://doi.org/10.3390/cryst13091377
APA StyleTouileb, K., Djoudjou, R., Ouis, A., Hedhibi, A. C., Boubaker, S., & Ahmed, M. M. Z. (2023). Particle Swarm Method for Optimization of ATIG Welding Process to Joint Mild Steel to 316L Stainless Steel. Crystals, 13(9), 1377. https://doi.org/10.3390/cryst13091377