Abstract
Fine-dispersed YGdAG:Ce nanopowders with various degrees of isomorphic substitution of yttrium by gadolinium were synthesized. The structure and luminescent properties were studied by X-ray diffraction, attenuated total reflection Fourier-transform infrared spectroscopy, luminescence spectroscopy and scanning electron microscopy. The possibility of synthesis of YGdAG:Ce nanopowders with a degree of gadolinium substitution up to 60% and nanocrystals with average sizes of 25–30 nm were shown. The red-shift of the cerium luminescence band with an increase in Gd content was studied. The CIE diagram for emission of YGdAG:Ce synthesized by the polymer–salt method shows that the degree 30–40% substitution of Y by Gd is optimal for the fabrication of a white light source based on LED with an emission wavelength of 470 nm.
1. Introduction
Cerium-doped media are commonly used as scintillators and phosphors [1]. A broad yellow luminescence band of the cerium ions allows the fabrication of the phosphors for spectral correction of LEDs, which allows for obtaining the white LEDs [2,3,4]. The yttrium-aluminum garnet with a cubic crystalline structure is widely applied as a matrix for luminescent rare-earth ions. Yttrium-aluminum garnet crystals are characterized by a number of beneficial physical properties such as high thermal conductivity, mechanical, chemical and radiation sustainability, and optical isotropy and transparency in a wide spectral range [5,6,7]. The ionic radius of yttrium is close to the ionic radii of some rare earth ions which allows the doping of YAG without significant distortion of its crystal structure.
The tuning of luminescence spectra is necessary in order to fabricate the phosphors which are able to convert the emission of LEDs to broadband white light. The modification of the environment of luminescent centers causes changes in the luminescence spectrum. Therefore, structural defects engineering based on the formation of intrinsic defects is a way to modify the structural and luminescent properties of materials. For example, the generation of defects in ZnO allows modifying its luminescence spectra [8,9,10,11]. In addition to the formation of such defects as vacancies, interstitial hydrogen or other elements, it is possible to change smaterials’ properties by using the partial substitution of some ions by ions with similar properties [12,13,14,15]. This approach allows changing the interatomic distances and crystal cell parameters. If the materials contain luminescent ions, their environment will change, which leads to the formation of other luminescent centers and modification of their luminescent properties [16,17,18,19,20].
For example, the isomorphic substitution of yttrium or aluminum by other ions modifies significantly the properties of materials doped with activator ions [15,21,22]. The partial substitution of aluminum (ionic radius 0.53 Å) by scandium (0.75 Å) in order to form paramagnetic centers in Mo3+-doped YAG was described in [21].
The luminescence bandwidth is a parameter having key importance for the fabrication of mode-locked lasers with shorter pulse duration. In order to widen the ytterbium luminescence band in Yb:YAG, aluminum ions can be substituted by Sc3+ [23,24] or yttrium ions can be substituted by gadolinium [15,25]. The difference in ionic radii of yttrium (0.92 Å) and gadolinium (0.97 Å) ions [26] provides the disturbance of the YAG crystal structure that causes the broadening of the ytterbium luminescence band. Since the difference in ionic radii of Y and Gd is lower than in the ionic radii of Al and Sc, the obtained effect is less strong. Thus, the substitution of yttrium for gadolinium allows a more subtle modification of the luminescence spectrum. However, at the replacement of more than 40% of yttrium atoms, the phase composition of Yb:YGdAG nanopowders is disturbed. One can observe this phenomenon in the luminescence spectrum, and it is confirmed by the data of XRD [15].
The effect of gadolinium incorporation on cerium luminescence bands in the YAG matrix is well known. The addition of gadolinium leads to the red-shift of the cerium luminescence band. Therefore, YGdAG:Ce is used as luminescent material for white LED fabrication [27,28]. Nevertheless, the studies on the influence of substitution of yttrium by gadolinium on YAG:Ce properties are brief or concern only YAG:Ce powders with low concentrations of gadolinium [29,30].
The synthesis of nanocrystalline powders opens new opportunities for structural defect engineering since these powders have a very high specific surface area. YAG nanocrystalline powders can be introduced into optical fiber [31,32] or be used as a material for temperature sensor fabrication [33,34] or as precursors for ceramics sintering [35]. The transparent YAG ceramics obtained by sintering nanocrystalline powders can be considered as a replacement for YAG monocrystals since the growth of crystals is a difficult and energy-consuming process.
YAG nanocrystalline powders can be synthesized by solid-state reaction [36,37,38], which is an energy-consuming process. The use of liquid–phase methods such as sol–gel method [39,40,41], precipitation method [42,43,44] and combustion methods [45,46,47] allows reducing the synthesis temperature of YAG nanopowders. The polymer–salt method which is a simple method of nanomaterials synthesis belongs to methods based on the combustion of organic fuel. This method is based on the dissolution of metal salts and soluble polymer, the drying of solution with the following calcination of obtained polymer–salt composition. It can be applied for the fabrication of luminescent and photocatalytic coatings and nanopowders [48,49,50,51]. The polymer–salt method allows for obtaining uniform nanomaterials due to the mixture of components in a liquid phase that allows for reaching homogeneity at the molecule level. A soluble polymer plays the role of stabilizer preventing the precipitation of the salts during the drying of solutions. It acts also as a dispersant evolving a big volume of gaseous products at its decomposition during the calcination process, which provides a decrease in the average size of nanoparticles in comparison with the synthesis without any organic fuel.
Thus, the aim of this work is to apply the polymer–salt method to the synthesis of YGdAG:Ce nanocrystalline powders and to perform a study on the influence of isomorphic substitution of yttrium by gadolinium in a wide range of gadolinium content on the structure and luminescent properties of the synthesized material.
2. Materials and Methods
Yttrium, cerium, gadolinium and aluminum nitrates as well as polyvinylpyrrolidone (PVP; Mw~1,300,000 g/mol) were used as precursors.
The amounts of salts and PVP were calculated according to the stoichiometric ratio for YGdAG:Ce with a predetermined percentage of isomorphic substitution of yttrium by gadolinium. Initial aqueous solutions were prepared and mixed using the magnetic stirrer until the full dissolution of PVP and salts. Then, obtained solutions were dried in the drying chamber at the temperature of 70 °C for three days. Obtained polymer–salt compositions were calcinated in the electric muffle at the temperature of 1000 °C.
The chemical compositions of initial solutions are presented in Table 1. The YAG-X notation was used, where X is the percentage of yttrium atoms substituted by gadolinium. The concentration of cerium in each sample is 0.5 wt. %.
The UV-VIS luminescence spectra were captured using the spectrofluorometer Perkin Elmer FL6500, since the cerium ions are characterized by strong luminescence in the visible spectral range.
The diffuse reflectance spectra were captured using Perkin Elmer Lambda 900 UV/VIS/NIR spectrophotometer equipped with a special module.
The measurement of absolute PL quantum yield was performed using Hamamatsu C9920-02G absolute PL quantum yield spectrometer.
Photoluminescence decay curves were captured using MicroTime 100 system (PicoQuant, Berlin, Germany) with excitation at 405 nm. The signal was collected in the spectral range from 430 to 780 nm. The decay curves were fitted by the bi-exponential function. The average luminescence lifetime was calculated as:
where A1,2 and τ1,2 are the amplitude and luminescence lifetime of each component in biexponential function, respectively [52].
The phase compositions of powders were studied using the X-ray diffraction method. XRD patterns were captured using the Rigaku Ultima IV diffractometer in the range of angles from 20° to 80°. The wavelength of X-ray radiation is 1.5406 Å. The average size of nanocrystals was calculated using the Scherrer equation [53]:
where k is the Scherrer constant dependent on the shape of nanoparticles (0.9 for cubic crystals), λ is the wavelength of X-ray radiation, β is FWHM of the most intense diffraction peak, and θ is the Bragg angle.
The changes in the powder structure which occur when Y is substituted by Gd were estimated based on the IR absorption spectra since the structural elements containing Y-O and Al-O bonds have intense absorption bands in the low wavenumber region [54]. The spectra were captured using the ATR-FTIR module which allows the comparison of peaks spectral positions, but it is impossible to obtain the absolute values of optical densities using this method.
The morphology of synthesized powders was studied using scanning electron microscopy (the VEGA3 TESCAN microscope).
3. Results and Discussion
3.1. Analysis of Chemical Composition Using EDXRF
In order to confirm the chemical composition and percentage of substitution of yttrium by gadolinium the energy dispersive X-ray fluorescence (EDXRF) was applied. The experimental data and comparison of the theoretical and experimental percentage of Y/Gd substitution are presented in Table 2.
Due to the limitations of the instrument, the cerium has not been detected since its concentration is low. According to the data in Table 2, the error of the Y/Gd substitution percentage does not exceed 5%. The deviation of Al, Y and Gd concentrations is caused by instrumental error.
3.2. X-ray Diffraction
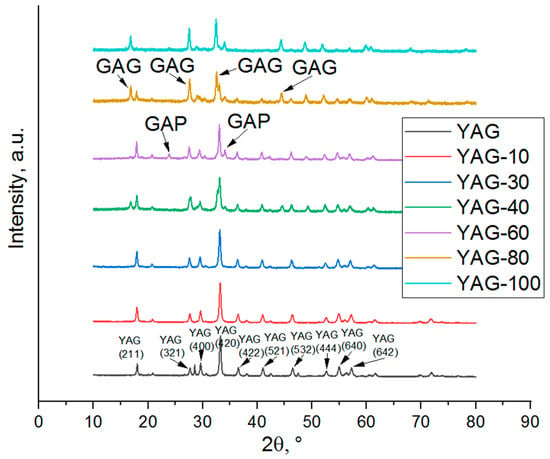
The X-ray diffraction patterns of YGdAG:Ce nanopowders synthesized using the polymer–salt method are given in Figure 1.
As one can see from Figure 1, the YGdAG:Ce samples with the percentage of substitution of Y by Gd not exceeding 30% consist of the pure yttrium-aluminum garnet phase, which corresponds to the result obtained earlier in [15] for the YAG:Yb,Gd nanopowders. The XRD peaks of YAG slightly shift to the lower Bragg angles. Thus, in the case of relatively low concentration, gadolinium incorporates the YAG crystal structure without the formation of other phases.
In the sample YAG-60, the peaks corresponding to the gadolinium aluminate phase (GAP, gadolinium-aluminium perovskite, GdAlO3) [55,56,57] are observed. The percentage of gadolinium aluminate phase in this sample is about 11% according to the estimation based on Rietveld refinement. Samples with 80% consist of the YAG phase as well as from unstable GAG (gadolinium-aluminum garnet, Gd3Al5O12). The GAG phase was not obtained in our previous work [15], but its synthesis was described in [58]. A sample with full substitution of yttrium by gadolinium represents a mixture of GAG and GAP phases. The formation of an unstable GAG phase can be explained by the stabilization of the crystal structure due to the presence of yttrium (in the sample YAG-80) and cerium ions or due to the relatively low temperature of materials synthesis (GAG phase thermally decomposes at the temperature exceeding 1300 °C [59]).
The results of the calculation of nanocrystal average sizes using the Scherrer equation and the calculation of the lattice parameters using Rietveld refinement are given in Table 3. The values of average sizes for YAG-80 and YAG-100 were obtained using the data on the most intense GAG peak.
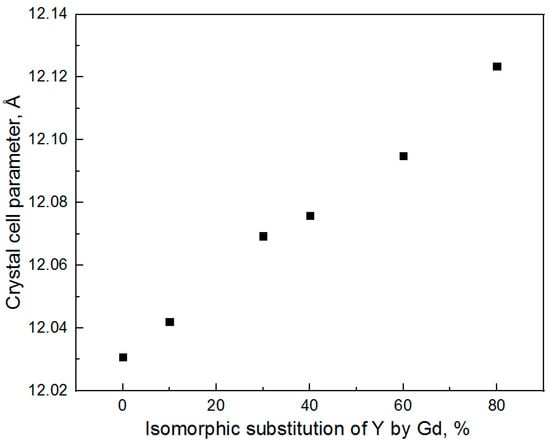
As one can see from Table 3, no influence of gadolinium on the average size of nanocrystals is observed. The dependence of the crystal cell parameter on the degree of isomorphic substitution of Y by Gd is shown in Figure 2. The crystal cell parameter was determined for the YAG phase using Rietveld refinement.
The dependence of the YAG crystal cell parameter on the isomorphic substitution of yttrium by gadolinium is linear. The obtained result confirms the incorporation of gadolinium into the YAG structure. It is worth noticing that the crystal cell parameter continues to increase in the substitution range of 40–80%; hence, even when the formation of parasite phases is observed, a significant part of gadolinium ions incorporates into the structure of the YAG phase.
3.3. ATR-FTIR Spectroscopy
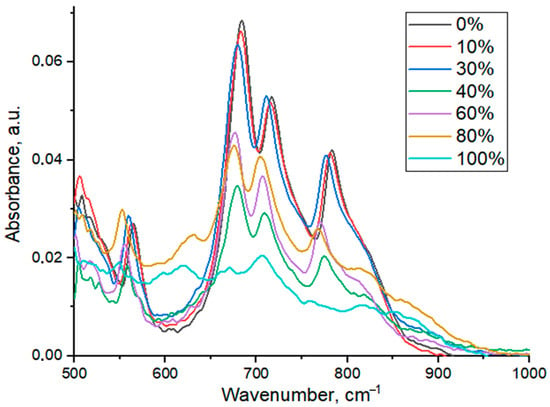
The infrared absorption spectra of YGdAG:Ce nanopowders are presented in Figure 3.
Figure 3.
ATR-FTIR spectra of YGdAG:Ce nanopowders with different percent of isomorphic substitution of Y by Gd.
As one can see from Figure 3, four intense bands with maxima at 565, 686, 715 and 783 cm−1 corresponding to YAG are observed in these spectra. The low-intensity band with a maximum at about 516 cm−1 can be attributed to Ce-O bond vibration [60] but it cannot be clearly distinguished due to the limitations of the instrument. These limitations also do not allow observing the bands having maxima less than 500 cm−1 in the spectrum. The bands with maxima at about 690 and 790 cm−1 correspond to Al-O vibrations in tetrahedral structural elements AlO4, which are presented in the YAG structure [54,60,61]. The bands with maxima at 570 and 720 cm−1 can be attributed to Y-O vibrations. According to the FTIR data, one can observe the presence of other phases in YAG-80 and YAG-100 samples, since there are some other bands that are not characteristic of the YAG phase.
The sample YAG100 with full substitution of yttrium by gadolinium consists of gadolinium aluminate garnet (GAG, Gd3Al5O12) and gadolinium-aluminum perovskite (GAP) phases according to the XRD data. The shape of the FTIR spectrum of the GAG phase is similar to the one of YAG [62,63]. The absorption band in the range of 600–620 cm−1 can be attributed to the GAP phase, which forms due to the thermal decomposition of the Gd3Al5O12 phase [64]. The FTIR data is consistent with the data obtained by XRD. The absorption bands of some parasite phases were not found since the FTIR peaks of YAG and other phases containing Y, Gd and Al overlap. For example, the peaks of the GdAlO3 phase would overlap with Al-O (690 cm−1) and Y-O (570 cm−1) peaks in the YAG phase [65,66].
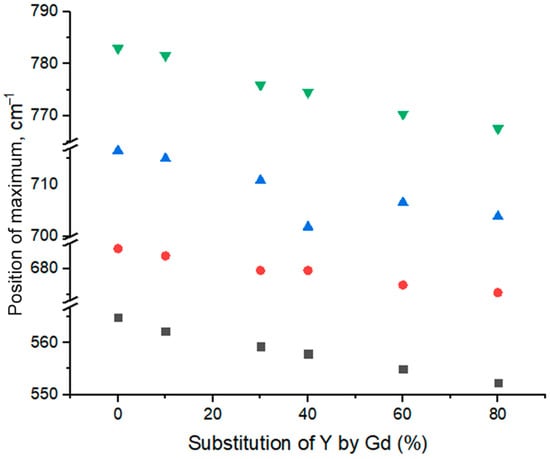
It is worth noticing that the ATR-FTIR measurement technique does not allow the comparison of absorption band intensities, since it depends on the pressure applied to the sample during the measurement. This method is applied in order to determine only the positions and shifts of the bands. A significant shift of Y-O and Al-O bands is observed with an increase in gadolinium content. The dependences of the position of maximum on gadolinium content are presented in Figure 4.
Figure 4.
Dependencies of positions of maxima of absorption bands in ATR-FTIR spectra of YGdAG:Ce nanopowders on the percent of isomorphic substitution of Y by Gd.
The dependence of the maxima positions on the degree of isomorphic substitution of yttrium by gadolinium is almost linear in the range of Gd content 0–60%. This linear shift of peaks maxima positions confirms the gadolinium incorporation into the YAG structure, which leads to distortion of crystal structure and change in frequencies of vibrations. However, the observed shift at 60–80% substitution of yttrium by gadolinium is less prominent, probably, due to the formation of other phases. Since their FTIR bands overlap with the bands of the YAG phase, the results obtained for samples with 60–100% of Y-Gd substation are difficult to be analyzed.
Despite the fact that gadolinium replaces only the yttrium in the YAG structure, it is worth noticing that the isomorphic substitution of yttrium by gadolinium affects significantly the frequencies of Al-O vibrations. This phenomenon can be explained by distortion of the YAG crystal structure which causes the change in distance between all the atoms in the structure and an increase in ion mass when gadolinium substitutes yttrium ions. Such an increase must lead to a decrease in vibrational frequency.
The shift of these vibrational bands can be explained also from the viewpoint of compression deformation in a rigid structure caused by the difference in ionic radii of yttrium and gadolinium which is able to affect also the vibration frequencies. Authors of [67] explained the effects on luminescence caused by Y/Gd substitution using this approach based on combining hybrid orbital theory with solid-state energy band theory.
3.4. Scanning Electron Microscopy
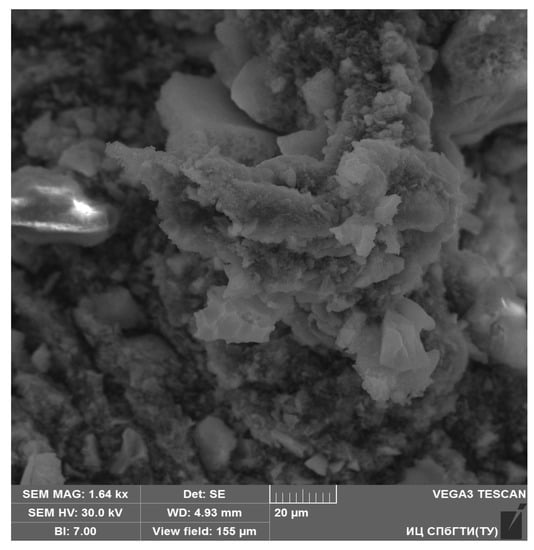
The SEM image of the YAG10 sample is presented in Figure 5.
The synthesized cerium-doped yttrium-aluminum garnet consists of aggregates that have a porous morphology and their sizes are in the range of 1–50 μm. The porous morphology of nanoparticle aggregates can be explained by the features of synthesis, that is, by outgassing during the decomposition of PVP and nitrates.
Although one can see the structure of aggregates from Figure 5, it is difficult to estimate visually the sizes of nanoparticles. For more precise estimation, the XRD analysis and the Scherrer equation can be applied.
3.5. Luminescence Spectroscopy
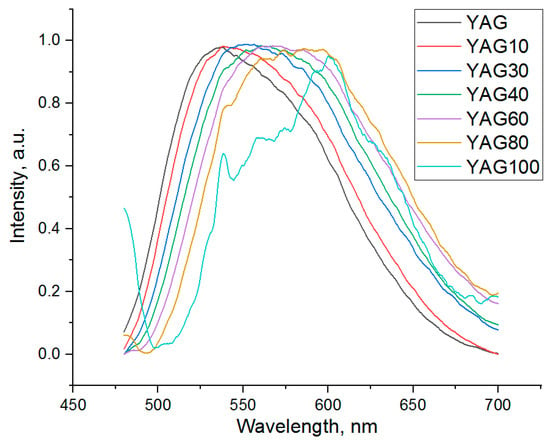
The luminescence spectra of the cerium-doped garnet nanopowders with different percentages of substitution of Y by Gd are presented in Figure 6. The wavelength of excitation light is 450 nm. The spectra were normalized to (0.1). The luminescence band of the YAG100 sample is distorted because of the low signal-to-noise ratio. Its lower intensity in comparison with other samples might be the reason for this phenomenon.
A wide intense band corresponding to YAG:Ce is observed in the spectra of all of YGdAG:Ce samples. This wide intense band corresponds to the 5d-4f electric dipole transition which is characteristic of the cerium ions in the YAG matrix [4,49]. A significant red-shift and distortion of the band shape are observed with an increase in gadolinium content.
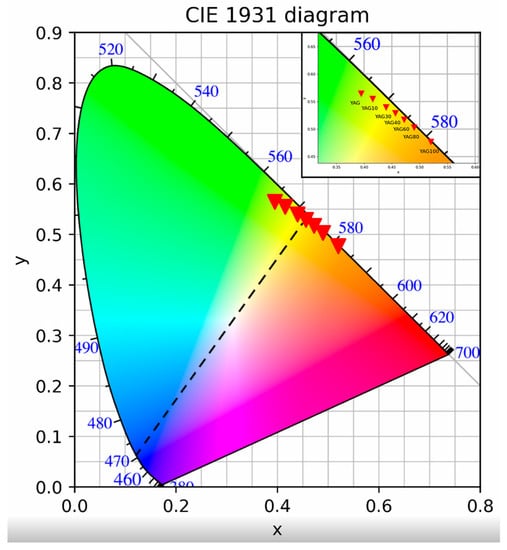
The CIE chromaticity diagram of YGdAG:Ce emission is presented in Figure 7.
The point which represents the color coordinates of a mixture of colors lies on the line connecting the points corresponding to these colors (Figure 7, dashed line). The x coordinate increases and the y coordinate decreases with the growth of gadolinium content. This change in chromaticity with an increase in Gd content is consistent with the data of [29] for YGdAd:Ce powders prepared by the urea combustion method; nevertheless, the y-coordinate of polymer–salt synthesized samples emission is lower. As one can see from Figure 7, the emission of samples with the degree of yttrium substitution by gadolinium 30–40% can be mixed with an emission of 470 nm (wavelength of blue LEDs) in order to fabricate white LEDs. Nevertheless, the precise value of the substitution degree is to be calculated based on the chromaticity of a specific LED since the LED emission spectrum is not monochromatic.
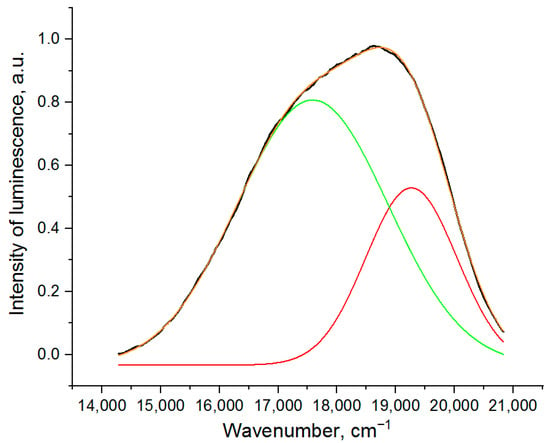
The structure of the cerium luminescence band in the YAG:Ce sample (without Gd) is shown in Figure 8. This band can be deconvoluted into 2 Gaussian bands which correspond to a high energy transition 5d-2F5/2 and a lower energy transition 5d-2F7/2 [68,69,70]. The results of Gaussian fitting for other samples are presented in Table 4 (Section 3.7).
Figure 8.
Structure of the luminescence band of the YAG sample (black line: experimental data, red and green lines: deconvoluted Gaussian peaks, orange line: sum of two Gaussian peaks).
As one can see from Figure 6, both bands shift to longer wavelengths with an increase in the degree of isomorphic substitution of yttrium by gadolinium. At the same time, the relative intensity of the band with a maximum at longer wavelength increases.
3.6. PL Excitation and Diffuse Reflectance Spectra
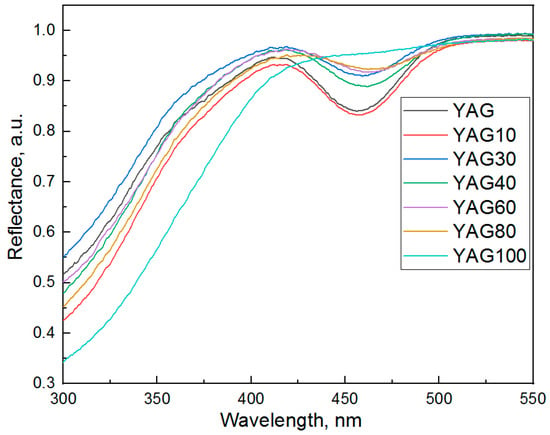
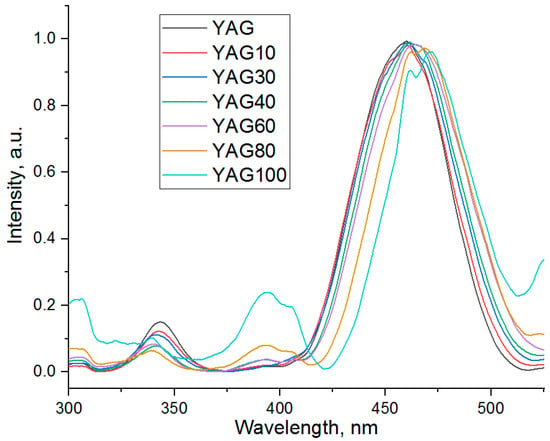
The diffuse reflectance and excitation spectra of synthesized YAG:Ce,Gd nanopowders at the emission wavelength 550 nm are presented in Figure 9 and Figure 10, respectively. The excitation spectra were normalized to (0.1).
Two absorption bands (Figure 9) which are characteristic of cerium ions in the YAG matrix [71,72,73] are observed in the spectrum. Since the morphology of synthesized powders is the same and the same amounts of powders were studied, one can conclude that the intensity of the band with a maximum of about 450 nm tends to decrease with an increase in gadolinium concentration. The cerium absorption band in the YAG-100 sample is not present in Figure 9. Nevertheless, a low-intensity band in this spectral region is observed in the excitation spectrum. Thus, the sensitivity of diffuse reflectance spectroscopy does not allow registration of this band. The values of band maxima are presented in Table 4 (Section 3.7).
Two excitation bands with maxima at about 380 and 450 nm which are characteristic of cerium ions in the YAG matrix [60,71,74] are observed in Figure 10. These bands are due to the electronic transitions from the 4f ground state of cerium ions to 5d states, which are split by the crystal field [29]. An excitation band of YAP:Ce with a maximum of about 300 nm is observed in the spectrum [75]. The relative intensity of this band increases with an increase in gadolinium content. This result is consistent with XRD data which has shown that at higher concentrations of gadolinium, the peaks of the YAP phase are observed in X-ray diffraction patterns of YAG:Ce,Gd. With the increase in the degree of yttrium substitution by gadolinium the band with a maximum of 450 nm shifts to a longer wavelength, and the band with a maximum of 380 nm, on the contrary, shifts to shorter wavelengths.
The bands of unknown origin in the spectral range of 370–425 nm are observed in excitation spectra of YAG:Ce nanopowders with the degree of substitution of yttrium by gadolinium higher than 60%. These bands are not characteristic of cerium ions in YAG and YAP matrix [60,76]. They can be due to the defects formation in YAG or YAP crystal structure.
3.7. Parameters of Luminescence
The values of luminescence, luminescence excitation peaks maxima and diffuse reflectance peaks minima obtained by fitting the spectrum by two Gaussian peaks, quantum yield and luminescence lifetime of YAG:Gd,Ce nanopowders are presented in Table 4. The dependencies of luminescence intensity on wavenumber were fitted, then obtained maxima were recalculated to wavelengths. This approach was applied to all the fitted spectra.
As one can see from the Table 4, the maxima of both cerium luminescence bands shift to longer wavelengths with an increase in gadolinium content. The correlation between diffuse reflectance and excitation peak (Peak 1) maxima is observed since both spectra represent the absorption of cerium ions.
The values of quantum yield lie in the range of 65–75% for samples with low concentrations of gadolinium. This result is consistent with data obtained in [77] where a quantum yield value of 70% was reported for YAG:Ce,Gd phosphors with 5% of yttrium substitution by gadolinium. The same values were obtained for YAG:Ce powders obtained by flame spray synthesis [78].
The value of luminescence lifetime for pure YAG:Ce sample is 66 ns. This result is consistent with the data obtained previously in [41] for sol–gel fabricated YAG:Ce nanoparticles. This value is in the typical range (60–90 ns) for YAG:Ce single crystal [79].
Luminescence lifetime tends to decrease with an increase in gadolinium content, and for samples YAG80 and YAG100, a 50% decrease is observed in comparison with the pure YAG:Ce sample. The same tendency was previously reported in [80] for cerium-doped gadolinium-aluminum garnet powders with isomorphic substitution of aluminum by scandium. The reason for the decrease in luminescence lifetime may be the inevitable deficiency of nanocrystals caused by the incorporation of gadolinium ions into the YAG structure. The increase in a short-decay component can be the reason for a decrease in the average luminescence decay time. Authors of [81] propose that this component is attributed to cerium ions which are close to the surface defects of the nanocrystal.
4. Conclusions
A set of YAG:Ce samples with different degrees of yttrium isomorphic substitution by gadolinium was synthesized via polymer–salt method. Due to its simplicity and efficiency, this method is promising for the synthesis of nanomaterials. The luminescence properties and structure of synthesized powders were studied using X-ray diffraction, ATR-FTIR spectroscopy, scanning electron microscopy and luminescence spectroscopy.
The average size of nanoparticles in synthesized powders lies in the range of 25–30 nm. Based on SEM data, the nanoparticles form porous aggregates with a size of 1–50 μm. The samples with yttrium by gadolinium substitution of less than 60% consist only of the YAG phase. The possibility of pure YAG:Ce synthesis with up to 60% gadolinium substitution using the polymer–salt method was demonstrated. It was shown that the dependence of unit cell parameters on gadolinium content is linear, therefore, gadolinium incorporates into the YAG crystal structure at a wide range of concentrations.
The increase in gadolinium concentration leads to a red-shift of the cerium luminescence band and its long-wave photoluminescence excitation band. The short-wave excitation band shifts to shorter wavelengths. The luminescence and excitation spectra are consistent with the spectra of YAG:Ce single crystal. The luminescence lifetime lies in the typical range for YAG:Ce single crystal for samples with low Y/Gd substitution. A decrease in quantum yield and luminescence lifetime with an increase in the degree of Y/Gd substitution is observed. It can be explained by an increase in the deficiency of nanocrystals due to the incorporation of ions with different ionic radii.
The analysis of the CIE chromaticity diagram of YGdAG:Ce emission shows that for the YGdAG:Ce nanopowders synthesized by the polymer–salt method the degree of Y substitution by Gd 30–40% is optimal for the fabrication of white LEDs based on LED with emission wavelength of 470 nm.
Author Contributions
Conceptualization, S.K.E. and A.A.S.; methodology, D.A.G.; software, M.K.M.; validation, D.V.B., S.K.E. and I.A.A.; formal analysis, D.V.B.; investigation, D.V.B., D.A.G. and I.A.A.; resources, A.A.S.; writing—original draft preparation, D.V.B. and S.K.E.; writing—review and editing, A.A.S. and M.K.M.; visualization, M.K.M.; supervision, S.K.E. All authors have read and agreed to the published version of the manuscript.
Funding
This research received no external funding.
Data Availability Statement
Not available.
Conflicts of Interest
The authors declare no conflict of interest.
References
- Kim, V.K.; Zakharov, A.I.; Chashchin, V.A. Luminophores Based on Aluminum Yttrium Garnet (Review). Glass Ceram. 2014, 71, 64–67. [Google Scholar] [CrossRef]
- Tucureanu, V.; Matei, A.; Avram, A.M. Synthesis and characterization of YAG: Ce phosphors for white LEDs. Opto-Electron. Rev. 2015, 23, 239–251. [Google Scholar] [CrossRef]
- Yi, X.; Zhou, S.; Chen, C.; Lin, H.; Feng, Y.; Wang, K.; Ni, Y. Fabrication of Ce: YAG, Ce, Cr: YAG and Ce: YAG/Ce, Cr: YAG dual-layered composite phosphor ceramics for the application of white LEDs. Ceram. Int. 2014, 40, 7043–7047. [Google Scholar] [CrossRef]
- Shi, H.; Zhu, C.; Huang, J.; Chen, J.; Chen, D.; Wang, W.; Wang, F.; Cao, Y.; Yuan, X. Luminescence properties of YAG: Ce, Gd phosphors synthesized under vacuum condition and their white LED performances. Opt. Mater. Express. 2014, 4, 649–655. [Google Scholar] [CrossRef]
- Fan, T.Y. Heat generation in Nd: YAG and Yb: YAG. IEEE J. Quantum Electron. 1993, 29, 1457–1459. [Google Scholar] [CrossRef]
- Qiu, H.; Yang, P.; Dong, J.; Deng, P.; Xu, J.; Chen, W. The influence of Yb concentration on laser crystal Yb: YAG. Mater. Lett. 2002, 55, 1–7. [Google Scholar] [CrossRef]
- Yu, Y.; Wu, Z.; Zhang, S. Concentration effects of Er3+ ion in YAG: Er laser crystals. J. Alloys Compd. 2000, 302, 204–208. [Google Scholar] [CrossRef]
- Zheng, L.; Liu, M.; Zhang, H.; Zheng, Z.; Wang, Z.; Cheng, H.; Wang, P.; Liu, Y.; Huang, B. Fabrication of ZnO Ceramics with Defects by Spark Plasma Sintering Method and Investigations of Their Photoelectrochemical Properties. Nanomaterials 2021, 11, 2506. [Google Scholar] [CrossRef] [PubMed]
- Bulyga, D.V.; Evstropiev, S.K.; Nashchekin, A.V. Structural engineering of ZnO–MgO intermediates for functional ceramics. Res. Chem. Intermed. 2022, 48, 4785–4796. [Google Scholar] [CrossRef]
- Lv, J.; Li, C.; Chai, Z. Defect luminescence and its mediated physical properties in ZnO. J. Lumin. 2019, 208, 225–237. [Google Scholar] [CrossRef]
- Reshchikov, M.A.; Morkoc, H.; Nemeth, B.; Nause, J.; Xie, J.; Hertog, B.; Osinsky, A. Luminescence properties of defects in ZnO. Phys. B Condens. Matter. 2007, 401, 358–361. [Google Scholar] [CrossRef]
- Eltabey, M.M.; El-Shokrofy, K.M.; Gharbia, S.A. Enhancement of the magnetic properties of Ni–Cu–Zn ferrites by the non-magnetic Al3+-ions substitution. J. Alloys Compd. 2011, 509, 2473–2477. [Google Scholar] [CrossRef]
- Kumar, S.; Supriya, S.; Pradhan, L.K.; Kar, M. Effect of microstructure on electrical properties of Li and Cr substituted nickel oxide. J. Mater. Sci. Mater. Electron. 2017, 28, 16679–16688. [Google Scholar] [CrossRef]
- Jasrotia, R.; Suman; Verma, A.; Verma, R.; Ahmed, J.; Godara, S.K.; Kumar, G.; Mehtab, A.; Ahmad, T.; Kalia, S. Photocatalytic dye degradation efficiency and reusability of Cu-substituted Zn-Mg spinel nanoferrites for wastewater remediation. J. Water Process. Eng. 2022, 48, 102865. [Google Scholar] [CrossRef]
- Bulyga, D.V.; Evstropiev, S.K.; Sadovnichii, R.V.; Khodasevich, M.A. Influence of isomorphic substitution of Y3+ ions by Gd3+ ions on structural and luminescent properties of Yb: YAG nanopowders. Mater. Sci. Eng. B 2022, 285, 115980. [Google Scholar] [CrossRef]
- Wu, Y.; Ding, D.; Pan, S.; Yang, F.; Ren, G. The influence of Sc/Lu ratio on the phase transformation and luminescence of cerium-doped lutetium scandium orthoborate solid solutions. J. Alloys Compd. 2011, 509, 366–371. [Google Scholar] [CrossRef]
- Miao, S.; Xia, Z.; Molokeev, M.S.; Chen, M.; Zhang, J.; Liu, Q.J. Effect of Al/Si substitution on the structure and luminescence properties of CaSrSiO4: Ce3+ phosphors: Analysis based on the polyhedra distortion. Mater. Chem. C 2015, 3, 4616–4622. [Google Scholar] [CrossRef]
- Ming, Z.; Qiao, J.; Molokeev, M.S.; Zhao, J.; Swart, H.C.; Xia, Z. Multiple substitution strategies toward tunable luminescence in Lu2MgAl4SiO12: Eu2+ phosphors. Inorg. Chem. 2020, 59, 1405–1413. [Google Scholar] [CrossRef]
- Allix, M.; Chenu, S.; Véron, E.; Poumeyrol, T.; Kouadri-Boudjelthia, E.A.; Alahraché, S.; Porcher, F.; Massiot, D.; Fayon, F. Considerable improvement of long-persistent luminescence in germanium and tin substituted ZnGa2O4. Chem. Mater. 2013, 25, 600–1606. [Google Scholar] [CrossRef]
- Sobierajska, P.; Pazik, R.; Zawisza, K.; Renaudin, G.; Nedelec, J.M.; Wiglusz, R.J. Effect of lithium substitution on the charge compensation, structural and luminescence properties of nanocrystalline Ca10(PO4)6F2 activated with Eu3+ ions. Cryst. Eng. Comm. 2016, 18, 3447–3455. [Google Scholar] [CrossRef]
- Asatryan, H.R. ESR Study of Mo3+ Containing Mixed Yttrium–Scandium–Aluminium Garnet Single Crystals. Phys. Status Solidi B 1988, 150, 253–259. [Google Scholar] [CrossRef]
- Kokta, M. Solubility enhancement of Nd7+ in scandium-substituted rare earth-aluminum garnets. J. Solid State Chem. 1973, 8, 39–42. [Google Scholar] [CrossRef]
- Feng, Y.; Hu, Z.; Chen, X.; Chen, C.; Ou, Y.; Liu, Y.; Li, W.; Li, J. Fabrication and properties of 10 at.% Yb: Y3Sc1. 5Al3. 5O12 transparent ceramics. Opt. Mater. 2019, 88, 339–344. [Google Scholar] [CrossRef]
- Kozlov, V.V.; Rosanov, N.N.; Wabnitz, S. Obtaining single-cycle pulses from a mode-locked laser. Phys. Rev. A 2011, 84, 053810. [Google Scholar] [CrossRef]
- Luo, D.W.; Xu, C.W.; Zhang, J.; Qin, X.P.; Yang, H.; Tan, W.D.; Cong, Z.; Tang, D. Diode pumped and mode-locked Yb: GdYAG ceramic lasers. Laser Phys. Lett. 2011, 8, 719–722. [Google Scholar] [CrossRef]
- Cockayne, B.; Gasson, D.B.; Findlay, D.; Goodwin, D.W.; Clay, R.A. The growth and laser characteristics of yttrium-gadolinium-aluminium garnet single crystals. J. Phys. Chem. Solids 1968, 29, 905–910. [Google Scholar] [CrossRef]
- Kottaisamy, M.; Thiyagarajan, P.; Mishra, J.; Rao, M.R. Color tuning of Y3Al5O12: Ce phosphor and their blend for white LEDs. Mater. Res. Bull. 2008, 43, 1657–1663. [Google Scholar] [CrossRef]
- Li, K.; Shen, C. White LED based on nano-YAG: Ce3+/YAG: Ce3+, Gd3+ hybrid phosphors. Optik 2012, 123, 621–623. [Google Scholar] [CrossRef]
- Popovici, E.J.; Morar, M.; Bica, E.; Perhaita, I.; Cadis, A.I.; Indrea, E.; Barbu-Tudoran, L. Synthesis and characterization of cerium doped yttrium-gadolinium aluminate phosphors by wet-chemical synthesis route. J. Optoelectron. Adv. Mater. 2011, 13, 617. [Google Scholar]
- Satilmis, S.U.; Ege, A.; Ayvacikli, M.; Khatab, A.; Ekdal, E.; Popovici, E.J.; Can, N. Luminescence characterization of cerium doped yttrium gadolinium aluminate phosphors. Opt. Mater. 2012, 34, 1921–1925. [Google Scholar] [CrossRef]
- Matrosova, A.S.; Kuzmenko, N.K.; Nikonorov, N.V.; Aseev, V.A.; Ananyev, V.A.; Demidov, V.V.; Dukelskii, K.; Evstropiev, S. Formation of Gd2O3: Nd3+ nanocrystals in silica microcapillary preforms and hollow-core anti-resonant optical fibers. Opt. Fiber Technol. 2021, 65, 102547. [Google Scholar] [CrossRef]
- Matrosova, A.; Evstropiev, S.; Demidov, V.; Nikonorov, N.; Aseev, V.; Kuzmenko, N.; Dukelskii, K.; Komarov, A.; Oreshkina, K. Silica microstructure-based optical fiber activated by YAG: Nd3+ nanocrystals. Micro-Struct. Spec. Opt. Fibres VI SPIE 2020, 11355, 38–43. [Google Scholar]
- Moussaoui, A.; Bulyga, D.; Evstropiev, S.; Pchelkin, G.; Shurupov, D.; Demidov, V.; Dukelskii, K. YAG: Ln3+ (Ln = Nd, Yb, Ce) nanocrystals for application in luminescent fiber-based temperature sensors. Opt. Eng. 2023, 62, 037105. [Google Scholar] [CrossRef]
- Evstropiev, S.K.; Demidov, V.V.; Bulyga, D.V.; Sadovnichii, R.V.; Pchelkin, G.A.; Shurupov, D.N.; Podrukhin, Y.; Matrosova, A.; Nikonorov, N.; Dukelskii, K. YAG: R3+ (R = Ce, Dy, Yb) nanophosphor-based luminescent fibre-optic sensors for temperature measurements in the range 20–500 °C. Quantum Elec. 2022, 52, 94. [Google Scholar] [CrossRef]
- Ikesue, A.; Kinoshita, T.; Kamata, K.; Yoshida, K. Fabrication and optical properties of high-performance polycrystalline Nd: YAG ceramics for solid-state lasers. J. Am. Ceram. Soc. 1995, 78, 1033–1040. [Google Scholar] [CrossRef]
- Michalik, D.; Sopicka-Lizer, M.; Plewa, J.; Pawlik, T. Application of mechanochemical processing to synthesis of YAG: Ce garnet powder. Arch. Metall. Mater. 2011, 56, 1257–1264. [Google Scholar] [CrossRef]
- Song, Z.; Liao, J.; Ding, X.; Liu, X.; Liu, Q. Synthesis of YAG phosphor particles with excellent morphology by solid state reaction. J. Cryst. Growth. 2013, 365, 24–28. [Google Scholar] [CrossRef]
- Ikesue, A.; Furusato, I.; Kamata, K. Fabrication of polycrystalline, transparent YAG ceramics by a solid-state reaction method. J. Am. Ceram. Soc. 1995, 78, 225–228. [Google Scholar] [CrossRef]
- Veith, M.; Mathur, S.; Kareiva, A.; Jilavi, M.; Zimmer, M.; Huch, V. Low temperature synthesis of nanocrystalline Y3Al5O12 (YAG) and Ce-doped Y3Al5O12 via different sol–gel methods. J. Mater. Chem. A 1999, 9, 3069–3079. [Google Scholar] [CrossRef]
- Sun, Z.; Yuan, D.; Li, H.; Duan, X.; Sun, H.; Wang, Z.; Wei, X.; Xu, H.; Luan, C.; Xu, D.; et al. Synthesis of yttrium aluminum garnet (YAG) by a new sol–gel method. J. Alloys Compd. 2004, 379, L1–L3. [Google Scholar] [CrossRef]
- Katelnikovas, A.; Vitta, P.; Pobedinskas, P.; Tamulaitis, G.; Žukauskas, A.; Jørgensen, J.E.; Kareiva, A. Photoluminescence in sol–gel-derived YAG: Ce phosphors. J. Cryst. Growth. 2007, 304, 361–368. [Google Scholar] [CrossRef]
- Zhang, K.; Liu, H.; Wu, Y.; Hu, W. Synthesis of (Y, Gd) 3Al5O12: Ce nanophosphor by co-precipitation method and its luminescence behavior. J. Mater. Sci. 2007, 42, 9200–9204. [Google Scholar] [CrossRef]
- Li, J.G.; Ikegami, T.; Lee, J.H.; Mori, T.; Yajima, Y. Co-precipitation synthesis and sintering of yttrium aluminum garnet (YAG) powders: The effect of precipitant. J. Eur. Ceram. Soc. 2000, 20, 2395–2405. [Google Scholar] [CrossRef]
- Xu, G.; Zhang, X.; He, W.; Liu, H.; Li, H.; Boughton, R.I. Preparation of highly dispersed YAG nano-sized powder by co-precipitation method. Mater. Lett. 2006, 60, 962–965. [Google Scholar] [CrossRef]
- Ramanathan, S.; Kakade, M.B.; Roy, S.K.; Kutty, K.K. Processing and characterization of combustion synthesized YAG powders. Ceram. Int. 2003, 29, 477–484. [Google Scholar] [CrossRef]
- Yang, Z.; Li, X.; Yang, Y.; Li, X. The influence of different conditions on the luminescent properties of YAG: Ce phosphor formed by combustion. J. Lumin. 2007, 122, 707–709. [Google Scholar] [CrossRef]
- Gupta, K.V.K.; Muley, A.; Yadav, P.; Joshi, C.P.; Moharil, S.V. Combustion synthesis of YAG: Ce and related phosphors. Appl. Phys. B 2011, 105, 479–484. [Google Scholar] [CrossRef]
- Evstropiev, S.K.; Gatchin, Y.A.; Evstropyev, K.S.; Romanova, E.B. Spectral properties of ZnO and ZnO-Al2O3 coatings prepared by polymer–salt method. Opt. Eng. 2016, 55, 047108. [Google Scholar] [CrossRef]
- Sokolov, I.S.; Maslennikov, S.Y.; Evstropiev, S.K.; Mironov, L.Y.; Nikonorov, N.V.; Oreshkina, K.V. YAG: Ce3+ phosphor nanopowders and thin textured coatings prepared by polymer–salt method. Opt. Eng. 2019, 58, 027103. [Google Scholar] [CrossRef]
- Matrosova, A.S.; Kuz’menko, N.K.; Evstrop’ev, S.K.; Aseev, V.A.; Danilovich, D.P.; Nikonorov, N.V.; Dukel’skii, K.V. Synthesis of Nanosized Luminophores Gd2O3: Nd3+ by Polymer–Salt Method and Study of Their Main Characteristics. Opt. Spectrosc. 2021, 129, 662–669. [Google Scholar] [CrossRef]
- Sasaki, Y.; Takeshita, S.; Isobe, T. Preparation, photoluminescence, and photostability of transparent composite films of glycothermally synthesized YAG: Ce3+ nanoparticles for white LED. ECS J. Solid State Sci. Technol. 2015, 5, R3049. [Google Scholar] [CrossRef]
- Arefina, I.A.; Kurshanov, D.A.; Vedernikova, A.A.; Danilov, D.V.; Koroleva, A.V.; Zhizhin, E.V.; Sergeev, A.A.; Fedorov, A.V.; Ushakova, E.V.; Rogach, A.L. Carbon Dot Emission Enhancement in Covalent Complexes with Plasmonic Metal Nanoparticles. Nanomaterials 2023, 13, 223. [Google Scholar] [CrossRef] [PubMed]
- Muniz, F.T.L.; Miranda, M.R.; Morilla dos Santos, C.; Sasaki, J.M. The Scherrer equation and the dynamical theory of X-ray diffraction. Acta Crystallogr. A 2016, 72, 385–390. [Google Scholar] [CrossRef] [PubMed]
- Slack, G.A.; Oliver, D.W.; Chrenko, R.M.; Roberts, S. Optical absorption of Y3Al5O12 from 10 to 55,000 cm−1 wave numbers. Phys. Rev. 1969, 177, 1308. [Google Scholar] [CrossRef]
- Raju, G.S.R.; Park, J.Y.; Jung, H.C.; Moon, B.K.; Jeong, J.H.; Kim, J.H. Luminescence properties of Dy3+: GdAlO3 nanopowder phosphors. Curr. Appl. Phys. 2009, 9, e92–e95. [Google Scholar] [CrossRef]
- Upadhyay, K.; Tamrakar, R.K.; Dubey, V. High temperature solid state synthesis and photoluminescence behavior of Eu3+ doped GdAlO3 nanophosphor. Superlattices Microstruct. 2015, 78, 116–124. [Google Scholar] [CrossRef]
- Wang, X.L.; Yang, Z.; Li, J.; Fu, W.F.; Tang, P.; Chen, Y.F.; Guo, J.; Gao, Z.-H.; Huang, Y.; Tao, Y. Hydrothermal synthesis, morphology and luminescent properties of GdAlO3: Eu3+ microcrystals. J. Alloys Compd. 2014, 614, 40–43. [Google Scholar] [CrossRef]
- Chaudhury, S.; Parida, S.C.; Pillai, K.T.; Mudher, K.S. High-temperature X-ray diffraction and specific heat studies on GdAlO3, Gd3Al5O12 and Gd4Al2O9. J. Solid State Chem. 2007, 180, 2393–2399. [Google Scholar] [CrossRef]
- Shishido, T.; Okamura, K.; Yajima, S. Gd3Al5O12 phase obtained by crystallization of amorphous Gd2O3 5/3Al2O3. J. Am. Ceram. Soc. 1978, 61, 373–375. [Google Scholar] [CrossRef]
- Tucureanu, V.; Matei, A.; Mihalache, I.; Danila, M.; Popescu, M.; Bita, B. Synthesis and characterization of YAG: Ce, Gd and YAG: Ce, Gd/PMMA nanocomposites for optoelectronic applications. J. Mater. Sci. 2015, 50, 1883–1890. [Google Scholar] [CrossRef]
- Schiopu, V.; Matei, A.; Dinescu, A.; Danila, M.; Cernica, I. Ce, Gd codoped YAG nanopowder for white light emitting device. J. Nanosci. Nanotechnol. 2012, 12, 8836–8840. [Google Scholar] [CrossRef] [PubMed]
- Papagelis, K.; Ves, S. Infrared spectroscopy and lattice dynamical calculations of Gd3Al5O12, Tb3Al5O12 and Lu3Al5O12 single crystals. J. Phys. Chem. Solids 2003, 64, 599–605. [Google Scholar] [CrossRef]
- Kumar, P.; Singh, S.; Gupta, I.; Nehra, K.; Kumar, V.; Singh, D. Structural refinement and optical characteristics of single-phase Gd3Al5O12: Er3+ nanophosphors for luminescent applications. J. Lumin. 2022, 252, 119338. [Google Scholar] [CrossRef]
- Teng, X.; Li, J.; Duan, G.; Liu, Z. Development of Tb3+ activated gadolinium aluminate garnet (Gd3Al5O12) as highly efficient green-emitting phosphors. J. Lumin. 2016, 179, 165–170. [Google Scholar] [CrossRef]
- Tamrakar, R.K.; Upadhyay, K.; Bisen, D.P. Variation in luminescence behavior of Yb3+ doped GdAlO3 phosphor with gradual increase in Yb3+ concentration. Infrared Phys. Technol. 2016, 75, 160–167. [Google Scholar] [CrossRef]
- Jisha, P.K.; Naik, R.; Prashantha, S.C.; Nagaswarupa, H.P.; Nagabhushana, H.; Basavaraj, R.B.; Sharma, S.C.; Prasad, D. Structural refinement, band-gap analysis and optical properties of GdAlO3 nanophosphors influenced by Dy3+ ion concentrations for white light emitting device applications. Mater. Res. Express. 2016, 3, 045007. [Google Scholar] [CrossRef]
- Chen, L.; Chen, X.; Liu, F.; Chen, H.; Wang, H.; Zhao, E.; Chen, S.; Jiang, Y.; Chan, T.-S.; Wang, C.-H.; et al. Charge deformation and orbital hybridization: Intrinsic mechanisms on tunable chromaticity of Y3Al5O12: Ce3+ luminescence by doping Gd3+ for warm white LEDs. Sci. Rep. 2015, 5, 11514. [Google Scholar] [CrossRef]
- Lisitsyn, V.M.; Ju, Y.; Stepanov, S.A.; Soschin, N.M. Complex study on photoluminescence properties of YAG: Ce, Gd phosphors. J. Phys. Conf. Ser. 2017, 830, 012160. [Google Scholar] [CrossRef]
- Guerbous, L.; Boukerika, A. Nanomaterial host bands effect on the photoluminescence properties of Ce-doped YAG nanophosphor synthesized by sol-gel method. J. Nanomater. 2015, 16, 97. [Google Scholar] [CrossRef]
- Dotsenko, V.P.; Berezovskaya, I.V.; Voloshinovskii, A.S.; Zadneprovski, B.I.; Efryushina, N.P. Luminescence properties and electronic structure of Ce3+-doped gadolinium aluminum garnet. Mater. Res. Bull. 2015, 64, 151–155. [Google Scholar] [CrossRef]
- Bachmann, V.; Ronda, C.; Meijerink, A. Temperature quenching of yellow Ce3+ luminescence in YAG: Ce. Chem. Mater. 2009, 21, 2077–2084. [Google Scholar] [CrossRef]
- Guan, R.; Cao, L.; You, Y.; Cao, Y. The luminescence properties and energy transfer from Ce3+ to Pr3+ for YAG: Ce3+ Pr3+ phosphors. J. Nanomater. 2015, 2015, 3. [Google Scholar] [CrossRef]
- Zhou, X.; Luo, X.; Wu, B.; Jiang, S.; Li, L.; Luo, X.; Pang, Y. The broad emission at 785 nm in YAG: Ce3+, Cr3+ phosphor. Spectrochim. Acta A Mol. Biomol. Spectrosc. 2018, 190, 76–80. [Google Scholar] [CrossRef]
- Li, Q.; Gao, L.; Yan, D. The crystal structure and spectra of nano-scale YAG: Ce3+. Mater. Chem. Phys. 2000, 64, 41–44. [Google Scholar] [CrossRef]
- De Queiroz, T.B.; Ferrari, C.R.; Ulbrich, D.; Doyle, R.; de Camargo, A.S.S. Luminescence characteristics of YAP: Ce scintillator powders and composites. Opt. Mater. 2010, 32, 1480–1484. [Google Scholar] [CrossRef]
- Park, J.Y.; Jung, H.C.; Raju, G.S.R.; Moon, B.K.; Jeong, J.H.; Son, S.M.; Kim, J.H. Sintering temperature effect on structural and luminescence properties of 10 mol% Y substituted Gd3Al5O12: Ce phosphors. Opt. Mater. 2009, 32, 293–296. [Google Scholar] [CrossRef]
- Tucureanu, V.; Matei, A.; Popescu, M.C.; Mihalache, I.; Avram, A.; Tincu, B.; Avram, M.; Munteanu, D. Spectroscopic techniques for the characterization of the YAG: Ce, Gd phosphors and PDMS-YAG: Ce, Gd composites. J. Optoelectron. Adv. Mater. 2019, 21, 518–523. [Google Scholar]
- Borlaf, M.; Kubrin, R.; Aseev, V.; Petrov, A.Y.; Nikonorov, N.; Graule, T. Deep submicrometer YAG: Ce phosphor particles with high photoluminescent quantum yield prepared by flame spray synthesis. J. Am. Ceram. Soc. 2017, 100, 3784–3793. [Google Scholar] [CrossRef]
- Zych, E.; Brecher, C.; Wojtowicz, A.J.; Lingertat, H. Luminescence properties of Ce-activated YAG optical ceramic scintillator materials. J. Lumin. 1997, 75, 193–203. [Google Scholar] [CrossRef]
- Hu, C.; Liu, G.; Wang, M.; Ma, S.; Zhang, J.; Wu, J.; Ye, Z. Preparation and characterization of Gd3 (ScAl) 2Al3O12: Ce3+ garnet phosphors towards high-color-rendering white-light illumination. J. Lumin. 2021, 235, 118062. [Google Scholar] [CrossRef]
- Pankratov, V.; Grigorjeva, L.; Millers, D.; Chudoba, T. Luminescence of cerium doped YAG nanopowders. Radiat. Meas. 2007, 42, 679–682. [Google Scholar] [CrossRef]
Disclaimer/Publisher’s Note: The statements, opinions and data contained in all publications are solely those of the individual author(s) and contributor(s) and not of MDPI and/or the editor(s). MDPI and/or the editor(s) disclaim responsibility for any injury to people or property resulting from any ideas, methods, instructions or products referred to in the content. |
© 2023 by the authors. Licensee MDPI, Basel, Switzerland. This article is an open access article distributed under the terms and conditions of the Creative Commons Attribution (CC BY) license (https://creativecommons.org/licenses/by/4.0/).

