Article

Gemological and Chemical Composition Characteristics of Basalt-Related Rubies from Chanthaburi-Trat, Thailand

1
School of Gemology, China University of Geosciences Beijing, Beijing 100083, China
2
State Key Laboratory of Geological Processes and Mineral Resources, China University of Geosciences, Beijing 100083, China
3
The Beijing SHRIMP Center, Chinese Academy of Geological Sciences, Beijing 100037, China
*
Author to whom correspondence should be addressed.
Crystals 2023, 13(8), 1179; https://doi.org/10.3390/cryst13081179
Submission received: 6 July 2023 / Revised: 19 July 2023 / Accepted: 26 July 2023 / Published: 28 July 2023
(This article belongs to the Section Mineralogical Crystallography and Biomineralization)

Abstract

:
The geographic origin determination of ruby is increasingly important in the gem trade and geological research. Unlike metamorphic-related ruby, the rarer basalt-related ruby has gained significant attention, especially from Thailand, a major producer of such gems. Thai rubies are classified as magmatic-related origin rubies, which can be found as xenocrysts (xenoliths) hosted by alkali basalts. This paper focuses on the gemological characteristics, inclusion morphology, identification, and geochemistry of basalt-hosted ruby from the Chanthaburi-Trat area in Thailand. Various instruments, including gemological conventional ones, Raman Spectrometer, EPMA, and LA-ICP-MS were used for the analysis. This study aimed to identify the distinctive characteristics of rubies from Thailand and find feasible methods for their geographic origin determination, in comparison with rubies from Cambodia, Myanmar, and Mozambique. Thailand samples exhibit diverse inclusion scenes and contain a variety of crystal or mineral inclusions. Raman spectroscopy results indicate the presence of anorthite, titanium oxide, and gypsum inclusions. The main chemical composition of the ruby consists of Al2O3, with trace elements including Fe, Cr, Si, Mg, Ti, Ga, V, Ca, and Ni. The color of Thailand ruby is correlated with the content of Cr and Fe. Chemical diagrams illustrating the contents of Fe, Mg, Cr, V, Ti, and Ga offer reasonable discrimination tools for differentiating rubies from various deposit types. The chemical compositions and inclusion characteristics of rubies from Thailand serve as reliable indicators for their origin identification. This study is an advantageous supplement to the research on Thailand rubies.

1. Introduction

Ruby, the red gem variety of the mineral corundum [1] (α-Al2O3 is nominally colorless) appears in pink to red color when the lattice position of Al3+ is replaced by Cr3+, depending on the extent of the substitution [2]. This precious gemstone is cherished for its vibrant color and brilliant luster. Gem-quality ruby is found in a limited number of primary metamorphic and magmatic rock types that are depleted in silica and enriched in alumina, as well as in secondary placers formed through the erosion of these rocks [3]. Ruby deposits can be found all over the world; each region hosts ruby with its own unique characteristics. Notable areas include Myanmar, Tanzania, Mozambique, Thailand, Cambodia, Vietnam, and others.
With the decline in production from the Mogok area of Myanmar, other regions in Southeast Asia, such as Thailand, Cambodia, and Vietnam, have emerged as significant sources of ruby deposits. Since the late 19th century, Thailand has progressively established itself as a major global supplier of rubies [4]. Although Thai rubies have a great value, their color is not as vibrant due to the presence of a high iron content. While the overall quality of these rubies may not match that of Myanmar rubies, exceptional stones can still be found. The properties of Thai ruby have been described in several studies [3,4,5,6,7,8,9,10,11,12,13,14,15,16,17]. These studies have also explored different types of mineral inclusions [4,5,6,7,8,9,10,11,12,13,14,15] and investigated the chemical composition [7,10,11,12,15] and isotopes [16,17] of these rubies.
The determination of origin is becoming increasingly important in the gem trade due to the substantial difference in value among rubies from various sources. Previous research has primarily explored the connections between the properties or features of individual gems and the geology of their deposits to determine geographic origin. The present study examines the gemological and chemical characteristics of the Thai basalt-related rubies and compares them with those of rubies from other locations, in order to identify the distinctive origin traits of the Thai basalt-related ruby.

2. Materials and Methods

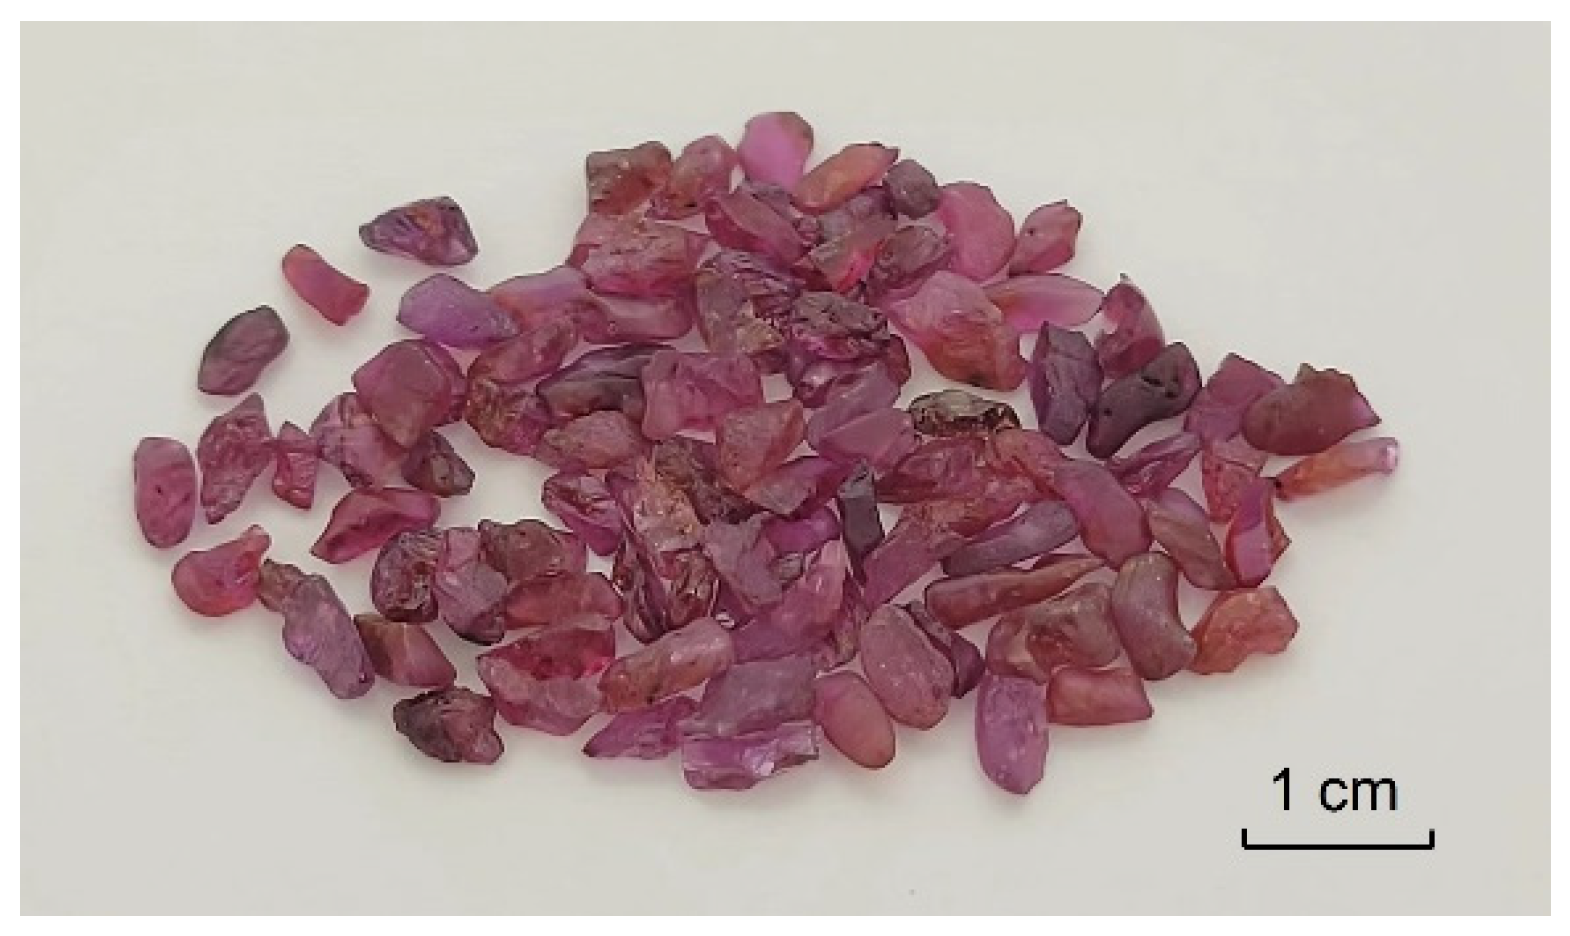
The rubies analyzed in this study were collected from the placer near the Chanthaburi-Trat area (referred to as C-T), in Thailand (Figure 1). Eighty-one (81) ruby samples were selected for analysis in depth (Figure 2). The analyzed samples were small in size (usually 2~5 mm, and 0.1~0.35 ct), but of gem quality and transparency. The color of these rubies generally ranges from violet to reddish-violet and red. Most of the rubies were waterworn which tended to be rounded to angular fragments not showing any crystal faces; however, a few rubies were generally flat, showing tabular hexagonal prisms.
After careful preliminary observation, 15 rubies without any visible inclusions were polished and embedded in an epoxy resin. Subsequently, these rubies were subjected to main and trace element analysis using both electron probe micro analyzer (EPMA) and laser ablation inductively coupled plasma mass spectrometry (LA-ICP-MS, Hefei, China). In addition, the gemological properties of the remaining samples, including specific gravity, refractive indices, polychromatism, and ultraviolet fluorescence, were measured using standard gemological equipment.
External and internal features were observed and photographed using a GI-MP22 binocular gemological microscope (Beijing, China). Darkfield, brightfield, and fiber-optic illumination techniques were employed. After careful selection under a microscope, ruby samples containing mineral inclusions were polished as slabs. This process aimed to enhance the visibility of mineral inclusions and bring them as close to the surface as possible. Mineral inclusions were identified using HR-Evolution Raman spectroscopy with a Renishaw in the Via Raman microscope system (Beijing, China). The Raman spectra were excited by an Arion laser operating at 532 nm, ranging from 1000 to 100 cm−1, and averaging up to three scans. All of the aforementioned analyses were conducted at the Gem Research Laboratory of the School of Gemmology, China University of Geosciences, Beijing.
The chemical composition was performed for major elements on a four-spectrometer Jeol JXA 8100 electron probe microanalyzer (Hangzhou, China) in the Key Laboratory of Submarine Geoscience, State Oceanic Administration, Second Institute of Oceanography, Ministry of Natural Administration, using an accelerating potential of 15 kV, a beam current of 100 nA, a counting time of the 20 s, and a spot size of 10 m. Trace element compositions of rubies were performed using LA-ICP-MS, which was equipped with an Argilent7900 laser ablation system in the Ore Deposit and Exploration Centre, School of Resources and Environmental Engineering, Hefei University of Technology.

3. Results

3.1. Gemological Properties

The rubies found in Thailand exhibit a range of colors, including light red, purplish red, red, and intense red, and these colors are evenly distributed within individual samples. Most rubies in this region have a high level of transparency. However, some samples contain cleavages, cracks, or brown impurities (Figure 3a), which can affect the overall transparency of the gemstone. The crystals generally displayed tabular habits and two to three sets of cleavage can be seen on the surface (Figure 3b). Some rough rubies also show slightly rounded edges and a corroded surface (Figure 3c), which is believed to be caused by the hot carrier magma commonly observed in corundum from basaltic terrains [18].
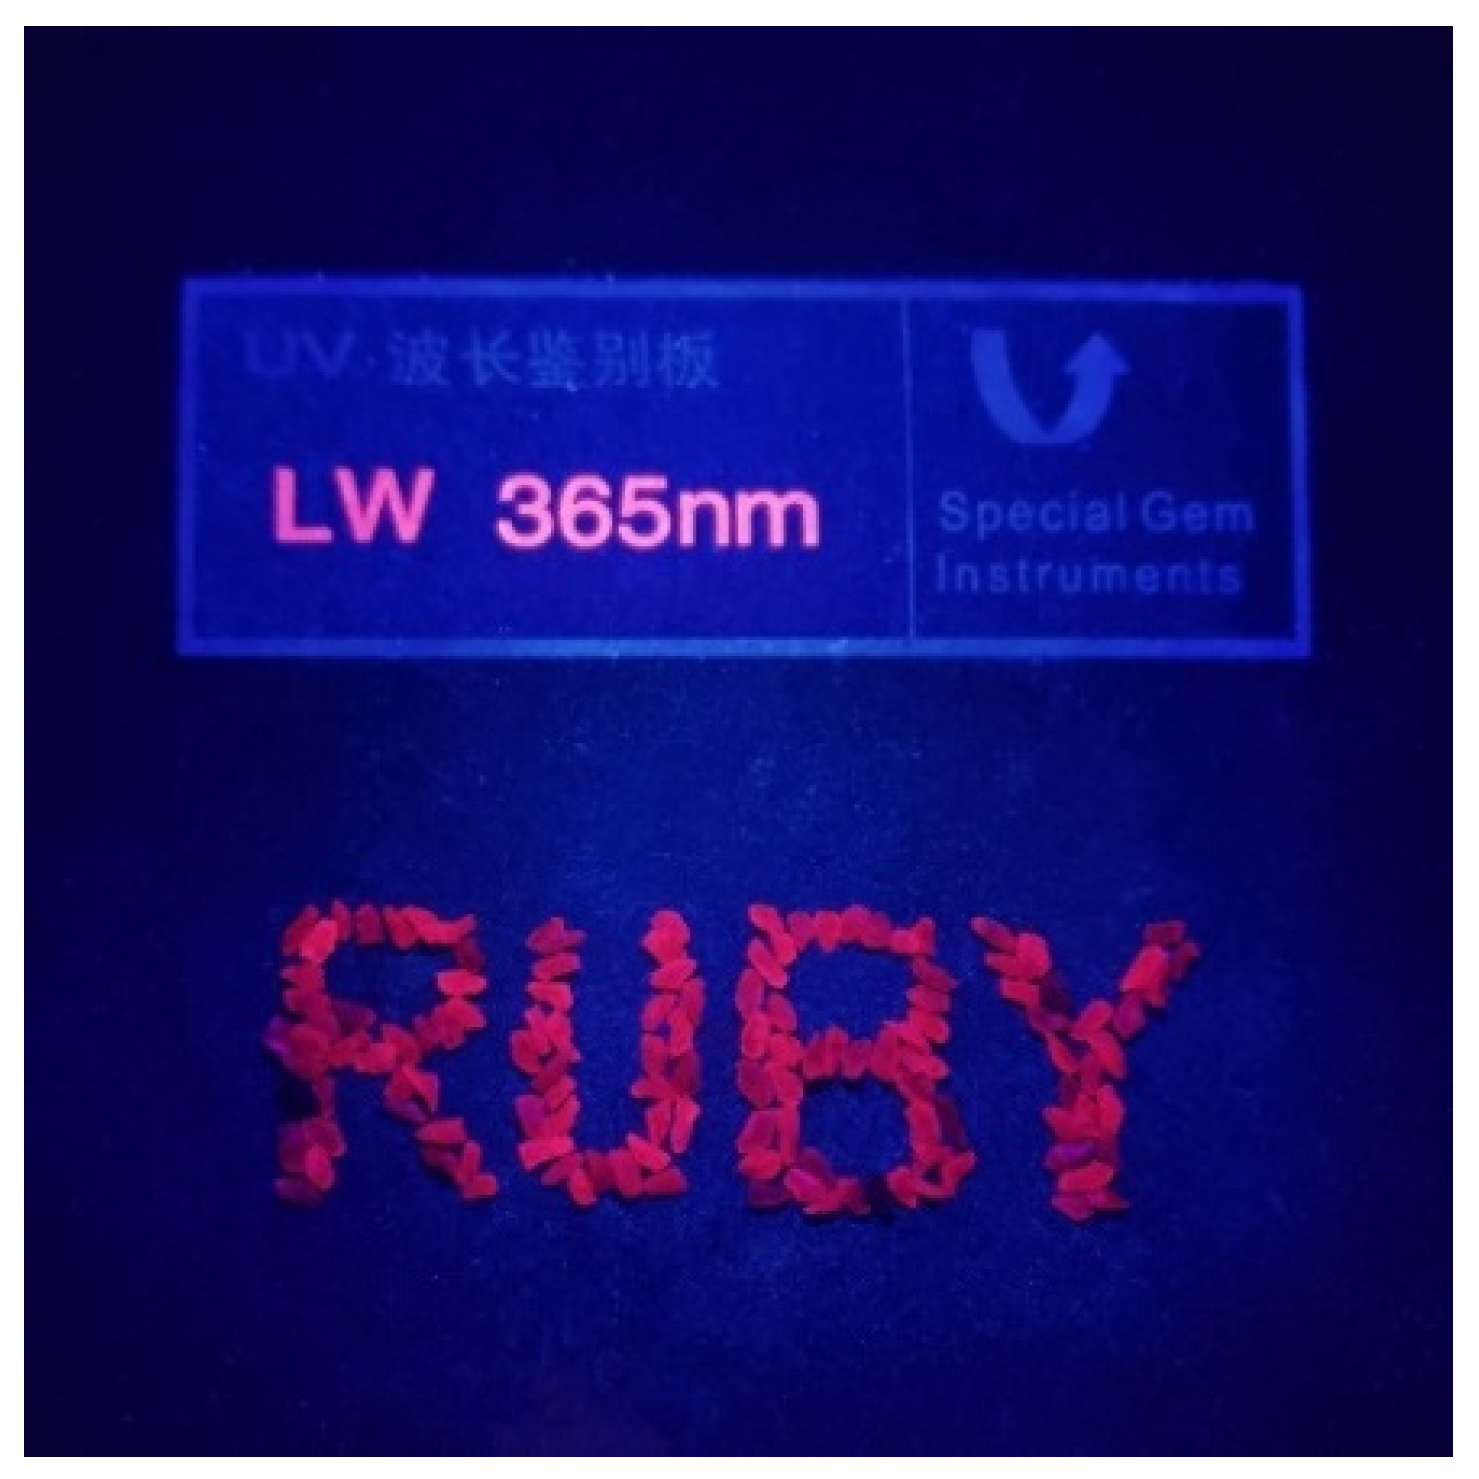
The average specific gravity of Thai rubies, determined using the hydrostatic weighing method, was found to be 4.00. The samples exhibited double refraction, with a refractive index (RI) ranging from 1.760 ± 0.002 to 1.770 ± 0.002 and a birefringence of 0.009 to 0.010. The refractive indices, birefringence, and specific gravity values of Thailand ruby fell within typical values for corundum, and there was little difference in these properties. Most of the rubies showed inert to moderate red fluorescence under long-wave UV (365 nm) radiation and were inert under short-wave UV (254 nm) (Figure 4).

3.2. Microscopic Characteristics and Inclusion Raman Spectra

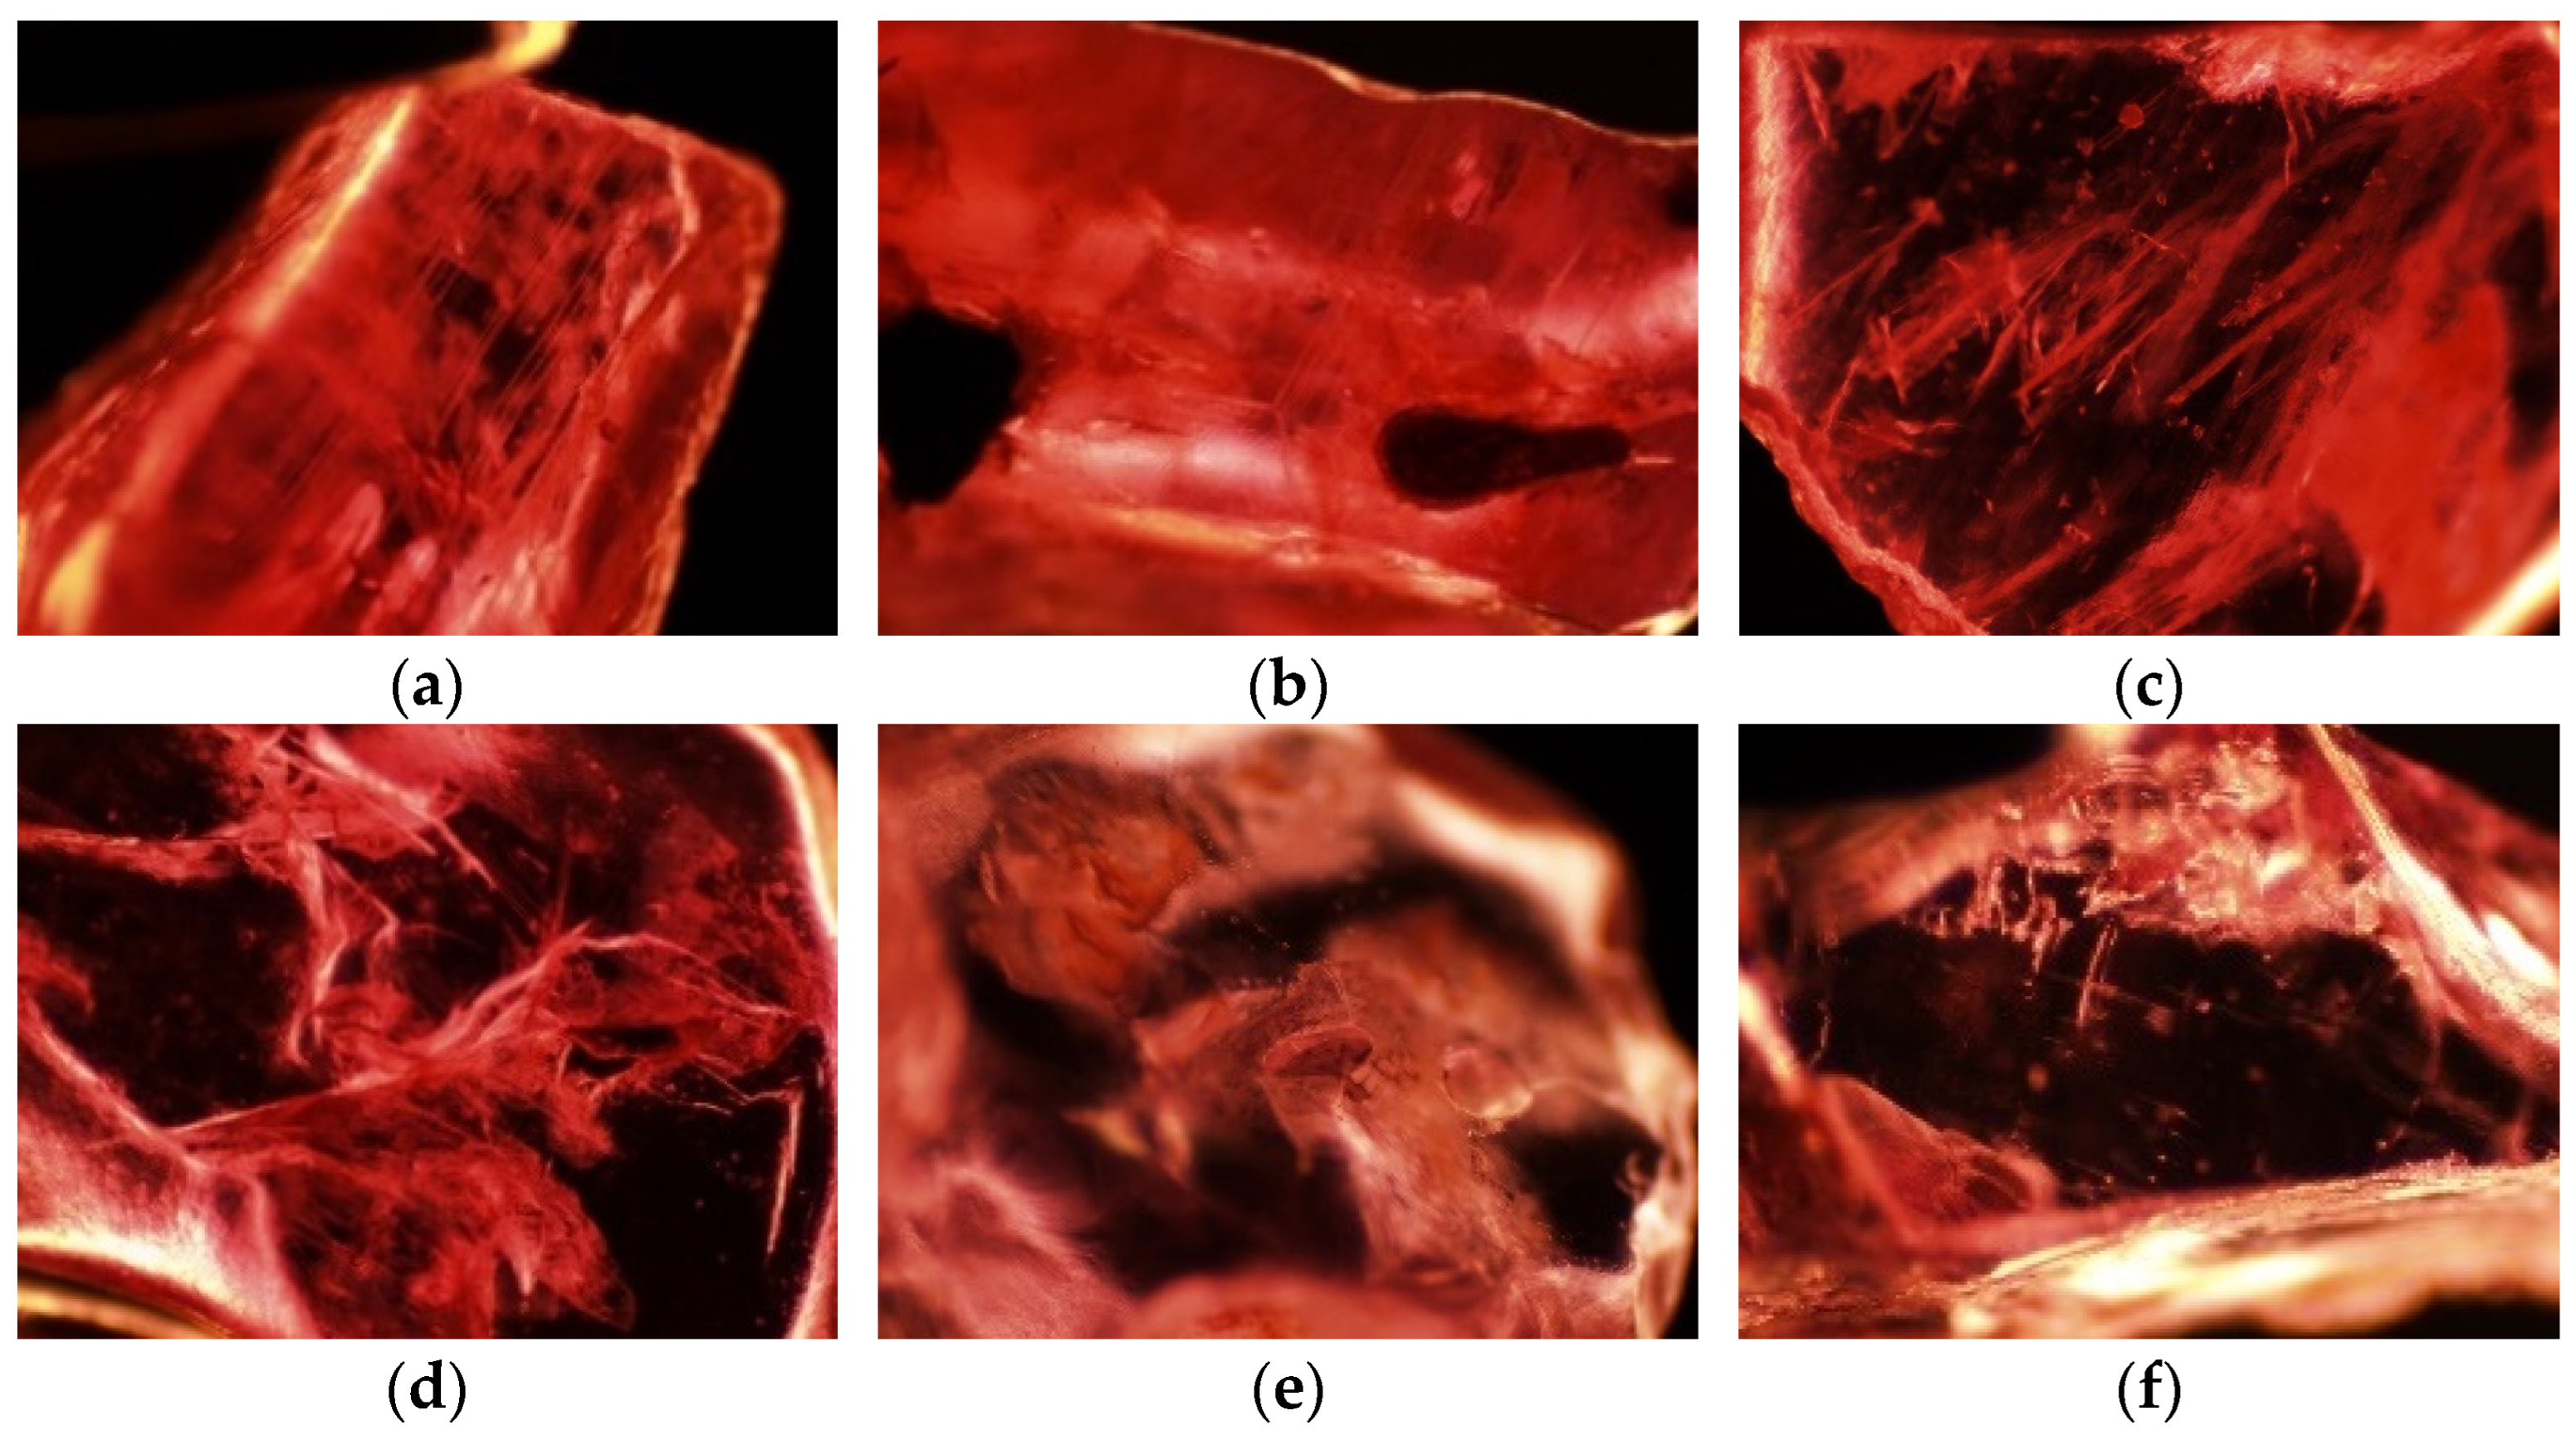
Microscopic study revealed the presence of multifarious internal inclusions in C-T basalt-related rubies. Prevalent were two to three sets of polysynthetic twinning planes (Figure 5a), with growth tubules between twinned domains often filled with diaspore or other aluminum hydroxides, which is a characteristic feature of Thailand rubies. Notably, an ‘architectural eagle frame’ was observed when three groups of growth tubules intersected at right angles (Figure 5b), while a ‘whisker edge’ was observed when the edge of some tubules was connected by small fissures (Figure 5c). Samples often exhibited naturally healed fractures or fingerprints (Figure 5d), which extended to the surface and were stained by secondary materials. Euhedral crystals surrounded by fluid fingerprints or tension cracks (Figure 5e) are noticeable.
Negative crystals surrounded by partially healed decrepitation halos were occasionally observed. Networks of minute crystals with equatorial thin films exhibit iridescent interference colors during observation under fiber-optic illumination. It is noteworthy that these partially healed decrepitation halos are consistently oriented in the same crystallographic direction, without being centered around a crystal inclusion (Figure 5f).
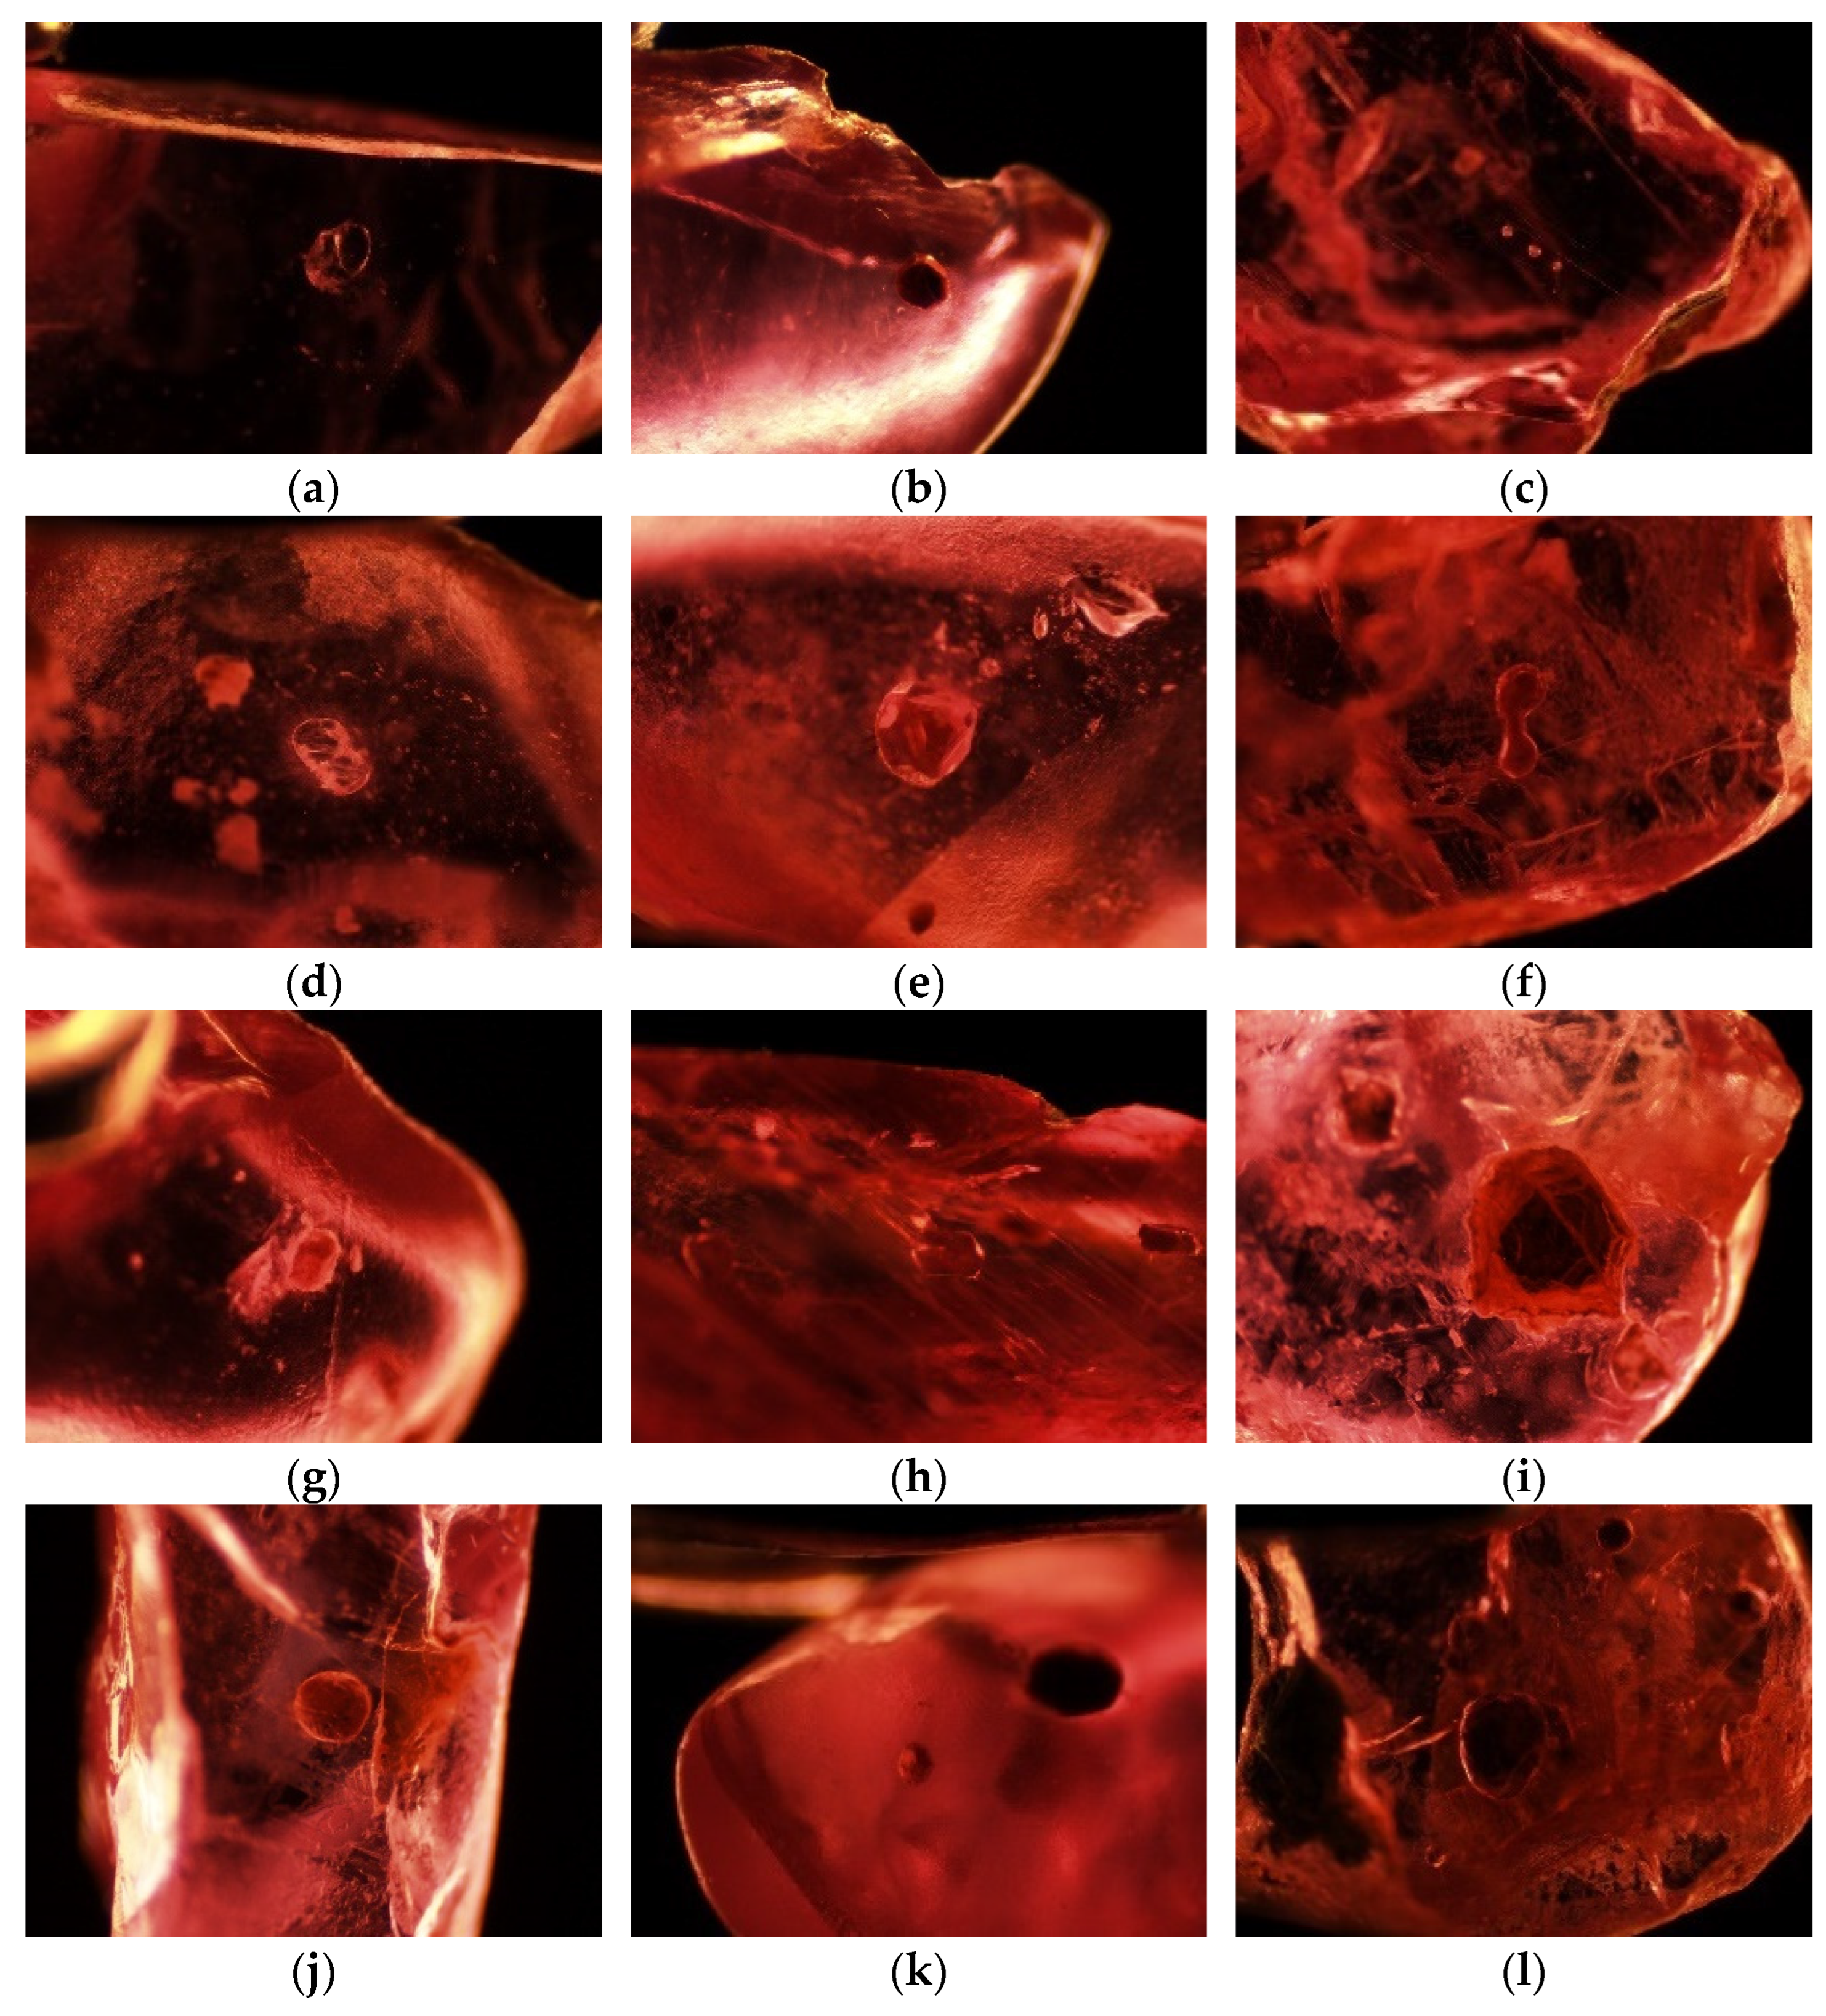
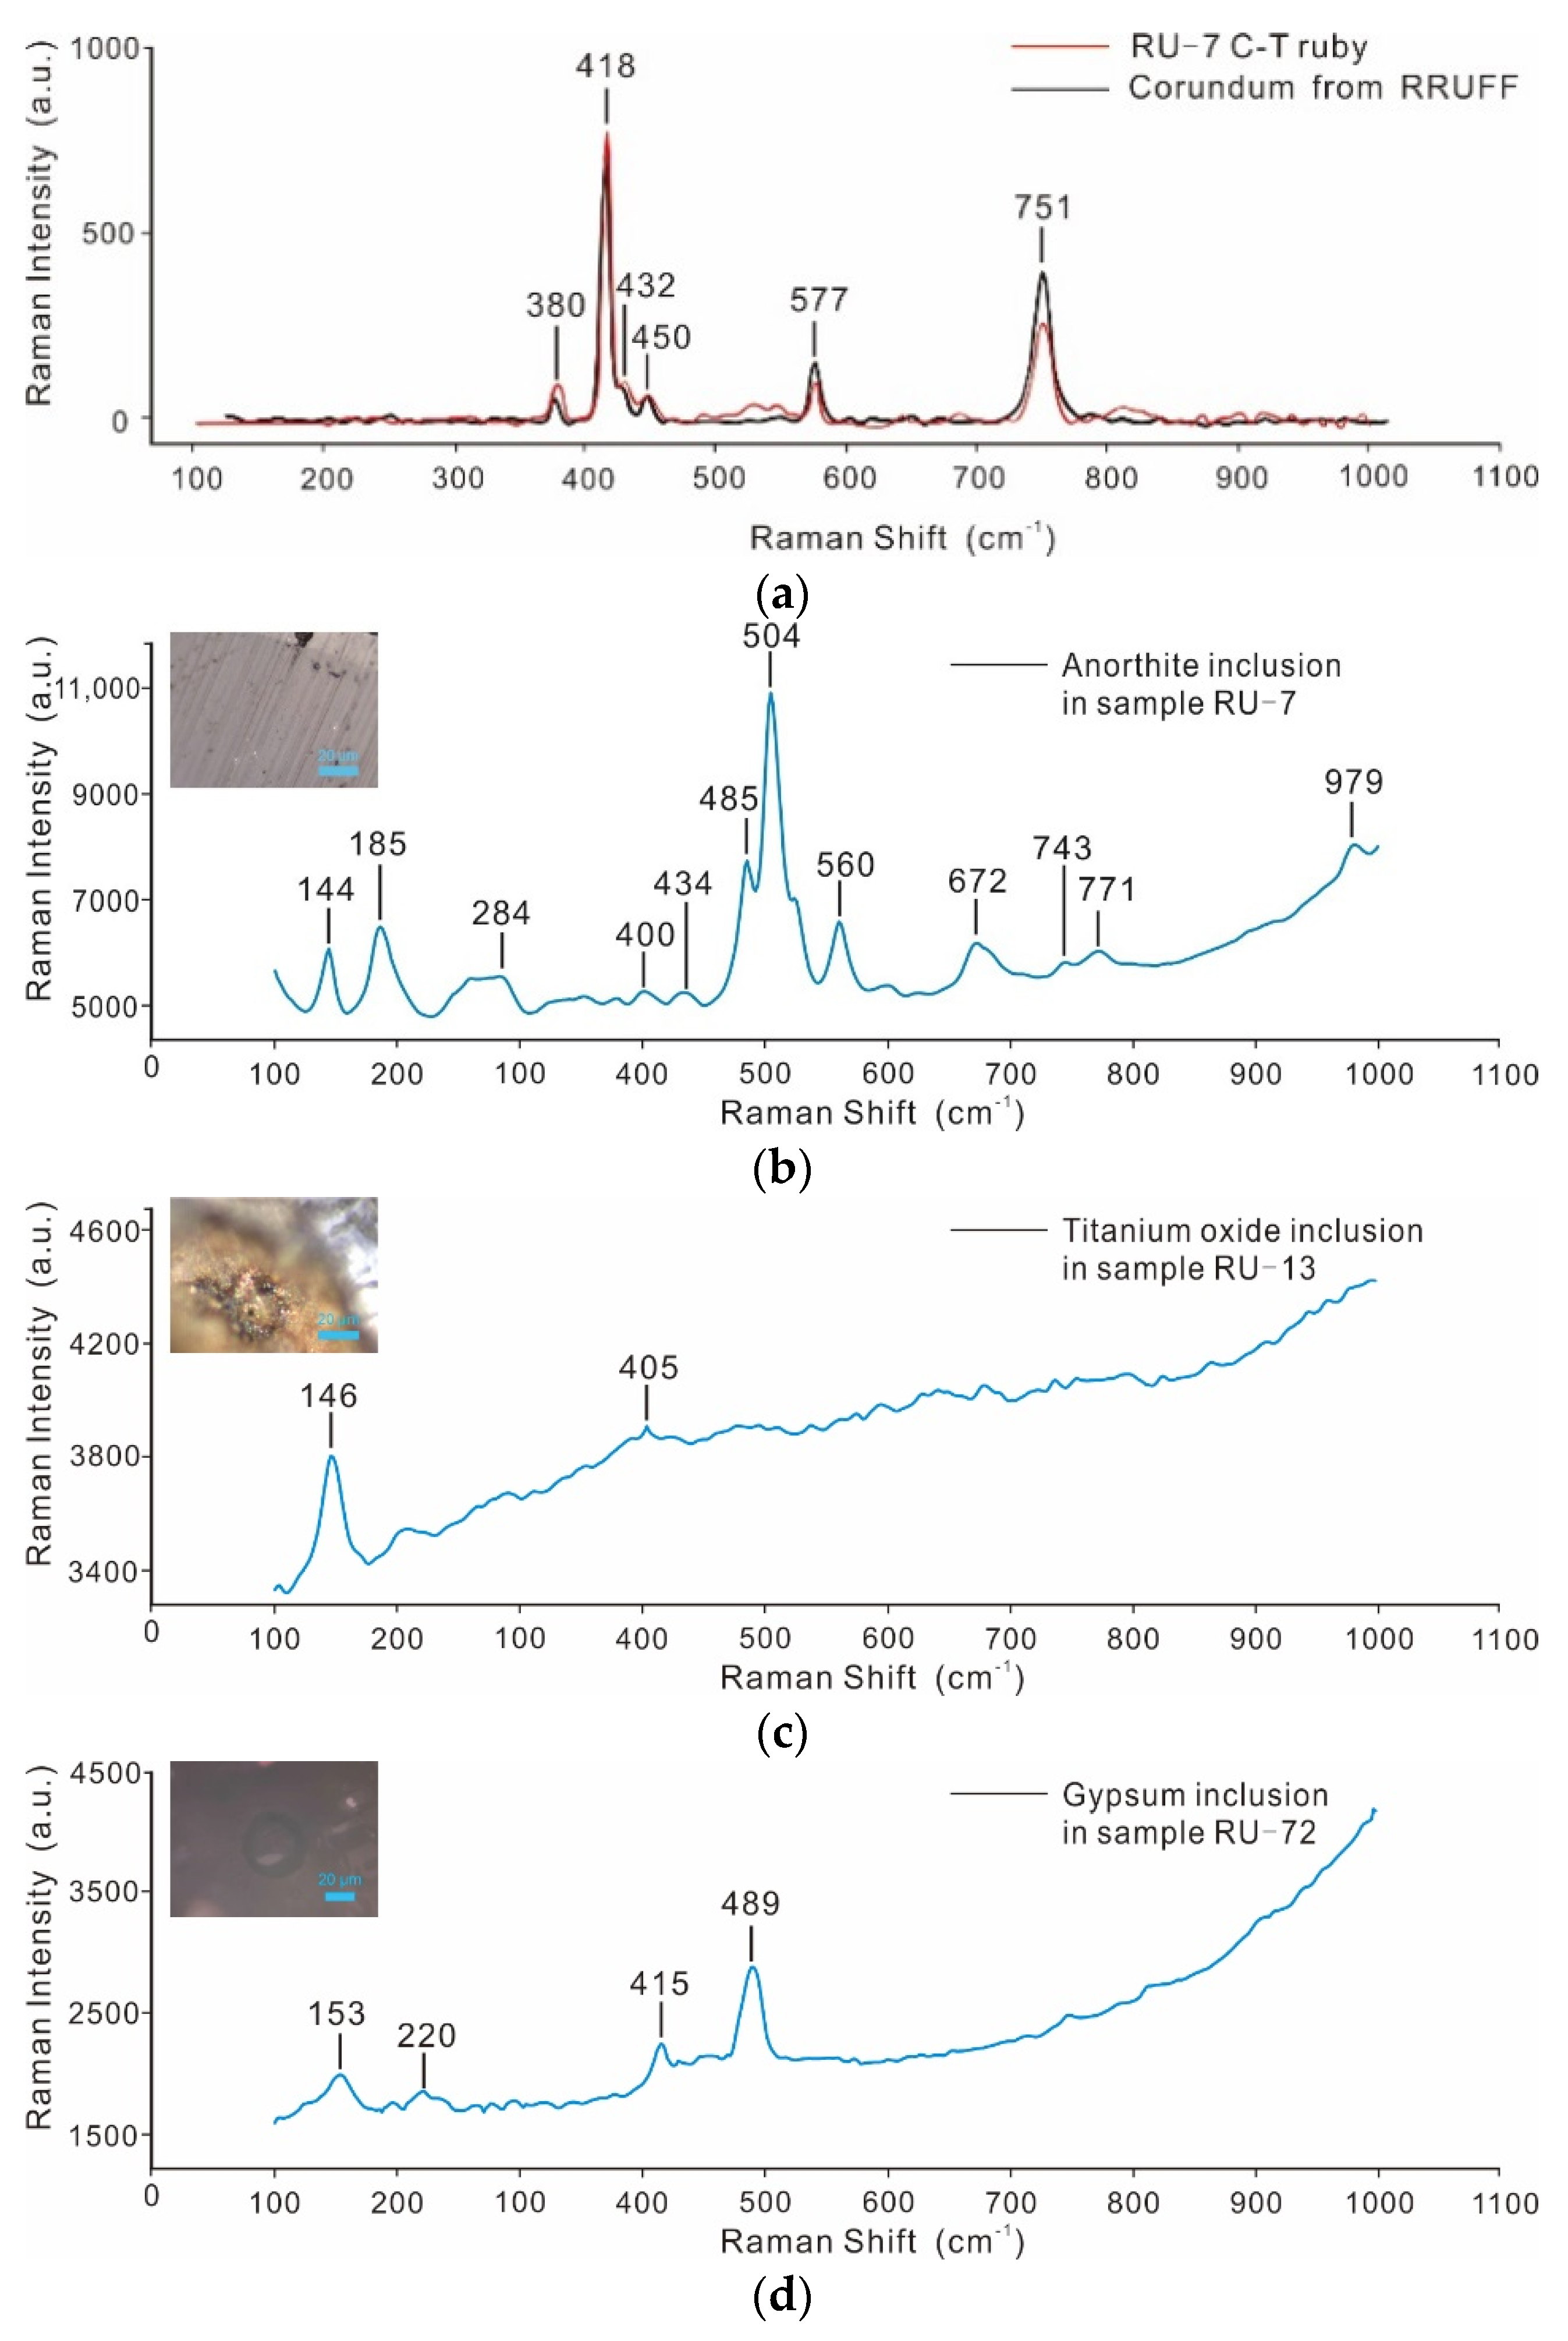
Under microscopic observation, the finding of various crystal and solid mineral inclusions was relatively common, most of which exhibit well-crystallized habits (Figure 6). During this study, selected inclusions were exposed to the surface and identified using Raman spectroscopy. The results revealed that ruby exhibits six Raman peaks at 380 cm−1, 418 cm−1, 432 cm−1, 450 cm−1, 577 cm−1, and 751 cm−1 (Figure 7a). In sample RU-4, a colorless transparent crystal (Figure 6a) measuring 150 μm to 200 μm in size, was identified as anorthite (Figure 7b). In sample RU-13, a hexagonal dark plate-like mineral inclusion (Figure 6b) measuring 200 μm in size, was identified as titanium oxide (Figure 7c). Lastly, in sample RU-72, several small, globular, colorless, and transparent crystals (Figure 6c) 50 μm in size, were identified as gypsum (Figure 7d).
There are some other forms of inclusions in the sample, such as a crystal with cleavage crack (Figure 6d), an idiomorphic unidentified crystal (Figure 6e), a mineral inclusion with a distinctive crystalline form that resembles clutching at the throat (Figure 6f), a short columnar translucent crystal (Figure 6g), a hexagonal plate-like crystal with a small core (Figure 6h), a hexagonal lamellar crystal (Figure 6i), a round plate-like crystal (Figure 6j), dark mineral inclusions with equiaxed crystalline habits (Figure 6k) and ellipsoid dark opaque mineral inclusions (Figure 6l).

3.3. Electron Microprobe Analysis and LA-ICP-MS Analysis

The compositions of major elements in the 15 ruby samples from Thailand were analyzed using EPMA; the results are given in Table 1. The main chemical component found in the ruby samples was Al2O3, with relatively high concentrations of Fe, Cr, Mg, Ti, Ga, and V. Fe ranges from 0.277% to 0.608% (avg. 0.455%), Cr ranges from 0.087% to 0.908% (avg. 0.314%), Mg ranges from 0.010% to 0.032% (avg. 0.019%), Ti ranges from 0.001% to 0.044% (avg. 0.019%), Ga ranges from below detection limit (bdl) to 0.026% (avg. 0.014%), while V ranges from bdl to 0.014% (avg. 0.009%). The results showed high contents of FeO and Cr2O3, the concentrations of FeO (avg. 0.455%) were greater than Cr2O3 (avg. 0.314%), and the Cr2O3/ FeO ratio ranged from 0.21 to 2.69 (or Cr/V ratio ranged from 0.18 to 2.37).
The trace element contents obtained for 15 ruby samples from Thailand by LA-ICP-MS were reported in Table 2, and the test points of LA-ICP-MS were chosen to be closely adjacent to the test points analyzed by EPMA. Trace elements, including Fe, Cr, Si, Mg, Ti, Ga, V, Ca, and Ni were detected in samples. The analysis showed high contents of Fe (avg. 4388 ppm), Cr (avg. 1961 ppm), Mg (avg. 175 ppm), and Ni (avg. 7 ppm). Comparing the data in Table 1 and Table 2, we noticed inconsistencies in the chemical composition obtained from EPMA and LA-ICP-MS analyses.

4. Discussion

Corundum is found all over the world, with Southeast Asia being the traditional supplier of rubies to the world market. Since the 7th century, Myanmar, particularly Mogok, has been known for producing ‘pigeon’s blood’ rubies, characterized by their bright red color with a slight purple tone [19]. In the 1960s, the supply of rubies from Myanmar started to decline because of local political problems [20]. As a result, the global ruby supply has undergone significant changes, with continued production in Southeast and Central Asia and the discovery of new ruby deposits in East Africa. The border area between Thailand and Cambodia was a major producer of high-quality rubies from the late 1800s until the 1990s, gaining dominance in the 1970s to 1980s. However, production in this region had virtually ceased by the early 2000s [21]. Other geographical origins have appeared as competitive sources, including Afghanistan [22], Vietnam [23], Madagascar [24,25], Tanzania [26,27], Greenland [28], and Egypt [29], however, these rubies were often produced in limited quantities. After the development of these prospects, the most important new deposit was Mong Hsu, Myanmar, which was the major source of rubies, until the emergence of the Montepuez deposit in May 2009 [19].
In Thailand, corundum deposits were found in several provinces including Chanthaburi-Trat, Kanchanaburi, Ubon Ratchathani, Si Sa Ket, and Phetchabun. The Chanthaburi-Trat area was the most vital source of Thai corundum. Among them, the Bo Rai deposit, located in the eastern part of Trat Province near the Cambodian province of Pailin, gained a reputation as the top producer of Thai rubies [13]. The rubies found in the C-T region of Thailand are very similar to those discovered in Pailin, Cambodia, which explains why this mining area is considered a single deposit despite being located across the geographic border [10]. These rubies have been found in alluvial and eluvial deposits, as well as in residual lateritic soil deposits associated with the corundum-bearing alkali basalts flows, where the rubies were brought up as xenocrysts within the lavas [4,8,13].

4.1. Classification of Ruby Deposits

The types of corundum deposits can be categorized into primary and secondary deposits, respectively. Secondary corundum deposits, also known as placers, are formed as a result of the erosion of primary deposits. Gem corundum is found in three types of deposits: eluvial, deluvial, and colluvial. Placer deposits are the main source of high-quality rubies. Corundum in primary deposits can be found either within the rock where it originally formed or as xenocrysts and xenoliths within the basaltic magma which transported it from the zone of crystallization in the crust or mantle to the Earth’s surface [3,30].
Despite numerous attempts to establish different corundum classification systems, most studies have suggested that primary corundum deposits can be divided into two types, based on the geological environment of formation: magmatic type and metamorphic type. In the line of previous classifications [1,31,32,33], this paper classifies magmatic-related deposits, which include rubies found as xenocrysts (xenoliths) hosted by alkali basalts (e.g., Thailand, Cambodia). On the other hand, metamorphic-related deposits are further divided into three sub-types: marble-hosted [34] (e.g., Myanmar, Afghanistan, or Vietnam), metamorphosed mafic and ultramafic rocks-hosted (M-UMR, e.g., Mozambique or Tanzania), and metamorphic-metasomatic deposits characterized by high fluid-rock interaction and metasomatism (e.g., Kenya or India).

4.2. Gemological Properties

As anticipated, our basic gemological experiments have demonstrated that the refractive indices, birefringence, and specific gravity alone are insufficient to distinguish rubies of different origins. Nevertheless, it is worth noting that fluorescence intensity can serve as a crucial indicator, which is influenced by the concentration of chromium (Cr) and the ratio of Cr to iron (Fe) [1]. The presence of Fe and an excess of Cr tend to diminish or restrain the fluorescence of ruby. It is important to highlight that rubies with diverse geological histories exhibit distinct fluorescence properties. For instance, Mozambique rubies display strong to medium red fluorescence under long-wave UV radiation and medium to weak red fluorescence under short-wave UV [35]. Ruby originating from the marble-hosted deposits (e.g., Myanmar and Afghanistan) and the basalt-hosted deposits (e.g., Thailand and Cambodia) have a more extreme reaction under UV light compared to Mozambique rubies. Specifically, the marble-related rubies, which have minimal iron content, often display stronger fluorescence, and the basalt-related rubies tend to be almost inert, particularly when exposed to short-wave UV light.
The C-T ruby samples show a sub-rounded to rounded appearance, which may be attributed to the resorption by magmas that carried them to the surface. Surface resorption or etching, as well as layer dissolution features such as the triangular hillocks on the grain’s surface, which reflect the internal trigonal crystal symmetry, also result from the reaction with the magmas. Surface impact features, such as exposed healed fracture surfaces and conchoidal fractures, suggest that the ruby undergoes reworking in the alluvial environment [14,17]. Based on these findings, it can be inferred that Thai ruby can be considered xenocrysts within their volcanic hosts [11], which transport them from crystalline zones in the crust or mantle to the Earth’s surface, where they ultimately appear in placer deposits.

4.3. Microscopic Inclusions

A considerable amount of literature has been published on the geological history of rubies and these studies concentrate on inclusions, trace elements, and isotopes. Inclusions serve as evidence that can directly connect ruby to its geological origin and the study of inclusions is relatively straightforward and effective, particularly for mineral inclusions [15]. Due to variations in inclusion scenarios among different sources of deposits and the unique inclusion sets generated by each geological setting, separation can be easily achieved using a gem microscope.
Inclusions of Thailand ruby have been intensively investigated recently. Previous research used many analytical techniques to identify the mineral inclusions, such as optical microscopy [5,10,12,14], Raman spectroscopy [10,11,13], electron probe microanalyzer (EPMA) [13,14], X-ray powder diffraction (XRD) [4] and scanning electron microscopy with energy dispersive X-ray spectrometry (SEM-EDX) [9].
Thai rubies can be easily identified by their characteristic inclusion scenes [12], setting them apart from stones originating in other geographic localities or genetic environments. Microscopic detection is used to differentiate them based on these inclusion scenes. Previous studies have shown that mineral inclusions, including high-alumina diopside [7,8,9,13,14], feldspar (mostly plagioclase) [7,13,20], pyrope [8,9,13,14], sulfides (including pyrrhotite and chalcopyrite) [4,13,14], sillimanite [13,14] and sapphirine [6,7,13], are the characteristic inclusions in Thai rubies. In this study, the C-T rubies from Thailand were found to have numerous crystal and mineral inclusions. The presence of anorthite, titanium oxide, and gypsum inclusions was confirmed through Raman spectroscopy. Additionally, the absence of rutile silk in the samples examined in this study was consistent with the findings reported by [12].
Table 3 provides a summary of the mineral inclusions discovered in Thai rubies and compares them to those reported in rubies from Myanmar and Mozambique. The table clearly shows that there is a distinct difference in the mineral inclusion set, supporting a clear separation between the three locations.

4.4. Trace-Element Variations

In recent years, the study of mineral trace elements and isotopic characteristics has emerged as a powerful tool for investigating the origin of gemstones [37,38,39]. To correctly determine the geographic origin of rubies, it is not only based on microscopic observations of the inclusions, but also requires the precise determination of trace elements including Mg, Ti, V, Cr, Fe, and Ga. The trace element contents of rubies can indicate their origins. Therefore, the trace elements in corundum can provide valuable insights both on their source and crystallization conditions. Trace elements are particularly useful for distinguishing rubies in secondary deposits [3,12]. Various quantitative trace element detection techniques, including EPMA, X-ray fluorescence (XRF), secondary ion mass spectrometry (SIMS), and LA-ICP-MS, have been used in several studies to determine specific trace element signatures of Thai rubies.
In this study, EPMA and LA-ICP-MS were utilized to gather data for the creation of chemical fingerprint diagrams, which can aid in determining the geographic origin. When comparing the data obtained from these two analytical methods, discrepancies in chemical composition were observed, despite the use of the same selected points. Generally, the EMPA results showed Cr and V values that were 1.2 to 5 times higher than the comparative LA-ICP-MS results on the same samples. These variations have been attributed to operational factors within the two analytical methods [40].
Pure corundum is colorless, and its color is determined by trace element impurities included in the corundum lattice. This is because both Al3+ and O2– in the corundum lattice structure do not absorb light in the visible region of the spectrum [41]. In the gem trade, the most optimal color for rubies is referred to as ‘pigeon’s blood’, which is a vivid red color with pure red fluorescence, and this color is achieved due to the presence of Cr in the octahedral site [1].
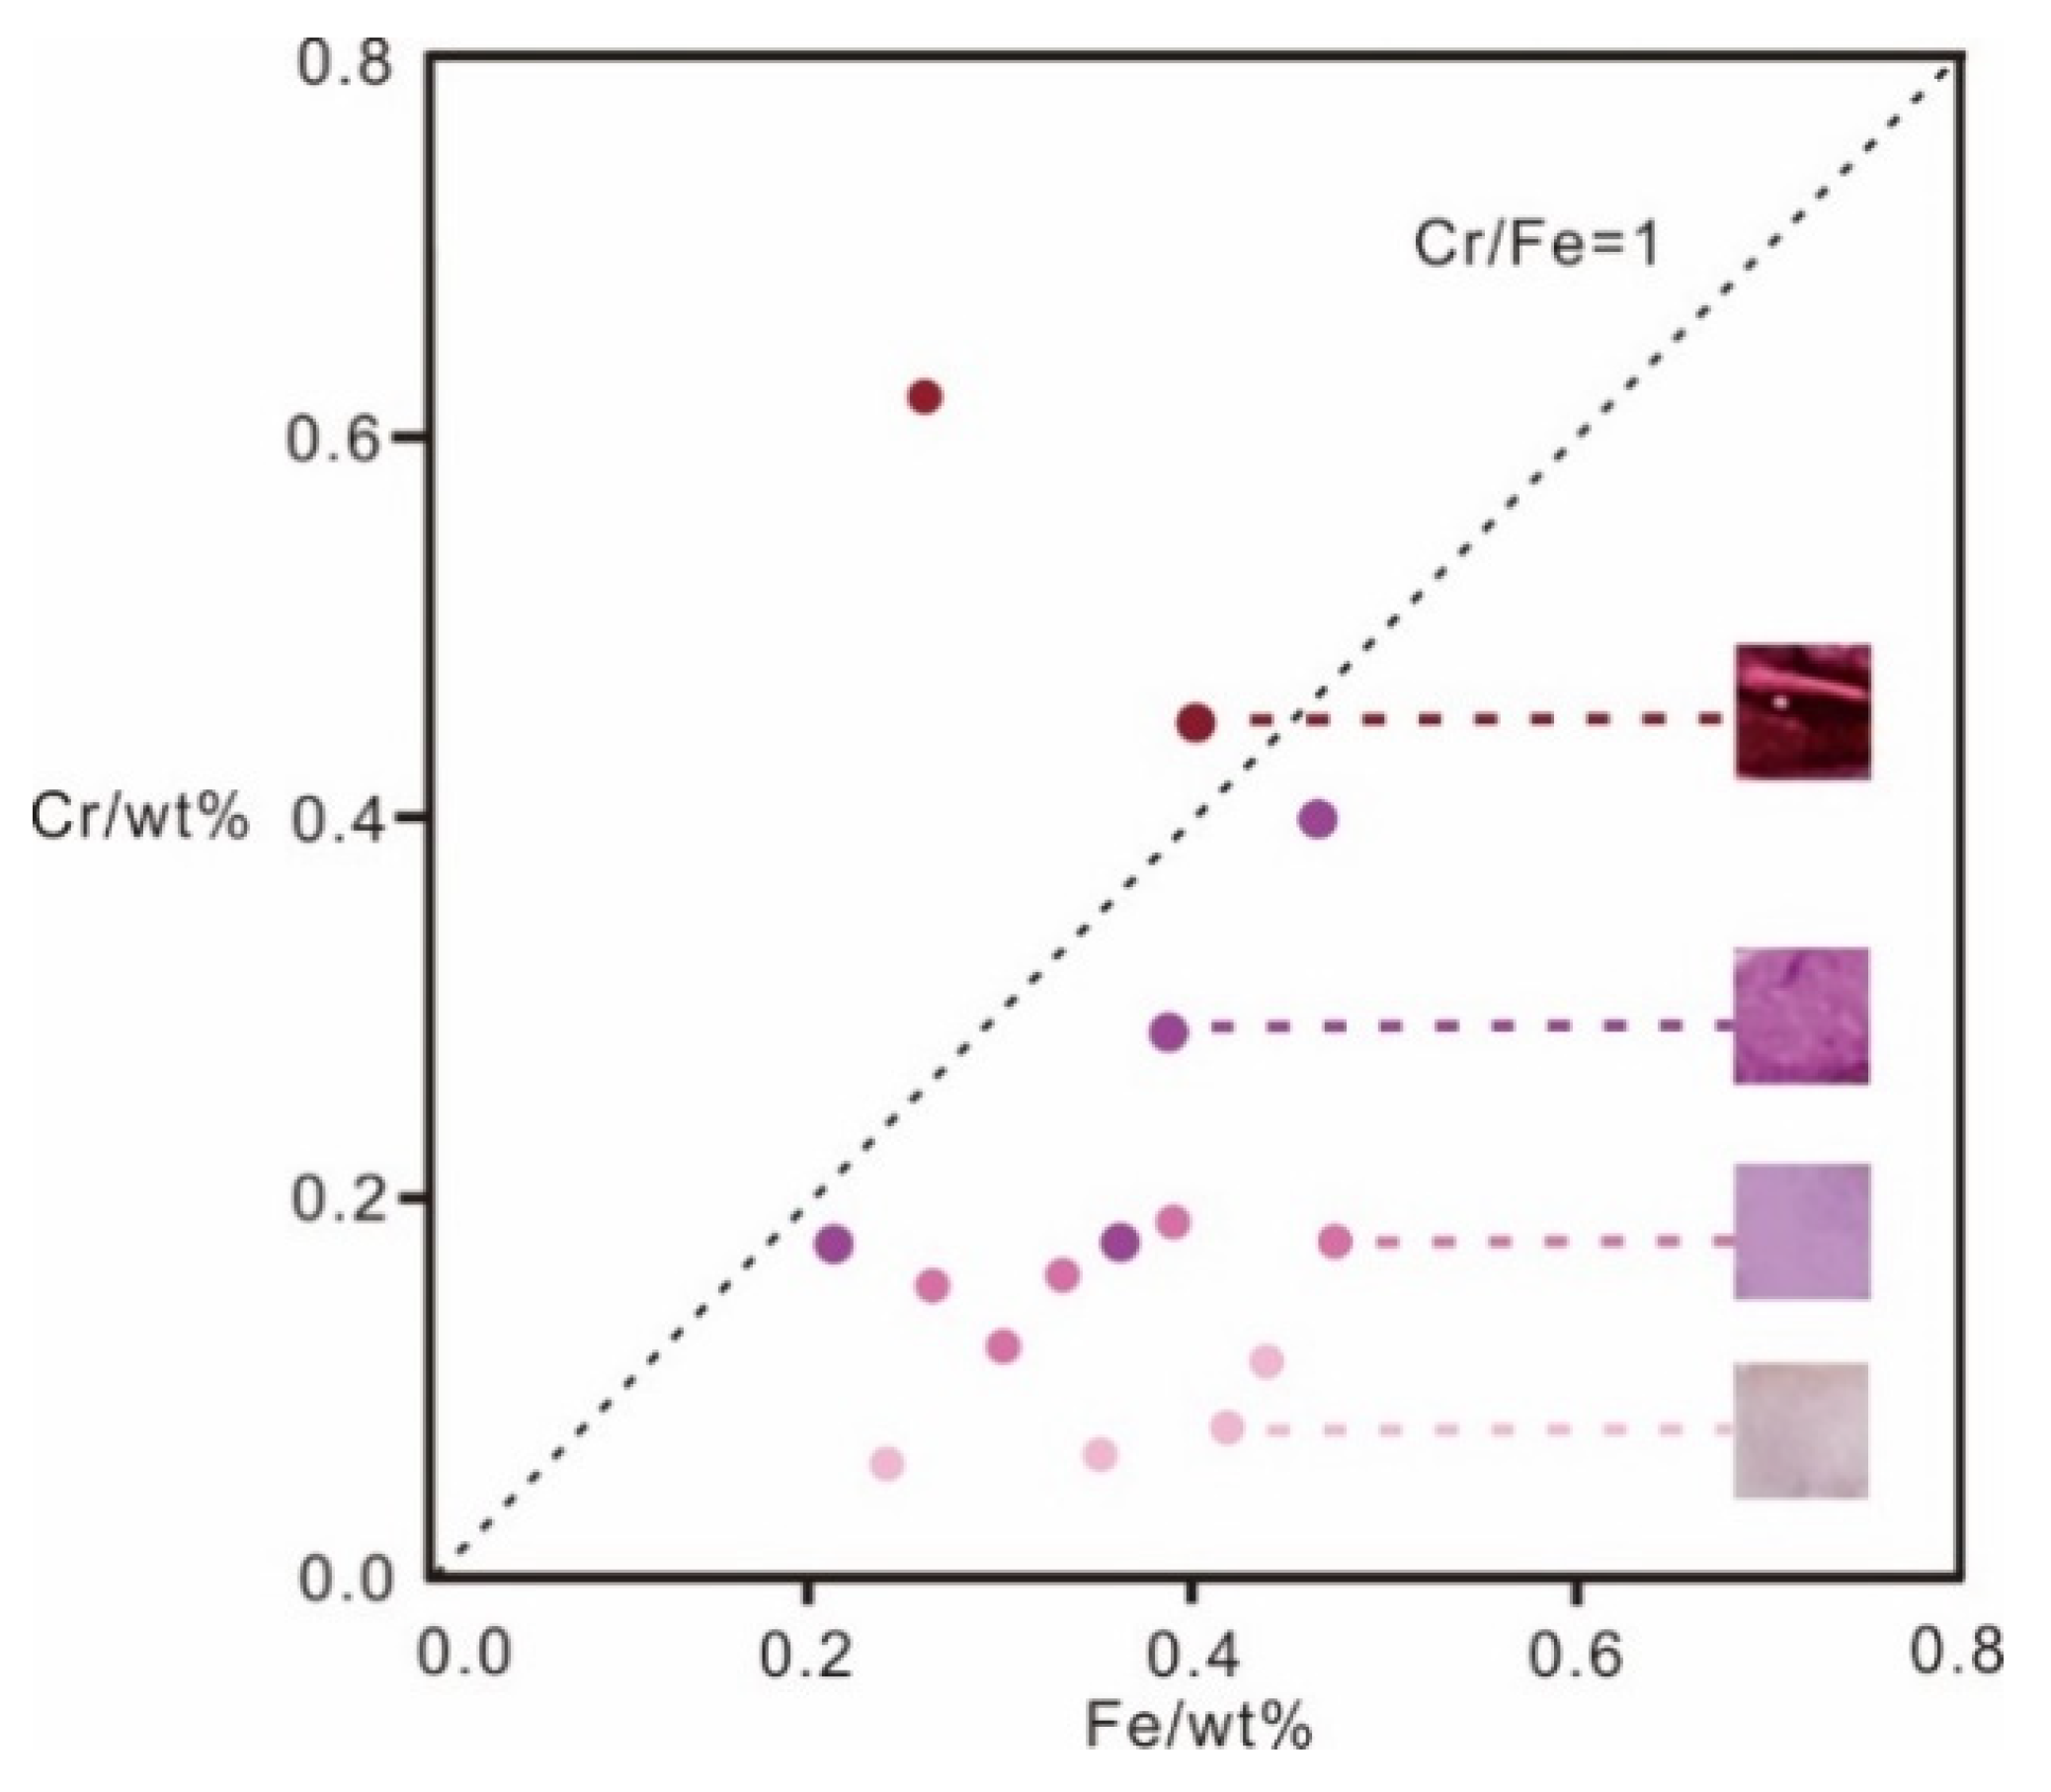
It is interesting to note that the chemistry of Thai rubies showed a significant Fe content (2154 to 4728 ppm) and a medium Cr content (595 to 6212 ppm). Ruby develops its red-to-orange pleochroism when Cr3+ enters Al3+ sites and Cr is considered the chromophoric element in rubies [42]. The relationship between color and Cr content is depicted in Figure 8. It is evident from the figure that as the Cr content increases, the color becomes more intense.
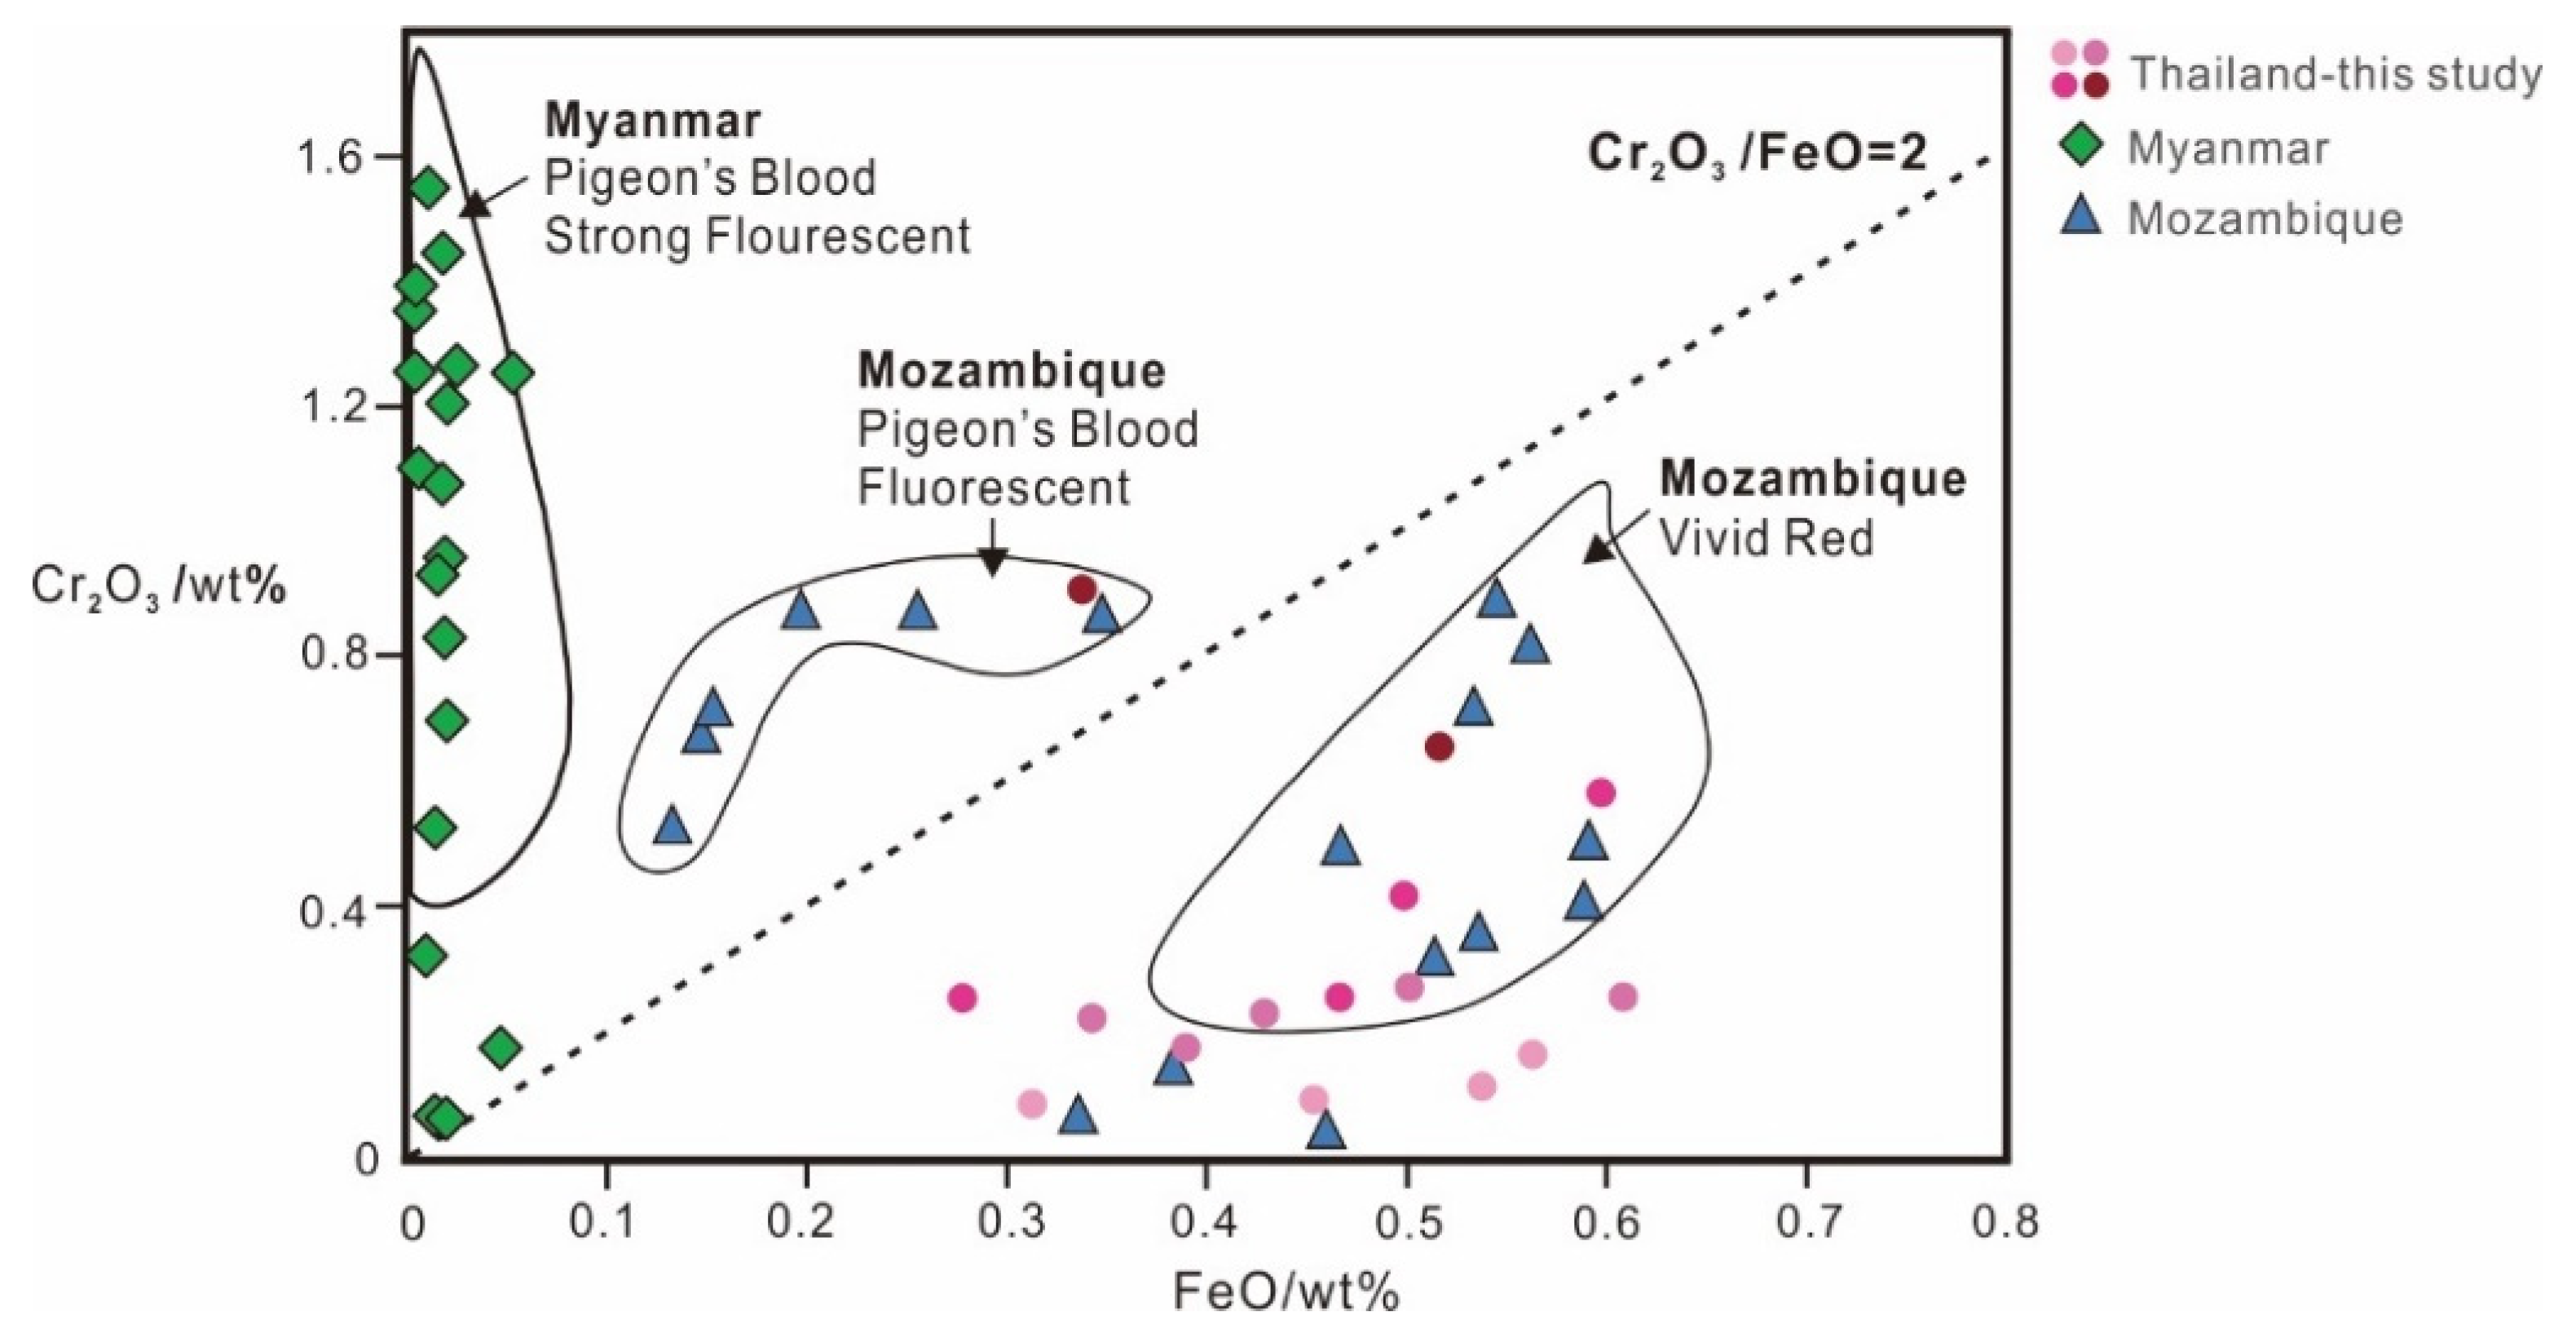
The presence of UV fluorescence in rubies can strengthen the stone’s color and increase its value. Most gem laboratories use the term ‘pigeon blood’ only for marble-hosted rubies that have low iron content and strong fluorescence, but at GRS, the ‘pigeon blood’ color grade is applied independently of the origin. GRS has categorized the relationship between fluorescence intensity and the iron (Fe) and chromium (Cr) contents into different regions [43], including Myanmar’s ‘pigeon’s blood’ with strong fluorescence, Mozambique’s ‘pigeon’s blood’ with fluorescence, and Mozambique’s ‘vivid red’ (Figure 9). The color of rubies significantly impacts their value. Figure 9 illustrates that the “pigeon’s blood” color grade rubies from Myanmar and Mozambique have high Cr2O3/FeO ratios. This implies that even the limited number of high-quality Thai rubies possess significant commercial potential.
Previous studies have found that the determination of geographic origin in rubies is primarily based on the Fe content rather than on the Cr content, as the latter is not considered a discriminant element [12]. According to Palke et al., rubies can be divided into two categories: marble-hosted rubies and high-iron rubies. Marble-hosted rubies, which are low in iron content (less than 200 ppma), are also found in other rocks associated with marble. On the other hand, high-iron rubies, with various geological origins such as basalt-related rubies and metamorphic or metasomatic rubies, generally have a high iron content (mostly above 400 ppma) [12]. In most cases, these two groups can be differentiated by their distinctive trace element chemistry. However, caution must be exercised when the iron content is between 200 and 400 ppma.
We analyzed data collected from various previous tests, including data from Thailand, Cambodia, Mozambique, and Myanmar. As depicted in Table 4, the content of Fe, Mg, Ti, V, Cr, and Ga of our findings shows complete overlap when compared to previous studies on basalt-related rubies (from Thailand and Cambodia). The primary difference lies in the iron concentration, with Myanmar rubies from marble-host rocks typically having low iron contents (avg. 148 ppm), while Thailand and Cambodia rubies from alkaline basalt have high iron contents (respectively, avg. 1989 ppm and avg. 2857 ppm).
Another remarkable finding from the data is that rubies from Myanmar contain a high concentration of Ti (avg. 454 ppm), V (avg. 287 ppm), and Ga (avg. 72 ppm), but a low concentration of Mg (avg. 64 ppm). In contrast, rubies from Mozambique, which belong to amphibole-bearing metamorphic rocks, have the lowest concentration of Mg (avg. 45 ppm), Ti (avg. 31 ppm), V (avg. 3 ppm), and Ga (avg. 15 ppm). Rubies from Thailand and Cambodia have the highest concentration of Mg (avg. 150 ppm and avg. 131 ppm, respectively) and relatively lower concentrations of Ti (avg. 110 ppm and avg. 132 ppm), V (avg. 16 ppm and avg. 18 ppm), and Ga (avg. 18 ppm and avg. 23 ppm) compared to rubies from Mozambique. These results indicate that the determination of rubies’ origin could be inferred by the concentrations of trace elements, and rubies originating from different types of deposits have distinct chemical fingerprints.
The co-substitution of Mg2+ and Ti4+ for two Al3+ cations is a vital mechanism for incorporating both Mg and Ti in corundum [11]. Further analysis of the Fe-Mg-Ti diagram (Figure 10) reveals variations in the concentrations of these three elements in rubies from different sources [40]. Rubies from Thailand and Cambodia exhibit a more concentrated spatial distribution, whereas Mozambique rubies show an Mg-Fe trend along the Mg-Fe axis, and Myanmar rubies have a similar Mg-Ti trend along the Mg-Ti axis.
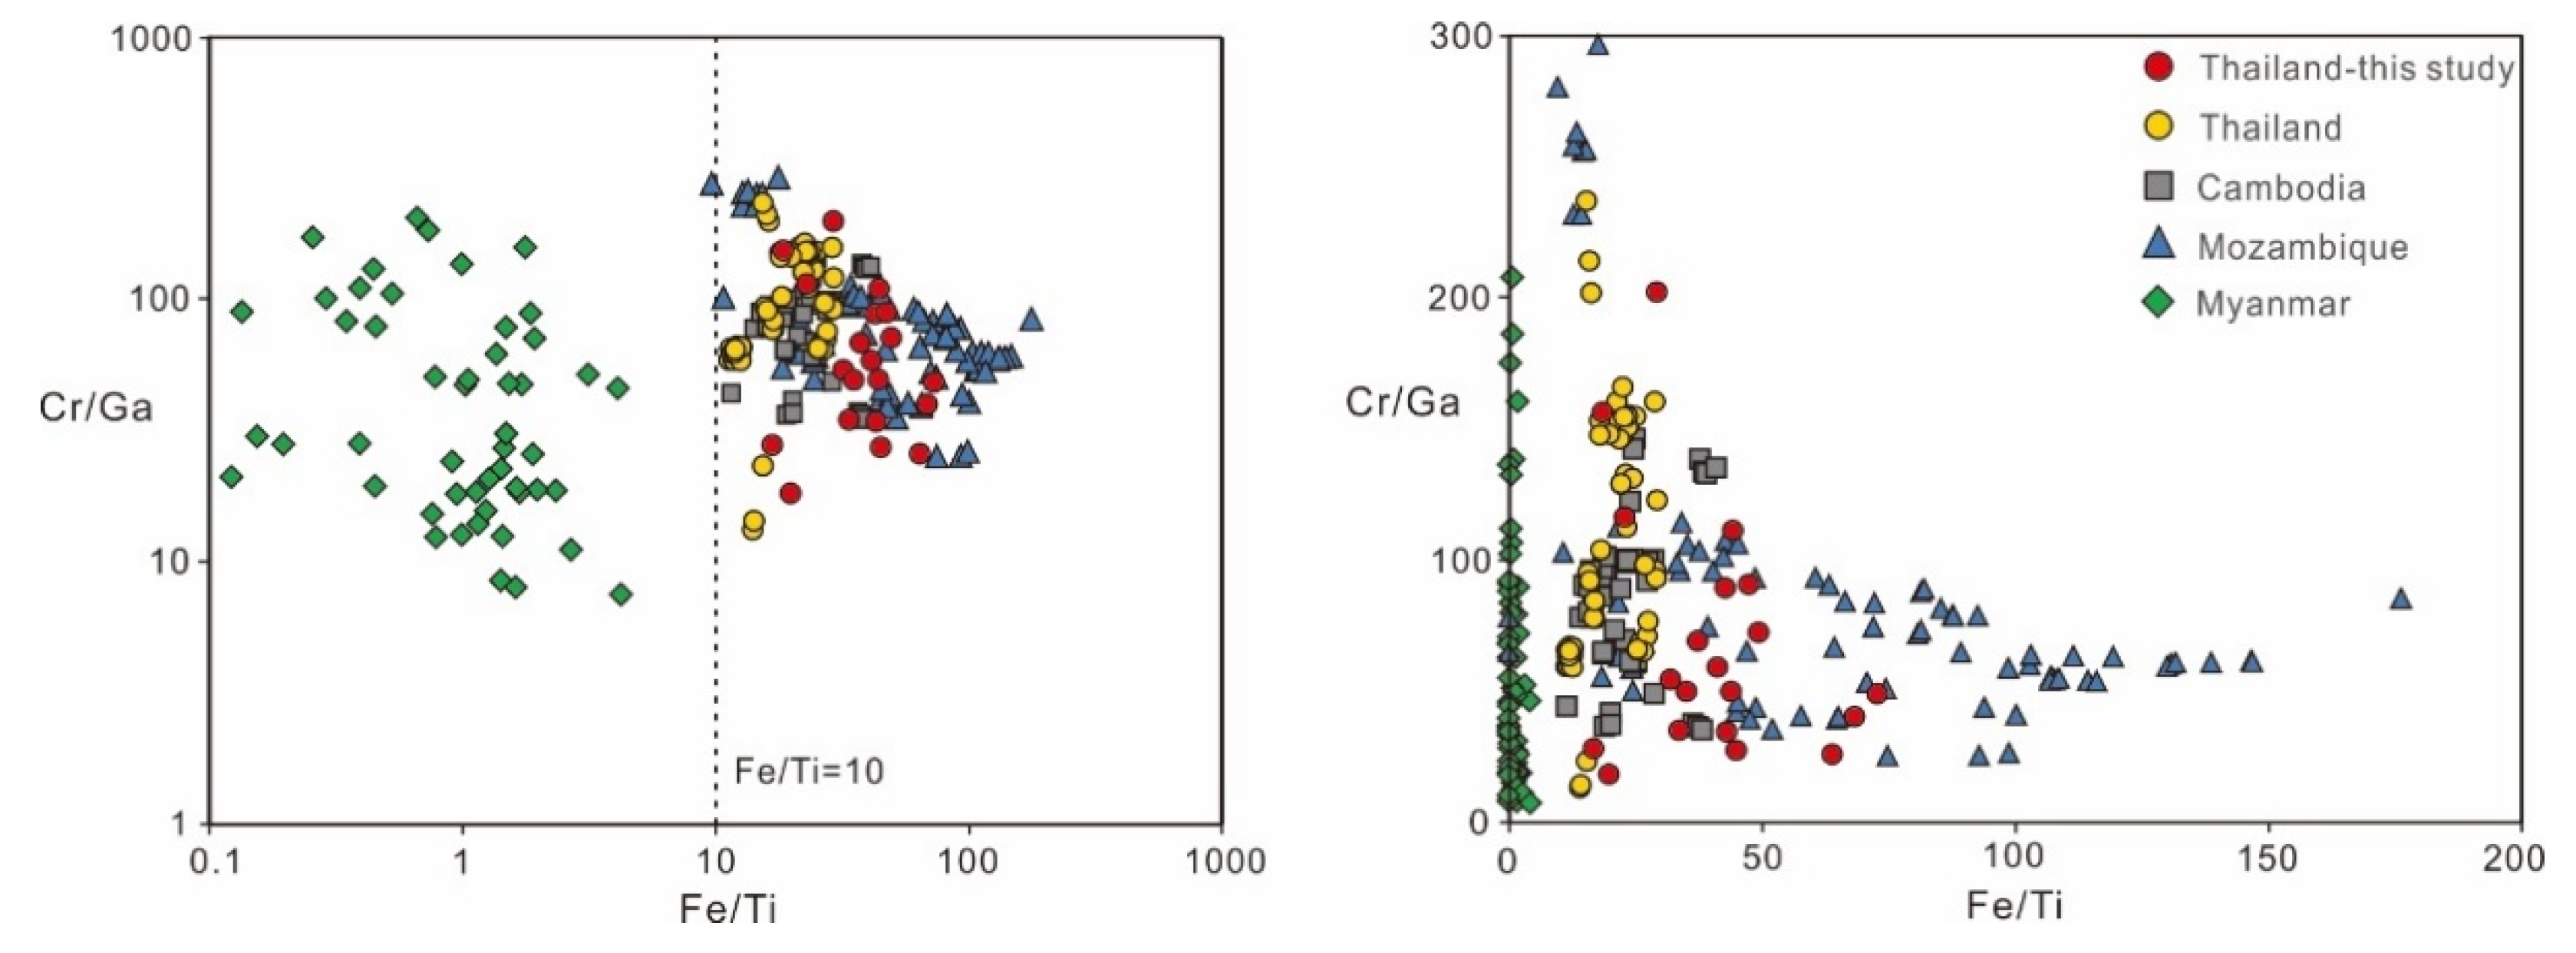
Relationships between Cr/Ga and Fe/Ti concentration ratios were investigated by [46] which shows that a Fe/Ti ratio of 10 serves as the boundary between two distinct deposits. Deposits with Fe/Ti ratios above 10 are classified as basaltic deposits (including Thailand and Madagascar), while those with Fe/Ti ratios below 10 are classified as marble deposits (including Myanmar). Our study’s results support the previous observations, showing that rubies from Thailand-Cambodia (basalt-related rubies) and rubies from Mozambique (amphibole metamorphic rubies) have both Fe/Ti ratios greater than 10 (Figure 11). Rubies from Mozambique, however, exhibit a wider range of Fe/Ti values. The data points representing marble rubies from Myanmar have Fe/Ti ratios lower than 10 and are more clustered compared to other deposits.
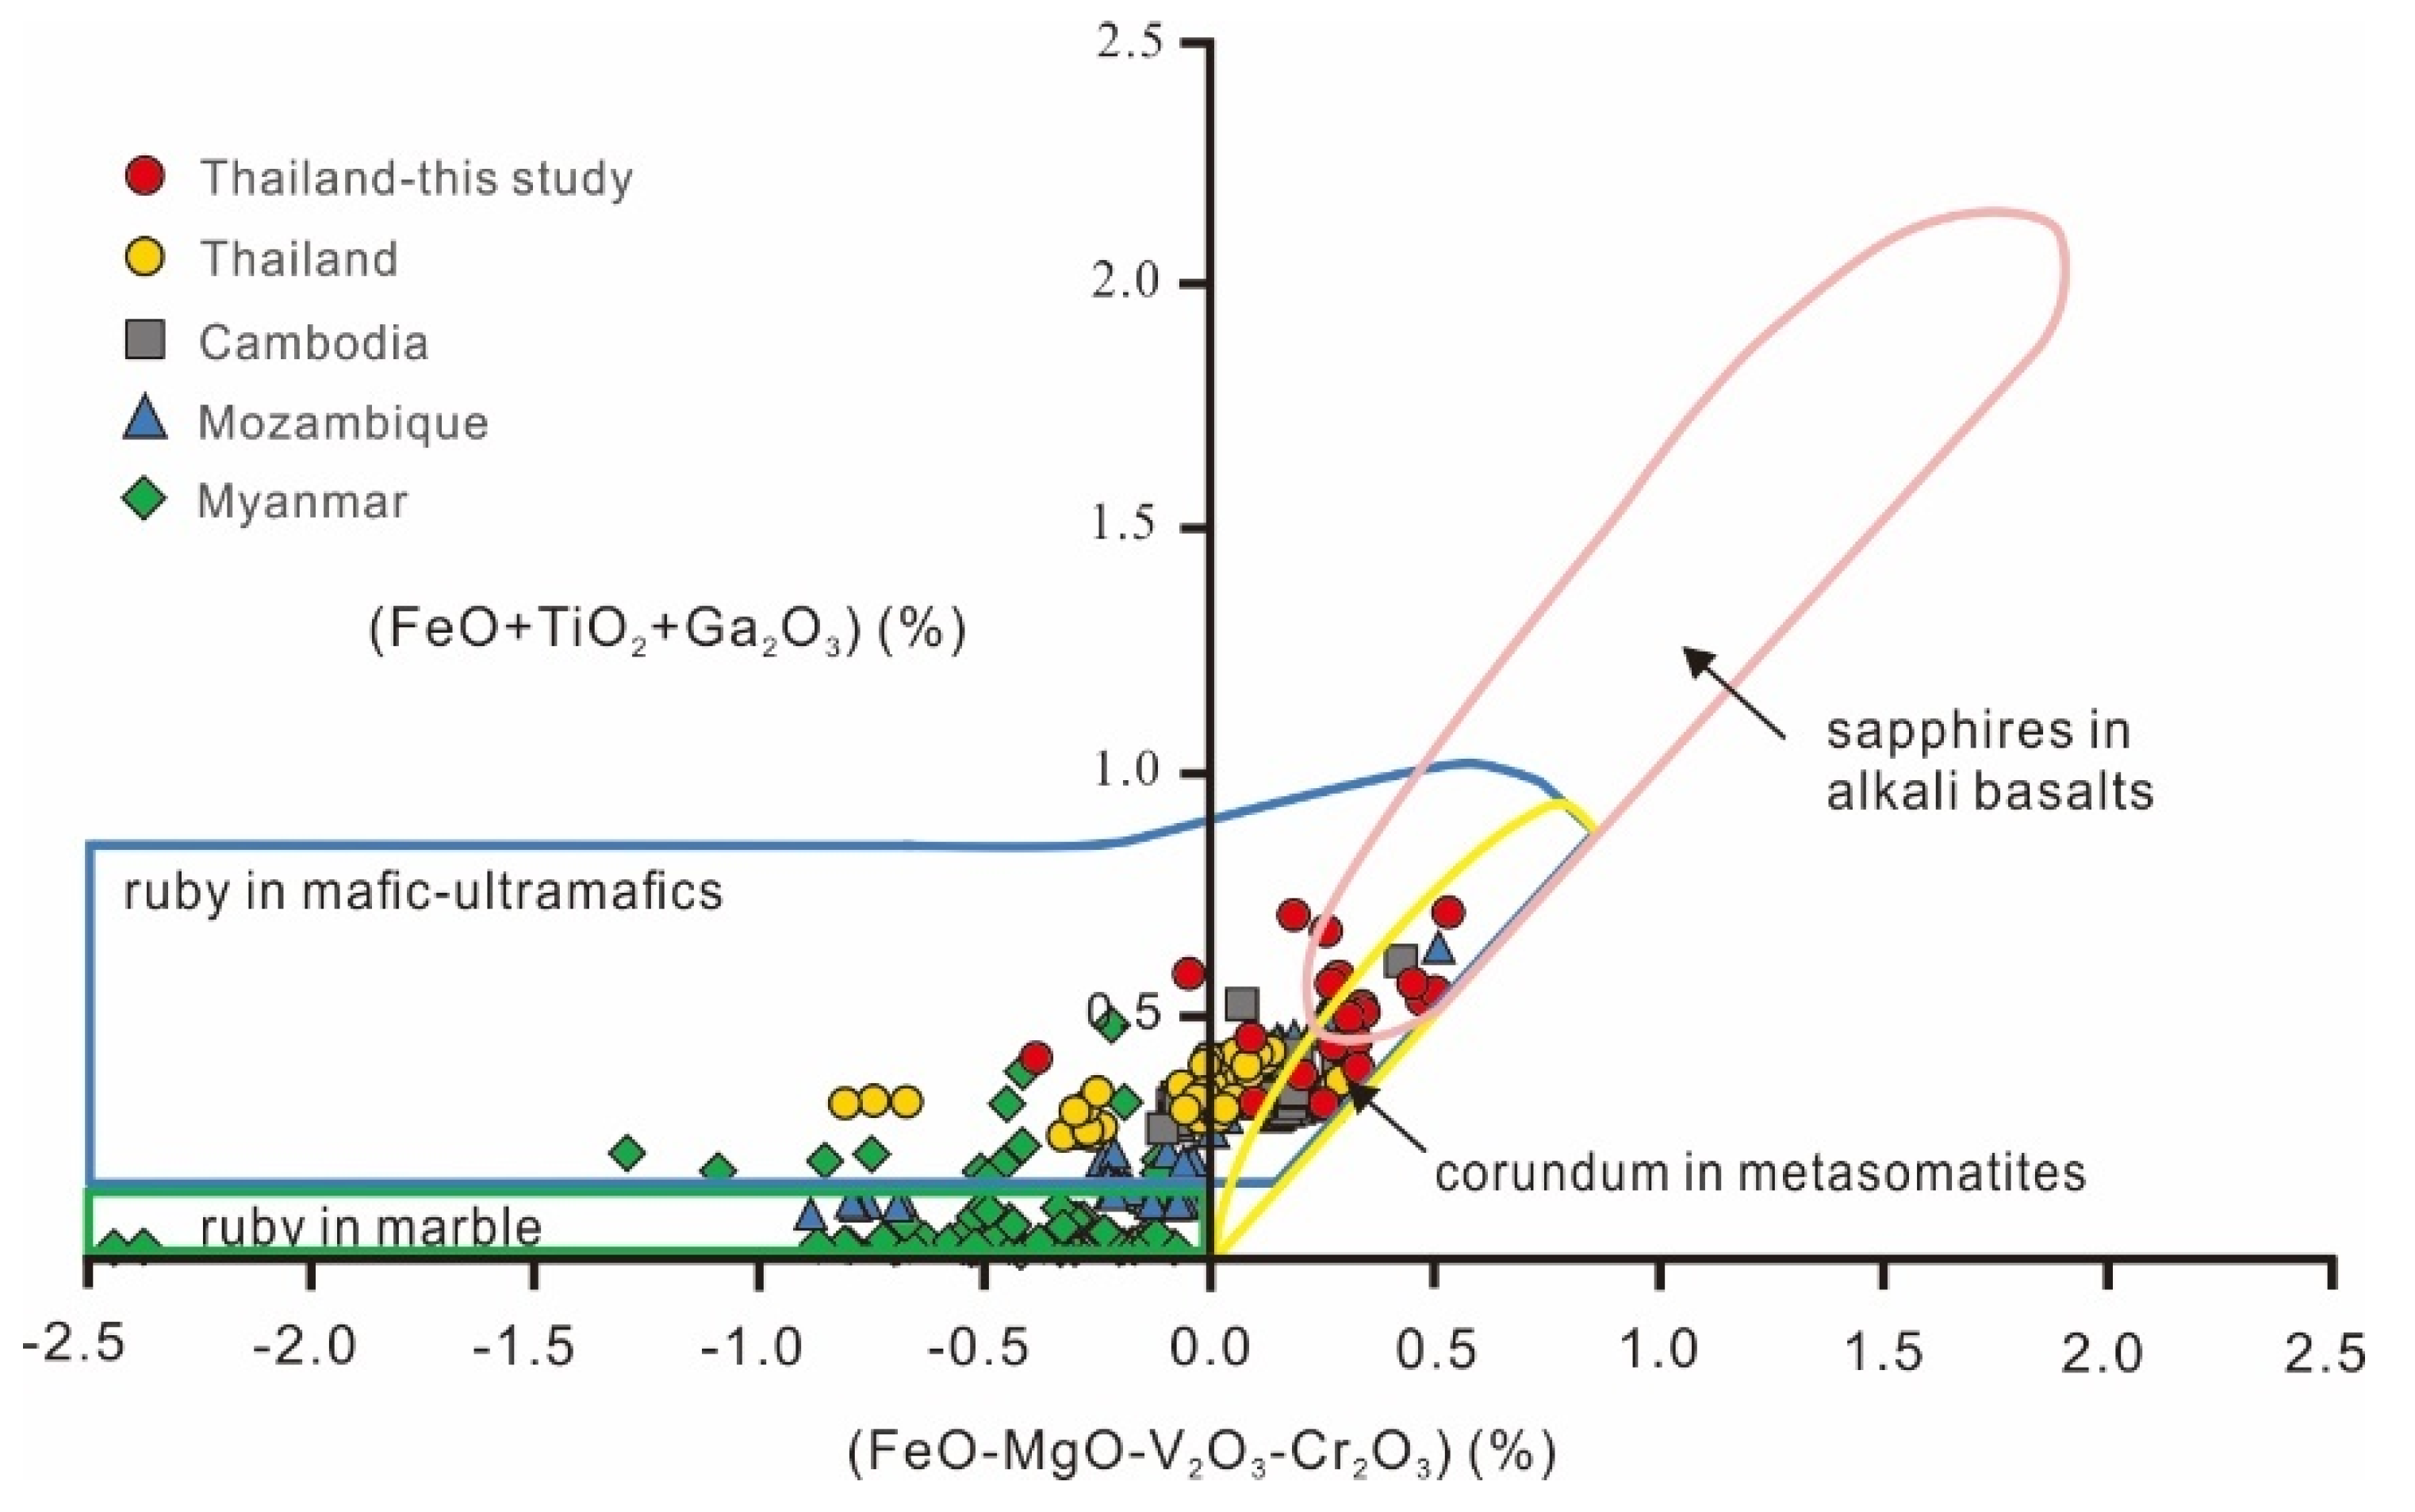
A new chemical classification diagram has been proposed to discriminate between different types of primary ruby deposits by using the EPMA analyses database [1]. In Giuliani’s plot of FeO + TiO2 + Ga2O3 vs. FeO-MgO-V2O3-Cr2O3, the FeO content is initially used to distinguish between low-iron rubies and high-iron rubies. Trace elements associated with sapphire (TiO2 and Ga2O3) or ruby (Cr2O3, V2O3, and MgO) are either added or subtracted to FeO. The different ruby deposits are classified into three fields: marble-hosted, M-UMR, and metasomatized.
As illustrated in Figure 12, the Thai and Cambodian rubies fall within the mafic-ultramafics (MUMR) domain and are accompanied by superpositions that have a metasomatic origin. Furthermore, rubies from Myanmar and Mozambique are located in both the mafic-ultramafics and marble fields, suggesting it would not be a sole origin.
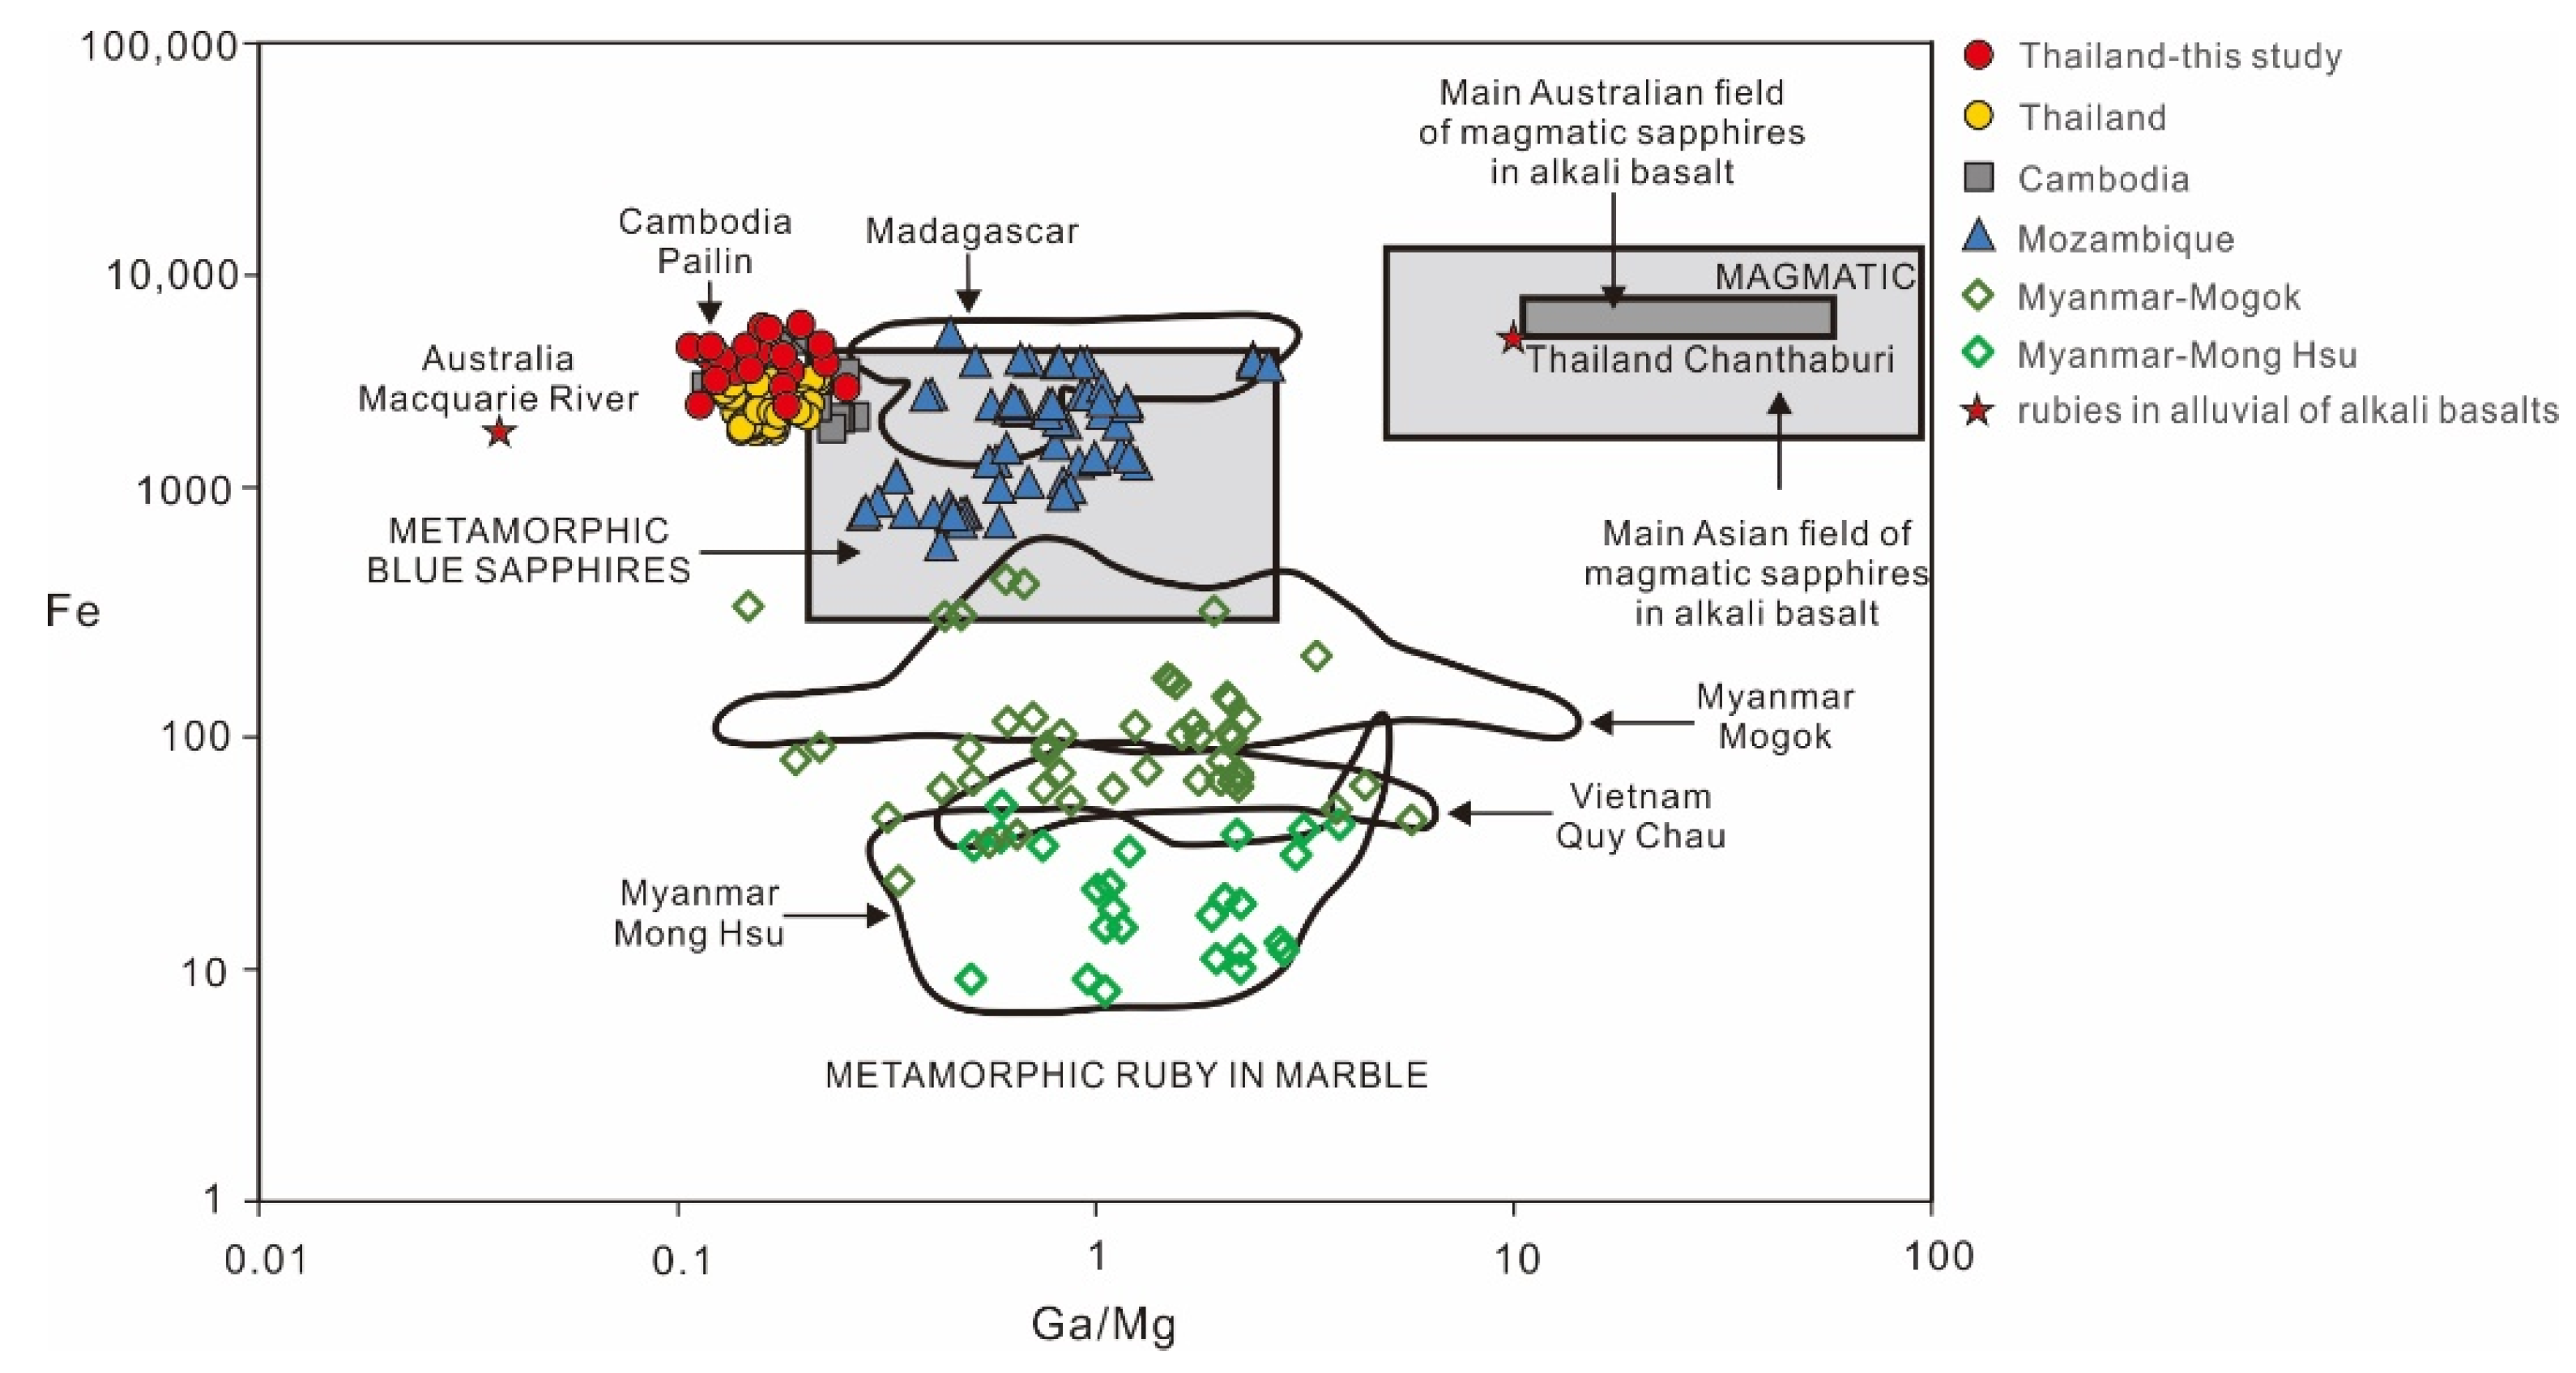
LA-ICP-MS analyses on corundum samples from various geological sources also served for drawing a trace element variation diagram [40]. This diagram utilizes Fe contents and Ga/Mg chemical ratios to distinguish between sapphires from metamorphic and magmatic settings [40]. Previous studies have established that the Ga/Mg ratio against Fe content can be a valuable tool for identifying different types of blue sapphire and can also be extended to ruby. The Ga/Mg ratio and overall Ga concentrations are commonly regarded as discriminant factors for the origin of gem corundum. Corundum with a ‘metamorphic’ origin typically has low values of Ga (<100 ppm) and Ga/Mg < 3, while corundum with a ‘magmatic’ origin shows high Ga concentrations (>100 ppm) and Ga/Mg > 3.
Compared to sapphires, natural rubies typically have unusually low Ga/Mg ratios (<10) and limited Ga (<200 ppm) [40]. The range boxes for different corundum origins were depicted by [1]. The discrimination diagram (Figure 13), shows that the Ga/Mg ratio exhibits great variability, ranging between 0.1 and 10 [1]. Thai ruby, which falls under the ‘metamorphic’ corundum classification, suites a low Ga/Mg ratio (0.10–0.25). However, the presence of silica melt inclusions in these rubies indicates their magmatic origin [11]. Meanwhile, distinguishing ruby localities in Thailand from Cambodia is challenging due to their overlapping nature. In contrast, Myanmar and Mozambique ruby suites have relatively similar higher Ga/Mg ratios and are more distinctly separated. Different Fe content (respectively, 0.15–5.74, and 0.14–2.61) can be used to differentiate between them.
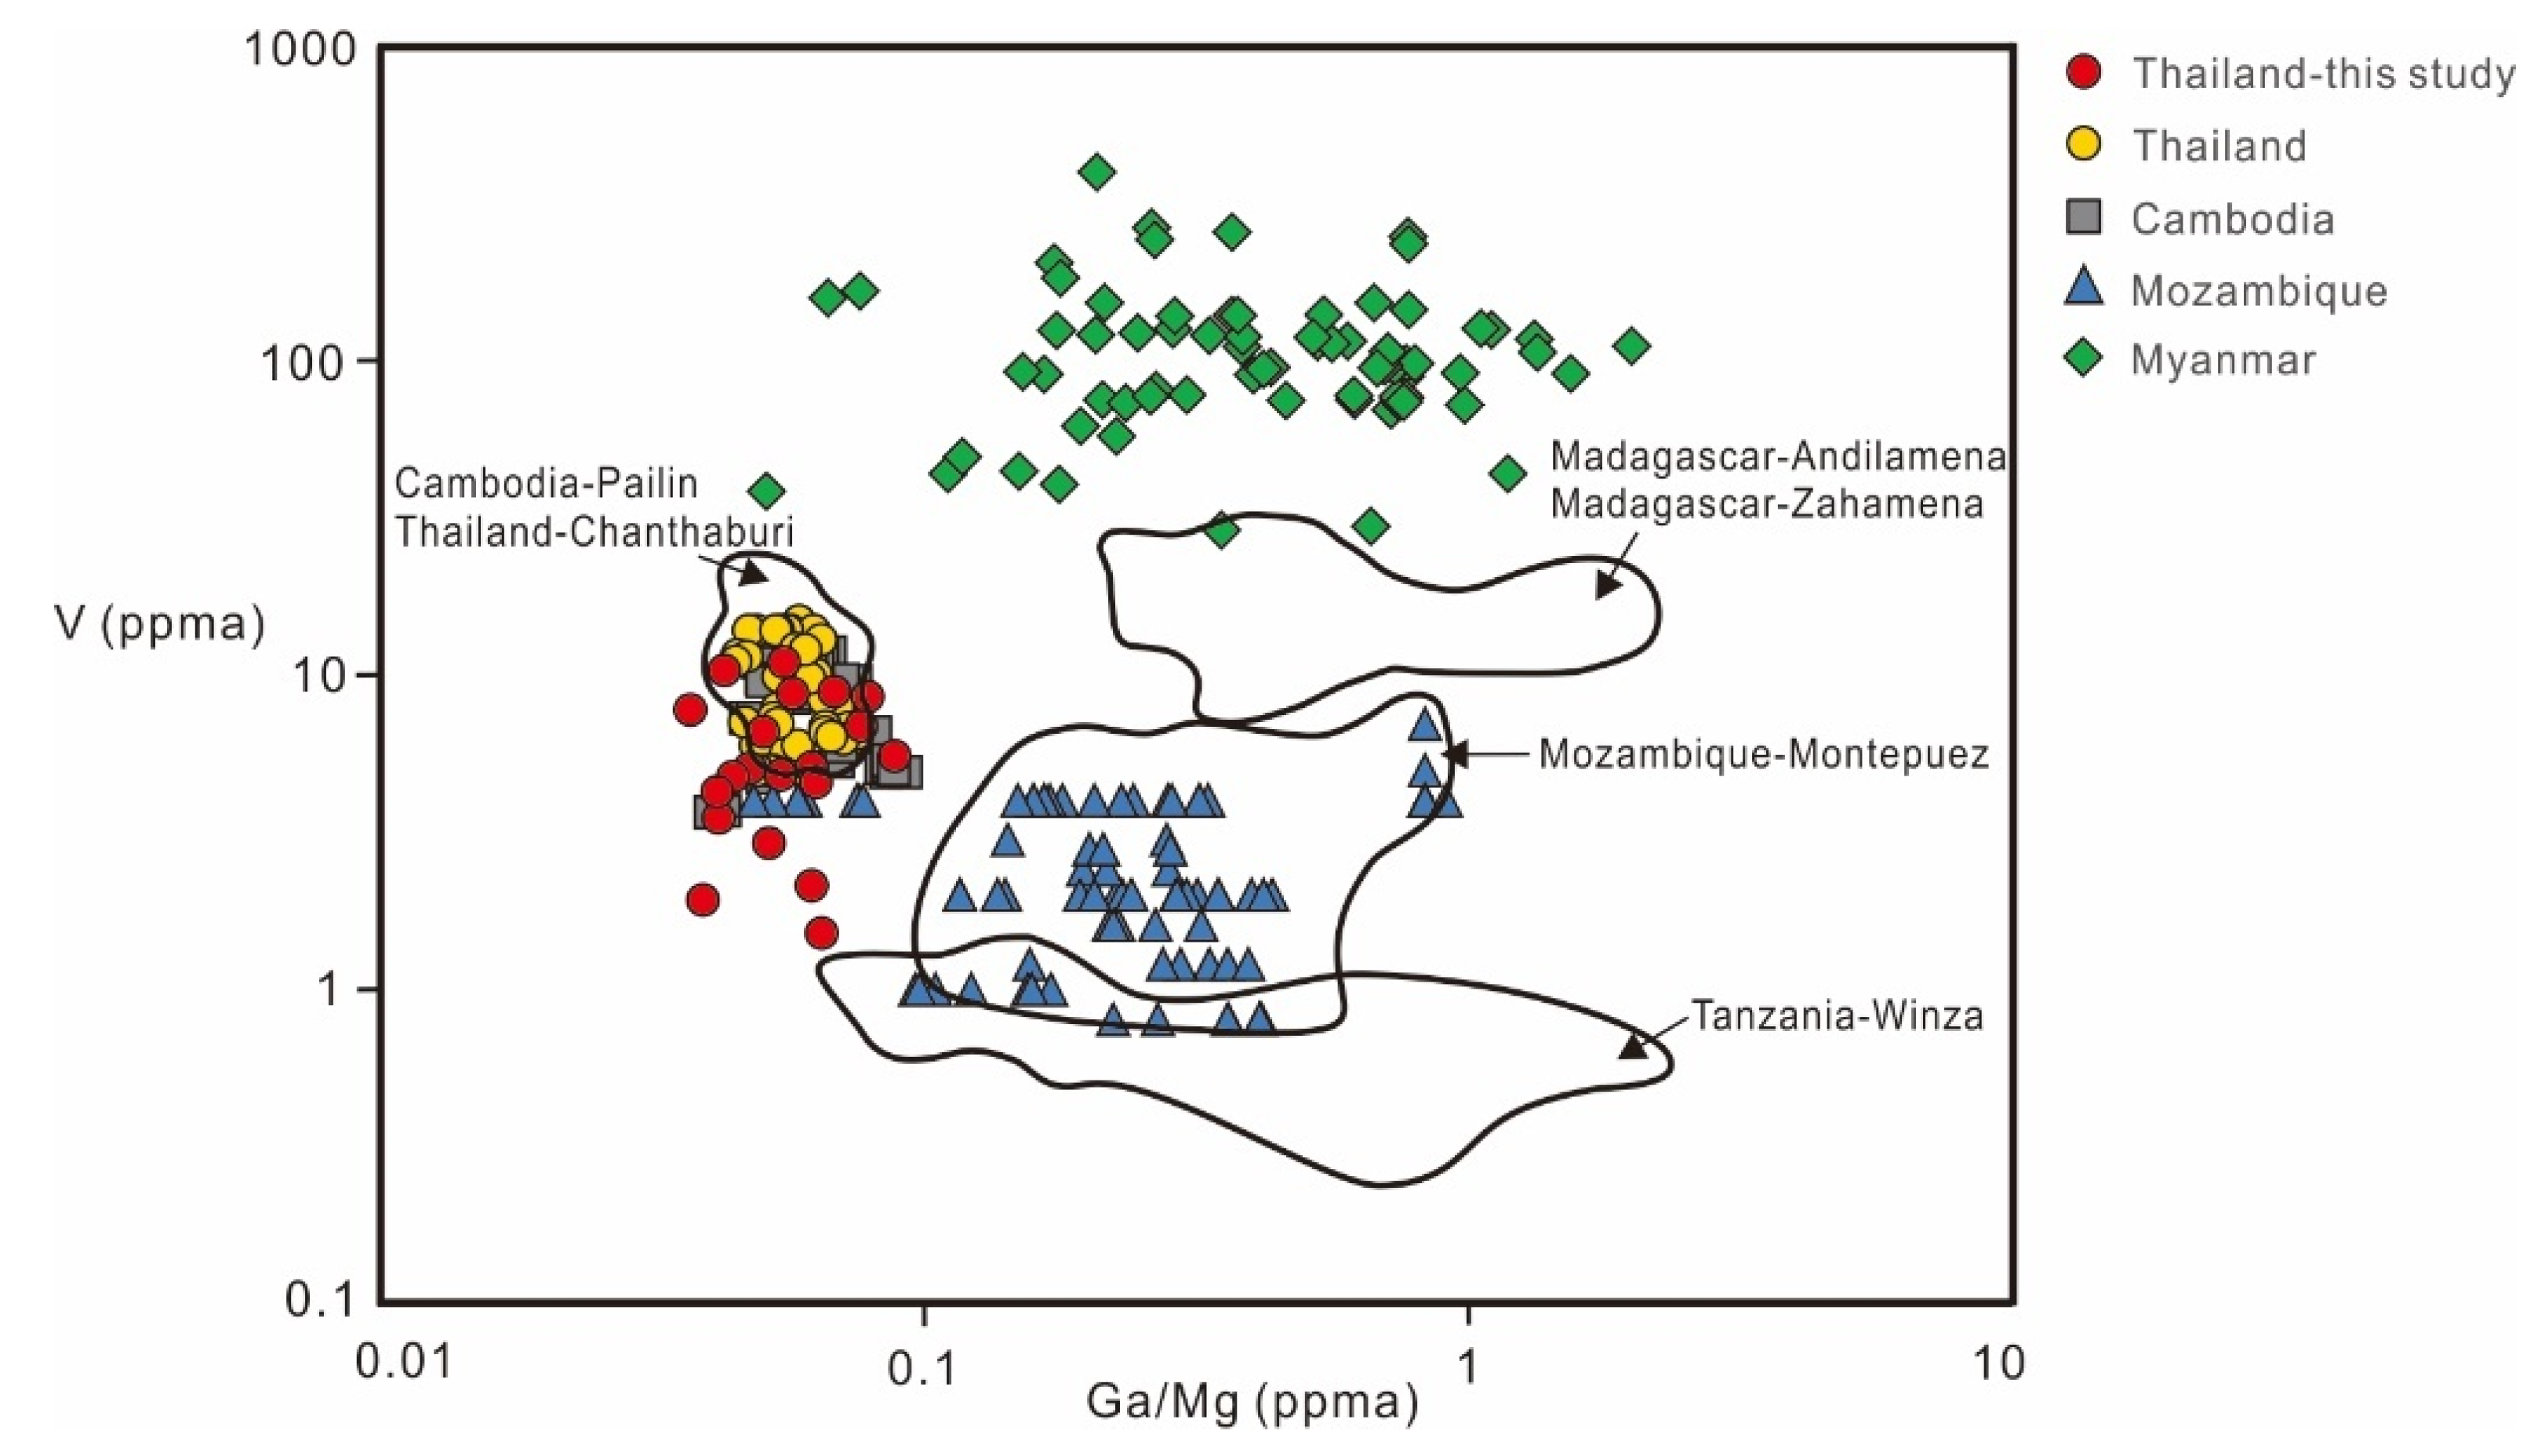
According to the discrimination diagram, the ratio of Ga/Mg and V has been identified as a useful plot for distinguishing Thailand rubies [10]. By comparing the higher Mg content and lower Ga/Mg ratio, Thai rubies can be separated from rubies from other sources (Figure 14). Moreover, rubies from Myanmar have higher V content, while rubies from Mozambique have lower V content compared to rubies from Thailand and Cambodia. Therefore, the V content can also be utilized to determine the origin of rubies.

5. Conclusions

This paper discusses the gemological, internal, and chemical composition characteristics of ruby samples from the Chanthaburi-Trat area in Thailand. The refractive indices, birefringence, and specific gravity values of the Thailand rubies align with typical values for corundum. Additionally, they exhibit inert to moderate red fluorescence under long-wave UV radiation (365 nm). The appearance of resorption or dissolution suggests that these rubies were carried to the Earth’s surface by volcanic flows from crystalline zones in the crust or mantle, as xenocrysts. The presence of growth tubes filled with aluminum hydroxides between twinned sectors is commonly found in rubies of Thai origin. Various crystal and mineral inclusions can be seen in ruby samples. Raman spectroscopy confirms the presence of anorthite, titanium oxide, and gypsum inclusions. Thailand samples have distinct inclusion scenes, setting them apart from stones found in other geographic locations or genetic environments.
The trace elements composition includes Fe, Cr, Si, Mg, Ti, Ga, V, Ca, and Ni. As the content of Cr increases, the color of the sample deepens. The trace elements of Thai ruby and Cambodian ruby, which are both basalt-related rubies, almost overlap, making it difficult to distinguish. Compared to rubies found in basalt-related sets, the trace element chemistry in the marble host sets of Myanmar and the amphibole metamorphic sets of Mozambique show considerable geographical variations, with some ambiguities and overlaps. Chemical diagrams that include Fe, Mg, Cr, V, Ti, and Ga components provide enough distinction to differentiate between various types of corundum deposits. By examining their chemical composition and inclusion characteristics, the various types of rubies can be identified. The findings presented in this study contribute to a better understanding of the gemology, internal characteristics, and chemical composition of Thai rubies.
Despite the limited production of Thai ruby, it continues to be traded in the global gem market and has become an essential component of the country’s gemstone industry. The value of these rubies is not only attributed to their rarity and quality but also to their distinctive geological history.

Author Contributions

Writing—original draft, E.L.; writing—review and editing, E.L. and B.X.; data curation, E.L.; methodology, B.X. All authors have read and agreed to the published version of the manuscript.

Funding

This research was funded by the National Natural Science Foundation of China (42222304, 42073038), the DDE Big Science Program, the Fundamental Research Funds for the Central Universities (Grant no. 265QZ2021012), and IGCP-662.

Data Availability Statement

The data presented in this study are available within the article.

Acknowledgments

We express our gratitude to the editor and anonymous reviewers for their valuable comments, which greatly contributed to enhancing the quality of our paper. This is the 17th contribution of B.X. for the National Mineral Rock and Fossil Specimens Resource Center.

Conflicts of Interest

The authors declare no conflict of interest.

References

  1. Giuliani, G.; Groat, L.A.; Fallick, A.E.; Pignatelli, I.; Pardieu, V. Ruby Deposits: A review and geological classification. Minerals 2020, 10, 597. [Google Scholar] [CrossRef]
  2. Groat, L.A.; Giuliani, G.; Stone-Sundberg, J.; Renfro, N.D.; Sun, Z. A review of analytical methods used in geographic origin determination of gemstones. Gems Gemol. 2019, 55, 512–535. [Google Scholar] [CrossRef] [Green Version]
  3. Giuliani, G.; Ohnenstetter, D.; Fallick, A.E. The geology and genesis of gem corundum deposits. In Geology of Gem Deposits; Groat, L.A., Ed.; Mineralogical Association of Canada: Québec, QC, Canada, 2014; pp. 35–112. [Google Scholar]
  4. Keller, P.C. The Chanthaburi-Trat Gem Field, Thailand. Gems Gemol. 1982, 18, 186–196. [Google Scholar] [CrossRef]
  5. Gübelin, E.J.; Koivula, J.I. Photoatlas of Inclusions in Gemstones; ABC Edition: Zurich, Switzerland, 1986. [Google Scholar]
  6. Koivula, J.I.; Fryer, C.W. Sapphirine (not sapphire) in a ruby from Bo Rai, Thailand. J. Gemmol. 1987, 20, 370. [Google Scholar] [CrossRef]
  7. Sutherland, F.L.; Schwarz, D.; Jobbins, E.A.; Coenraads, R.R.; Webb, G. Distinctive gem corundum suites from discrete basalt fields: A comparative study of Barrington, Australia, and West Pailin, Cambodia, gemfields. J. Gemmol. 1998, 26, 65–85. [Google Scholar] [CrossRef]
  8. Sutthirat, C.; Saminpanya, S.; Droop, G.T.R.; Henderson, C.M.B.; Manning, D.A.C. Clinopyroxene-corundum assemblages from alkali basalt and alluvium, eastern Thailand: Constraints on the origin of Thai rubies. Mineral. Mag. 2001, 65, 277–295. [Google Scholar] [CrossRef]
  9. Saminpanya, S.; Sutherland, F.L. Different origins of Thai area sapphire and ruby, derived from mineral inclusions and co-existing minerals. Eur. J. Mineral. 2011, 23, 683–694. [Google Scholar] [CrossRef] [Green Version]
  10. Sangsawong, S.; Vertriest, W.; Saeseaw, S.; Pardieu, V.; Muyal, J.; Khowpong, C.; Atikarnsakul, U.; Weeramonkhonlert, V. A study of rubies from Cambodia and Thailand. GIA Research News. 2017. Available online: https://www.gia.edu/gia-news-research/study-rubies-cambodia-thailand (accessed on 28 March 2023).
  11. Palke, A.C.; Wong, J.; Verdel, C.; Ávila, J.N. A common origin for Thai/Cambodian rubies and blue and violet sapphires from Yogo Gulch, Montana, USA? Am. Mineral. 2018, 103, 469–479. [Google Scholar] [CrossRef]
  12. Palke, A.C.; Saeseaw, S.; Renfro, N.D.; Sun, Z.; McClure, S.F. Geographic Origin Determination of Ruby. Gems Gemol. 2019, 55, 580–612. [Google Scholar] [CrossRef]
  13. Promwongan, S.; Sutthirat, C. Mineral inclusions in ruby and sapphire from the Bo Welu gem deposit in Chanthaburi, Thailand. Gems Gemol. 2019, 55, 354–369. [Google Scholar]
  14. Promwongan, S.; Sutthirat, C. An update on mineral inclusions and their composition in ruby from the Bo Rai gem field in Trat Province, eastern Thailand. J. Gemmol. 2019, 36, 634–645. [Google Scholar] [CrossRef]
  15. Palke, A.C. Coexisting rubies and blue sapphires from major world deposits: A brief review of their mineralogical properties. Minerals 2020, 10, 472. [Google Scholar] [CrossRef]
  16. Giuliani, G.; Fallick, A.E.; Garnier, V.; France-Lanord, C.; Ohnenstetter, D.; Schwarz, D. Oxygen isotope composition as a tracer for the origins of rubies and sapphires. Geology 2005, 33, 249–252. [Google Scholar] [CrossRef]
  17. Yui, T.F.; Wu, C.-M.; Limkatrun, P.; Sricharn, W.; Boonsoong, A. Oxygen isotope studies on placer sapphire and ruby in the Chanthaburi-Trat alkali basaltic gemfield, Thailand. Lithos 2006, 86, 197–211. [Google Scholar] [CrossRef]
  18. Coenraads, R.R. Surface features on natural rubies and sapphires derived from volcanic provinces. J. Gemmol. 1992, 23, 151–160. [Google Scholar] [CrossRef]
  19. Hughes, R.W. Ruby and Sapphire; RWH Publishing: Boulder, CO, USA, 1997. [Google Scholar]
  20. Hughes, R.W.; Manorotkul, W.; Hughes, E.B. Ruby and Sapphire: A Gemologist’s Guide; RWH Publishing/Lotus Publishing: Bangkok, Thailand, 2017; p. 816. [Google Scholar]
  21. Vertriest, W.; Palke, A.C.; Renfro, N.D. Field gemology: Building a research collection and understanding the development of gem deposits. Gems Gemol. 2019, 55, 490–511. [Google Scholar] [CrossRef]
  22. Bowersox, G.W.; Foord, E.E.; Laurs, B.M.; Shigley, J.E.; Smith, C.P. Ruby and sapphire from Jegdalek, Afghanistan. Gems Gemol. 2000, 36, 110–126. [Google Scholar] [CrossRef] [Green Version]
  23. Pignatelli, I.; Giuliani, G.; Morlot, C.; Pham, V.L. The texture and chemical composition of trapiche ruby from Khoan Thong, Luc Yen mining district, northern Vietnam. J. Gemmol. 2019, 36, 726–745. [Google Scholar] [CrossRef]
  24. Schwarz, D.; Schmetzer, K. Rubies from the Vatomandry area, eastern Madagascar. J. Gemmol. 2001, 27, 409–416. [Google Scholar] [CrossRef]
  25. Pardieu, V. Ruby and Sapphire Rush near Didy, Madagascar. April–June 2012. Available online: https://www.gia.edu/doc/Ruby-and-Sapphire-Rush-Near-Didy-Madagascar.pdf (accessed on 25 July 2023).
  26. Kongsomart, B.; Vertriest, W.; Weeramonkhonlert, V. Preliminary observations on facet-grade ruby from Longido, Tanazania. Gems Gemol. 2017, 53, 472–473. [Google Scholar]
  27. Schwarz, D.; Pardieu, V.; Saul, J.M.; Schmetzer, K.; Laurs, B.M.; Giuliani, G.; Klemm, L.; Malsy, A.K.; Hauzenberger, C.; Du Toit, G.; et al. Ruby and sapphires from Winza (Central Tanzania). Gems Gemol. 2008, 44, 322–347. [Google Scholar] [CrossRef] [Green Version]
  28. Yakymchuk, C.; Hinsberg, V.V.; Kirkland, C.L.; Szilas, K.; Kinney, C.; Kendrick, J.; Hollis, J.A. Corundum (ruby) growth during the final assembly of the Archean North Atlantic Craton, southern West Greenland. Ore Geol. Rev. 2021, 138, 104417. [Google Scholar] [CrossRef]
  29. Khaleal, F.M.; Saleh, G.M.; Lasheen, E.S.R.; Alzahrani, A.M.; Kamh, S.Z. Exploration and Petrogenesis of Corundum-Bearing Pegmatites: A Case Study in Migif-Hafafit Area, Egypt. Front. Earth Sci. 2022, 10, 869828. [Google Scholar] [CrossRef]
  30. Sutherland, F.L.; Hoskin, P.W.O.; Fanning, C.M.; Coenraads, R.R. Models of corundum origin from alkali basaltic terrains: A reappraisal. Contrib. Mineral. Petrol. 1998, 133, 356–372. [Google Scholar] [CrossRef]
  31. Simonet, C.; Fritsch, E.; Lasnier, B.A. classification of gem corundum deposits aimed towards gem exploration. Ore Geol. Rev. 2008, 34, 127–133. [Google Scholar] [CrossRef]
  32. Giuliani, G.; Groat, L.A. Geology of corundum and emerald gem deposits: A review. Gems Gemol. 2019, 55, 464–489. [Google Scholar] [CrossRef] [Green Version]
  33. Zhang, B.L.; Schwarz, D.; Lu, T.J. Geographic Origin Determination of Colored Gemstones; The Geological Publishing House: Beijing, China, 2012; pp. 109–186. [Google Scholar]
  34. Garnier, V.; Giuliani, G.; Ohnenstetter, D.; Fallick, A.E.; Dubessy, J.; Banks, D.; Vinh, H.Q.; Lhomme, T.; Maluski, H.; Pêcher, A.; et al. Marble-hosted ruby deposits from Central and Southeast Asia: Towards a new genetic model. Ore Geol. Rev. 2008, 34, 169–191. [Google Scholar] [CrossRef]
  35. Vertriest, W.; Saeseaw, S. A decade of ruby from Mozambique: A review. Gems Gemol. 2019, 55, 162–183. [Google Scholar] [CrossRef] [Green Version]
  36. Peretti, A.; Schmetzer, K.; Bernhardt, H.J.; Mouawad, F. Rubies from Mong Hsu. Gems Gemol. 1995, 31, 2–26. [Google Scholar] [CrossRef]
  37. Xu, B.; Hou, Z.Q.; Griffin, W.L.; Lu, Y.; Belousova, E.; Xu, J.F.; O’Reilly, S.Y. Recycled volatiles determine fertility of porphyry deposits in collisional settings. Am. Mineral. 2021, 106, 656–661. [Google Scholar] [CrossRef]
  38. Xu, B.; Hou, Z.Q.; Griffin, W.L.; Zheng, Y.C.; Wang, T.; Guo, Z.; Hou, J.; Santosh, M.; O’Reilly, S.Y. Cenozoic lithospheric architecture and metallogenesis in Southeastern Tibet. Earth Sci. Rev. 2021, 214, 103472. [Google Scholar] [CrossRef]
  39. Xu, B.; Hou, Z.Q.; Griffin, W.L.; O’Reilly, S.Y. Apatite halogens and Sr–O and zircon Hf–O isotopes: Recycled volatiles in Jurassic porphyry ore systems in southern Tibet. Chem. Geol. 2022, 605, 120924. [Google Scholar] [CrossRef]
  40. Peucat, J.J.; Ruffault, P.; Fritsch, E.; Bouhnik-Le Coz, M.; Simonet, C.; Lasnier, B. Ga/Mg ratios as a new geochemical tool to differentiate magmatic from metamorphic blue sapphires. Lithos 2007, 98, 261–274. [Google Scholar] [CrossRef]
  41. Sutherland, F.; Zaw, K.; Meffre, S.; Yui, T.-F.; Thu, K. Advances in Trace Element “Fingerprinting” of Gem Corundum, Ruby and Sapphire, Mogok Area, Myanmar. Minerals 2014, 5, 61–79. [Google Scholar] [CrossRef] [Green Version]
  42. Zaw, K.; Sutherland, F.L.; Yui, T.F.; Meffre, S.; Thu, K. Vanadium-rich ruby and sapphire within Mogok gemfield, Myanmar: Implications for gem color and genesis. Mineral. Depos. 2015, 50, 25–39. [Google Scholar] [CrossRef]
  43. Perretti, A. The Making of an International Color Standard by GRS: “Pigeon’s Blood” and “Royal Blue”. Definitions, Retroperspective and Future. 2015. Available online: https://www.gemresearch.ch/pigeonsblood (accessed on 25 July 2023).
  44. Pardieu, V.; Sangsawong, S.; Chauviré, B.; Massi, L.; Sturman, N. Rubies from the Montepuez area (Mozambique), Bangkok, GIA Laboratory. 2013. Available online: https://www.gia.edu/doc/GIA_Ruby_Montepuez_Mozambique.pdf (accessed on 28 March 2023).
  45. Sutherland, F.L.; Khin, Z.; Meffre, F.; Thompson, J.; Goemann, K.; Kyaw, T.; Than, T.N.; Mhod, Z.M.; Harris, S.I. Diversity in ruby chemistry and its inclusions: Intra and inter-continental comparisonsfrom Myanmar and Eastern Australia. Minerals 2019, 9, 28. [Google Scholar] [CrossRef] [Green Version]
  46. Chulapakorn, T.; Intarasiri, S.; Bootkul, D.; Singkarat, S. Identification of deposit types of natural corundum by PIXE. Nucl. Instrum. Methods Phys. Res. B 2014, 331, 108–112. [Google Scholar] [CrossRef]
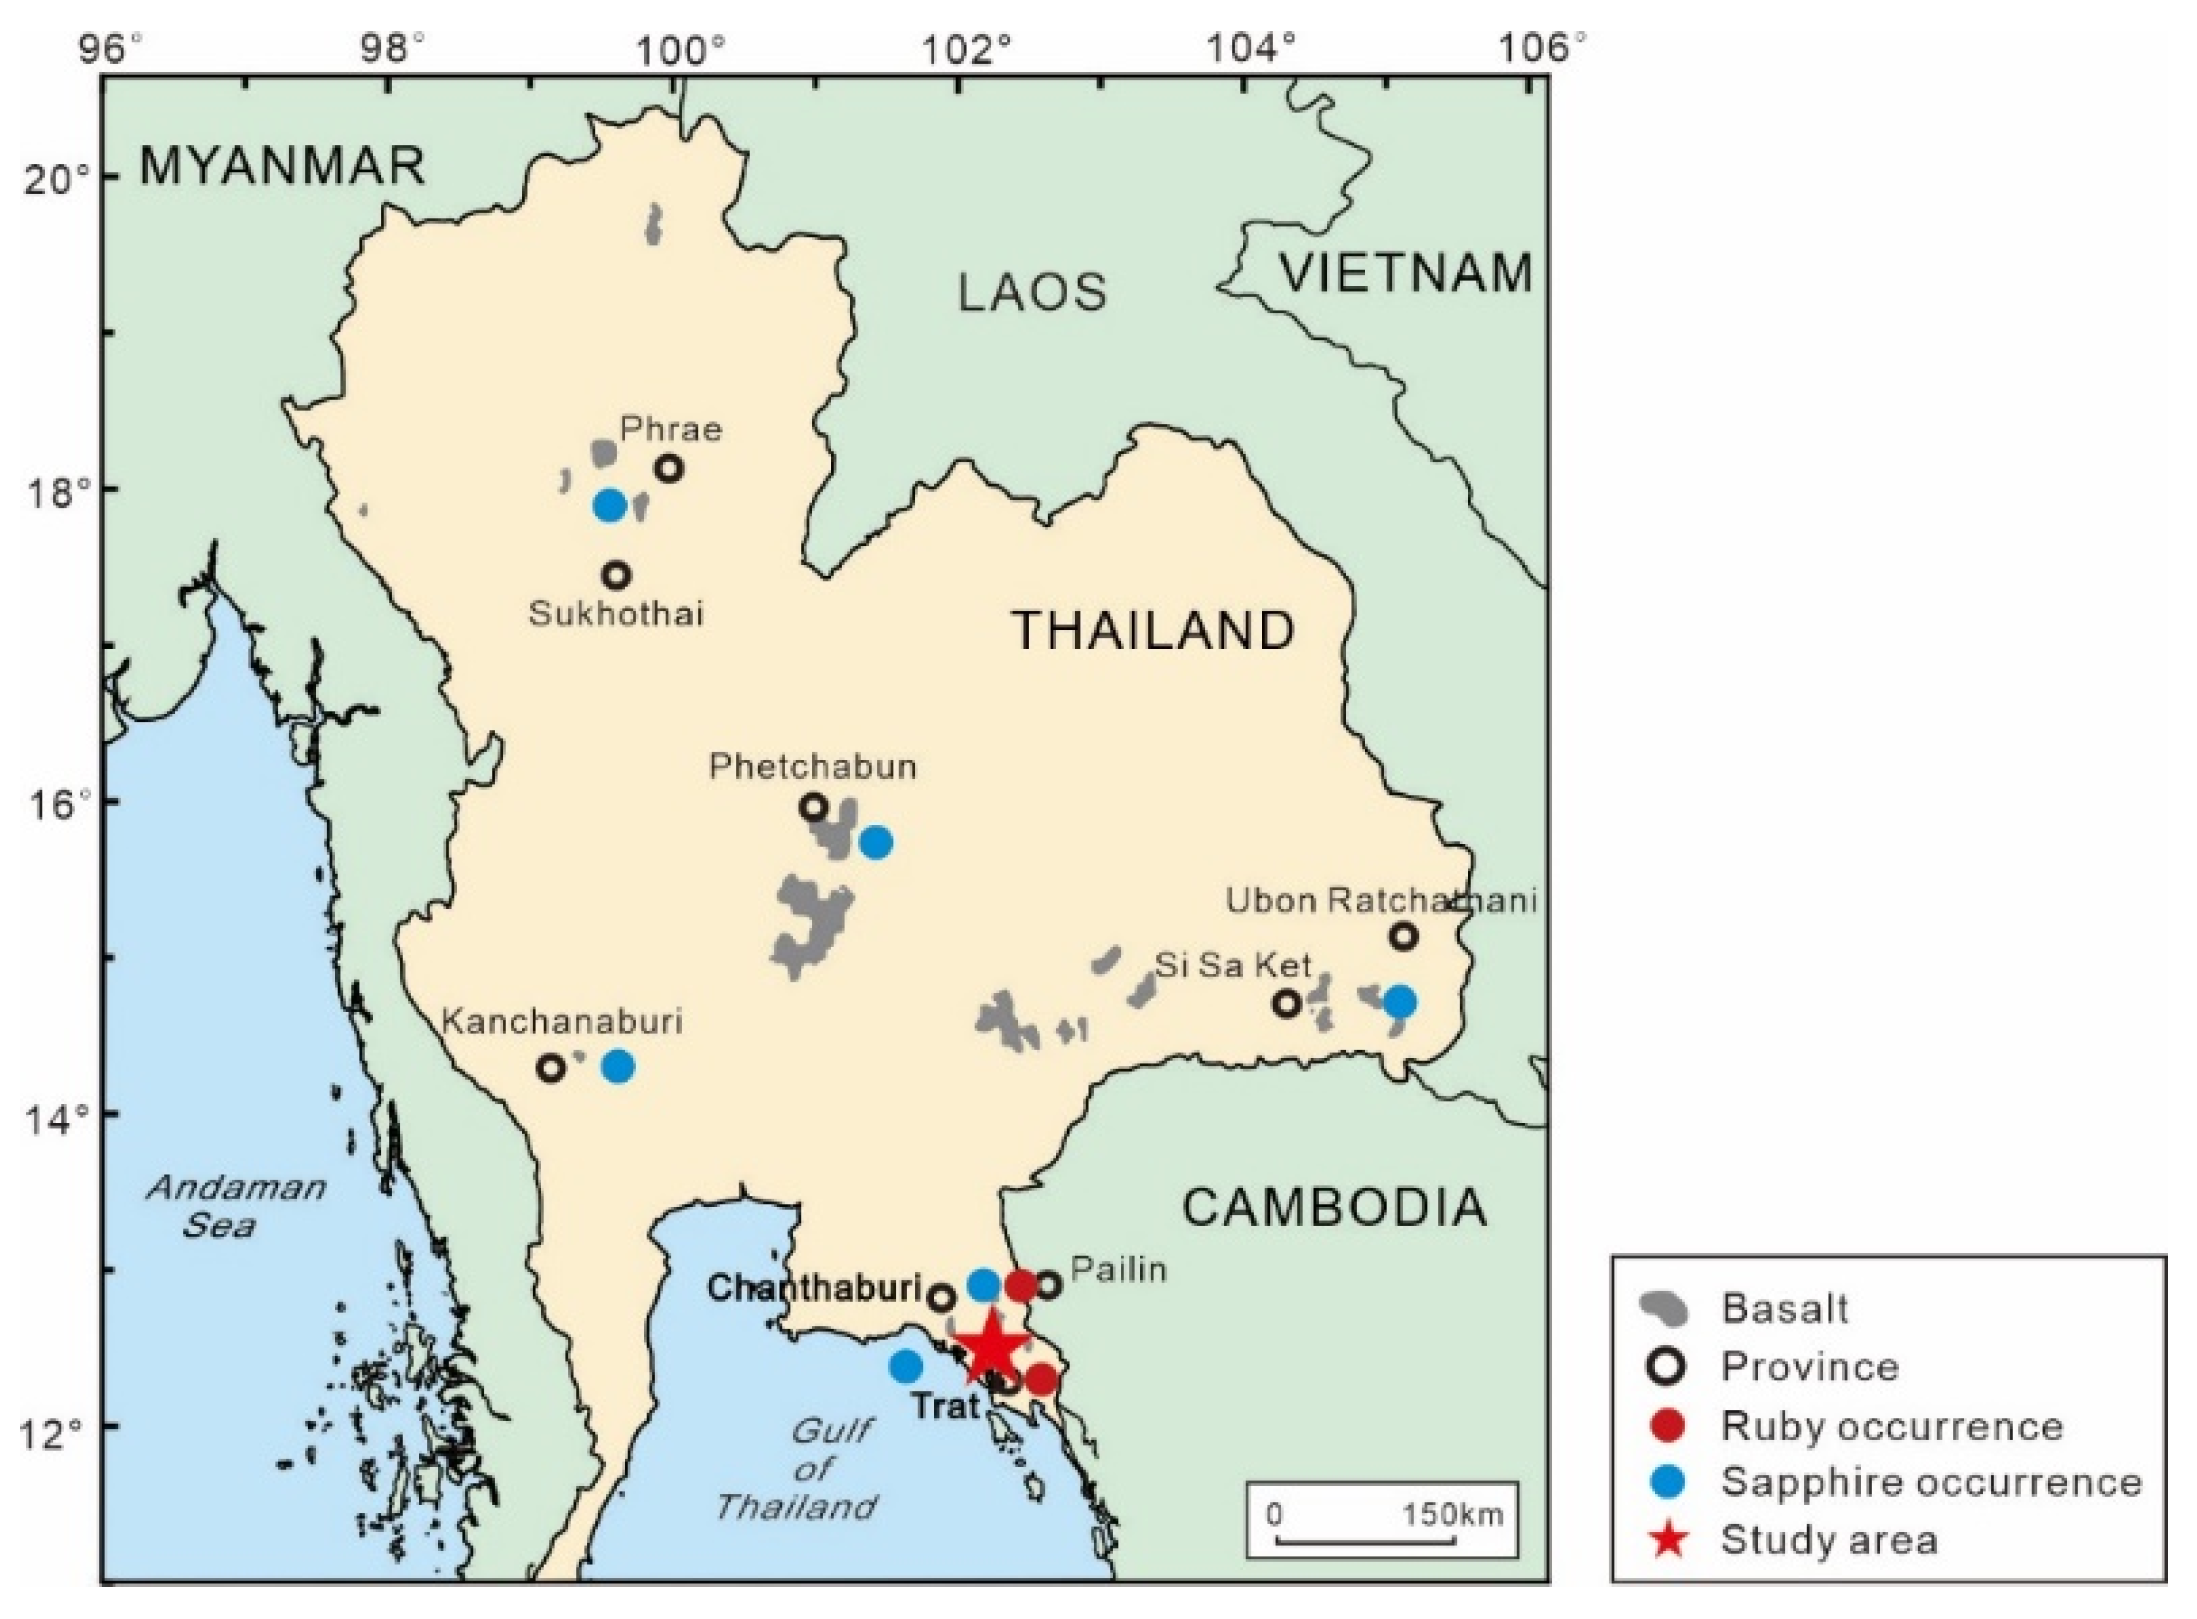
Figure 1. Map of Thailand showing the location of the Chanthaburi-Trat area. The ruby and sapphire occurrences are taken from [13].
Crystals 13 01179 g001
Figure 2. The color and appearance of Chanthaburi-Trat ruby rough samples collected for this study.
Crystals 13 01179 g002
Figure 3. (a) Inclusions of brown impurities under 30× dark field; (b) Three sets of cleavage and triangular etch marks on a Thai ruby’s surface under 30× reflected light; (c) Corroded features on a Thai ruby’s surface under 20× dark field.
Crystals 13 01179 g003
Figure 4. Inert to moderate red fluorescence of Thai rubies for this study under long-wave UV (365 nm) radiation.
Crystals 13 01179 g004
Figure 5. (a) Polysynthetic twinning planes under 30× dark field; (b) Parallel and intersecting growth tubules under 40× dark field; (c) Growth tubules connected by small fissures under 40× dark field; (d) Natural healed fractures under 30× dark field; (e) Crystal inclusion with fluid fingerprint under 40× dark field; (f) Tiny crystals surrounded by thin films under 30× dark field.
Crystals 13 01179 g005
Figure 6. Internal features of C-T ruby samples. (a) Colorless transparent crystal in the sample RU-4; (b) Hexagonal dark plate-like mineral inclusion in the sample RU-13; (c) Small, globular, colorless, and transparent crystals in the sample RU-72; (d) Colorless transparent crystal with cleavage crack in the sample RU-13; (e) Transparent idiomorphic crystal in the sample RU-1; (f) Brown translucent mineral inclusion with a distinctive crystalline form in the sample RU-31; (g) Short columnar translucent crystal in the sample RU-22; (h) Transparent hexagonal plate-like crystal with a small core in the sample RU-24; (i) Yellowish-brown hexagonal lamellar crystal in the sample RU-29; (j) Round-plate-like crystal in the sample RU-56; (k) Dark mineral inclusions with equiaxial crystalline habits in the sample RU-55; (l) Ellipsoid dark opaque mineral inclusions in the sample RU-70. All photos above were taken at 40× magnification under dark field.
Crystals 13 01179 g006
Figure 7. Raman spectra of ruby and mineral inclusions in samples from C-T area, Thailand. (a) Raman spectra of ruby; (b) Anorthite inclusion within the sample RU-4; (c) Titanium oxide inclusion within the sample RU-13; (d) Gypsum inclusion within the sample RU-72.
Crystals 13 01179 g007
Figure 8. Plot of Cr against Fe of C-T rubies associated with the particular color.
Crystals 13 01179 g008
Figure 9. Cr2O3 against FeO diagram for rubies from Myanmar, Mozambique, and Thailand. The discriminant fields are taken from GRS [43].
Crystals 13 01179 g009
Figure 10. Trace element chemistry plot of Mg × 100-Ti × 10-Fe ternary for different origin rubies.
Crystals 13 01179 g010
Figure 11. A plot of Cr/Ga against Fe/Ti for rubies with different origins.
Crystals 13 01179 g011
Figure 12. FeO + TiO2 + Ga2O3 against FeO-MgO-V2O3-Cr2O3 classification diagram for different origin rubies. The range boxes are modified from [1].
Crystals 13 01179 g012
Figure 13. Fe against Ga/Mg classification diagram for different origin rubies. The range boxes are modified from [1].
Crystals 13 01179 g013
Figure 14. V against Ga/Mg classification diagram for different origin rubies. The range boxes are modified from [10].
Crystals 13 01179 g014
Table 1. Major chemical composition (wt.%) of ruby samples from the C-T area, analyzed by EPMA.
LabelColorAl2O3Cr2O3MgOFeOTiO2V2O3Ga2O3Total
RU-1-2light red99.8380.0940.0130.4530.0130.0120.013100.436
RU-1-5light red98.480.1150.0180.5370.0130.0140.02699.203
RU-1-9light red99.5910.1660.0160.5630.0150.01bdl100.361
RU-1-10light red100.5490.0870.0180.3120.0120.012bdl100.99
RU-1-3purplish red96.9170.2320.010.4280.0010.0090.02697.623
RU-1-6purplish red99.7470.1770.0230.3890.0340.0130.015100.398
RU-1-7purplish red99.2370.2240.0170.3420.013bdl0.00499.837
RU-2-5purplish red99.7670.2730.0130.5010.0180.0080.008100.588
RU-2-10purplish red99.6990.2580.0140.6080.031bdl0.021100.631
RU-2-1red98.8480.5830.0210.5970.0440.0080.015100.116
RU-2-2red99.4780.2560.0170.2770.014bdl0.006100.048
RU-2-3red99.1430.2570.0220.4660.0160.0050.01499.923
RU-2-9red98.7670.4190.0250.4980.018bdl0.01499.741
RU-2-4intense red98.5320.9080.020.3370.0190.0030.0199.829
RU-2-7intense red98.5320.6570.0320.5160.033bdl0.01199.781
Table 2. Trace element concentrations (ppm) of ruby samples from the C-T area, analyzed by LA-ICP-MS.
LabelColorMgSiCaTiVCrFeGaNi
RU-1-2light red128.11855.2062.49107.5012.06701.634618.5220.180.73
RU-1-5light red146.60636.69bdl52.833.781350.923840.0127.454.18
RU-1-9light red189.901026.42bdl75.258.78601.554803.0723.008.98
RU-1-10light red176.441006.2379.16249.5621.441133.734171.3840.067.76
RU-1-3purplish red180.731333.52bdl48.205.371311.803289.9232.4116.81
RU-1-6purplish red125.30963.13bdl119.1416.621087.704902.0818.313.66
RU-1-7purplish red166.23771.810.0761.384.82520.772754.3418.837.82
RU-2-5purplish red200.66442.2168.31261.1027.603732.115964.1132.006.18
RU-2-10purplish red156.28861.18bdl85.5611.451561.412730.5128.582.41
RU-2-1red160.59911.0940.6687.5311.891500.864313.0420.677.31
RU-2-2red218.79545.79bdl120.4625.985491.543513.4427.137.48
RU-2-3red147.93756.2625.38133.9817.312269.074995.1532.697.21
RU-2-9red257.00934.4340.69264.2919.514327.514881.8627.6411.82
RU-2-4intense red205.56842.56bdl103.7410.692249.574909.2324.755.84
RU-2-7intense red160.27638.1925.69175.1022.301585.386133.5131.665.36
Table 3. Mineral inclusions in rubies from Thailand, Myanmar, and Mozambique.
Mineral GroupInclusionsThailandMyanmarMozambique
SilicatesZircon √ [33]
Garnet√ [5,13]
Titanite √ [5,33]
Olivine √ [33]
Diopside√ [7,8,9,11,13,14]
Hornblende √ [5]√ [12,35]
Sillimanite√ [2]
Plagioclase√ [7,13,20]
Nepheline√ [13]
Sapphirine√ [6,7,13]
silica melt√ [13]
Muscovite √ [36]√ [12,35]
CarbonatesCalcite √ [5,12]
Dolomite √ [5,33]
PhosphatesApatite√ [5,13]√ [5,33]√ [33]
OxidesSpinel√ [13]√ [5,33]
Quartz√ [13]
Rutile √ [5,12,33]√ [33]
SulfidesPyrrhotite√ [4,14] √ [12]
Sphalerite √ [5]
Chalcopyrite √ [35]
HalogenidesFluorite √ [36]
Table 4. Trace element concentrations (ppm) of rubies from Thailand, Cambodia, Mozambique, and Myanmar based on LA-ICP-MS analyses.
ElementsValueThailand
(n = 15)
This Study
Thailand
(n = 56)
[10,11]
Cambodia
(n = 44)
[10,11]
Mozambique
(n = 85)
[35,44]
Myanmar
(n = 73)
[45]
Range125–257118–206102–18111–18416–216
MgAverage1751501314564
Median1661471293651
Range48–26439–21052–219Bdl–14636–3201
TiAverage13011013231454
Median1079712324128
Range5–285–339–301–773–1012
VAverage1616183287
Median1216184247
Range521–5492450–7611521–2856435–2990429–16,388
CrAverage19622002189012413072
Median1501148918829452705
Range2731–6134756–3620987–3794246–56328–483
FeAverage438819892857153492
Median431325302784149362
Range18–407–347–326–3420–170
GaAverage2718231572
Median271924971
Disclaimer/Publisher’s Note: The statements, opinions and data contained in all publications are solely those of the individual author(s) and contributor(s) and not of MDPI and/or the editor(s). MDPI and/or the editor(s) disclaim responsibility for any injury to people or property resulting from any ideas, methods, instructions or products referred to in the content.